Embed Size (px)
Citation preview

photo size: 4.5 cm wide photo size: 4.5 cm wide crop to 2.4 cm high crop to 2.4 cm high
World Cities Research Final Report on World Cities
photo size: 4.5 cm wide crop to 3.7 cm high
Prepared by MVA for
Commission for Integrated Transport
March 2005
In Association With:
Dr Jeff Kenworthy

Document Control
Project Title: World Cities Research
MVA Project Number: C33991
Document Type: Final Report on World Cities
WP Reference: JD
Temporary Directory &
File Name: I:\tep\Projects\C33991 - CfIT World Cities Research\World Cities report\world cities final report j.doc
Final Workspace
Location
Document Approval Primary Author: Jacqui Dunning
Other Author(s):
Reviewer(s): Andrew Last
Jeff Kenworthy
Formatted by: Jacqui Dunning
Distribution Issue Date Distribution Comments
2 2903/05 Final

Contents
1 Introduction 1 1.1 Introduction 1 1.2 Methodology 2 1.3 Structure of this Report 3
2 Background and Context 5 2.1 Motorised Travel 5 2.2 Key Drivers of Demand 7
3 Strategies 33 3.1 Overview 33 3.2 Barcelona 35
3.3 London 40
3.4 Madrid 46 3.5 Moscow 49
3.6 New York 53
3.7 Paris 57
3.8 Singapore 62 3.9 Toyko 65
WORLD CITIES RESEARCH
Contents
4 Outcomes 71
4.1 Evolution of Policy 71 4.2 Effectiveness 74
4.3 Successful Initiatives 81
5 Conclusion 83 5.1 Conclusions 83
5.2 Lessons for UK Cities 84 5.3 Recommendations for Future Research 84
WORLD CITIES RESEARCH

Summary
In November 2004, the Commission for Integrated Transport (CfIT)
charged MVA with investigating the strategies being implemented
to manage traffic growth and congestion in a sample of cities. This
report covers the ‘world cities’ and other large comparators,
namely: Barcelona; London; Moscow; Madrid; New York; Paris;
Singapore; and Tokyo.
The research has been undertaken in three phases comprising a
desk study of available documentation, case studies based on
interviews with relevant authorities in the cities and an analysis of
the impacts of transport strategies. Statistical evidence is limited
and the key outcomes have been changes in car modal share,
public transport patronage, and traffic levels and speed as proxy
measures of congestion.
The work has shown that national economies depend on the
contribution of large cities, and while there have been fluctuations
associated with world or local events, the city economies have
remained strong. Economic development has driven population
growth and the resulting competition for land has given rise to a
process of suburbanisation that started at different times, but has
occurred in all the cities and continues to the present. The
increasing need to travel from lower density suburbs to more
centralised employment areas or edge of town commercial centres,
coupled with increasing household wealth and rising car ownership
has fuelled growth in mobility.
Some of this increase has come from higher trip rates, but the
main contributor has been the increase in distances travelled. Cities
that have sprawled more, or gone further in allowing the separation
of people and jobs, now have the longest average journey lengths.
The challenge facing all cities has been how to accommodate this
growth in travel demand which is becoming increasingly disparate
and more difficult to meet with cost-effective public transport.
There is some commonality in the policies that have been
implemented. All of the cities have adopted a combination of
highway investment (typically ring roads to reduce through traffic
in city centres) and public transport improvements. Some have also
sought to radically improve conditions for pedestrians and cyclists
in the hope that this will attract short-distance car users.
None of the cities has harnessed the full potential of land use
policies to contain low-density sprawl, ensure a mix of development
types to reduce the need to travel, or increase public transport
patronage through transit-oriented development. Greater progress
has been made in Barcelona, Singapore and Tokyo where new lines
IWORLD CITIES RESEARCH

Summary
are generally keeping pace with development, and it is these cities
that have the lowest reliance on public sector subsidy.
Most of the cities have implemented some form of traffic restraint,
but the commitment to reducing car use and the measures used
vary. For example, Barcelona has implemented physical restrictions
on car access to the historic core and other environmentally-
sensitive neighbourhoods and, like Madrid, there has been a major
programme to reallocate road space to pedestrians. Parking
provision is extremely limited in London and New York, there are
high user charges and the authorities are committed to effective
enforcement.
There are tolls on strategic inter-urban routes in most cities and on
the bridge and tunnel approaches to Manhattan Island. Congestion
charging has been implemented in London and Singapore; the
London scheme charges drivers a £5 daily fee for driving within the
zone, whereas the Electronic Road Pricing Scheme (ERP) in
Singapore charges drivers each time they enter the charging zone
and the rate varies according to congestion levels (monitored by
average vehicle speeds).
Data on changes in modal share are only available for six cities and
in varying formats which makes comparison difficult. However, the
study has shown that Barcelona and London have been successful
in reducing car dependency (Figure 1).
Barcelona has seen a
fall of 0.8% pa in the
proportion of trips
made by private
transport both within
the inner city1 and
between the inner
city and the suburbs
in the past four
years, with a cons-
equent reduction in
traffic and rise in
average speed. This has been achieved through a combination of
investment in public transport, integrated fares and ticketing and
restrictions on car use through access controls, removal of car
parking and the reallocation of road space to pedestrians. These
policies have been assisted by the existing mix of people and jobs,
extremely high land use density and good pedestrian facilities in
the inner city which have increased the feasibility of using
alternative modes.
Barcelona’s strategy is expensive; the city typically spends 2% of
its GDP on transport, and the 10 Year Infrastructure Plan for 2001-
2010 is worth 7.3billion euros (£6bn adjusted for purchasing power
Figure 1 - Annual Average Change in Car Mode Share
-1.0%
-0.8%
-0.6%
-0.4%
-0.2%
0.0%
0.2%
0.4%
0.6%Barcelona(wthin city)Barcelona(suburb-city)London
New York(Manhattan)Paris
Singapore
Tokyo
1 Within the ring road
WORLD CITIES RESEARCH 2

Summary
parity); however, this contains a further 251km of new suburban
rail and metro.
In London, the car mode share has fallen by 0.5% per annum
between 1993 and 2003, and by 0.8% between 1999-2003 to
compare with Barcelona. The strategy has comprised investment in
public transport (including expanding the bus network, increasing
frequencies and better reliability through continued implementation
of bus priority measures and operator incentives) and the
introduction of congestion charging.
Whilst it has been controversial, the charge has been effective in
increasing public transport patronage and reducing traffic and
delays in central London, and has not resulted in substantially
higher flows on perimeter routes. It has also created a revenue
stream (estimated at £1.3bn over 10 years of operation) for further
transport improvements. London is now spending nearly 3% of its
GDP on transport and the Five Year Investment Programme
(2005/06-2009/10) includes £10bn of investment in extending the
East London Line, Metropolitan (Underground) Line and new
Docklands Light Railway links.
Public transport patronage has also increased substantially in
Singapore (Figure 2). The rise is due to the continuing growth in
population at accessible locations, and an increase in the public
transport trip rate resulting from the combination of rail and bus
network extensions
and traffic restraint.
The transport
strategy has sought
to balance the
supply and demand
for road space,
rather than reduce
car use per se, and
so the car mode
share has increased,
but the ERP has
been successful in ensuring that as traffic rose, average speeds
remained constant. This approach contrasts with Moscow, where
there have been no constraints on car use and the public transport
trip rate has been falling in parallel with the rapid increase in car
ownership which has doubled over the past 10 years.
Amongst the key factors that have assisted the success of policies
has been integrated planning, particularly to ensure a ‘carrot and
stick’ approach to providing alternative modes and discouraging car
use, and co-ordinating transport and land use policies to reduce
sprawl and contribute to an urban structure suitable for walking,
cycling and cost-efficient public transport.
Figure 2 - Annual Average Change in Public Transport Trip Rate
-6.0%
-4.0%
-2.0%
0.0%
2.0%
4.0%
6.0% Barcelona
London
Madrid
Moscow
New York(Manhattan)Paris
Singapore
Tokyo
WORLD CITIES RESEARCH 3

Summary
Other factors have included the need for long-term political
consensus and continuity in the planning and delivery of the
strategy. Where policies have been controversial, such as access
controls in Barcelona and congestion charging in London and
Singapore, these were made more acceptable by being ‘sold’ to the
public as part of a package of measures.
WORLD CITIES RESEARCH 4
1 Introduction
1.1 Introduction
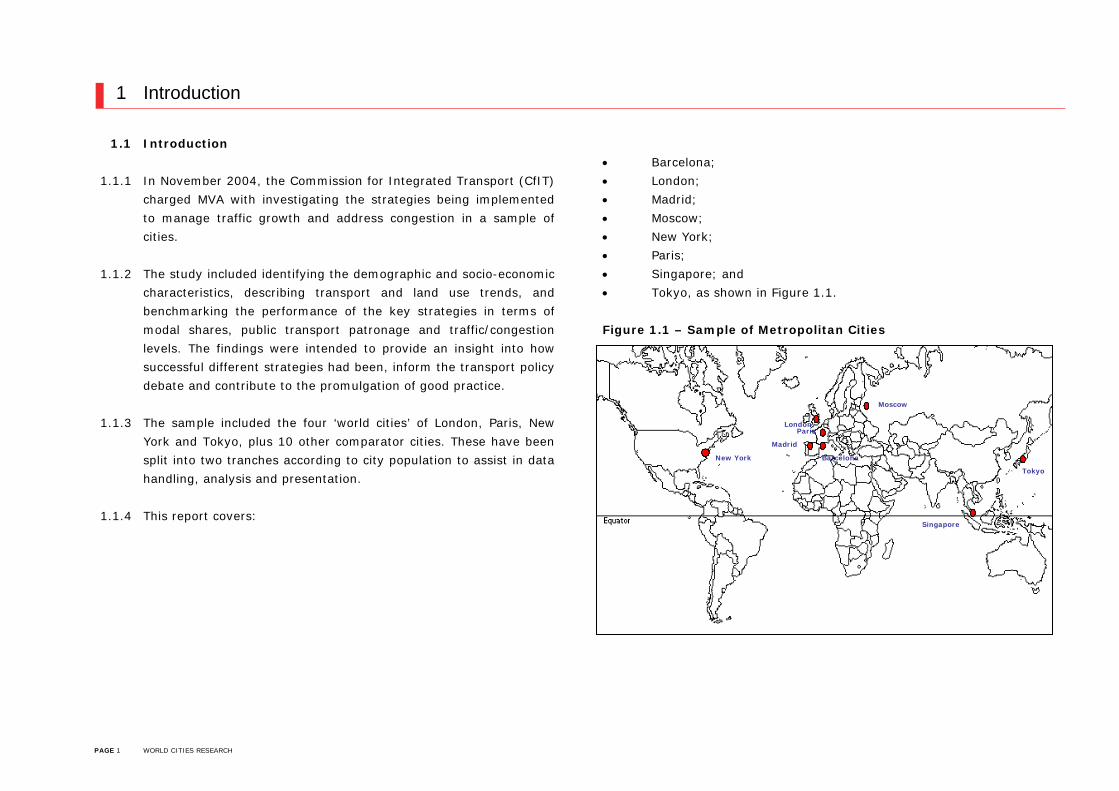
1.1.1 In November 2004, the Commission for Integrated Transport (CfIT)
charged MVA with investigating the strategies being implemented
to manage traffic growth and address congestion in a sample of
cities.
1.1.2 The study included identifying the demographic and socio-economic
characteristics, describing transport and land use trends, and
benchmarking the performance of the key strategies in terms of
modal shares, public transport patronage and traffic/congestion
levels. The findings were intended to provide an insight into how
successful different strategies had been, inform the transport policy
debate and contribute to the promulgation of good practice.
1.1.3 The sample included the four ‘world cities’ of London, Paris, New
York and Tokyo, plus 10 other comparator cities. These have been
split into two tranches according to city population to assist in data
handling, analysis and presentation.
1.1.4 This report covers:
• Barcelona;
• London;
• Madrid;
• Moscow;
• New York;
• Paris;
• Singapore; and
• Tokyo, as shown in Figure 1.1.
Figure 1.1 – Sample of Metropolitan Cities
London
New York
Madrid
Barcelona
Paris
Moscow
Tokyo
Singapore
PAGE 1 WORLD CITIES RESEARCH

1 Introduction
1.1.5 The second tranche of the study concerns the strategies being
implemented in Dublin, Lyon, Nottingham, Perth, Rome and Zurich.
1.2 Methodology
1.2.1 The research into each tranche of cities has been undertaken in
three phases; a desk study of available documentation and
statistics, case studies based on interviews with relevant authorities
within the cities, and an analysis of the policies and their impacts.
1.2.2 The Internet has been a valuable resource in the desk study phase
giving access to information collected by various pan-European
initiatives, including previous research funded by the European
Commission and networking groups such as POLIS and EMTA. We
have also benefited from several articles on transport strategies
and their impacts in on-line journals such as Transport Policy and
Transport Reviews which have been supplemented by papers from
recent conferences organised by the Association of European
Transport (AET) and the OECD.
1.2.3 Much of the contextual data has come from two key sources:
• Millennium Cities Database (data for 1995/96) -
compiled in 2001 by Dr Jeff Kenworthy and Felix Laube for
the International Association of Public Transport (UITP);
and
• An International Sourcebook of Automobile
Dependence in Cities 1960–1990 (trend data for every
ten years, typically 1961, 1971, 1981, 1991) – compiled in
1999 by Dr Jeff Kenworthy and Felix Laube and published
by the University of Colorado Press.
1.2.4 These are the most comprehensive and consistent datasets, but
they contain limited time series data to enable an investigation into
the impacts of policies.
1.2.5 Hence, we have used data provided by the relevant city authorities
to consider issues of effectiveness. Unfortunately monitoring is
continuing to receive a low profile and the analysis has been
constrained by the availability of suitable indicators and differences
in definitions and survey years.
1.2.6 The benchmarking has focused on changes in 2003/04:
• Modal shares;
• Public transport patronage; and
• Congestion – using proxy measures of traffic flows and
speeds.
PAGE 2 WORLD CITIES RESEARCH

1 Introduction
1.2.7 We have sought to compare ‘like with like’; the data refer to the
metropolitan areas which generally cover the journey to work
areas, and financial information has been converted to a common
currency and adjusted for purchasing power parity. However, the
metropolitan areas covered by Tokyo and New York are significantly
larger than Greater London, and data for Paris and Madrid tend to
be collected at the regional, rather than the metropolitan area
level.
1.2.8 Where possible, we have included data for the central business
district (CBD) or the inner city to assist meaningful comparison.
1.3 Structure of this Report
1.3.1 Following this introductory chapter:
• Chapter 2 considers the contextual factors that are
influencing the demand for travel and, in particular, levels
of car use and congestion.
• Chapter 3 summarises the strategies that are being
implemented, drawing on the material in the case studies.
• Chapter 4 links the contextual factors and the strategies
and discusses the common issues facing the World Cities
and the selected large comparators, and the effectiveness
of the various strategies, along with the factors that have
contributed to success.
• Chapter 5 provides some interim conclusions for the study.
1.3.2 The case study reports are included in the Appendix.
PAGE 3 WORLD CITIES RESEARCH


2 Background and Context
2.1 Motorised Travel
2.1.1 Motorised travel has grown significantly since the 1960s,
mainly due to the increase in car, rather than public
transport use (Figures 2.1-2.2).
Figure 2.1 – Car Use
Tokyo
London
New York
2.1.2 Car use is continuing to rise in all the cities (where data
exists), with the exception of New York, where there was
some decline through the early 1990s associated with falling
car ownership. Recent data suggests that this may have
continued, though there has been no fall in traffic in
Manhattan.
Paris
Singapore
0
1000
2000
3000
4000
5000
6000
7000
8000
9000
1951 1961 1971 1981 1991 2001
Pass
enge
r kilo
met
res
per
capi
ta
Note: Passenger kilometres per capita is a measure of car use,
taking no account of occupancy, and a good proxy indicator of congestion, as it reflects the volume of vehicles on the road.
Source: Kenworthy and Laube, 1999 and 2001
2.1.3 The rate of growth slowed in London and Singapore during
the early 90s; the daily average number of car journeys in
London continued to rise slowly through the late 90s and
began to decline in 20032, and annual car mileage also fell in
Singapore after 20023.
2.1.4 In contrast, car use increase in Paris and Tokyo rose rapidly
in the early 90s. In Paris, this has since tailed off and the
2 TfL, London Travel Report 2004 3 Land Transport Authority, Singapore Land Transport Statistics in Brief, 2004
PAGE 5 WORLD CITIES RESEARCH

2 Background and Context
number of car trips per day fell between 1997-2001, though
the average journey length has continued to increase4. Figure 2.2 – Public Transport Use
London
New York
2.1.5 Whilst there has been a clear trend of increasing car use,
public transport use has varied largely because of
fluctuations in the economy and issues of quality and
reliability (discussed later).
2.1.6 In London, the decline in the early 90s has been reversed
and total passenger kilometres has risen; bus use has
increased 50% between 1998/99 and 2003/04, while
Underground use peaked in 2000/01 and has fallen slightly
in the last three years. Similar trends of increasing public
transport use have occurred recently in the other cities, with
the exception of Paris, where the average number of
journeys per day has fallen, but the average journey length
has remained constant. Substantial increases in public
transport patronage (passenger journeys) have been seen in
Madrid and Barcelona.
Paris
Singapore
Tokyo
0
1000
2000
3000
4000
5000
6000
1951 1961 1971 1981 1991 2001
Pass
enge
r ki
lom
etre
s pe
r cap
ita
Source: Kenworthy and Laube, 1999 and 2001
4 DRIEF, Les résultants détaillés de l’enquête globale de transport 2001-2002
PAGE 6 WORLD CITIES RESEARCH

2 Background and Context
2.1.7 These changes in car and public transport use have resulted from:
• Changes in the drivers of demand; and
• The strategies that have been adopted to manage traffic
growth.
2.1.8 The rest of this chapter considers the key drivers, namely the
changes in the demographic structure, land use pattern, economy
and travel options, particularly the availability of a car. The
strategies and the policies implemented in each city are discussed
in Chapter 3.
2.2 Key Drivers of Demand
Demographics
2.2.1 Each of the cities has undergone a period of rapid urbanisation. In
London, Paris and New York this took place during the late
nineteenth century before the influence of the private car.
2.2.2 The population of the city centre subsequently stabilised or even
declined as residents moved out to the suburbs; in London, the
railways assisted the relocation of the middle classes, whereas in
Paris, the wealthy households stayed in the centre and the poor
moved out to areas with little transport provision.
2.2.3 In New York, the rail/subway links opened some surrounding areas
to development, but it was the construction of the freeways
following the Second World War that allowed the population to
continue to grow in low density neighbourhoods that sprawl into the
surrounding states of New York, Connecticut and New Jersey.
2.2.4 Meanwhile cities such as Barcelona, Madrid, Tokyo and Moscow
were growing fast. The growth was initially focused on the city
centre, but monocentric policies in the first three were diluted by
market forces and largely unplanned housing developments
occurred on the periphery as transport infrastructure was extended.
2.2.5 In Tokyo, the combination of radial rail links and poor housing
conditions in the centre encouraged residents to move out to
increasingly remote suburbs. Nowadays two-thirds of commuters
travel more than an hour to work.
2.2.6 The Asian cities have been booming since the 1970s; Tokyo has
continued to grow and the population of Singapore has been rising
by 10-15% every 10 years.
PAGE 7 WORLD CITIES RESEARCH

2 Background and Context
City 1970 1980 1990 1995 2000
Barcelona 2,170 2,486 2,621 2,776 2,885
London (Outer) 4,498 4,303 4,325 4,300 4,416
Madrid 3,761 4,687 4,906 5,182 5,205
Moscow (includes inner city) 7,200 8,100 9,000 8,800 8,297
New York (rest of Tri-state area) 10,836 10,854 11,086 n/a 11,219
Paris (rest of Ile de France) 6,846 7,906 8,509 8,851 8,875
Singapore (includes inner city) 2,074 2,414 2705 2,987 3,263
Tokyo (Saitama, Kanagawa, Chiba) 12,630 17,587 23,633 24,609 25,283
Note: The definitions of Barcelona and Paris vary slightly between datasets. For example, the tables above correspond with the most recent travel data and assume that Barcelona is made up of the
city, immediate suburbs beyond the ring road and the extended metropolitan area, whereas Kenworthy and Laube have used the city and the immediate suburbs only. Similarly for Paris,
we have assumed the inner city is the Ville de Paris, whereas Kenworthy and Laube have used this plus the surrounding Petite Couronne. Recent population data for the inner city and suburbs is not readily available for Moscow and Singapore. Source: Various City Census plus Kenworthy
and Laube, 1999 and 2001 for Singapore.
Table 2.1 - Population of Inner City (000s)
City 1970 1980 1990 1995 2000
Barcelona 1,745 1,753 1,644 1,615 1,496
London (Inner) 3,031 2,498 2,504 2,700 2,766
Madrid 3,121 3,159 3,010 2,867 2,939
New-York (New York City) 7,895 7,071 7,323 n/a 8,008
Paris (Ville de Paris) 2,400 2,188 2,152 2,131 2,125
Tokyo (23 Wards) 8,841 8,352 8,164 7,830 8,130
Table 2.2 - Population of Suburbs (000s)
2.2.7 All the cities grew in the late 90s, with the exception of
Barcelona and Moscow, which saw some decline that has
since been reversed. The growth has occurred in the
suburbs as city residents continue to decentralise or new
residents in-migrate from other regions (Tables 2.1-2.2).
This has been accompanied by higher rates of growth in car
ownership and car use to provide mobility in areas that
have limited public transport options, particularly for orbital
movements.
2.2.8 The most dramatic rebalancing of city centre and suburban
populations has been in Barcelona, Madrid, Paris and
Tokyo (Figure 2.3 overleaf).
2.2.9 For example, between 1970 and 2000, Barcelona grew by
11%; the inner city population fell by 14% (249,000), and
the surrounding metropolitan area gained 33% (715,000)
mainly in the outermost parts. Similarly in Paris, the Ville
de Paris fell by 11% (275,000) and the surrounding Ile de
France region grew by 30% (2 million). The exodus of
people (and jobs) has tempered policies to restrain car use
as much of the traffic in the centre is generated by
residents, and there are relatively low levels of commuters
and visitors coming in by car.
PAGE 8 WORLD CITIES RESEARCH

2 Background and Context
Figure 2.3 – Changes in Metropolitan Populations (Selected Cities)
1,745 1,753 1,644 1,496
2,170 2,486 2,621 2,885
0
2,000
4,000
6,000
8,000
10,000
12,000
1970 1980 1990 2000Popu
latio
n (m
illio
ns)
Barcelona Suburb
Barcelona City
3,031 2,498 2,504 2,766
4,498 4,303 4,325 4,416
1970 1980 1990 2000
London Suburb (Outer)
London City (Inner)
3,121 3,159 3,010 2,939
3,761 4,687 4,906 5,205
1970 1980 1990 2000
M adrid City M adrid Suburb
2,400 2,188 2,152 2,125
6,846 7,906 8,509 8,875
1970 1980 1990 2000
Paris Suburb (IIe de France)Paris City (Arr 1-10)
8,841 8,352 8,164 8,130
12,630 17,58723,633 25,283
05,000
10,00015,00020,00025,00030,00035,00040,000
1970 1980 1990 2000
Popu
latio
n (m
illio
n
Tokyo City Tokyo Suburb
Paris Suburb (Petite and Grande Couronne)
Paris City (Ville de Paris)
s)
PAGE 9 WORLD CITIES RESEARCH

2
Mid
adult
Older
adult
Over
65
23.8% 31.7% 21.5%
38% 17.8% 11%
63.4% 19.3%
57.8% 23.4%
62% 13%
6% 26.1% 19.6%
36.6% 21.6% 7.2%
70.9% 17.1%
ouncil (www.bcn.es), child 0-14, young adult 15-24, f National Statistics (Mid-2000 estimate), child 0-14, -64; 3Madrid Population and Housing Census (2001), .ru/eng/pop/t_4.htm 1995, child, working age, older (New York City 2004 estimate), child 18 and under, ecensement/page_accueil_rp.htm, city child 0 to 19, adult 60 to 74; 7http://www.singstat.gov.sg/papers/ tion by age group (2000), age categories as London. /PROFILE/APPENDIX/appendix2.htm, child under 14, tages may not sum to 100% due to rounding effects.
lation and Average Household Size 2.2.
2.2.
PAGE
Background and Context
City Child
Young
adult
Barcelona1 11.6% 11.4%
London2 18.9% 13.9%
Madrid3 17.3%
Moscow4 18.8%
New York5 26%
Paris6 18.3% 3
Singapore7 21.5% 13.0%
Tokyo8 11.9%
Source and age categories: 1Barcelona Town Cmid adult 25-39, older adult 40-64; 2Office o
young adult 15-24, mid adult 25-44, older adult 44child under 19, adult 20-64; 4http://www.md.mos
than working age; 5http://www.statehealthfacts.kff.orgadult, 19-64; 6Source: http://www.insee.fr/en/ryoung adult 20 to 39, mid adult 40 to 59, older
c2000/censuscount.pdf 2000, resident popula8http://www.chijihon.metro.tokyo.jp/ english
adult 15-64. Percen
Table 2.3 – Age Structure of Popu10 Further growth in car use has occurred as the city
populations have aged and the average household size has
fallen.
11 London, Singapore and Tokyo have a particularly large
proportion of adults in their 30s and 40s (Table 2.3). It is
these age cohorts that travel the most and have the
highest propensity to drive, as illustrated by the distances
travelled in England and Wales from the National Travel
Survey (Table 2.4 overleaf).
10 WORLD CITIES RESEARCH
2 Background and Context
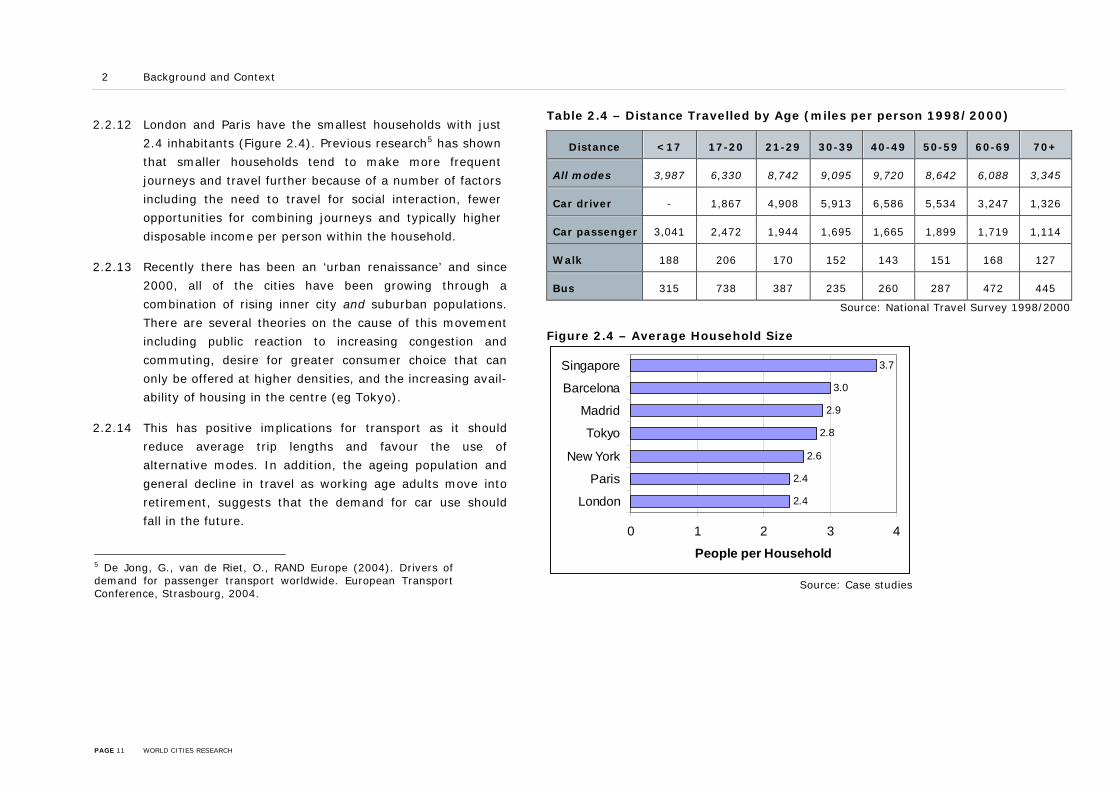
Table 2.4 – Distance Travelled by Age (miles per person 1998/2000)
Distance <17 17-20 21-29 30-39 40-49 50-59 60-69 70+
All modes 3,987 6,330 8,742 9,095 9,720 8,642 6,088 3,345
Car driver - 1,867 4,908 5,913 6,586 5,534 3,247 1,326
Car passenger 3,041 2,472 1,944 1,695 1,665 1,899 1,719 1,114
Walk 188 206 170 152 143 151 168 127
Bus 315 738 387 235 260 287 472 445
Source: National Travel Survey 1998/2000 Figure 2.4 – Average Household Size
2.4
2.4
2.6
2.8
2.9
3.0
3.7
0 1 2 3 4
London
Paris
New York
Tokyo
Madrid
Barcelona
Singapore
People per Household
Source: Case studies
2.2.12 London and Paris have the smallest households with just
2.4 inhabitants (Figure 2.4). Previous research5 has shown
that smaller households tend to make more frequent
journeys and travel further because of a number of factors
including the need to travel for social interaction, fewer
opportunities for combining journeys and typically higher
disposable income per person within the household.
2.2.13 Recently there has been an ‘urban renaissance’ and since
2000, all of the cities have been growing through a
combination of rising inner city and suburban populations.
There are several theories on the cause of this movement
including public reaction to increasing congestion and
commuting, desire for greater consumer choice that can
only be offered at higher densities, and the increasing avail-
ability of housing in the centre (eg Tokyo).
2.2.14 This has positive implications for transport as it should
reduce average trip lengths and favour the use of
alternative modes. In addition, the ageing population and
general decline in travel as working age adults move into
retirement, suggests that the demand for car use should
fall in the future.
5 De Jong, G., van de Riet, O., RAND Europe (2004). Drivers of demand for passenger transport worldwide. European Transport Conference, Strasbourg, 2004.
PAGE 11 WORLD CITIES RESEARCH

2 Background and Context
Land Use Pattern
2.2.15 The physical development of the city and the resulting land use
pattern affects people’s need to travel and their choice of mode;
previous research6 has shown that residents and employees in
‘compact cities’ tend to travel less, make fewer journeys by car and
more trips on foot than those in lower density cities.
2.2.16 In London, the early development of the railways allowed residents
to move out of the city centre and so land use density did not rise
to the same level as Paris and New York where urban sprawl was
constrained for longer (in Paris by the ring of military land
surrounding the Ville de Paris, and in New York by the limited land
area of Manhattan Island). Whilst the majority of the jobs have
stayed in the Central Business District (CBD) (Figure 2.5), multi-
centric planning policies have since encouraged further
development at lower densities in the suburbs (Table 2.5 overleaf).
2.2.17 In Paris, major suburban centres have been developed just outside
the city walls, for example, at Créteil and Bobigny to absorb the
growing population, and La Défense to accommodate employment
growth. The plans for new towns, for example, in the rural areas of
Marne-la-Vallée and Melun, included housing and employment to
6 See www.vtpi.org and Kenworthy and Laube, 1999
reduce travel, but they grew into dormitory settlements and
contributed to the growth in travel.
2.2.18 In New York, the zoning laws have ensured that the suburban
residential areas are interspaced with small pockets of employment
and retail centres. Like Paris, this has taken the development
pressure off the city centre, but sprawl and disparate travel
patterns cannot be served by public transport and there is a high
level of car dependency, though New York has by far the lowest car
use of all US cities due to its extensive high density inner area and
large rail-oriented public transport system.
Figure 2.5: Employment in the CBD
13
14
16
18
20
21
28
39
0 5 10 15 20 25 30 35 40 45
Moscow
Tokyo
Singapore
Paris
Barcelona
New York
London
Madrid
Cit
y
Proportion of Jobs in CBD (%)
Source: Kenworthy and Laube, 2001
PAGE 12 WORLD CITIES RESEARCH

2 Background and Context
Table 2.5 – Comparative Land Use Indicators
Land Use Indicators Barcelona London Madrid Moscow New York Paris Singapore Tokyo
Area
metropolitan area (km2)13,235
1,579
(Inner London 321) 8,028 1,091
22,763
(NY City 785)
12,012
(Ville de Paris 105)648 12,563
urbanised area (km2)2 141 1,186 604 588 10,657 2,311 319 3,689
CBD (km2) n/a 27 42 19 23 23 8 42
Population Density
metropolitan area (pop/ km2) 8,387 4,438 645 7,974 845 916 4,612 2,386
urbanised areas (pop/ km2) 19,710 5,907 8,585 14,626 1,804 4,762 9,353 8,768
city centre (pop/ km2) 16,601 6,296 22,3773 15,4704 22,970 18,227 7,500 6,334
Note: 1The metropolitan area depends on arbitrary administrative boundaries. In some cases this is very large and incorporates lots of non-urban land (such as Madrid, Paris and New York), whereas in some cases it is very tight around the urban area (such as London). 2 The urbanised area is a
better measure of the built-up area ie the metropolitan area without agricultural land, forest, large parks and bodies of water; 3Refers to the city rather than the CBD; 41980 data. Source: Kenworthy and Laube, 2001, plus www.economist.com and consultant’s own research.
PAGE 13 WORLD CITIES RESEARCH

2 Background and Context
2.2.19 Political philosophies in the cities that developed rapidly in the mid-
20th century supported centralised planning and hence Barcelona,
Madrid and Moscow have high density centres and a mix of
residential and employment functions in the city centre.
2.2.20 In Barcelona, continuing urban growth has been accommodated by
in-fill in the existing urban area and decentralisation to towns on
the edge of the metropolitan area. Whilst these are served by rail,
there has been an increase in car use as the new sites have
generous parking standards.
2.2.21 In Madrid, the General Urban Plan (1946) allowed ribbons of
growth out from the city along the main radial corridors
(particularly along the north west/south east axes) to satellite
settlements. This structure demanded a high level of mobility,
especially for commuting journeys, but also meant that Madrid was
better suited to public transport use than cities with low density
sprawl.
2.2.22 However, the vision has gradually been replaced by more ad-hoc
planning decisions that have permitted low density peripheral
housing and science parks. With the continuing use of minimum
parking standards7 and development of high capacity roads, this
has contributed to greater car use and longer journey lengths.
2.2.23 Whilst the growth in employment in central Tokyo was a
considerable draw, the lack of housing prevented densities from
rising in the original city (known as the 23 Wards). With the
construction of the railways, cities have grown in the metropolitan
area that have densities similar to Ville de Paris and Manhattan,
however, these were unplanned and are mainly dormitory
settlements. The pressure from commercial occupiers and the rise
in property prices forced some residents out of the 23 Wards in the
70s and 80s, while tax incentives made areas on the periphery –
some 90km from the 23 Wards - more attractive8, further
extending commuting distances and leading to extreme crowding
on the road and rail networks.
7 The General Urban Plan (1997) requires one parking space for each new house or 100m2 of housing, and each 100m2 of land developed for industrial use. Rates for offices and recreation vary according to location; one space per 100m2 of built area inside the city and 1.5 spaces outside the M-30 ring road. 8 Most Japanese companies bear the full commuting costs of their employees and this has encouraged many workers to live in distant suburbs. Employers can deduct the costs of commuting allowances from their corporate income taxes.
PAGE 14 WORLD CITIES RESEARCH

2 Background and Context
Figure 2.6 – Urbanised Area and Motorised Travel
Moscow
Barcelona
Madrid
SingaporeLondon
Paris
Tokyo
New York
y = 0.6644x + 6749.2R2 = 0.7202
0
2000
4000
6000
8000
10000
12000
14000
16000
0 2000 4000 6000 8000 10000 12000
Urban Area (km2)
To
tal
Mo
tori
sed
Passen
ger
Kil
om
etr
es
Figure 2.7 – Motorised Travel by Mode
1266
1454
1763
1764
2047
3143
5605
7152
12504
4991
5385
3261
5553
3830
4151
3077
0 2000 4000 6000 8000 10000 12000 14000 16000
New York
Madrid
Paris
Barcelona
London
Singapore
Tokyo
Moscow
Passenger Kilometres per Capita
Public Transport Private Transport
Source: Kenworthy and Laube, 2001
2.2.24 In contrast, the development of Singapore has been
planned by the Urban Redevelopment Agency and regulated
by Government controls on land sales. New towns and
suburban areas have high densities and a mix of functions
to reduce the need to travel. Development is well
integrated with transport provision; the public housing
areas are well-served by the extensive public bus and rail
networks, though there is higher car dependency in the
private estates.
2.2.25 Singapore’s 1991 Revised Concept Plan has been strongly
influenced by transport considerations and contains two key
land use planning strategies; to decentralize activities to
balance rail utilisation, and reduce the need to travel by
locating employment opportunities close to residential
areas.
2.2.26 The impact of the land use patterns (discussed above) on
travel are illustrated in Figure 2.6. Residents in the cities
that have spread over a larger urban area (namely Paris,
New York, Tokyo) tend to travel more, and a greater
proportion of their mileage is by private rather than by
public transport (Figure 2.7). The exception is Tokyo where
PAGE 15 WORLD CITIES RESEARCH

2 Background and Context
Figure 2.8 – Urbanised Area and Average Journey Length over half of the total distance travelled by motorised modes
is by public transport (almost entirely rail).
Figure 2.9 – Density and Average Journey Length
Barcelona
New York
Tokyo
Paris
MadridLondon
Singapore
Moscow
y = 1.1416Ln(x) + 0.5237R2 = 0.6516
0
2
4
6
8
10
12
14
0 2000 4000 6000 8000 10000 12000
Urbanised Area (km2)
Avera
ge J
ourn
ey L
ength
(km
)Moscow
SingaporeLondon
Madrid
Paris
Tokyo
New York
Barcelona
y = -1.8043Ln(x) + 24.596R2 = 0.45
0
2
4
6
8
10
12
14
0 5000 10000 15000 20000 25000
Density of Urbanised Area (people/km2)
Avera
ge J
ourn
ey L
ength
(km
)
Source: Kenworthy and Laube, 2001
2.2.27 Part of this increased mobility is due to longer average
journey lengths, as shown in Figure 2.8. A typical journey
in the ‘spread cities’ of New York and Tokyo is significantly
longer than in smaller cities such as Barcelona and
Singapore.
2.2.28 Average journey length is affected by density. Cities that
have retained high densities in the city centre and focused
additional growth in mixed use suburban centres, tend to
have shorter average journey lengths (Figure 2.9). Hence
the lowest levels of motorised travel are in compact, high
density cities.
PAGE 16 WORLD CITIES RESEARCH

2 Background and Context
Economic Growth
Moscow
New York
TokyoParis
London
SingaporeMadrid
Barcelona
y = 0.0217x + 4652.2R2 = 0.0085
0
2000
4000
6000
8000
10000
12000
14000
0 5,000 10,000 15,000 20,000 25,000 30,000 35,000 40,000 45,000 50,000Metropolitan GDP ($, 1995)
To
tal
Passen
ger
Kil
om
etr
es b
y C
ar
Figure 2.10 – Car Travel and GDP
2.2.29 Measures of the economic wealth of a metropolitan area are
sensitive to the location of the boundary of the functional
economic region. Where there is cross-border commuting
residents take their wealth back to their place of residence,
hence London has a considerably lower gross domestic
product (GDP) per capita than Paris, as many wealthy
commuters live outside Greater London, whereas the Ile de
France area is much bigger and contains just about all
Parisien workers.
2.2.30 Using the GDP for the region, there is no apparent link
between wealth and total motorised mobility or total travel
by car amongst the world cities and the other large
comparators (Figure 2.10). The effects of transport policies,
congestion and other contextual factors have helped to
decouple these. Source: Kenworthy and Laube, 2001
2.2.31 The case studies highlight several cities that have seen
public transport demand fluctuate with economic growth and
recession, but there is insufficient trend information on
changes in GDP, incomes and travel demand to enable any
robust analysis as part of this study.
PAGE 17 WORLD CITIES RESEARCH

2 Background and Context
Figure 2.12 – Revenue per Passenger Kilometre
0.00 1.00 2.00 3.00
Singapore
Barcelona
Madrid
Tokyo
New York
Paris
London
£ (2001)
RailMetroBus
0.00 0.05 0.10 0.15 0.20
Barcelona
Madrid
Tokyo
New York
Paris
London
£ (2001)
RailMetro
Bus
Figure 2.11 – Revenue per Passenger Public Transport Fares and Cost Recovery
2.2.32 Cities have simplified fares structures and most have flat or
zonal fares, particularly for bus, tram and metro systems. All
the cities except Moscow also offer stored value or
smartcards to provide integrated fares. Comparing the
average revenue per passenger and per passenger-kilometre
to overcome differences in average journey lengths (Figures
2.11-2.12), shows that:
• New York and London have the highest urban rail
fares;
• London has by far the highest metro fare; and
• Tokyo, New York, and London have the highest bus
fares.
2.2.33 London’s public transport fares rose by about 20% in January
2005 to help fund a £3bn investment programme in the
transport network, although in real terms bus fares have not
increased for four years. A pricing strategy has been
introduced through the ‘Oyster’ pre-paid card to reduce the
number of cash transactions and to encourage off-peak
travel.
Source: Case studies and EMTA (www.emta.com) Source: Relevant transport authorities and EMTA (www.emta.com)
PAGE 18 WORLD CITIES RESEARCH

2 Background and Context
Table 2.6 – Cost Recovery Rate
City Farebox
(%)
Other (%)
London 55% 45% mainly central government grant
Moscow 56% 44% central and city government grant
Barcelona 75% 25% central and city government grant
New York 46% 28% dedicated taxes, 14% toll revenues
7% state and local subsidies, 5% other revenue
2.2.34 Fare levels tend to reflect the philosophy towards public
transport, in particular the amount to which fare revenue is
expected to cover the operating costs.
2.2.35 Paris has the lowest cost recovery rate (the proportion of
public transport operating costs covered by fare revenue), as
shown in Table 2.6. The farebox covers just 28% of costs
and the remainder is made up through a ‘payroll’ tax
(Versement Transport), government grants, and employer
contributions to employee travel costs (through the Carte
Orange season ticket). Singapore has the highest cost
recovery ratio at over 100%, where fare revenue alone
covers more than the operating costs, though this is also true
for many of the private operators in Tokyo.
Madrid 55% 45% subsidies
Paris 28% 37% ‘versement transport’ payroll tax
22% central/regional/local government grant
9% employers contribution to carte orange, 4% other
Tokyo 80% 16% subsidies/grants
8% other commercial sources
Singapore 100+% n/a
Note: Percentages include rounding errors. Source: Case studies and EMTA (www.emta.com). Fare revenue includes concessionary fare reimbursement.
PAGE 19 WORLD CITIES RESEARCH

2 Background and Context
Highways and Roads
2.2.36 New York is unique in that its strategic links form a grid pattern and
access to Manhattan is provided by bridges and tunnels. These
provide an effective cap on traffic entering the city centre and
varying tolls are being used to manage the level of demand
throughout the day.
2.2.37 In the other cities, the highway networks are highly radial. In
London, these radials run through suburban centres where local
access movements reduce their efficiency. Elsewhere, the major
radial roads tend to be tolled and segregated to provide fast access
to the city.
2.2.38 The convergence of numerous radial routes has brought problems
of through traffic and distribution to the city streets which have
been tackled with varying levels of investment and environmental
sensitivity.
2.2.39 For example, with rapid growth during the mid 20th century, Tokyo
outgrew its network of minor roads. An outer ring road circling the
north of the Tokyo prefecture was built and inside eight
expressways feeding inner and central ring roads have been carved
into the existing urban structure of the 23 Wards (Figure 2.13).
Figure 2.13 – Tokyo Expressways
PAGE 20 WORLD CITIES RESEARCH

2 Background and Context
2.2.40 In Paris, fourteen autoroutes converge on the eight-lane
Boulevard Périphérique which was built on unused land
circling the Ville de Paris. Within the city limits, the
Boulevards Extérieurs provide an inner ring road with grade
separated flyovers
and under-passes at
intersections. Efforts
to implement former
President Pompidou
policies “to adapt
Paris to the car” also
included the
construction of
segregated
expressways running parallel to the Seine (left) that provide
a bypass to the CBD.
Figure 2.14 - Roads per 1000 People
2.2.41 Madrid has two complete orbitals and two major bypasses
around the south and east of the city. Barcelona has three
ring roads and a fourth is under consideration. The inner
rondas that form a complete orbital were built as part of the
large-scale improvement in infrastructure ahead of the 1992
Olympics. 1,627
1,910
1,860
4,004
4,765
91
9
67
10
113w York
d
n
s
Tokyo
Ne
PAGE 21 WORLD CITIES RESEARCH
Madri
Londo
Pari
2.2.42 This scale of major road building contrasts with London
where the M25 circles the outside of the metropolitan area,
the North Circular provides the only dedicated orbital route
in the city and there are few urban motorways (see Figures
2.14 and 2.15)
93544
13 514
1,000 2,000 3,000 4,000 5,000
Moscow
Length of Road (m/1000 persons)
Figure 2.15 - Roads per Urban Hectare
37 494
0 6,000
Barcelona
Singapore
Urban motorway Other roads
2
2
4
3
7
1
8
1
75
86
87
89
97
113
140
351
0 50 100 150 200 250 300 350 400
Moscow
New York
Singapore
Paris
Barcelona
London
Madrid
Tokyo
Length of Road (m/100km2)
Urban motorway Other roads
(hectare)

2 Background and Context
2.2.43 Tokyo and Moscow have plans for significant road building. In
Tokyo, these are aimed at alleviating congestion, whereas in
Moscow, they aim to address the current under-provision of roads
and the city authorities accept that road building will not have
much impact on congestion as car ownership is rising so rapidly.
2.2.44 Elsewhere, there is evidence of a change of public and political
attitudes towards urban roads. For example, public demands to
reclaim public space in Paris led to the Seine Banks being closed
during summer 2004 and converted into public ‘beaches’, and it is
likely that they will be downgraded or closed permanently in the
future.
2.2.45 Some 99km of Madrid’s dual three-lane inner ring road (M30) are
currently being reconstructed and 56km will be placed in tunnel at
a total cost of €3.7 billion (£3.1 billion adjusted for purchasing
power parity). Similarly, 5km of Barcelona’s rondas have already
been placed in tunnel to reduce noise and pedestrian severance
(below) and road space along the main distributor (Avenida
Diagonal) has been reallocated to tramways.
The Ronda del Mig (right) now runs in a 2km tunnel and the
road above has been converted to a rambla
lined with trees and public seating.
PAGE 22 WORLD CITIES RESEARCH

2 Background and Context
Figure 2.16 - Traffic Intensity
676,312
1,662,174
2,042,991
2,143,606
2,241,416
2,196,267
4,141,479
4,076,121 584,031
33,786
221,592
54,146
42,991
107,925
3,874
16,020
0 500000 1000000 1500000 2000000 2500000 3000000 3500000 4000000 4500000 5000000
Tokyo
New York
Paris
London
Madrid
Singapore
Moscow
Barcelona
Cit
y
Vehicle km/km
Passenger car kilometres per kilometre of road (v.km/km)
Motor cycle kilometres per kilometre of road (v.km/km)
26
29
30
30
35
35
36
39
0 5 10 15 20 25 30 35 40 45
Tokyo
London
Moscow
Barcelona
Madrid
Singapore
Paris
New York
Cit
y
km/h
Figure 2.17 - Average Traffic Speed
Source: Kenworthy and Laube, 2001
2.2.46 Within the cities, the differences in the capacity of the road
links are important in explaining average speeds and
congestion levels. In New York and Paris, for example, the
planned networks of multi-lane distributor roads
accommodate a higher volume of traffic and hence have a
higher average speed than the predominantly single
carriageway roads in London9 and Tokyo that have evolved
as the city has grown (Figure 2.16 and 2.17).
2.2.47 Significantly only in Tokyo does the average speed of public
transport exceed that of general road traffic.
2.2.48 Roads in the historic core of Barcelona are too narrow to
allow unrestrained car use. Areas have been pedestrianised
or converted to access only operation with permit schemes
and the traffic is channelled onto more appropriate roads.
This has increased the traffic intensity, but reduced traffic
congestion in the centre.
9 The Millennium Cities Database contains the most recent consistent data on average speed in each metropolitan area, but this refers to 1995, and precedes the congestion charging scheme in London. More recent data for certain parts of cities, or types of roads, are shown in Chapter 4, but this can only be used for trend analysis within the city concerned.
PAGE 23 WORLD CITIES RESEARCH

2 Background and Context
2.2.49 The effects of low road provision and road pricing are
evident in the high traffic intensity yet above-average
speed in Singapore. The charges discourage drivers from
travelling in congested conditions and help to manage
traffic levels throughout the day.
Figure 2.18 – Formal Parking Spaces per 1,000 CBD Jobs
16
40
66
122
142
237
263
445
0 100 200 300 400 500
Moscow
Tokyo
New York
London
Paris
Singapore
Madrid
Barcelona
Cit
y
Number of Spaces
Source: Millennium Cities Database
2.2.50 Parking policies are used to influence traffic demand in all
the cities (Figure 2.18), with the exception of:
• Moscow - where there are few formal parking
spaces, but the existing legislation does not support
stopping and parking restrictions and their
enforcement; and
• Tokyo - where the shortage of parking provision
and need to provide evidence of an off-street
overnight space prior to purchasing a car have
restrained both car ownership and car use,
however, this is changing as the metropolitan
government encourages more car park
construction.
PAGE 24 WORLD CITIES RESEARCH

2 Background and Context
2.2.51 The supply of parking varies according to: Table 2.7 – Comparison of Parking Charges (2004)
Parking Charges Paris London New York
Shopping area:
Parking charge (£ per hour)
Maximum duration of stay (hours)
2
2
3
2
2.5
1
Business area:
Parking charge (£ per hour)
Maximum duration of stay (hours)
2
2
4
1
2
1 Note: Streets selected in the vicinity of Bourse and Grands Magasins, Paris; Oxford
Circus and City of London, London; and Fifth Avenue and Wall Street, New York. Prices have been adjusted for purchasing power parity. Source: MVA, 2004.
• The need to provide adequate spaces for residents -
Barcelona and Madrid have more than half of the
metropolitan population living in the city and hence
have the highest parking provision; and
• The commitment to parking controls to deter car
access - London and New York are the strongest
examples of this and have long used parking
restrictions and charges to deter car access.
2.2.52 A limited comparison of on-street parking charges in key
business and shopping areas show that parking is more
expensive and restricted in London and New York than in
Paris, for example, where there is a greater proportion of
metropolitan residents in the CBD and parking policies have
tended to have lower priority than public transport
improvements in transport policy (Table 2.7).
PAGE 25 WORLD CITIES RESEARCH

2 Background and Context
Public Transport
2.2.53 Rail has been important in allowing cities to expand by providing a
fast means of bringing commuters into the city centre. The older
surface rail systems in London, Paris and New York provide radial
links to the edge of the CBD, whereas the newer systems provide
cross-city links that reduce interchange movements and crowding at
peripheral stations.
2.2.54 For example, the Tokyo surface rail
network serves commuters within a
100km radius of the centre of the
CBD. JR East (formerly Japanese
National Railways) and most of the
private rail operators feed a 30km
inner circle (Yamanote Loop). JR
East opened an additional 180km
Shonan-Shinjuku cross-city line in
2001, linking the suburban cities in
the north of the metropolitan area
with the southern part of the city
centre, and it is currently used by
60,000 passengers per day.
Yamanote Loop
2.2.55 Metro systems link the inner suburbs with the city centre and
provide the main means of public transport within the city. The
exceptions to this hierarchy of modes are London and Singapore
where buses have an important role (Table 2.8).
2.2.56 London has the longest metro system in our sample of cities,
though New York covers a larger area and so transit speeds are an
issue. There are station bypasses and double-tracking – the total
network has 1,065km of track - to allow both express and stopping
services and 24-hour operation.
Table 2.8 - Length of Metro
City Length of
Metro (km)
Metro Share of Bus and Metro
Trips (%) No. Bus Routes
London 415 38 700
New York1 368 65 235
Tokyo 292 822 n/a
Moscow3 265 67 540
Madrid4 226 58 188
Paris5 212 88 534
Barcelona 111 63 104
Singapore6 83 25 244
1Data for New York City; 2Data for 23 Wards; 3Bus includes trolleybus; 4Bus data for city; 5Bus data for Ville de Paris; 6comprises underground sections of the
MRT system. Sources: www.wikipedia.com, Jane's Urban Transport Systems 01-02, American Public Transport Association (2005) and individual operators.
PAGE 26 WORLD CITIES RESEA
RCH
2 Background and Context
2.2.57 A dual system also operates in Paris; the part-over, part-
underground RER provides express links from the suburbs and
across the city centre without obliging commuters to interchange at
terminus stations. The métro mainly covers the Ville de Paris; its
stations are closely spaced so speeds are low and the system is only
really appropriate for the short-distance movements that in London
are typically made by bus (as illustrated by the modal shares for the
city centres in Table 2.9).
Table 2.9 Modal shares for the city centres
Mode Paris
(Arr 1-4)
Central
London
Rail/metro 70 71
Bus 4 10
Car/motorcycle 17 12
Walk/cycle 9 6
Note: Comparisons between London and Paris are complicated by the different
levels at which data are collected. The first four arrondisements have a
population of 101,000 and area of 5km2, compared to Central London which
has a population of 170,000 and area of 11km2. Source: MVA 2004 and TfL
2002.
PAGE 27 WORLD CITIES RESEARCH

2
ail (surface and metro lines)
4745
2000 3000 4000 5000
ents) Density (m per urbanised km2)
2.2.5
2.2.5
2.2.6
PAGE 2
Background and Context
Figure 2.19 – Provision of r
93
39
149
55
55
92
171
153
167
400
709
747
774
830
1033
0 1000
New York
Singapore
Paris
Madrid
Moscow
Tokyo
London
Barcelona
Supply (km per mil resid
8 All the cities except New York have been developing their metro
systems by building extensions and new lines. With the exception of
London, these are supported by feeder buses in the suburbs.
Barcelona and Singapore see investment in metro (and tram) as
crucial to encouraging modal switch and this has been possible, in
part, because it does not have the heavy maintenance burden of
London, Paris and New York which have much older, larger systems.
9 The total provision of rail (surface and metro lines) is shown in
Figure 2.19. London has the largest supply of lines and second
highest density in the sample, though the supply is influenced by
the relatively low population density of Greater London.
0 Few operators publish information on crowding but the case studies
suggest that the worst problems are in Tokyo, London and New
York. In Tokyo, passenger demand is highly peaked with most
commuters travelling within a 20-minute period around 08:30 when
trains typically having an ‘overload percentage’ of 250% - two and
half times the design capacity. The rail operators employ ‘pushers’
to keep passengers clear of the doors and allow trains to leave the
Source: Consultants own research
platform, rather than to pack as many people as possible into the
carriage.
8 WORLD CITIES RESEARCH

2 Background and Context
2.2.61 Bus services have been improving in most of the cities as service
levels are increased, fleets are replaced or renovated and varying
progress is made with priority measures to improve speeds.
2.2.62 The greatest increase in bus
kilometres has been in London,
rising by 28% between
1999/2000 and 2004/2005 to
452 million. There has also been
a notable improvement in the
quality of the vehicles; there are
now 7,966 vehicles in the fleet,
93% are low-floor10 and the
average age is 6.7 years
(including Routemasters, 4.5
years excluding Routemasters)11.
Paris has 171km of segregated bus lanes, 17km of contra-flow lanes and
118km of dual-use bus and cycle lanes.
2.2.63 Alongside the investment in suburban rail and metro extensions,
Madrid has also been making significant progress in increasing the
bus service offering. The municipal bus fleet comprises 1,958
mainly single deck buses and more than three-quarters are low-
10 TfL data for November 2004
11 TfL data for March 2004
floor with the rest being replaced over the next two to three years.
Service kilometres has increased by 12% between 1991-2002 to 96
million per year. There are a further 1,494 buses operated under
contract in the suburbs and about 150 of these are easy access.
The average age is 4.2 years for urban and 4.9 years for the
suburban fleet, within the Consorcio de Transportes de Madrid’s
target range of 4.5-6 years.
2.2.64 Significant improvements in bus priority have been made in Paris
where 350km of bus lanes have been implemented in the Ville de
Paris and immediate suburbs, compared to 205km in Greater
London and some 120km in Singapore. However, focus groups with
residents and local
employees have revealed
that the low headways
(typically 15 minutes on
most routes) and delays at
junctions mean that buses
are still not competitive with
the metro or the private car
for short journeys12.
In 2003, London began introducing bendy buses. At 18 metres long, these vehicles can
carry 140 people, at least 60 more than a double deck.
12 MVA 2004.
PAGE 29 WORLD CITIES RESEARCH
2 Background and Context
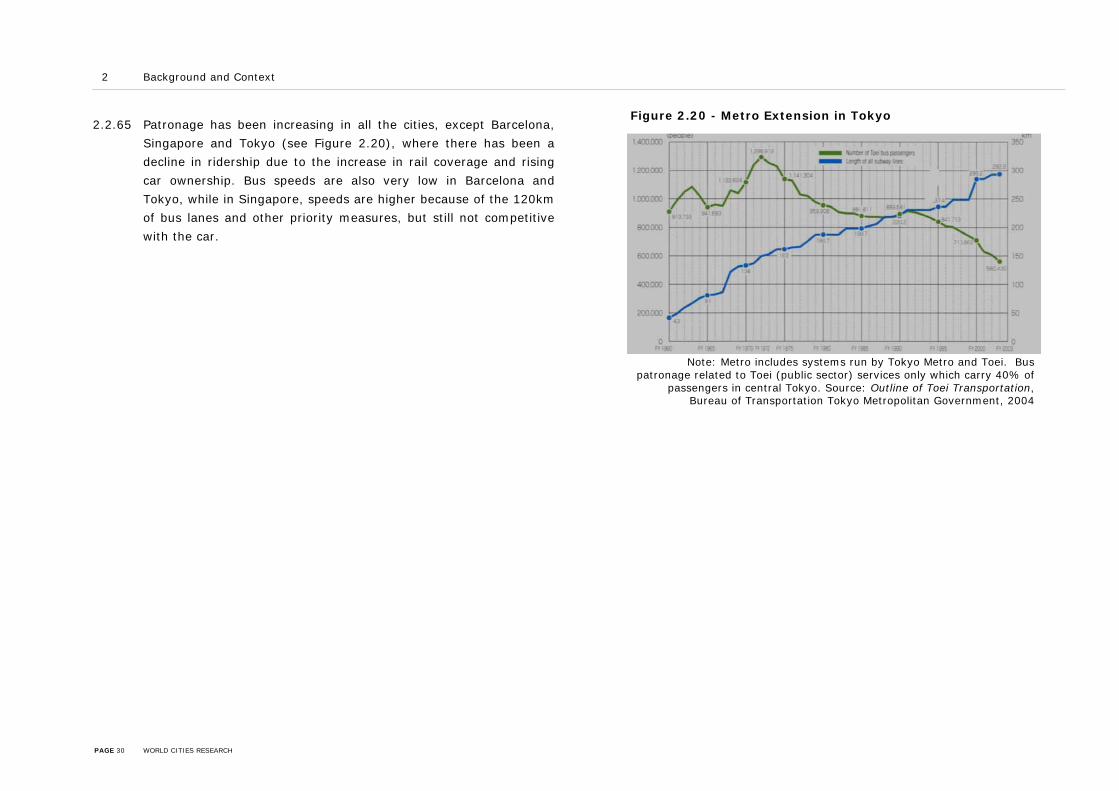
2.2.65 Patronage has been increasing in all the cities, except Barcelona,
Singapore and Tokyo (see Figure 2.20), where there has been a
decline in ridership due to the increase in rail coverage and rising
car ownership. Bus speeds are also very low in Barcelona and
Tokyo, while in Singapore, speeds are higher because of the 120km
of bus lanes and other priority measures, but still not competitive
with the car.
Note: Metro includes systems run by Tokyo Metro and Toei. Bus atronage related to Toei (public sector) services only which carry 40% of
passengers in central Tokyo. Source: Outline of Toei Transportation, Bureau of Transportation Tokyo Metropolitan Government, 2004
p
Figure 2.20 - Metro Extension in Tokyo
PAGE 30 WORLD CITIES RESEARCH

2
2.2.
2.2.
2.2.
13 Cf
PAGE
Background and Context
Singapore Vehicle Quota System
The Singapore Government increased vehicle import duties, registration fees and road tax in 1972 as the first step towards greater control of vehicle ownership and hence vehicle use. When the policy shifted towards road pricing as a more effective lever on use, these charges were reduced slightly, but still amounted to about S$34,000 (£10,000) on a typical 1500cc car with a market value of S$20,000, plus S$1,000 pa in 19991.
Despite the charges, vehicle ownership continued to rise by about 7% pa through the late 80s and the Government introduced a vehicle quota system to cap this at 3% pa by controlling the number of vehicles bought each month. Potential purchasers bid for a certificate of entitlement which is valid for 10 years and can be extended for a further 5 or 10 years after which the vehicle has to be scrapped. The bids are closely linked to the economy and are typically about S$30,000 but have reached as much as S$100,000. The bidding process has become more open; ‘auctions’ are held every fortnight, bidders now know the number of certificates available, and specify a reserve price which can be revised as bids rise.
Car Ownership
66 Previous research13 has shown strong links between GDP
and car ownership at the national level, but this correlation
is not clear within the sample of cities for this study where
the rate has been rising in some cities and falling in others
(Table 2.10 overleaf).
67 Car ownership has been increasing in Barcelona, Madrid and
Paris with the move to the suburbs, in Moscow, because cars
have become more widely available under the market
economy and average incomes have been rising, and also in
Tokyo as more off-street parking is built using metropolitan
government grants.
68 In contrast, car ownership has been declining in Singapore
where there are controls on purchases and high taxes (see
panel), and to a lesser extent in London and New York
because of high insurance costs, congestion and difficulties
The charges and quota system have been effective in constraining the growth in vehicle ownership. The total fleet was projected to reach one million by 19902, but had only grown to 711,043 (including 380,142 cars) in 2003. However, after paying so much for the vehicle, owners are encouraged to use them more. The average annual car use is 20,171km per car3, compared to 11,500km in London4. 1May, A.D. (2004) Singapore: The development of a world class transport system. Transport Reviews, Vol 24, No 1, 79-101, Jan 2004. 2Lim, L.G (1970) Transport planning in Singapore, Journal of the Institution of Engineer, Singapore. 3Singapore Land Transport, Statistics in Brief 2004. 4Estimated from total traffic in London (Transport for London, London Travel Report 2003) and total vehicle population in London (Office of National Statistics).in finding parking spaces, and the fluctuations in the New
York economy.
IT, European Best Practice in the Delivery of Integrated Transport, 2001
31 WORLD CITIES RESEARCH

2 Background and Context
2.2.69 Car ownership tends to be lower in the city centre where densities
are higher and there are more travel options. For example, just
over half of the households in centre
York do not have access to car (Table 2
2.2.70 The Ville de Paris has retained a
ownership per 1,000 population, comp
France, however, it is still higher than
the high population density, many of t
parked cars. The shortage of car parki
influence on modal choice; residents are reluctant to lose their
parking space and so they walk or use public transport for shorter
o suburban supermarkets
e city. Politicians cannot
most of the spaces are
t commuters and visitors
Table 2.10 – Growth in Car Ownersh
Year Barcelona1 Singapore2
1980 64
1990 102
1995 370 116
2000 452 111Source: 1,4 mu 9)
and Regional Govern 9); 7Fo or.
Table 2.11 - Car Ownership and Ava
Car Ownership Inner
No car households 5
One car households 3
2+ car households 1
Cars per 1,000 residents 2Source: Transport for London 2004
résultants détaillés de l’en
PAGE 32 WORLD CITIES RESEARCH
s of London, Paris and New
.11).
relatively low level of car
ared to the rest of the Ile de
London and New York. With
he streets are dominated by
ng spaces has had a positive
journeys and keep a car for weekly trips t
and weekends when they drive out of th
use parking to control traffic levels as
occupied by residents, and car use amongs
is relatively low.
ip
Paris3 Madrid4 London5 New York6 Tokyo7 Moscow8
338 287 284 412 156 206
360 366 348 484 225
418 431 n/a 444 307 149
450 536 345 n/a 439 250nicipal websites; 2Statistics Singapore (www.singstat.gov.uk) 3Kenworthy and Laube (1995 and 199ment estimate for 2000; 5Transport Statistics for London, TfL (2000); 6Kenworthy and Laube (199undation of Tokyo Transport Safety Association (2004); 8 Recent data supplied by case study auth
ilability
London Ville de Paris New York City
1% 54% 56%
9% 40% 32%
0% 6% 12%
72 288 255; Office for National Statistics Census 2001; DREIF, Les
quête globale de transport 2001-2002; US Census 2000

3 Strategies
3.1 Overview
3.1.1 There is evidence of a shift in policy emphasis from road
construction to travel demand management14. The factors that
have influenced these decisions have varied. For example, in
London, Paris and New York, there is a shortage of available land to
continue building infrastructure, a strong environmental lobby and
widespread awareness that increasing capacity will encourage more
trips by car.
3.1.2 In Singapore, a high capacity road network has been constructed to
ensure the smooth flow of commercial and industrial vehicles15.
There is a strong recognition that current levels of economic
activity and personal wealth would generate significant growth in
private vehicles, if car ownership and usage was unchecked, and
the congestion would adversely affect the national economy.
3.1.3 In Barcelona and Madrid, the impetus is on improving the quality of
life and conserving the architectural heritage to make the cities
more attractive to inward investment and tourism.
14 Travel demand management is often referred to as mobility management in Europe 15 Singapore has five times the length of urban motorway per person as London and four times that of Tokyo
3.1.4 Only Moscow and Tokyo have significant plans to develop more
roads. Moscow arguably has an under-provision of roads and the
city authority wants an outer ring road to reduce through traffic
and open up land for development, even though it accepts that this
will not address the growing problem of congestion caused by the
rapid motorisation and lack of investment in alternatives to the car.
In Tokyo, additional orbital roads form part of a land use strategy
to develop rings of suburban cities that would take the pressure off
the 23 Wards. A similar multi-centric plan has been implemented in
Paris, and whilst it may have been successful in relieving
congestion and crowding in the centre, it has contributed to greater
car use in the suburbs (Table 3.1).
PAGE 33 WORLD CITIES RESEARCH

3 Strategies
Table 3.1 – Evolution in Trip Rates in Paris
1976 1983 1991 2001 Change 1976-2001
Public Transport:
Ville de Paris 1.03 1.09 1.15 1.15 11.7%
Petite Couronne 0.66 0.69 0.69 0.71 7.6%
Grande Couronne 0.49 0.46 0.49 0.44 -10.2%
Private car:
Ville de Paris 0.68 0.72 0.76 0.65 -4.4%
Petite Couronne 1.07 1.28 1.38 1.42 32.7%
Grande Couronne 1.49 1.67 1.98 2.04 36.9%
Note : Trips per person over six years per day. Source: DREIF,
Les résultants détaillés de l’enquête globale de transport 2001-2002.
3.1.5 Three main categories of measures have been implemented in the
cities to manage traffic demand and reduce congestion:
• Land use strategies;
• Improvements to alternative modes; and
• Road user charging.
3.1.6 It is notable that none of the cities have made a significant effort
with ‘soft policies’ such as travel plans and awareness campaigns,
but these figure more in the strategies applied in the small and
medium sized cities in the second stage of the study.
3.1.7 Regulating land use through the location, type, size and density of
development can help to reduce the need to travel, particularly by
car. However, the effectiveness of land use strategies has been
disputed by some, for example, because people’s decisions on
where to live are based on a number of factors beyond proximity to
their workplace, they change jobs and homes at different times,
and land use patterns evolve over a period of years so the impacts
are difficult to monitor.
3.1.8 Investing in the quality and coverage of alternative modes can
encourage modal shift away from the car, particularly if the
strategy includes complementary measures such as physical
restrictions or reallocation of road space to restrict car use, or
congestion provides an effective cap on further traffic growth.
Without these, continued investment is likely to generate
diminishing returns as the comfort and convenience associated with
the car means that it will always be more attractive than public
modes.
PAGE 34 WORLD CITIES RESEARCH
3 Strategies
3.1.9 Taxes on car ownership, fuel duty and parking charges are widely
used to influence car use. Various additional forms of road user
charging have also been applied on strategic routes, but it is only
London and Singapore that have congestion charging schemes in
the city centre.
3.1.10 The following sections describe the transport strategies being
implemented in each of the cities.
3.2 Barcelona
3.2.1 Barcelona has strived to gain identity and independence first within
Spain, and then in Europe through regional economic development.
Over the last 20 years it has become one of the key business
centres and is frequently quoted in the top areas for investment
because of its strategic transport links, attractive environment and
good quality of life. However, like Madrid, the progressive
decentralisation of the population, increase in car ownership and
traffic threatened the very factors that contributed to the city’s
success.
3.2.2 In the late 1990s the focus of the transport policy shifted very
much towards public transport to reduce car dependency in the
suburbs and complementary land use policies to focus new
development in the existing high-density city or at sites served by
rail.
3.2.3 The Metropolitan Transport Authority set objectives to increase the
use of public transport, maximise the economic and social return,
and reduce the car mode share in relation to public transport. Its
targets included:
PAGE 35 WORLD CITIES RESEARCH

3 Strategies
• Extending rail to densely populated areas (>300 inhab/ha)
so that no-one is more that 500m from a metro station and
800m from local train station; and
• Matching the supply and demand for public transport, so
that buses serve corridors with 2500-4000 passengers per
hour, trams are implemented in corridors with 3000-8000
passengers per hour, and metro or rail is provided where
there is higher demand.
3.2.4 These targets are echoed in the Public Transport Infrastructure Plan
(PDI) for 2001-2010 which stresses that rail-based systems are
crucial for the city to function and to ensure international
competitiveness, and that sufficient public transport capacity must
be provided to “guarantee the effectiveness of government
investment”, particularly in pump-priming economic growth.
3.2.5 Investment rose dramatically to about 2% of the regional GDP and
these high levels of spend have been sustained, as shown in the
more recent figures (Table 3.2).
Table 3.2 – Investment & Subsidy (million Euros in 2001)
Investment Roads1 Suburban Rail
Metro & Buses
Investment:
National Government 191 83
Regional government 267 31 50
Motorway concessionnaires 26
Municipalities 37
Investment and subsidy:
Metropolitan Transport Authority2
74 192
Total 521 188 242
Note: 1Spend on roads includes demand management measures such as access control, pedestrianisation and relocating roads in tunnels; 2Cost recovery is reasonably high at 71% for FGC
suburban rail and 79% for TMB (metro and urban bus).
3.2.6 The suburban rail and metro systems were extended and now form
the backbone of the public transport system, supported by the
urban bus network. The fares structure was simplified and the
average price of a journey fell by 4.2% between 2000 and 2003.
New tickets allow free interchange between rail, metro and buses
across the metropolitan area and the number of multi-modal public
transport journeys has risen from 8% to 21% in 2003.
PAGE 36 WORLD CITIES RESEARCH

3 Strategies
3.2.7 Despite the fall in average fares, ticket revenue has risen by more
than 10% pa because of the increase in patronage. Further growth
followed the opening of two tramways in 2004; the 12km Trambaix
connects with the suburbs, and the 4.8km Trambesos (which will
be further extended by 1.7km) supports several urban renewal
projects.
3.2.8 The €7.3bn PDI includes a further 251km of new suburban rail and
metro lines. This includes the new perimeter metro line (L9) to
improve access to development sites, and the Can Cuias and Can
Ruti ‘light metros’ with 230 new stations in areas where residents
have campaigned for better public transport specifically to tackle
traffic growth and pollution.
3.2.9 To balance these ‘carrots’ to encourage drivers to switch mode, the
strategy also contains some policy ‘sticks’ to reduce car use. Five
restricted access zones have been introduced in environmentally
sensitive areas. These have access gates that limit entry to
authorised vehicles (residents, doctors and emergency vehicles)
which are equipped with in-vehicle transponders. Within the zones,
the speed limit is just 10kph and priority is given to pedestrians
and bicycles.
3.2.10 Surveys conducted in the first zone, La Ribera, show that the traffic
entering the zone has fallen by 78% and, despite the lower speed,
the average travel time has dropped by 18%. Residents are
pleased with the scheme and the impacts on the economy are
generally positive, though there has been a change in the types of
businesses located in the zone to those that are less dependent on
car-based customers.
3.2.11 Some 5km of the main arteries have been placed in tunnel in order
to reduce the traffic noise and increase pedestrian space. Other
avenues, such as Avenida Meridiana, Arago Street and Gran Via,
have been narrowed so that road space could be re-allocated to
footways. Across the city, the pedestrianised area has increased
from 97ha in 1995 to close to 110ha, and the amount of green
space has also risen from about 930ha to 990ha.
3.2.12 The city council has been tightening parking controls and reducing
on-street provision to discourage commuters and visitors driving
into the city. It has increased the supply of underground residents’
spaces to make up for the previous shortfall that led to
unnecessary circulatory traffic as drivers searched for a space.
3.2.13 The strategy has been effective in increasing overall public
transport use; patronage on rail-based modes has increased, but
bus use has been falling despite the 35% increase in network
length and investment in new easy access vehicles (Table 3.3).
PAGE 37 WORLD CITIES RESEARCH

3 Strategies
Table 3.3 – Public Transport Patronage (000s)
Source: Transport Indicators, ATM
3.2.14 There is also evidence of modal switch with public transport
increasing almost entirely at the expense of the car (Table 3.4).
There has been an increase in traffic on the ring road, but traffic
levels within the inner city have generally been declining.
Table 3.4 – Modal Share (% of all trips)
Patronage 1992 2004
Suburban rail 116,982 176,680
Metro 272,500 321,365
Bus 200,900 189,800
Total 590,382 687,845
1999 2002
Trips within the inner city:
Public transport 37.8% 39.5%
Car 26.8% 24.5%
Walk 36.4% 36.0%
Trips between suburbs and inner city:
Public transport
31.0% 33.5%
Car 65.1% 62.7%
Walk 3.9% 3.7%
Source: Pacte per a la Mobilitat.
PAGE 38 WORL
D CITIES RESEARCH
3 Strategies
Barriers and Levers
– With the abolition of the Metropolitan Corporation of Barcelona in
1987, there is no longer a single authority responsible for transport
and land use planning and other urban functions within the
metropolitan area. Whilst all the metropolitan cities have undergone
a process of suburbanisation, the lack of ‘joined up thinking’
allowed this to happen rapidly in Barcelona and generate the
transport problems that the strategy sought to address.
– Whilst new suburban developments tend to be located on sites
served by rail, the potential influence on car ownership and modal
choice is undermined by the continued use of generous parking
standards.
– Policy-making is complicated because responsibilities for transport
are split between the regional government (strategic roads, though
the tolled motorways are operated by concessionaires, the FGC
suburban railways and inter-urban buses), national rail operator
RENFE, Metropolitan Transport Authority (public transport),
Metropolitan Entity of Transport (metro and bus), groups of
municipalities (distributor roads), and individual municipalities
(local roads, traffic management and parking, walking and cycling).
– Funding the increase in public transport supply and integrated fares
increased the burden of subsidy. Both public transport authorities
borrowed to meet the growing gap between their funding from the
national, regional and local governments and system operating
costs. They built up debts in excess of €32m which the national
Government eventually agreed to pay off.
+ Despite the political tensions between the Socialist city council and
the more Conservative regional government, there has been
agreement on the need to invest in transport to access the new
development sites and ensure the availability of workers to support
economic development.
+ Funding for capital investment has been available from the
European Union, national Government, public-private partnerships
and local taxation (Barcelona has the highest taxes in Spain).
+ Policies and investment decisions were developed through
negotiation with the public transport authorities and the
municipalities. This process was made easier because the strategy
largely contained positive inducements to encourage modal switch,
and there was already a culture of walking and public transport use.
+ However, the public transport bodies are now calling for more
restraints on car use to reinforce the effects of the public transport
improvements but this is more difficult to reach a consensus on
controversial policies.
PAGE 39 WORLD CITIES RESEARCH

3 Strategies
3.3 London
on was one of the earliest large industrialised cities, and had
hed a population of 6.5 million by the end of the 19th Century.
city continued to expand; but active steps were taken to
ain sprawl through the establishment of the Green Belt.
on’s population reached a peak of about 9 million by the
inning of World War 2, but then declined, with active policies to
urage relocation of jobs to other parts of the country. By
1, the population had fallen to 6.8 million, but this trend has
n reversed and it is now steadily increasing through a
bination of urban in-fill and edge of town development.
Figure 3.1 – Comparative Population Density Patterns
on’s history has given it a unique set of spatial characteristics.
as grown as a relatively low-density, open city compared to
r World Cities. Two-thirds of its land area and the majority of
opulation are in the suburbs (Figure 3.1), whilst jobs are still
entrated in the city centre, so there is strong commuter flow.
re are a number of distinct suburban centres, many of which
back to the original settlements that have become subsumed
in the conurbation, but these have been weakened by out-of-
3.3.1 Lond
reac
The
cont
Lond
beg
enco
198
bee
com
3.3.2 Lond
It h
othe
its p
conc
The
date
with
centre shopping and leisure developments, which has increased
demand for both longer-distance and orbital travel.
PAGE 40 WORLD CITIES RESEARCH

3 Strategies
3.3.3 The economy is dominated by the service sector, including finance
and business services which have increased rapidly over the past
decade and now account for 35% of London’s Gross Value Added
(GVA) and a third of all employee jobs. Much of the growth has
taken place through redevelopment and densification in the City of
London, and there has been significant employment (and
population) growth in the Docklands, which has led to reorientation
of the city eastwards.
3.3.4 A key stimulus to this transformation was the construction of the
Docklands Light Railway (DLR), which provided a rapid and
frequent link between the City, the Isle of Dogs and Stratford.
Commercial developments quickly followed Government
commitment to the construction of the DLR, and then a virtuous
circle was established which saw extensions to Bank station, in the
heart of the City, to Beckton, and subsequently south of the river to
Lewisham. Subsequently, a very much higher capacity link to the
Docklands has been created by the creation of the Jubilee Line
Underground extension, opened in 2000.
3.3.5 Car ownership continued steadily between 1971 and 1991, but
slowed through the 1990s in contrast to other English metropolitan
areas (Table 3.5). This is likely to be associated with the rising cost
of fuel and insurance, and the high cost and limited availability of
parking.
Table 3.5: Car Ownership
1971 1981 1991 1996 2002
Households without car/van (%) 52 46 41 39 38
Household with 1 car or van (%) 40 41 39 44 42
Household with 2 or more cars/vans (%) 8 13 20 17 20
Passenger cars/1000 population (London)
223 284 325 337 345
Passenger cars/1000 population (all English metropolitan areas)
- 230 305 345 415
Source: TfL, DfT
3.3.6 Responsibility for planning and transport has undergone
considerable change in the last 30 years. The Greater London
Council was established in 1974 as a strategic authority; it was
abolished in 1986, and the Greater London Authority (GLA), with an
elected Mayor, was established in 2000. Throughout this period,
other organisations, including the London Boroughs, London
Transport (now part of Transport for London) and central
Government in different forms, have all had varying roles in
steering transport strategy and developing transport projects. The
London Planning Advisory Committee (LPAC) promoted strategic
thinking and the need for demand management, investment in
public transport and walking/cycling, and integrated land use
policies, but it had no delivery mechanism.
PAGE 41 WORLD CITIES RESEARCH

3 Strategies
3.3.7 Given added impetus by terrorist activity in 1992-3, the
Corporation of London implemented a key traffic restraint measure
in the City (the business and financial district). Physical restrictions
on access to the Traffic and Environment Zone were intended to
reduce through-traffic. Within the 4km2 ‘Ring of Steel’ road space
was been re-allocated and signal settings adjusted to favour
pedestrians, cyclists and buses. Following implementation in 1993,
the number of vehicles entering the zone fell by 25%, pedestrian
accidents reduced by 39%, and air pollution fell by 10%. The
scheme has been popular with businesses who have recently
contributed to a westward extension.
3.3.8 The establishment of Transport for London (TfL) and creation of a
single body responsible for public transport and the 580km network
of main roads and all of London's 4,600 traffic lights provided an
opportunity for addressing transport problems and implementing
further restraint, in cooperation with the Boroughs who are
responsible for local road schemes, walking and cycling
improvements, and other initiatives. TfL has some influence on
local policy through its funding powers and between 2000-2004, TfL
spent £450m on Borough-led projects including road renewal,
safety improvements, and bus priority measures.
3.3.9 Transport issues have fed into the development of the London Plan,
a spatial strategy that envisages significant growth in population
and jobs with a focus on the regeneration of the east of London and
existing suburban centres. However, local planning decisions, local
roads and parking policies are the responsibility of the 32 Boroughs
and the Corporation of London (in the City of London). Each Council
is controlled by elected councillors representing wards within the
borough who make decisions on policies and funding using income
from central government, TfL and Council Tax on residents.
3.3.10 Over the past 10 years there have been extensions to the
Underground, investment in light rail and two tramways. Since
2000, the Mayor’s Transport Strategy has delivered significant
improvements in buses, including new routes, new vehicles, higher
frequencies and better reliability, as illustrated by the 34% rise in
service-kilometres operated in Table 3.6. In addition, fares have
been lowered and simplified, new types of tickets have been
introduced, including the Oyster Card, a pre-paid smart card that
can be used on buses and Underground, and cashless operation has
been implemented in central London which has improved boarding
times.
3.3.11 Service kilometres on the Underground have also increased (by
22%), but there are still concerns about crowding and issues about
reliability on Underground and mainline rail services. For example:
PAGE 42 WORLD CITIES RESEARCH

3 Strategies
• Underground - scheduled kilometers operated has fallen
from 95% in 1990/91 to 93.1 in 2003/0416 (Figure 3.2);
and
• Rail – trains arriving on time (ie within 10 minutes of their
timetabled arrival time at the final destination) has fallen
from 89.6% in 1997/98 to 80.5% in 2003/0417.
3.3.12 The Underground has been part-privatised through an innovative
Public Private Partnership (PPP) with three private sector companies
which will see an important injection of funding into maintenance
and renewal of the assets amounting to £16bn in the first 15 years,
while TfL retains responsibility for managing and operating train
services.
3.3.13 There have been further restrictions on stopping and parking along
main roads (red routes) and increases in parking charges and
residents’ only parking provision across London. These measures
have helped to free up road capacity, facilitate the implementation
of 250km of bus lanes and deter car use amongst commuters and
visitors. However, the roads are still heavily congested and traffic
speeds were falling, prior to the introduction of the congestion
charging zone (Table 3.7).
16 TfL London Travel Report 2004 17 SRA National Rail Trends 2004/05 Q2. Data for all services run by London and South East operators.
Table 3.6 - Bus and Underground Statistics
Underground Bus
Year Passenger kms (m)
Passenger journeys
(m)
Train kms (m)
Passenger kms (m)
Passenger journeys
(m)
Bus kms operated
(m)
1971 5,158 654 50 4,678 1,480 314
1981 4,088 541 50 4,039 1,080 275
91/92 5,895 751 53 3,996 1,149 296
95/96 6,337 784 57 4,018 1198 326
01/02 7,451 953 65 5,128 1,430 373
03/04 7,340 948 68 6,431 1,702 437
Source: TfL, 2004
Figure 3.2 – Proportion of Scheduled Kilometres Operated
Source: TfL, London Travel Report 2004
PAGE 43 WORLD CITIES RESEARCH

3 Strategies
Table 3.7 – Morning Peak Average Traffic Speeds (mph)
3.3.14 Throughout the 1990s ideas for road user charging were
researched and developed, but with little tangible commitment to
implementation. However, in 1998 the newly elected Labour
Government set in place changes to the legislation that would allow
charging and the Mayor implemented the congestion scheme
covering most of Central London in February 2003. It was
important that the benefits be visible in the first term of office and
so the Mayor’s Transport Strategy was rapidly developed to provide
a strategic rationale for the scheme, in the absence of powers over
the Underground or rail services. The strategy held Underground
fares at inflation and froze bus fares (so they reduced in real terms)
to encourage modal shift and the quality of bus provision and scope
was improved, with some improvements in provision for walking
and cycling.
Morning Peak Period
Central Area Rest of Inner Area
Outer Area
1977-1982 12.2 14.1 19.2
1983-1990 11.7 12.7 18.6
1990-1997 10.6 13.3 17.2
1997-2000 10.0 12.0 18.2
2000-2002 9.9 11.6 16.9
2003-2004 10.6 11.7 n/a
Source: TfL London Travel Trends 2004
3.3.15 The scheme has been successful in reducing traffic by 15% and
delays by around 30% inside the zone. This has led to a 20% fall in
traffic-related CO2 emissions and 20% less fuel consumption.
3.3.16 Some 50-60% of the former car users have transferred to public
transport. There has been some switching between mainline rail,
Underground and bus to accommodate the increased demand, but
there is crowding on the rail-based modes in the peak periods. 20-
30% continue to drive but divert around the zone, though there has
been little or no adverse effect on the roads immediately outside
the zone. The remaining 15-25% have adapted their travel
patterns, for example, by changing the time of travel.
3.3.17 The charging scheme, along with bus priority measures, additional
policing of bus lanes and introduction of Quality Incentive Contracts
that reward operators for good performance have increased bus
service levels and reliability. Scheduled kilometers operated has
risen from 97.3% in 1990/91 to 98.9% in 2003/04, the average
wait for high frequency services has reduced and the proportion of
PAGE 44 WORLD CITIES RESEARCH

3 Strategies
low frequency service arriving on time has increased from 62.9% to
74.6% over the same period. As a result, London Buses now carry
1.7billion passengers – the highest number since 1968. In light of
these benefits, there has been a public consultation into proposals
to extend the zone westwards, to embrace adjacent congested
areas such as Knightsbridge and Kensington.
3.3.18 There have also been notable results from work with the Boroughs;
for example, the London Cycling Action Plan has included a range of
measures to improve conditions for cyclists, such as cycle parking
at stations, at schools and free training, and cycling has
subsequently increased by 23% in just a year (May/June 2003 to
same time 2004).
Barriers and Levers:
– For a long time there was no long-term integrated transport and land use strategy in London and, until recently, there has been no single authority responsible for delivering improvements in an integrated context.
– Major projects were conceived and implemented by London Transport, including the Jubilee Line extension, DLR extensions and Croydon Tramlink, and whilst there has been some integrated land use development, these policies were not placed
in a broader, multi-modal context, particularly with regard to wider issues of managing the demand for road space18.
– Through the 80s and particularly the 90s, funding of the Underground was not sufficient to renew and maintain its infrastructure to acceptable standards, and bus service quality has steadily deteriorated as traffic congestion eroded reliability.
– TfL, SRA and the relevant Train Operating Companies have been attempting to simplify service patterns and make other changes that will enable the south London rail network to be presented as a ‘metro-style’ service, but institutional, funding and infrastructure constraints have hampered progress.
– Fares are high; they rose particularly steeply during the early 1990s, as the then Government shifted more of the costs of public transport from Government to passengers. The relative rise in the cost of using different modes created a powerful economic mechanism favouring car use over public transport.
– London is unusual amongst other cities in that a high proportion of local government spending is raised and determined nationally rather than locally. For example, TfL’s total budget at the start of 2003/04 was £4,354 million of which passenger revenue is 51%, Government grants 48% and other local revenue is 1%.
18 With the exception of Docklands development, which because of access problems was always predicated on the need to establish and maintain very high public transport mode shares for work journeys.
PAGE 45 WORLD CITIES RESEARCH

3 Strategies
+ The election of a mayor with strong views on the need to manage traffic and the creation of TfL to deliver his strategy have given London a powerful, integrated institutional structure.
+ One of the first moves of the newly elected Mayor was to reduce bus fares; this was partly to facilitate other measures intended to facilitate fares simplification and hence improve operational efficiency, but was also a response to the perception that bus fares had become too high.
+ The congestion charge has been effective in reducing car use and encouraging a switch to public transport, and appears to have had no adverse effect on the economy, though analysis has been complicated by other parallel influences such as the Iraq war and Central Line disruptions.
+ The bus network has been substantially expanded and London now has the world’s largest fleet of accessible buses – more than 93% of London’s 8,000 buses are modern, low floor and wheelchair-accessible. Service levels are higher than at any time since 1957 and 90% of all London’s households are now within 400 metres of a bus service. More people are now choosing to travel by bus than at any time since 1968.
+ Ticketing improvements have made using public transport more attractive, convenient and affordable. The Oyster Card combined season ticket and pre-paid pay-as-you-go ticket is now the largest smartcard programme in Europe and take-up is increasing daily. It is speeding up Tube and bus journeys by
making ticket purchase easier and reducing time spent boarding buses.
3.4 Madrid
3.4.1 Historic planning policies have generated a high population density
and mixed land use pattern in the centre of Madrid and focused
new development along the main radial corridors (particularly along
the north west/south east axes) that are well-served by public
transport. However, between 1970 and 1985, both the population
and the supply of public transport were increasing, but total
patronage fell by about 20%, mainly because of poor co-ordination
between the rail, metro and bus systems, lack of investment in new
fleets and interchange penalties. The development of low density
housing and science parks in the suburbs and continuing use of
minimum parking standards19 contributed to further increases in
car ownership, car use and congestion that threatened continued
economic growth.
19 The General Urban Plan (1997) requires one parking space for each new house or 100m2 of housing, and each 100m2 of land developed for industrial use. Rates for offices and recreational developments vary according to location; one space per 100m2 of built area inside the city and 1.5 spaces outside the M-30 ring road.
PAGE 46 WORLD CITIES RESEARCH

3 Strategies
3.4.2 The regional government adopted ‘maintaining public transport
patronage’ and ‘controlling suburbanisation’ as key objectives and
developed a transport strategy with the national Government and
municipal authorities, including the City Council. Following the
completion of three dual carriageway ring roads, policies have
focused on increasing public transport provision to offer motorists a
greater choice of travel with some efforts to manage traffic demand
through tolls on the radial and orbital autoroutes, two sections of
HOV lanes and traffic restraint within the city. These include
parking restrictions, pedestrianisation and other improvements to
walking and cycling facilities to maintain the cultural and
architectural heritage and support the growing tourist industry.
3.4.3 Through the 90s, the national Government invested in the
electrification of the 12 radial cercanias (suburban) lines and rolling
stock renewal that have improved punctuality (the proportion of
trains arriving within 5 minutes of their scheduled time) from 92%
to 99%. Park and ride sites have been built at suburban rail
stations20.
3.4.4 The regional government extended the metro system; 115km have
been added in the last 10 years at a cost of €3.7 bn (£3.1 bn) and
a further 73km is planned for completion by 2007. Trains have
been replaced and the average age is just 10.9 years, and about
20 There is capacity for over 17,000 cars, with 300-500 spaces at each site
half of the 236 stations have been retro-fitted with lifts to improve
access to the platforms. The complementary urban bus network,
run by the municipal operator, has also been extended by more
than 10%, stops have been upgraded and most of the fleet is now
low-floor with an average age of less than five years.
3.4.5 The typical annual spend on metro and urban bus is shown in Table
3.8. This approximates to £180 per head21.
Table 3.8 - Spend on Metro and Urban Bus (€million/year)
Body Investment Subsidy Subsidy/ operating cost
MINTRA – all modes 592.11
Consorcio
Metro and urban bus
159.62
335.83
45%
Note: 1Average spend 2000-2003; 2Average spend 1997-2002; 3Support in 2002. Source: Urban Mobility Observatory,
Ministry of Environment (2004) and Consorcio de Transportes (2003). 3.4.6 The region set up the Consorcio de Transportes de Madrid to plan
and manage public transport. The Consorcio devised a zonal fare
system in 1987, lowered metro fares to create a common tariff
within the city (a single is about €1) and introduced the Abono
Transportes, an unlimited monthly or yearly travel pass that
permits interchange between cercanias, metro and buses. These
21 Using the population of the city plus the surrounding metropolitan ring in 2002.
PAGE 47 WORLD CITIES RESEARCH

3 Strategies
measures made public transport easier to use and much cheaper
for increasingly disparate journeys in the suburbs and successfully
reversed the trend of declining public transport use. Patronage has
since increased by 61% (Table 3.9).
Table 3.9 – Public Transport Demand (millions)
Trips Pass-kms
Year 1986 2002 1986 2002
Metro 329.0 565.0 1,875.3 3,162.0
Urban buses 387.3 412.0 1,755.0 1,674.4
Cercanias 59.7 193.3 890.2 3,450.4
Regional buses 116.5 266.1 1,125.4 4,445.6
Total 892.5 1,436.4 5,645.9 12,732.4
% increase 61% 125%Source: Consorcio de Madrid
3.4.7 Traffic levels have fluctuated; generally declining in the inner city,
but rising in the suburbs where ad-hoc decisions are still being
made on development proposals, though the municipalities are now
negotiating for contributions to transport improvements.
3.4.8 In the city centre, the main commercial and tourist areas have
been pedestrianised and the City Council has launched an
ambitious Accessibility Plan to reclaim more space for walking –
including a 1.5km link between the Royal Palace and the Prado
Gallery. There are also traffic calming schemes in inner city
neighbourhoods where pavements are being widened, and on-
street parking is being converted to residents-only use and re-
located underground.
Barriers and Levers
– The investment in public transport has helped to off-set the full impacts of the demographic and economic trends, but it is difficult to see how this level of spend can be sustained in the absence of more effective forms of restraint either on suburbanisation or car use.
– The regional government has a spatial planning strategy, but little has been done to contain sprawl, particularly through the late 80s and 90s when economic prosperity intensified the pressure for development.
– The rail extensions have improved travel choices in existing suburban areas, but the investment could have been more effective if new developments had been focused around stations, rather than in low density housing estates and science parks.
– Travel patterns are becoming increasingly complex and difficult to accommodate with conventional public transport.
PAGE 48 WORLD CITIES RESEARCH
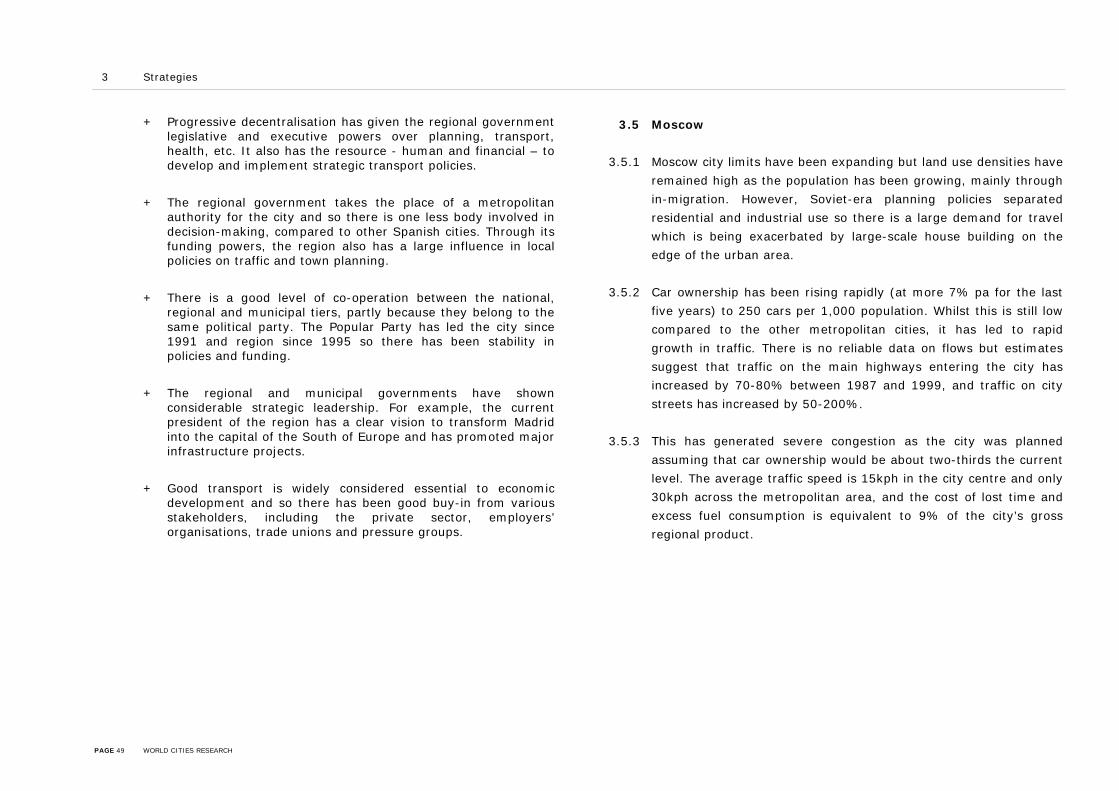
3 Strategies
+ Progressive decentralisation has given the regional government legislative and executive powers over planning, transport, health, etc. It also has the resource - human and financial – to develop and implement strategic transport policies.
+ The regional government takes the place of a metropolitan authority for the city and so there is one less body involved in decision-making, compared to other Spanish cities. Through its funding powers, the region also has a large influence in local policies on traffic and town planning.
+ There is a good level of co-operation between the national, regional and municipal tiers, partly because they belong to the same political party. The Popular Party has led the city since 1991 and region since 1995 so there has been stability in policies and funding.
+ The regional and municipal governments have shown considerable strategic leadership. For example, the current president of the region has a clear vision to transform Madrid into the capital of the South of Europe and has promoted major infrastructure projects.
+ Good transport is widely considered essential to economic development and so there has been good buy-in from various stakeholders, including the private sector, employers’ organisations, trade unions and pressure groups.
3.5 Moscow
3.5.1 Moscow city limits have been expanding but land use densities have
remained high as the population has been growing, mainly through
in-migration. However, Soviet-era planning policies separated
residential and industrial use so there is a large demand for travel
which is being exacerbated by large-scale house building on the
edge of the urban area.
3.5.2 Car ownership has been rising rapidly (at more 7% pa for the last
five years) to 250 cars per 1,000 population. Whilst this is still low
compared to the other metropolitan cities, it has led to rapid
growth in traffic. There is no reliable data on flows but estimates
suggest that traffic on the main highways entering the city has
increased by 70-80% between 1987 and 1999, and traffic on city
streets has increased by 50-200%.
3.5.3 This has generated severe congestion as the city was planned
assuming that car ownership would be about two-thirds the current
level. The average traffic speed is 15kph in the city centre and only
30kph across the metropolitan area, and the cost of lost time and
excess fuel consumption is equivalent to 9% of the city’s gross
regional product.
PAGE 49 WORLD CITIES RESEARCH

3 Strategies
3.5.4 There is also very poor air quality because of take-up of older
imported cars and a worsening safety record because of poor driver
training and inadequate traffic management (Figure 3.3). The
number of deaths per 100,000 people is 1.5 times higher than the
next highest city in our sample, New York.
Figure 3.3 - Comparative Road Safety
8 .0 2
10 .9 2
17 .4 5
17 .7 8
19 .9 3
2 3 .8 0
3 0 .9 4
5 4 .9 3
0 10 20 30 40 50 60
London
New York
Tokyo
Madrid
Paris
Singapore
Barcelona
Moscow
Cit
y
Deaths / 1,000,000,000 vehicle km
PAGE 50 WORLD CITIES RESEARCH
Source: Kenworthy and Laube, 2001
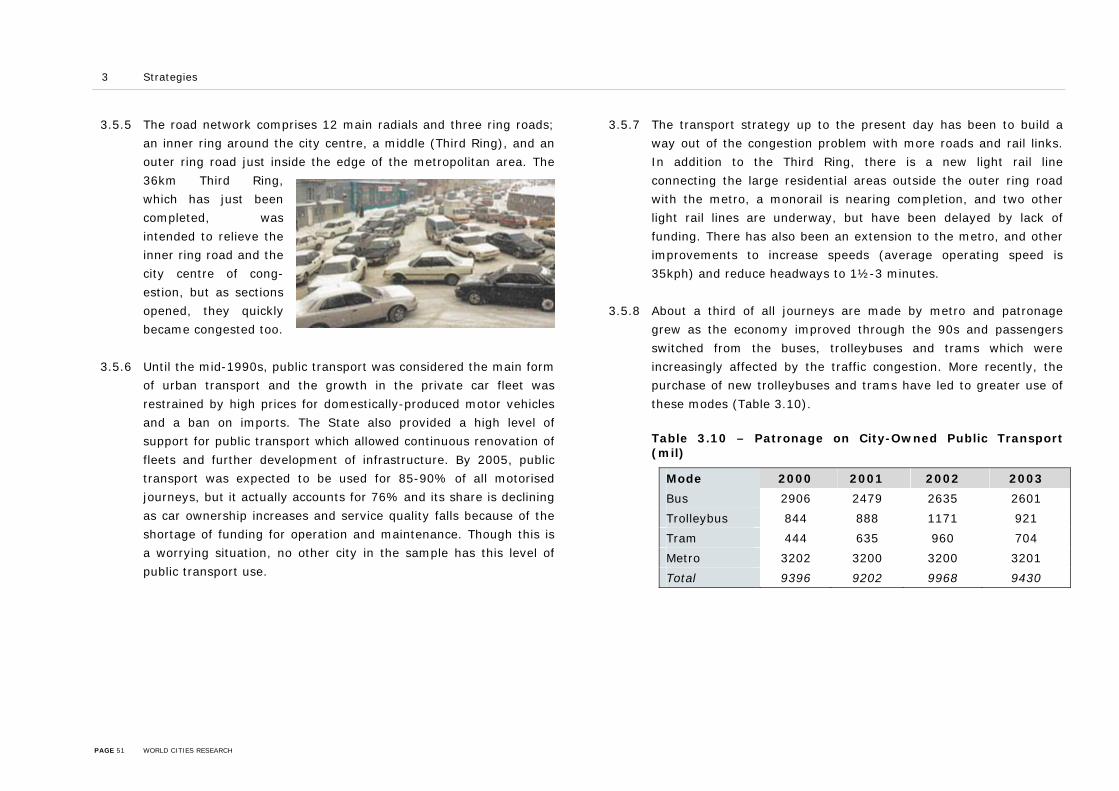
3 Strategies
3.5.5 The road network comprises 12 main radials and three ring roads;
an inner ring around the city centre, a middle (Third Ring), and an
outer ring road just inside the edge of the metropolitan area. The
36km Third Ring,
which has just been
completed, was
intended to relieve the
inner ring road and the
city centre of cong-
estion, but as sections
opened, they quickly
became congested too.
3.5.6 Until the mid-1990s, public transport was considered the main form
of urban transport and the growth in the private car fleet was
restrained by high prices for domestically-produced motor vehicles
and a ban on imports. The State also provided a high level of
support for public transport which allowed continuous renovation of
fleets and further development of infrastructure. By 2005, public
transport was expected to be used for 85-90% of all motorised
journeys, but it actually accounts for 76% and its share is declining
as car ownership increases and service quality falls because of the
shortage of funding for operation and maintenance. Though this is
a worrying situation, no other city in the sample has this level of
public transport use.
3.5.7 The transport strategy up to the present day has been to build a
way out of the congestion problem with more roads and rail links.
In addition to the Third Ring, there is a new light rail line
connecting the large residential areas outside the outer ring road
with the metro, a monorail is nearing completion, and two other
light rail lines are underway, but have been delayed by lack of
funding. There has also been an extension to the metro, and other
improvements to increase speeds (average operating speed is
35kph) and reduce headways to 1½-3 minutes.
3.5.8 About a third of all journeys are made by metro and patronage
grew as the economy improved through the 90s and passengers
switched from the buses, trolleybuses and trams which were
increasingly affected by the traffic congestion. More recently, the
purchase of new trolleybuses and trams have led to greater use of
these modes (Table 3.10).
Table 3.10 – Patronage on City-Owned Public Transport (mil)
Mode 2000 2001 2002 2003
Bus 2906 2479 2635 2601
Trolleybus 844 888 1171 921
Tram 444 635 960 704
Metro 3202 3200 3200 3201
Total 9396 9202 9968 9430
PAGE 51 WORLD CITIES RESEARCH

3 Strategies
3.5.9 Traffic management measures have sought to create additional
capacity to accommodate the growing traffic levels and there are
no plans to re-allocate this to bus lanes. Measures have included a
centralised control system that co-ordinates signal settings (START)
at 122 key intersections, which has increased road capacity by
about 12% and a permit scheme to restrict HGVs entering the city
during the day. A further 15% capacity gain is expected from the
conversion of the inner ring road and other key routes to a one-way
operation, which is currently underway.
3.5.10 There are plans for a 3km tunnel link from the Third Ring to the city
centre and a fourth ring road to start construction in 2007.
However, there is an increasing awareness that this approach will
not succeed, and that more attention must be directed to reducing
the demand through traffic restraint measures and better utilisation
of existing resources with traffic management schemes and surface
transit priority measures. Among the many problems in this
approach is the lack of legislation for parking enforcement in the
centre.
Barriers and Levers
– Policy is largely the responsibility of the city government, but transport is covered by the Transport and Communications Department, planning falls under the Department of City-Planning Policy, Reconstruction and Development, air quality
under the Department of Natural Resources and Environment, while traffic management and safety are covered by the Moscow Division of the State Traffic Safety Inspection. As a result there is no integrated strategy; infrastructure, public transport improvements and traffic management are considered in isolation and detailed in separate policy documents.
– After the collapse of the USSR in 1991, the State transferred responsibility for urban public transport to local authorities. With the economic problems, Moscow’s heavily subsidised public transport systems received insufficient funding for operation and maintenance.
– Fares have increased to make up for some of the deficit, but quality and service levels on surface modes have declined. Many people qualified for fares exemptions (as a privilege or a form of social services support) and with ineffective fare collection methods, only 38% of passengers pay for a ticket. New legislation introduced this year has now reduced the number of exemptions.
– The metro has improved and a light rail line has opened and is well used but they have made little impact on traffic levels. Restrictions on cars access to the city centre are a highly controversial topic and would require changes to be made to the State legislation which are extremely difficult in the current political climate.
PAGE 52 WORLD CITIES RESEARCH

3 Strategies
– There has been some increase in road capacity through traffic management, but there is potential for making significant improvements in circulation and influencing travel demand through parking policies. Currently drivers can park on-street at no charge and the legislation does not allow vehicles to be removed.
+ There is a culture of public transport use and whilst the public transport modal share is falling, it is still high compared to other metropolitan cities. The economic constraints have prevented large-scale road building and there is a growing awareness of Western experience in tackling congestion and an acknowledgement of the importance of managing traffic demand.
3.6 New York
3.6.1 Whilst some of the metropolitan cities have needed to invest in
public transport to meet the needs of their expanding built-up
areas, New York City already had the necessary infrastructure in
place, but years of neglect had led to a gradual decline in reliability
and service quality. By the 1980s it was clear that the capacity of
the tunnels and bridges
approaching Manhattan and
the congestion on the city’s
streets effectively limited
further traffic growth, and
the only way the economy
could continue to grow would
be by increasing access to
jobs using public transport.
3.6.2 In 1982, the metropolitan authorities developed a consensus to
“save public transport” by restoring the decrepit track, rolling stock
and much of the behind the scenes infrastructure such as signals
and the power system. Over the last 10 years, this restoration work
has continued and there has been more ‘visible’ investment in
replacing fleets, increasing capacity, modernizing stations and
introducing the MetroCard in 1996. This is a 1, 7 or 30-day multi-
PAGE 53 WORLD CITIES RESEARCH

3 Strategies
ride ticket, similar to the Oyster card in London, which allows free
interchange between bus and subway services within two hours22.
3.6.3 In all the Metropolitan Transport Authority has invested US$48
billion (£25 bn) in capital funds in restoring and upgrading the
public transport, including refurbishing 356 railroad and subway
stations and modernising/replacing train and bus fleets which also
contributed to a decline in crime, along with the zero-tolerance
approach to graffiti which has increased people’s sense of security
on the system and contributed to patronage growth. On-time
performance has increased from 85% to 93.1% on the Long Island
Rail Road and from 80.5% to 97.5% on the Metro-North Railroad.
The mean distance between failures on the subway has increased
continuously, from 7,000 to nearly 140,000 miles.
3.6.4 The investment has been successful in increasing the use of the
public transport systems and supporting economic growth; an extra
400,000 jobs have been created in the CBD. Between 1992-2000,
railroad patronage grew by 28% and bus and subway patronage by
44%23 and there is now severe crowding in the peaks.
e has not been
as hi
mak
there have been
prici
22 Interchange penalties apply to cash fares 23 Scanlon and Seeley (2004) At Capacity: The Need for More Rail Access to the
Manhattan CBD; Rudin Center for Transportation Policy and Management
3.6.5 Subway passenger kilometers increased sharply after 1996 on the
strength of the economic boom and the introduction of the
MetroCard (Figure 3.4).
3.6.6 By 2001 bus and subway patronage reached 2.1bn pa – the highest
level since 1970. Then the economy suffered following 9/11 and
fares were increased after an eight year freeze. In 2003, ridership
y nearly 5% on buses and just under 1% on the subway. As
many of the remaining users shifted to Metrocards which offer
volume discounts, the subsequent growth in revenu
gh as expected and further fares increases may be needed to
e up for the growing operating deficit.
fell b
3.6.7 Alongside the improvements in public transport,
ng and traffic management measures to improve the efficiency
of the road network and calm traffic in residential areas.
Figure 3.4 - Passenger Kilometres Per Annum by Public Transport
0
2,000
4,000
6,000
12,000
1990
1991
1992
1993
1994
1995
1996
1997
1998
1999
mil
lio
ns
8,000
10,000
14,000
NY City andussuburban B
NY and NJSubway
NY and NJUrban Rail
Note: Figures for the New York Metropolitan Transportation Council area, which
covers 2,440 square miles ie 11 of the 19 million people that live in the metropolitan area, provide the best comparator for Greater London
PAGE 54 WORLD CITIES RESEARCH

3 Strategies
3.6.8 In 2001, the Port Authority of New York and New Jersey (PANYNJ)
introduced ‘value pricing’ on the two tunnels and four bridges
between New York and New Jersey. The scheme aimed to reduce
congestion by encouraging public transport use and greater take-up
of the E-ZPass (electronic payment system) that would speed up
toll collection.
3.6.9 The tolls varied according to the crossing and time of day;
crossings with worst congestion and most public transport options
were more expensive than those with spare capacity and few
alternate modes, and discounts were available for off-peak
(9:00am-4:00pm, 7:00pm-midnight) and night-time (midnight-
6:00am) use. The typical toll for a passenger car, for example, was
increased from $4.00 cash ($3.40 with E-ZPass) to $7.00, but there
was significant public opposition and so this was reduced to $6.00
cash ($5.00 in the peak and $4.00 off-peak with E-ZPass). An
additional $1.00 discount on E-ZPass trips is available for car-
poolers with 3 or more occupants.
3.6.10 The morning peak period has been spreading, and the initial data
suggests that the differential tolls have been successful in
encouraging some further shift from peak to off-peak periods.
Coupled with the take-up of E-ZPass, the shift has improved
journey times as the typical queue into Manhattan Island has
dropped from 3 minutes (in 1996) to only 20 seconds, despite a
13% increase in traffic.
3.6.11 However, neither the public transport improvements nor the value
pricing have had any real impact on modal shares. Some 11% of
journeys to work in Manhattan are made by car and 59% by public
transport (Table 3.11), compared to 13% and 79% into Central
London
Table 3.11 - Mode Share for Journeys to Work in Manhattan
Mode 1990 2000
Drive Alone 8% 8%
Car Pool 4% 3%
Public Transport 58% 59%
Walk 23% 22%
Other Means 2% 2%
Worked at Home 5% 6%
Source: New York Transportation Statistics 2000
3.6.12 The reactions to the increases in public transport fares and tolls
originally proposed for value pricing suggest that New Yorkers
would be responsive to congestion charging policies. However,
there is limited potential for accommodating more passengers on
public transport in the short-term and there is no lead politician to
implement a balanced transport strategy to reduce car use across
the city and its immediate environs. Instead, less controversial
PAGE 55 WORLD CITIES RESEARCH

3 Strategies
traffic management measures have had positive local impacts and
are being pursued further.
Barriers and Levers:
– The New York Metropolitan Transportation Council (NYMTC) provides a collaborative planning forum to address transportation issues and makes decisions on the use of federal funds, but it only covers 2,440 square miles ie 11 of the 19 million people that live in the metropolitan area.
– The area covered by the Council is the least car dependent urban area in the US largely because of the high land use density. Outside the Council area, the low density ‘spread city’ cannot be cost-effectively served by public transport and distances are too long to walk or cycle.
– The Metropolitan Transport Authority has responsibility for public transport and toll bridges and tunnels serving New York City. The managing board comprises members nominated by the State Governor and mayor of New York City and representatives from union and passenger bodies with no clear leader or political clout.
– The policies have been implemented in isolation; the fare and toll increases faced massive public resistance, unlike Singapore, for example, where congestion charges were accepted because they were sold as a part of package of measures.
– There has been little feedback on changes to proposed policies and the impacts of the transport improvements. The groups that had opposed the value pricing have taken this to mean that their concerns will never be addressed.
+ The MTA receives funding from the State and is able to shield the operating companies from public or political debates about the benefits of subways over buses or transport over other city functions such as police and fire services.
+ Key stakeholders were involved early in the planning of the value pricing initiative which helped to fine-tune the proposal and engender support which was important because of the public adversity.
PAGE 56 WORLD CITIES RESEARCH

3 Strategies
3.7 Paris
3.7.1 The population of the Ile-de-France has been stable for the past
two decades, but there has been a continuous decentralisation of
people and jobs to the outer parts of the region (Table 3.12). Car
ownership in the Ville de Paris (inside the Périphérique) was already
high at about 288 cars per 1,000 population (compared to Inner
London 272 and New York City 255) and this has remained
constant, whilst car ownership in the suburbs has grown.
Table 3.12 – Ile de France Population
1982 1990 1999 Change 1982-1999
Change 1990-1999
Ville de Paris
2,176,243 2,152,423 2,125,246 -2.3% -1.3%
Petite Couronne
3,909,995 3,988,393 4,038,992 +3.3% +1.3%
Grande Couronne
3,991,821 4,519,738 4,787,773 +19.9% +5.9%
Ile-de-France
10,073,059 10,660,554 10,952,011 +8.7% +2.7%
Source: DREIF, Les résultants détaillés de l’enquête globale de transport 2001-2002.
3.7.2 These factors have contributed to a decline in trips and hence
traffic in the Ville de Paris which has been reinforced by certain
policy measures. These have tended to concern traffic calming to
improve the quality of the local environment and encourage
residents to stay, rather than charging or restrictions on car use
which could be unpopular and hasten further decentralisation. The
latest monitoring data shows that total vehicle flows fell by 3%
between 2001 and 2002, and this is likely to continue with
proposals to restrict through traffic using traffic management and
access controls which are being developed by the Mayor.
3.7.3 There has been a corresponding rise in traffic in the surrounding
suburbs (Petite Couronne) and a significant rise on the outskirts
(Grande Couronne), as shown in Figure 3.5 (overleaf). This has
shifted the focus of policies and spending to reflect the concerns
about the growing problem in the suburbs which has led to tensions
between the bodies responsible for transport. STIF, the
Government-led public transport authority, will become a regional
body in July 2005 and this is expected to further tip the balance
towards transport improvements in the suburbs.
PAGE 57 WORLD CITIES RESEARCH
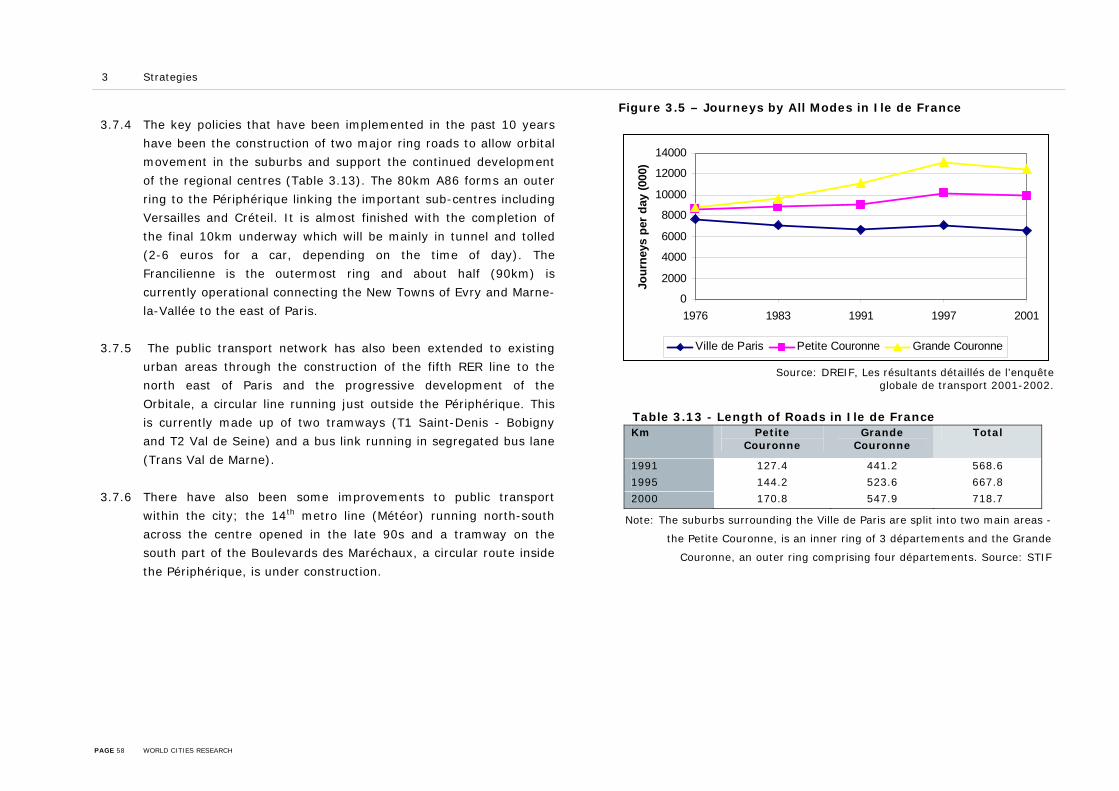
3
Figure 3.5 – Journeys by All Modes in Ile de France 3
0
2000
4000
6000
8000
10000
12000
14000
1976 1983 1991 1997 2001
Jour
neys
per
day
(000
)
Ville de Paris Petite Couronne Grande Couronne3
Source: DREIF, Les résultants détaillés de l’enquête globale de transport 2001-2002.
3
Table 3.13 - Length of Roads in Ile de France Km Petite
Couronne Grande
Couronne Total
1991 127.4 441.2 568.6
1995 144.2 523.6 667.8
2000 170.8 547.9 718.7
PAG
Strategies
.7.4 The key policies that have been implemented in the past 10 years
have been the construction of two major ring roads to allow orbital
movement in the suburbs and support the continued development
of the regional centres (Table 3.13). The 80km A86 forms an outer
ring to the Périphérique linking the important sub-centres including
Versailles and Créteil. It is almost finished with the completion of
the final 10km underway which will be mainly in tunnel and tolled
(2-6 euros for a car, depending on the time of day). The
Francilienne is the outermost ring and about half (90km) is
currently operational connecting the New Towns of Evry and Marne-
la-Vallée to the east of Paris.
.7.5 The public transport network has also been extended to existing
urban areas through the construction of the fifth RER line to the
north east of Paris and the progressive development of the
Orbitale, a circular line running just outside the Périphérique. This
is currently made up of two tramways (T1 Saint-Denis - Bobigny
and T2 Val de Seine) and a bus link running in segregated bus lane
(Trans Val de Marne).
.7.6 There have also been some improvements to public transport
within the city; the 14th metro line (Météor) running north-south
across the centre opened in the late 90s and a tramway on the
south part of the Boulevards des Maréchaux, a circular route inside
the Périphérique, is under construction.
Note: The suburbs surrounding the Ville de Paris are split into two main areas -
the Petite Couronne, is an inner ring of 3 départements and the Grande
Couronne, an outer ring comprising four départements. Source: STIF
E 58 WORLD CITIES RESEARCH

3 Strategies
3.7.7 There has been a massive reorganisation of bus services to create a
‘trunk network’ across the Ile de France region made up of 70
strategic routes that complement the rail and tram services.
Timetables have been revised on the second tier of routes that feed
the rail stations. In total over 730km of routes have been improved
with a variety of measures including bus priority, re-allocation of
road space to create bus lanes, higher frequencies and real time
information. The priority measures have helped to improve bus
speeds and there has been an increase in patronage, particularly in
the suburbs (Table 3.14).
Table 3.14 - Passenger Kilometres (millions) by Mode Year Regional
Trains Metro Trams Bus -
Paris Bus -
Suburbs Total
1990 13,780 5,883 - 751 - -
1995 11,779 4,960 39 724 2,583 20,085
2000 13,699 6,011 125 846 3,075 23,756
2001 13,870 6,081 129 832 - -
Source: STIF (2002) Les transports en Ile de France, édition 2001. Memento de statistiques pg.17
3.7.8 Further increases in patronage have been achieved through the
changes in ticketing including the introduction of the Carte Orange
(monthly ticket) in 1991 and a single ticket allowing travel on
metro, suburban rail and RER in 1995. The Carte Orange has
significantly reduced the cost of commuting as employers pay half
the cost of the ticket for their employees. The ticket will soon be
converted to a Navigo pass, which is similar to an Oyster Pass in
London.
3.7.9 Employers also contribute to the financing of public transport
through the ‘Versement transport’. This is a tax levied on public
and private sector organisations with more than 9 employees which
varies according to the size of the city24 and the salaries paid. The
Versement transport makes up over a third of the STIF’s income
and goes towards operating costs and investment (Tables 3.15 &
3.16).
24 Maximum rates for the VT are defined by law; the applied rates are then determined by the local authorities. In the Ile-de-France, the rates are 2.6% in Paris and Hauts-de-Seine, 1.7% in Seine-Saint-Denis and Val-de-Marne and 1.4% in the Grande Couronne.
PAGE 59 WORLD CITIES RESEARCH
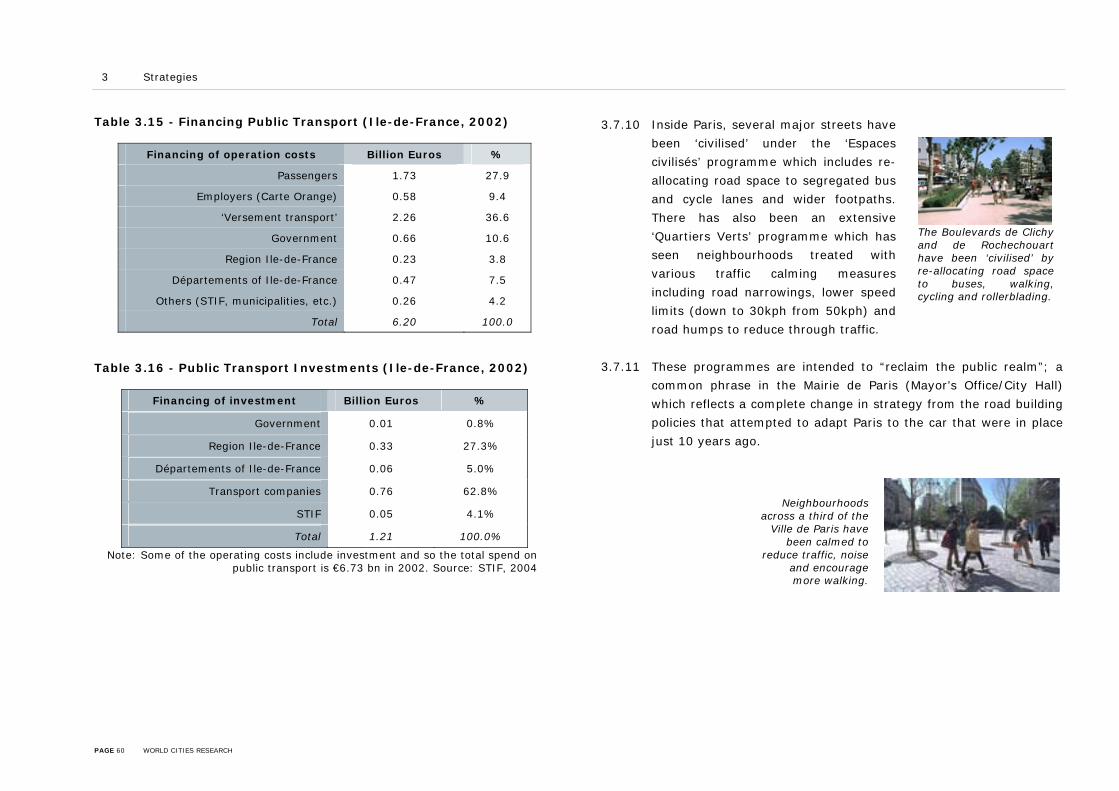
3 Strategies
Table 3.15 - Financing Public Transport (Ile-de-France, 2002)
Financing of operation costs Billion Euros %
Passengers 1.73 27.9
Employers (Carte Orange) 0.58 9.4
‘Versement transport’ 2.26 36.6
Government 0.66 10.6
Region Ile-de-France 0.23 3.8
Départements of Ile-de-France 0.47 7.5
Others (STIF, municipalities, etc.) 0.26 4.2
Total 6.20 100.0
Table 3.16 - Public Transport Investments (Ile-de-France, 2002)
Financing of investment Billion Euros %
Government 0.01 0.8%
Region Ile-de-France 0.33 27.3%
Départements of Ile-de-France 0.06 5.0%
Transport companies 0.76 62.8%
STIF 0.05 4.1%
Total 1.21 100.0%
Note: Some of the operating costs include investment and so the total spend on public transport is €6.73 bn in 2002. Source: STIF, 2004
3.7.10 Inside Paris, several major streets have
been ‘civilised’ under the ‘Espaces
civilisés’ programme which includes re-
allocating road space to segregated bus
and cycle lanes and wider footpaths.
There has also been an extensive
‘Quartiers Verts’ programme which has
seen neighbourhoods treated with
various traffic calming measures
including road narrowings, lower speed
limits (down to 30kph from 50kph) and
road humps to reduce through traffic.
The Boulevards de Clichy and de Rochechouart have been ‘civilised’ by re-allocating road space to buses, walking, cycling and rollerblading.
3.7.11 These programmes are intended to “reclaim the public realm”; a
common phrase in the Mairie de Paris (Mayor’s Office/City Hall)
which reflects a complete change in strategy from the road building
policies that attempted to adapt Paris to the car that were in place
just 10 years ago.
Neighbourhoods
across a third of the Ville de Paris have
been calmed to reduce traffic, noise
and encourage more walking.
PAGE 60 WORLD CITIES RESEARCH

3 Strategies
3.7.12 Car modal share has been rising, but the proportion of trips by
public transport has remained at about 20% over the past 25
years. Over this time, the average distance travelled per person
has increased from 6.2km to 9.9km by car and 5.4km to 5.9km for
public transport (Table 3.17). There has been some decline in
walking, but levels are still higher than most metropolitan cities.
Table 3.17 - Trip Rate by Mode (Ile-de-France)
Millions per day
Public Transport
Car Motorcycle
Walking Other
1976 5.9 9.8 1.6 12.6 0.4
1983 6.2 11.8 0.9 12.0 0.3
1991 6.7 14.4 0.6 11.2 0.3
1997 6.8 16.6 0.8 12.4 0.2
2001 6.8 15.5 0.7 12.0 0.2
% in 1976 19% 32% 5% 42% 1%
% in 2001 20% 38% 3% 38% 1%
Sources: INSEE, DREIF, enquêtes globales de transport
Barrier and Levers
– Parking policies have not been exploited because about half of the supply in the city centre is in private ownership. There is also a reluctance to introduce controversial policies in case it hastens the decline of the resident population.
– Employers contribute to funding public transport and feel that they are already doing enough to reduce traffic hence there has been little progress with travel plans.
– The availability of funding may have contributed to some inefficiencies, for example, there is a high level of fare evasion on the metro and RER.
+ All the main stakeholders are involved in financing transport investment and subsidising operating costs and so there is a degree of realism in which schemes are affordable and should be progressed, after construction of concurrent public transport schemes over-committed the authorities in the 90s.
+ Employers play an important role in supporting public transport. Their contributions to the Versement transport and Carte Orange amounts to over 40% of the global (subsidy and investment) costs which has helped to keep fares at a reasonable level and allowed significant improvements in supply.
+ The Schéma Directeur and the Plan de Déplacements Urbain (PDU) provide clear frameworks for transport planning in the Paris area for the medium and long-term and demonstrate a commitment to public transport schemes.
PAGE 61 WORLD CITIES RESEARCH

3 Strategies
3.8 Singapore
3.8.1 Singapore’s transport strategy has its roots in the 1972 State and
City Planning Project which recommended developing a network of
expressways, comprehensive traffic management and restraint on
cars in the CBD, and improvements to public transport. While
responsibilities for transport and development have shifted between
Government departments, there has been an unswerving
commitment to implementing these measures and providing a high
quality, integrated and efficient transport system (Table 3.18).
Table 3.18 - Infrastructure Development
19721 19992 20033
Road (km)
Including expressways
1000
-
3,100
149
3,165
150
Rail (km) - 83 128
Buses
Bus lanes (km)
3,730
-
3,300
n/a
3,211
120
Source: 1,2May, A.D. (2004) Singapore: The development of a world class transport system. Transport Reviews, Vol. 24, No. 1, 79-101, January 2004;
3Land Transport Authority, Statistics in Brief, 2004.
3.8.2 The key feature of the strategy is the use of various charges to
influence both vehicle ownership and use. The Vehicle Quota
System (described earlier) limits the growth in vehicles to 3% pa
by requiring potential owners to bid (typically S$30,000) for a
Certificate of Entitlement. The quota works in parallel with the
congestion charging scheme which deters driving in congested
conditions and its effectiveness is partly demonstrated by the fact
that car ownership and use are substantially lower than London
(Table 3.19), for example, even though its GDP is higher.
Table 3.19 – Car Ownership and Car Use
1980 1990 1999/2000
Cars per 1,000 population
Singapore
London
64
284
102
348
111
345
Private vehicle kms per
capita1
Singapore
London
770
2529
1864
3892
2150
4114
Note: 1Data refers to 1995/96. Source: Kenworthy and Laube, 1999 and 2001
3.8.3 The charging scheme was introduced as an Area Licence in 1975
and drivers were required to purchase a permit from roadside
booths, post offices, and various other outlets to drive in the CBD
in the peak. The initial S$3 per day charge was immediately
successful in reducing traffic entering the CBD by 40% and
increasing the average speeds from 23 kph to 30 kph25. The
25 Holland, E.P. and Watson, P.L. (1978) Traffic restraint in Singapore, Traffic Engineering and Control, 19(1), pp. 14-22.
PAGE 62 WORLD CITIES RESEARCH

3 Strategies
charging zone was subsequently enlarged to include the
surrounding expressways and the controls extended to all-day
operation.
3.8.4 The Area Licence was replaced in 1998 by an Electronic Road
Pricing (ERP) scheme that allows greater flexibility in setting
charges and deducting payments. Drivers are now charged each
time they enter the charging zone and charges are adjusted if
speeds fall outside the accepted 20-30kph range in the CBD and
45-65kph on the expressways. Payment is made from a stored
value card located in an in-car unit as the vehicle passes under an
overhead gantry.
3.8.5 Whilst the ERP charge is typically
lower than the permit, the switch to
pay per entry has led to a further
15% drop in entry flows. This has
caused a 23% fall in revenue (from
S$115 million to S$88 million), which
is partly off-set by the cheaper
operating cost (S$10 million
compared to S$19 million previously).
3.8.6 With much of the infrastructure and management controls in place,
and the construction of two more LRT lines and a circle line
currently underway, there has been a move to make best possible
use of the road and rail links and ensure ‘value for money’. The
land use strategy has sought to decentralise development to high
density regional and sub-regional centres with mass rapid transit
(MRT) stations and ensure a mix of development types to reduce
the need to travel and redistribute passenger demand so services
are busy in two directions. Singapore has been well placed to
deliver these changes as the Concept Plan and more detailed
Development Guide Plans specify exactly how land is to be used
and avoids ad-hoc decision-making that has undermined transport
strategies in other metropolitan cities (see Madrid).
3.8.7 Part of Singapore’s success is also due to the ruling People's Action
Party (PAP) being able to maintain strong political control. It has
been in its political interest to invest in high density housing linked
to rail stations to control unbridled car use.
3.8.8 Further efficiencies have been gained through the development of
an Integrated Transport Management System that brings together
data on junction operations and traffic speeds and relays real-time
travel information and ERP charges to a website to inform pre-trip
planning. The data are also used to adjust traffic signal settings and
enable faster recovery from incidents.
3.8.9 There has also been on-going investment in public transport; after
rejecting World Bank funding for a busway in the early 1980s, the
Government has met the cost of all rail schemes, rolling stock,
PAGE 63 WORLD CITIES RESEARCH

3 Strategies
rolling stock replacement, a park and ride facility and good
pedestrian links to stations. It has also built 120km of bus lanes
and measures that allow buses to leave stops, but there is no bus
priority at signals.
3.8.10 Buses continue to be the main form of public transport with 25
million journeys pa, compared to 2.3 million by rail, but patronage
is falling slowly in line with rail expansion and transit-oriented
development. Services are operated by two private companies that
cover different parts of the city and so there is no competition.
Fares and service levels are specified by Government, but are
regulated by the Public Transport Council, an independent body
made up of a cross-section of society, that helps to ensure that
service patterns are responsive to changing needs. New services
have been introduced that specifically appeal to car users; the
PlusBus is an executive minibus, and the RapidBus is a cross-island
express that has reduced journey times by about 20 minutes.
3.8.11 Whilst the controls on car ownership and use, and the investment
in public transport have been successful in managing demand and
tackling congestion, car modal share has continued to rise and now
represents about 35% of all journeys in the CBD, compared to 15%
in central London (Table 3.20). Singapore is therefore constantly
adapting its charging system for car purchase and use to keep an
effective cap on motorisation.
Table 3.20 – Share of Motorised Journeys
Daily AM Peak
Public Private Public Private
Island wide 55% 45% 60% 40%
CBD 65% 35% 70% 30%
Barriers and Levers:
– The lack of availability of land has reinforced the need to make good use of infrastructure as there are limited possibilities for constructing more surface transport without incurring significant social and environmental costs.
– It has also reinforced the high density approach to land use planning which has, to date, produced a functional city with a relatively high quality of life.
+ Finance has not hindered the delivery of the strategy; the revenue from the area licence always exceeded spend on transport, but the cost of implementing the ERP technology and lower revenue means that the charging scheme is likely to be revenue neutral for eight years.
PAGE 64 WORLD CITIES RESEARCH
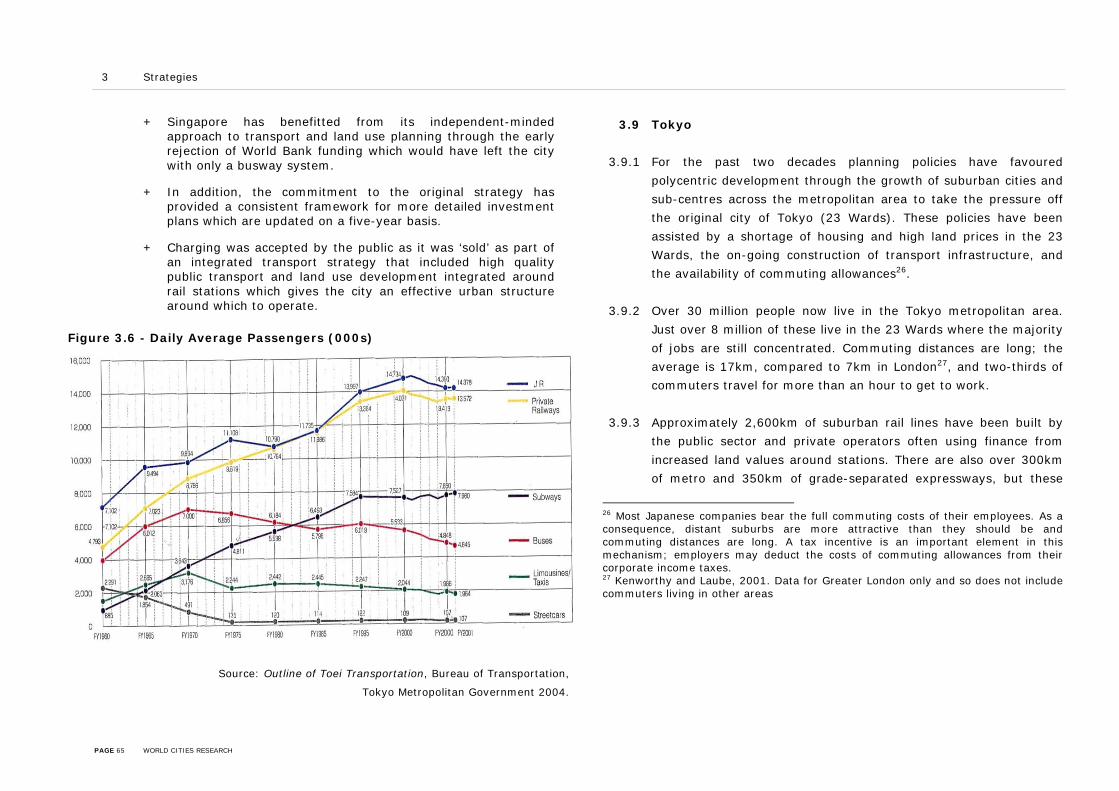
3 Strategies
+ Singapore has benefitted from its independent-minded approach to transport and land use planning through the early rejection of World Bank funding which would have left the city with only a busway system.
+ In addition, the commitment to the original strategy has provided a consistent framework for more detailed investment plans which are updated on a five-year basis.
+ Charging was accepted by the public as it was ‘sold’ as part of an integrated transport strategy that included high quality public transport and land use development integrated around rail stations which gives the city an effective urban structure around which to operate.
3.9 Tokyo
3.9.1 For the past two decades planning policies have favoured
polycentric development through the growth of suburban cities and
sub-centres across the metropolitan area to take the pressure off
the original city of Tokyo (23 Wards). These policies have been
assisted by a shortage of housing and high land prices in the 23
Wards, the on-going construction of transport infrastructure, and
the availability of commuting allowances26.
3.9.2 Over 30 million people now live in the Tokyo metropolitan area.
Just over 8 million of these live in the 23 Wards where the majority
of jobs are still concentrated. Commuting distances are long; the
average is 17km, compared to 7km in London27, and two-thirds of
commuters travel for more than an hour to get to work.
Figure 3.6 - Daily Average Passengers (000s)
Source: Outline of Toei Transportation, Bureau of Transportation,
Tokyo Metropolitan Government 2004.
3.9.3 Approximately 2,600km of suburban rail lines have been built by
the public sector and private operators often using finance from
increased land values around stations. There are also over 300km
of metro and 350km of grade-separated expressways, but these
26 Most Japanese companies bear the full commuting costs of their employees. As a consequence, distant suburbs are more attractive than they should be and commuting distances are long. A tax incentive is an important element in this mechanism; employers may deduct the costs of commuting allowances from their corporate income taxes. 27 Kenworthy and Laube, 2001. Data for Greater London only and so does not include commuters living in other areas
PAGE 65 WORLD CITIES RESEARCH

3 Strategies
have always lagged behind the ever-increasing demand for travel,
particularly in the morning peak as the economy has picked up
through the 90s.
3.9.4 Currently there is traffic congestion throughout the day, the
average speed has fallen from 26kph in the mid-90s to 21kph, and
trains arrive 50% over capacity in the morning peak hour.
3.9.5 About 30% of all trips are made by public transport, but the share
is falling because of increasing car use. About 90% of public
transport trips are made by rail; the suburban systems of JR East
(former national operator) and the private railways account for
about 32% each, with the remainder by the metro28, which is
continuing to attract passengers from the bus services, despite the
introduction of new bus services, real-time information at stops and
on the Internet, and an integrated bus pass which can be used on
all operators (Figure 3.6).
3.9.6 As the focus has always been building new infrastructure to support
the spatial plan, there has been no coherent strategy to manage
travel demand. There are high taxes on car ownership and tolls on
the expressways, but these are used to raise funds for road
construction and maintenance, rather than influence traffic levels.
Drivers have to have an off-street parking space to park their car
28 Jane’s Urban Transport Systems 2001-02 (JUTS 01-02)
overnight. Spaces are limited and therefore expensive and this has
helped to deter people from buying cars, but the metropolitan
government is now offering grants for the private sector to build
more car parks. The rail operators have refused to increase the
capacity of existing rail links because the worst crowding occurs for
about 20 minutes around 8:30am and demand falls off significantly
outside the peak hour, but there have been no efforts between the
government, employers and operators to introduce more flexible
working and encourage peak spreading.
3.9.7 The national and metropolitan governments see the solution in the
continued development of the suburban centres. The ‘vision’ for the
future of Tokyo is a series of concentric road and rail links that
serve larger sub-centres (Figure 3.7). The key difference is that
these will contain a mix of residential, employment and other
functions to ensure that they are more self-sufficient and generate
less travel demand29.
29 There is a great deal of literature that shows that transit-oriented development is a good basis for managing travel demand, and indeed Singapore, discussed later, is a good example of how mixed use sub-centres linked to rail can help to manage growth in car travel.
PAGE 66 WORLD CITIES RESEARCH

3 Strategies
Figure 3.7 – The Vision for the future of Tokyo
Source: Toei 2004
PAGE 67 WORLD CITIES RESEARCH

3 Strategies
3.9.8 The vision includes additional expressways, metro extensions and
some 530km of new rail links within 50km of central Tokyo to serve
expanding sub-centres at Shibuya, Shinjuku and Ibebukuro, and
new centres at Ueno-Asakusa, Kinshicho-Kameido, and Ohsaki.
These centres will have high densities and good provision for
walking and cycling.
3.9.9 There is also investment in traffic management initiatives to
address the congestion. There has been an increase in enforcement
to crack down on illegal parking, a programme of improvements at
100 junctions and ‘enlightenment campaigns’ to raise awareness of
the importance of the stopping and parking restrictions.
Barriers and Levers:
– Responsibility for transport is split between a number of national, metropolitan and local government bodies, and several private and public sector operators which results in a lack of joined up thinking. For example, the metropolitan government has been promoting cycling and many commuters cycle to the rail station but there is a chronic shortage of parking and the police confiscate bikes left unattended.
– The metro is run by Tokyo Metro (8 lines) and the Metropolitan Bureau of Transportation Toei (4 lines). The split administration is unique and causes frustration for users. For example, fares are low, equivalent to just over a euro for a single ticket, but
there is a charge of just under a euro for interchanging between networks. There are different maps at stations, on trains and on customer information boards, focussing on the company’s own lines, making interchange difficult.
– There have been continuous extensions to the metro and patronage has been growing but this has been at the expense of the local bus services.
+ Responsibility for planning is shared between the metropolitan government and the relevant city or town councils. Plans are ratified by the Minister of Land, Infrastructure and Transport in the central Government and so there are strong controls to ensure that development takes place in areas served by rail.
+ The strong regulatory framework protects rail operators from excessive competition to ensure a stable operating environment.
+ The suburban rail network has expanded rapidly, helped by investment by the private sector.
+ Existing legislation allows rail operators with affiliated bus companies to provide feeder buses to stations.
3.9.10 Table 3.21 overleaf provides a summary of the key elements of the transport issues and policies in the sample of eight cities. Their effectiveness is considered in more detail in Chapter 4.
PAGE 68 WORLD CITIES RESEARCH

3 Strategies
Table 3.21 - Summary of Transport Strategies and Effectiveness
London Moscow Barcelona New York
Pro
ble
m • Traffic congestion
• Historic underinvestment in transport • Public transport unreliability, crowding • Increasing travel demand from economic and
demographic growth
• Traffic congestion • Deterioration public transport system • Environmental impacts • Traffic safety
• Traffic congestion • Poor integration of public transport
• Traffic congestion • Overcrowding on public transport • Road safety
Tra
nsp
ort
S
trate
gy
Managing demand and improving public transport system
• Tackling traffic congestion • Providing additional public transport (largely
bus) capacity and reliability • Providing transport links to underpin
population and job growth
Currently lacking integrated transport
strategy
• Previous focus on road construction • Increasing awareness of need for traffic
restraint and better utilisation of existing resources, eg surface transit priority measures.
Supporting strong economic vision
• Construction of ring roads to reduce through traffic in inner city
• Focusing new development in urban areas and sites served by rail
• Matching public transport demand and supply • Improvements to quality of urban realm
Improving public transport to increase travel choice
• Series of capital and financial plans to improve public transport
• Traffic/demand management initiatives • Increased funding for walking/cycling
projects
Po
lici
es
Imp
lem
en
ted
• Congestion charging • More bus services, priority measures • Parking restraint and higher enforcement • Walking and cycling strategies • Underground and light rail extensions to the
east of the city
• Road building • Promotion of public transport • Traffic management • Parking policy • Moscow Urban Transport Project • Metro developments
• Public transport modernisation and extensions • Integrated fares and ticketing • Pedestrianisation, more green space • Park and ride • Access controls in sensitive neighbourhoods
• Upgrading of existing bus and metro system • Fares freeze and integrated ticketing • ‘Thru Streets’ traffic management • Variable tolls on bridges and tunnels • Traffic calming initiatives
Inst
itu
tio
nal TfL established in 2000
City government coordinates transport network and services
AMT (public transport) set up in 1997,
MTA (public transport) only covers part of metropolitan area
Eff
ect
ive-
ness
• Reduced traffic delays in central London by 30%
• More buses and greater reliability • Urban realm improvements, eg ‘World
Squares’ project
• Lack of integrated policy means no major impacts
• Mode share remains high due to relatively low car ownership
• Increased traffic on ring road, decrease elsewhere
• Increased ridership on rail, but decrease on bus
• Increased walking and cycling, and improved air quality
• Public transport use increasing (3.1% in 2001), but so is traffic
• No significant change in mode share • Improvement in road network speeds • Peak spreading of bridge and tunnel traffic
PAGE 69 WORLD CITIES RESEARCH

3 Strategies
Table 3.21 (cont) – Summary of Transport Strategies and Effectiveness
Madrid Paris Tokyo Singapore
Pro
ble
m • Traffic congestion
• Poor coordination of public transport networks and services
• Suburbanisation, decentralisation, leading to higher car use
• Traffic congestion • Effects of congestion on public transport • Lower level of public transport quality in
suburbs
• Rapid development has led to extreme congestion and crowding
• High property prices and commuting subsidies led to long-distance commuting
• Growth in vehicular traffic
Tra
nsp
ort
S
trate
gy
Improving public transport to increase travel choice
• Maintaining public transport patronage and controlling suburbanisation
• Issues of transport efficiency, environmental impacts and safety subsidiary in decision-making
• Some efforts to manage car use
Improving public transport to increase travel choice
• Investment in public transport to improve travel choice
• Promoting walking and cycling
Supporting spatial strategy
• High charges on car ownership to raise funds for roads
• Investment in extending rail networks • Encouragement of growth at major sub-
centres to alleviate pressure on city centre
Managing demand and improving public transport system
• Integrated land use planning • Demand for car ownership balanced with the
number of vehicles using the roads • Improvement and expansion of public
transport network
Po
lici
es
Imp
lem
en
ted
• Public transport extensions • Integrated fares and ticketing • Construction of four toll motorways • High occupancy vehicle lanes • Removal of car parking spaces
• Construction and improvement of orbital roads
• Extension of the public transport network • Ticketing integration • Extensive traffic calming
• Construction of grade-separated expressways • Promotion of additional ring road construction • Extension of the rail network • Enforcement of parking etc. to reduce
congestion
• Vehicle quota system • Road pricing • Improvement to bus network, eg bus priority
measures • Expansion of rail (suburban/ metro/ light
rail) systems
Inst
itu
-ti
on
al
CTM manages public transport STIF organises public transport Split of responsibilities LTA established 1995
Eff
ect
ive-n
ess
• Reversed declining public transport patronage and generated 60% increase, mainly on metro
• HOV lanes improved efficiency of A-6 corridor
• No significant change in public transport mode share
• Increased car ownership and use in the suburbs
• Overall public patronage rising • But public transport mode share declining as
car use increases • Some improvement in air quality due to
vehicle restrictions
• Control on car ownership growth through VTS Management of car use
• Dominant public transport mode share
PAGE 70 WORLD CITIES RESEARCH

4 Outcomes
4.1 Evolution of Policy
4.1.1 National economies have long depended on the contribution of the
major cities. There have been fluctuations associated with world or
local events, but the metropolitan economies have remained
strong, adapted to changing markets and grown faster than the
national economy.
4.1.2 Economic development has driven population growth and the
resulting competition for land has given rise to a process of
suburbanisation that started at different times, but has occurred in
all the cities and continues to the present. The increasing need to
travel from lower density suburbs to more centralised employment
areas or edge of town commercial centres, coupled with increasing
household wealth and rising car ownership has fuelled further
growth in mobility.
4.1.3 Some of this increase in mobility has come from higher trip rates,
but the main contributor has been the increase in distances
travelled. Cities that have sprawled more, or gone further in
allowing the separation of people and jobs, now have the longest
average journey lengths.
4.1.4 The challenge facing all cities has been how to accommodate this
growth in travel demand which is becoming increasingly disparate
and more difficult to meet with cost-effective public transport. In
the meantime, more households have found their own solution in
further increasing car dependency and contributing to a larger
problem of congestion, which has more widespread impacts on
economic efficiency, public transport operations, and people’s
health and safety. Those without access to a car feel the effects of
the congestion plus elements of social exclusion from not being
able to reach jobs, training, healthcare, etc.
4.1.5 So, which policies have been implemented to address the growth in
travel demand and congestion? All of the cities have adopted a
combination of highway investment, land use policies and public
transport improvements – either to meet their continued growth
aspirations or as part of strategies to reduce traffic. Some have
also sought to radically improve conditions for pedestrians and
cyclists in the hope that this will attract short-distance car users.
PAGE 71 WORLD CITIES RESEARCH

4 Outcomes
Attitudes to Road Building
4.1.6 With the exception of Tokyo30, all cities have come to view
continued spending on highways is no longer feasible because of a
number of factors including the lack of available land, unacceptable
environmental impacts, and recognition that increasing capacity
generates additional demand. Their last significant outlay has been
in ring roads designed to meet the more complex orbital
movements in the suburbs and reduce through traffic in the city
centre. Some of these have been built in tunnel (Barcelona and
Madrid) or tolled (Madrid and Paris) to ‘manage’ the environmental
concerns and induced traffic effects.
Integrating Transport and Land Use
4.1.7 None of the cities have harnessed the full potential of land use
policies to contain low-density sprawl, ensure a mix of development
types to reduce the need to travel, or increase public transport
patronage through transit-oriented development. Greater progress
has been made in Barcelona, Singapore and Tokyo where new lines
are generally keeping pace with development, and it is these cities
that have the lowest reliance on public sector subsidy. In contrast,
the other cities appear to be trying to catch up with changes in land
30 Whilst Tokyo has a high supply of roads per capita and per unit area, it has the lowest provision of urban motorways after London, which has influenced policies on road building.
uses after car-dominated travel patterns have evolved (for
example, metro investment in Madrid has been led by previous
market-led development in the suburbs, and RER, metro and tram
investment in Paris has sought to better link the planned sub-
centres with the Ville de Paris).
Public Transport Policies
4.1.8 None of the cities have met their perceived need for improvements
in the supply and quality of public transport. Barcelona, Madrid and
Singapore have invested significantly in new rail-based lines,
whereas London and New York have been making up for the
maintenance backlog on existing systems while there is a growing
need for new lines to meet evolving travel needs, especially for
orbital travel. Further plans tend to be constrained by affordability
at a time when public authorities are expected to be reducing
expenditure, and in some cities, a lack of public sector funding has
been offset by private sector contributions (for example, in
redeveloping stations in Madrid, constructing lines and stations in
Barcelona and Tokyo, and asset renewal on the London
Underground).
4.1.9 There have been general improvements in bus services, with all
cities refreshing their fleets, most cities investing in new simplified
ticketing and better real-time information, and some cities (London,
Paris and Singapore) introducing priority measures. Views on the
PAGE 72 WORLD CITIES RESEARCH

4 Outcomes
role of the bus in the public transport hierarchy remained polarised,
with London, Singapore and to a lesser extent Madrid seeing buses
as an important mode in urban areas, whilst the others tend to
consider them as feeder services for rail. Where rail-based modes
have been extended and replaced bus routes (Barcelona,
Singapore, Tokyo), there has been an increase in rail patronage
that has exceeded the decline in bus patronage.
4.1.10 There is a general recognition that whilst improvements in the
supply and quality of public transport have attracted some modal
shift (Barcelona, Madrid and Paris), continuing investment will not
be enough to encourage larger-scale transfer and address traffic
congestion. The car will always offer high levels of comfort and
convenience and so traffic restraint measures are necessary to
influence the attractiveness of public transport.
“A vision of public transport is a necessary, but
not a sufficient condition for achieving
sustainable mobility. Measures must be
implemented to dissuade car use.” Pelayo
Martínez Bauluz, Manager, Barcelona
Metropolitan Entity of Transport (EMT)
4.1.11 The exception here is Tokyo which sees further investment in public
transport as essential to its land use strategy, and active traffic
restraint is viewed as unnecessary because it believes that the
further dispersal of activities will facilitate continued economic
growth and address congestion/crowding. This will only work,
however, if the strategy is successful in decentralising employment
and creating self-sustaining cities which has not been possible in
Paris, where the previous multi-centric policies have generated
dormitory settlements and increased the overall demand for travel.
Demand Management
4.1.12 There are taxes on car ownership in all the cities; these have been
particularly effective in Singapore where the duties and a certificate
of entitlement are typically three times the market value of an
average car. With the exception of Moscow, there are also various
forms of control on car use using physical restrictions, parking
policies and pricing.
4.1.13 For example, Barcelona has implemented physical restrictions on
car access to the historic core and other environmentally-sensitive
neighbourhoods, and like Madrid, there has been a major
programme to reallocate road space to pedestrians. Parking
provision is extremely limited in London and New York, there are
high user charges and the authorities are committed to effective
enforcement.
PAGE 73 WORLD CITIES RESEARCH

4 Outcomes
4.1.14 There are tolls on strategic inter-urban routes in most cities and on
the bridge and tunnel approaches to Manhattan Island. Congestion
charging has been implemented in London and Singapore; the
London scheme charges drivers a £5 daily fee for driving within the
zone, whereas the ERP scheme in Singapore charges drivers each
time they enter the charging zone and the rate varies according to
congestion levels (monitored by average vehicle speeds).
4.1.15 There is also evidence that congestion itself has been a deterrent to
further car use; for example, traffic levels in London and New York
have been stable since the mid-90s, and in New York, the
congestion was sufficient to encourage drivers back onto rail, once
the subway system had been made acceptable to users.
4.2 Effectiveness
4.2.1 Data on changes in modal share are only available for six of the
cities and in varying formats which makes comparison difficult.
Table 4.1 (overleaf) shows that Barcelona and London have been
successful in reducing car dependency.
4.2.2 Barcelona has seen a fall of 0.8% per annum in the proportion of
trips made by private transport (cars and powered two-wheelers)
both within the inner city31 and between the inner city and the
suburbs in the past four years.
4.2.3 This has been achieved through a combination of:
• Investment in public transport (modernising suburban rail,
5km extension to the metro and two new tramways and a
20% increase in bus kilometres);
• Integrated fares and ticketing which has led to a three-fold
increase in public transport journeys involving two or more
modes/services; and
• Restrictions on car use through access controls, removal of
car parking and the reallocation of road space to
pedestrians.
4.2.4 These policies have been assisted by the existing mix of people and
jobs, extremely high land use density and good pedestrian facilities
in the inner city which have increased the feasibility of using
alternative modes. As the population has decentralised, new
housing has been focused on sites served by rail. Proximity to a
sufficiently large number of potential users has helped to improve
the financial viability of public transport and the cost recovery of
suburban rail is 71% and metro/urban bus 79%, compared to 31 Within the ring road
PAGE 74 WORLD CITIES RESEARCH
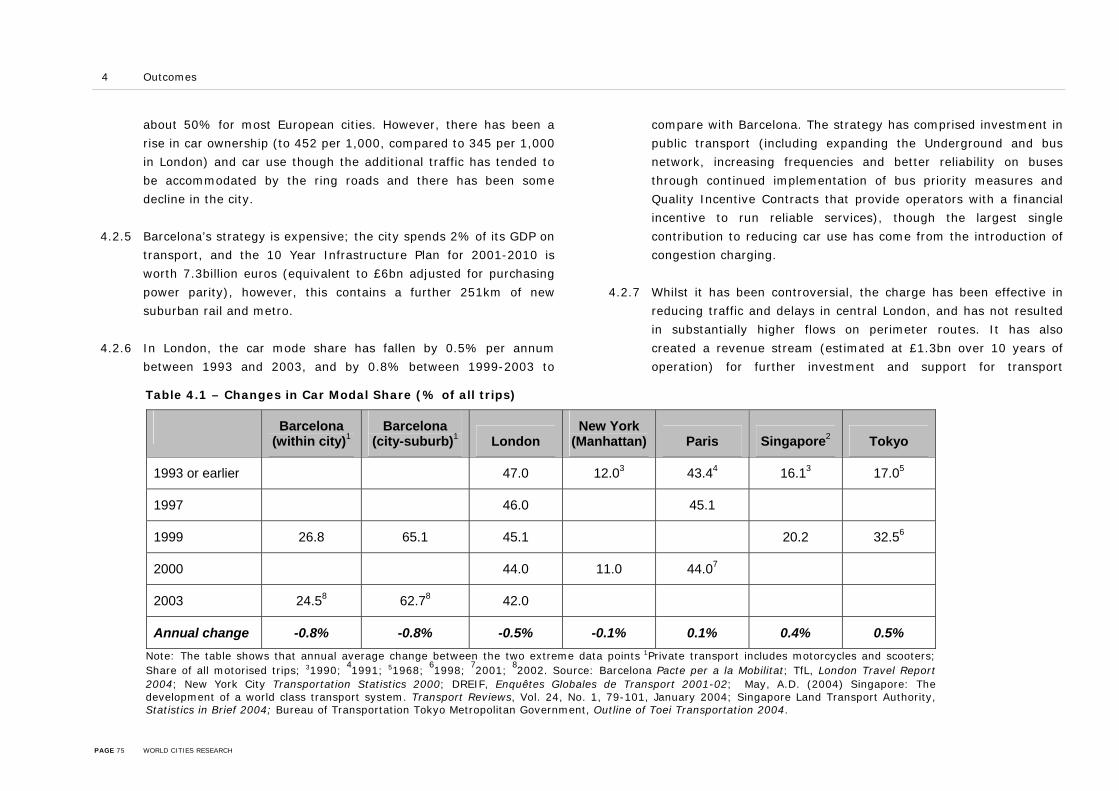
4 Outcomes
about 50% for most European cities. However, there has been a
rise in car ownership (to 452 per 1,000, compared to 345 per 1,000
in London) and car use though the additional traffic has tended to
be accommodated by the ring roads and there has been some
decline in the city.
4.2.5 Barcelona’s strategy is expensive; the city spends 2% of its GDP on
transport, and the 10 Year Infrastructure Plan for 2001-2010 is
worth 7.3billion euros (equivalent to £6bn adjusted for purchasing
power parity), however, this contains a further 251km of new
suburban rail and metro.
4.2.6 In London, the car mode share has fallen by 0.5% per annum
between 1993 and 2003, and by 0.8% between 1999-2003 to
compare with Barcelona. The strategy has comprised investment in
public transport (including expanding the Underground and bus
network, increasing frequencies and better reliability on buses
through continued implementation of bus priority measures and
Quality Incentive Contracts that provide operators with a financial
incentive to run reliable services), though the largest single
contribution to reducing car use has come from the introduction of
congestion charging.
4.2.7 Whilst it has been controversial, the charge has been effective in
reducing traffic and delays in central London, and has not resulted
in substantially higher flows on perimeter routes. It has also
created a revenue stream (estimated at £1.3bn over 10 years of
operation) for further investment and support for transport
Table 4.1 – Changes in Car Modal Share (% of all trips)
Barcelona (within city)1
Barcelona (city-suburb)1 London
New York (Manhattan) Paris Singapore2 Tokyo
1993 or earlier 47.0 12.03 43.44 16.13 17.05
1997 46.0 45.1
1999 26.8 65.1 45.1 20.2 32.56
2000 44.0 11.0 44.07
2003 24.58 62.78 42.0
Annual change -0.8% -0.8% -0.5% -0.1% 0.1% 0.4% 0.5%Note: The table shows that annual average change between the two extreme data points 1Private transport includes motorcycles and scooters; Share of all motorised trips; 31990;
41991; 51968;
61998;
72001;
82002. Source: Barcelona Pacte per a la Mobilitat; TfL, London Travel Report
2004; New York City Transportation Statistics 2000; DREIF, Enquêtes Globales de Transport 2001-02; May, A.D. (2004) Singapore: The development of a world class transport system. Transport Reviews, Vol. 24, No. 1, 79-101, January 2004; Singapore Land Transport Authority, Statistics in Brief 2004; Bureau of Transportation Tokyo Metropolitan Government, Outline of Toei Transportation 2004.
PAGE 75 WORLD CITIES RESEARCH

4 Outcomes
improvements in London.
4.2.8 Spending on transport in London has risen from 1.75% of GDP in
the mid 90s to close to 3% and the Five Year Investment
Programme (2005/06-2009/10) is worth £10bn.
4.2.9 In both Barcelona and London, the switch from the car has tended
to benefit public transport and the general trend of decline in
walking has continued, with the exception of Paris (Table 4.2).
4.2.10 Paris has historically had a high proportion of trips made by foot,
largely because of high density, mixed land uses in the inner city
and difficulties associated with finding available car parking. There
has been an extensive programme of traffic calming in the more
residential neighbourhoods and key shopping areas within the Ville
de Paris. This has sought to reduce traffic speed (with a blanket
speed limit of 30kph), widen footpaths and improve pedestrian
safety and appears to have been successful in encouraging a little
more walking.
Table 4.2 – Changes in Public Transport and Walk Modal Shares (% of all trips)
Mode Year Barcelona (within city)
Barcelona (city-suburb) London
New York (Manhattan) Paris
Tokyo (MTA)
1993 or earlier 27.1 58.01 20.22 32.03
1997 29.5 18.5
1999 37.8 31.0 30.1 28.0
2000 30.9 59.0 19.34
2003 39.55 33.55 33.5
Publ
ic T
rans
port
Annual change 0.6% 0.8% 0.6% 4.7% 1.8% -0.1%
1993 or earlier 23.1 23.01 33.72 43.03
1997 22.4 33.7
1999 36.4 3.9 22.0 24.0
2000 22.0 22.0 34.14
2003 36.05 3.75 21.5
Wal
king
Annual change -0.1% -0.1% -0.2% -0.1% 0.0% -0.7% Note: 11990; 21991; 31968; 42001; 52002. Source: Barcelona Pacte per a la Mobilitat; TfL, London Travel Report 2004; New York City Transportation Statis-
tics 2000; DREIF, Enquêtes Globales de Transport 2001-02; Bureau of Transportation Tokyo Metropolitan Government, Outline of Toei Transportation 2004 . PAGE 76 WORLD CITIES RESEARCH

4 Outcomes
Table 4.3 –Modal Shares for Commuting (% of all trips)
Mode Year London
New York (Manhattan) Paris
Singapore
1997 or earlier 47 12.31 50 18.1
2000 43 11.7 492 23.7
2003 42 Car
Annual change -0.9% -0.1% -0.3%
0.5%
1997 or earlier 40 61.71 30 55.0
2000 43 63 362 52.4
2003 45
Pu
blic
Tra
nsp
ort
Annual change 0.8% 0.1% 1.5%
-0.3%
1997 or earlier 8 24.31 17 8.0
2000 9 23.2 112 6.1
2003 9
Walk
ing
Annual change 0.2% -0.1% -1.5%
-0.2%
Note: 11990; 22001. Source: TfL, London Travel Report 2004; New York City Transportation Statistics 2000; DREIF, Enquêtes Globales de Transport 2001-02;
Singapore Department of Statistics, Census of Population 2000.
4.2.11 The changes in modal shares for commuting further illustrate
the progress that has been made in London (Table 4.3),
compared to New York and Paris, where there have been no
additional restrictions on car use to complement the improve-
ments in alternative modes. In New York, $48billion has been
spent on restoring and upgrading the decrepit public transport
systems over the past 20 years, and patronage has increased
(Table 4.4), but not at the expense of car use.
4.2.12 Public transport patronage has also increased substantially in
Singapore and London. In Singapore, the rise is due to the
continuing growth in population at accessible locations, and an
increase in the public transport trip rate resulting from the
combination of rail and bus network extensions and traffic
restraint. The transport strategy has sought to balance the
supply and demand for road space, rather than reduce car use
per se, and so the car mode share has increased (Table 4.3),
but the ERP has been successful in ensuring that as traffic
rose, average speeds remained constant (Tables 4.5-4.6).
PAGE 77 WORLD CITIES RESEARCH

4 Outcomes
Table 4.4 – Public Transport Patronage (passenger journeys, millions)
Mode Year Barcelona London Madrid Moscow New York1 Paris Singapore Tokyo
1992 or earlier 590.4 892.52 1615.1 130353
1995/96 2440 2850.5 10426
2000/01 2816 9396.3 2295.2 3398 14803
2002/03 2981 1436.4 1534.1
2003/04 687.8 3356 1543.9 9430.2 1629.7
All M
od
es
Annual change 1.3% 4.1% 2.9% 0.1% 4.5% 3.6% 6.2% 0.9%
1992 or earlier 200.9 503.82 21163
1995/96 1198 995.3 2020
2000/01 1170.3 1695
2002/03 1534 678.1 1139.9
2003/04 189.8 1702 747.5 1184.8
Bu
s
Annual change -0.5% 4.5% 2.2% 4.7% 3.9% -1.4%
Annual change in PT trip rate 1.3% 3.8% 2.1% -5.2% 3.3% 3.5% 4.4% -0.2%
Note: 1Data refers to New York city and suburban buses, New York and New Jersey subway and urban rail; 21986; 31985. Source: ATM 2005; TfL London Travel
Report 2004; Consorcio de Transportes de Madrid, 2003; Research Institute of Road Transport (NIIAT), 2005; US Statistics Transit Fact Book; STIF, Les Transportes
en Ile de France 2001; Singapore Land Transport Authority, 2004; Bureau of Transportation Tokyo Metropolitan Government, Outline of Toei Transportation 2004.
PAGE 78 WORLD CITIES RESEARCH

4 Outcomes
4.2.13 In London, most of the growth in patronage has come from the
increase in the public transport trip rate, again resulting from a
combination of public transport improvements and traffic restraint.
TfL research shows that just 18% of Londoners do not use the bus,
compared to 24% in 2002/0332.
4.2.14 Traffic levels have generally been falling in Barcelona, London and
inside Madrid, but not in the suburbs. Barcelona and London have
32 TfL Annual Report, 2004
also seen a parallel increase in the average speed (Table 4.6
overleaf).
4.2.15 Madrid has also seen a rise in public transport patronage and trip
rate (Table 4.4) which suggests that it too has been able to reduce
the car modal share. However, the latest travel survey was
completed in 1996 and so it will not be possible to confirm this until
more recent data is collected.
Table 4.5 – Traffic Levels (vehicles per day)
Year Barcelona London Madrid New York Singapore
Roads
into city
Ring
roads
Boundary
cordon
Inner
Cordon
Central
Cordon
1st inner
ring road
Betw 1st and
2nd ring road
2nd Outer
ring road
NYC
cordon
Entering
CDB
1991 1,159,266 264,051 2,430 2,173 1,644
2001 1,200,484 283,914 2,566 1,512 626,913 890,653 1,014,717 2,189,588
2002 2,129 1,442 597,416 867,831 922,917 2,275,923 245,000
2003 1,140,490 288,314 2,078 1,310 577,039 887,955 949,256 2,310,174 244,000Source: Ajuntament de Barcelona, 2004; Tfl, 2005; Madrid Region Statistical Yearbook 2004;
NYC Department of Transportation 2004; Singapore Land Transport Authority 2004.
PAGE 79 WORLD CITIES RESEARCH

4 Outcomes
4.2.16 Other sources report that traffic in the Ville de Paris fell 3% in
2001/02, largely because of the centralisation and traffic calming
which has forced some re-routeing and contributed to the rise in
traffic in the suburbs33.
33 DREIF 2004
PAGE 80 WORLD CITIES RESEARCH

4 Outcomes
Table 4.6 – Average Speed (kph)
Barcelona
London
AM Peak Only Paris Singapore Year
Ring roads Within City Outer Central Radials in
Inner suburbs Radials in
Outer Suburbs Expressway Within City
1999 59.8 19.9 29.31 16.1
2002 58.9 20.2 27.22 15.9 62.5 60 66.7 24.8
2003 56.5 21.6 n/a 17.13 61.7 57.1 65.4 24.3
Note: Data for 11997-2000; 22000-2002; 32003-2004. Source: Generalitat de Catalunya, 2004;
TfL London Travel Report 2004; DREIF 2004; Singapore Land Transport Authority
Influences on Transport Policy
4.2.17 The key factors that have assisted the development,
implementation and success of the demand management policies
have been:
• Integrated planning – The cities that have had greater
success in reducing car dependency have adopted a
combination of public transport, land use and traffic
restraint policies. In Barcelona and Madrid, the focus has
been more on public transport, and in London and
Singapore, it has been more on restraint, but all cases have
been assisted by past and present land use policies that
have reduced sprawl and contributed to an urban structure
that can be served by public transport.
• Long-term planning and continuity – Barcelona, Madrid and
Singapore have followed their strategies for more than 20
years and this has allowed time for the benefits,
particularly the effect of the land use policies, to come to
fruition. Congestion charging has been implemented more
recently in London, but has followed a period of sustained
application of parking restraint, development control and
PAGE 81 WORLD CITIES RESEARCH

4 Outcomes
integrated transport and land use planning to the east of
the city.
• Consensus – Whilst the integrated institutional structure
and common political aspirations of the transport and
planning authorities in Madrid and Singapore have helped
to streamline policy-making, this is not a pre-condition for
success. Responsibilities are split between national,
regional and local bodies in Barcelona, and yet they have
been able to agree a consensus because they are firmly
committed to the economic development strategy which
depends on an efficient transport system. Similarly in New
York, there is no clear lead authority on transport issues,
but the various players have successfully worked together
to reverse the trend of decline in subway use because they
were united in their common desire to ‘save public
transport’.
• Availability of funding – All the cities have had access to
high levels of funding from national, regional and local
sources, but the declining availability of future funds or
greater pressure to reduce spend, has helped to raise the
importance of demand management and deterred further
investment in infrastructure. The recent economic situation
has reduced spend on transport in Moscow, in particular,
but in the absence of a coherent strategy, there would have
been diminishing benefits to the planned spend on public
transport as car ownership continued to rise.
• Acceptability – London and Singapore are the only two
cities that have implemented more punitive policies which
have been made publicly acceptable because they were
introduced as part of a package that included
improvements to public transport.
4.3 Successful initiatives
4.3.1 The World Cities and the large comparators have tended to adopt
conventional policies to address their transport problems. There
have been some examples of successful innovation; as journeys
become more complex, integrated ticketing has given public
transport patronage a boost by allowing free interchange between
modes and smartcard technology has made services easier to use.
Modern communications technology has also been essential in
supporting the successful congestion charging scheme and value
pricing in New York, though the latter would have been more
effective if the Port Authority had not succumbed to public
opposition and kept to the higher charges that were originally
proposed.
PAGE 82 WORLD CITIES RESEARCH

5 Conclusions
5.1 Conclusions
5.1.1 The study has highlighted the different approaches to managing
traffic growth in the cities. There has been some commonality in
their attitudes towards discontinuing road building and their desire
to invest in public transport and better conditions for walking and
cycling. However, there are notable differences in their
commitment to reducing traffic and implementing specific restraint
measures.
5.1.2 The improvements in public transport have been successful in
increasing public transport patronage, and in most cases, the public
transport trip rate, but this has not necessarily resulted in a decline
in car use. In addition to increasing coverage, the key drivers have
been simplified fares systems, integrated ticketing and
improvement in reliability.
5.1.3 The better pedestrian facilities in the European cities appear to
reduce the general decline in walking, but only Paris has been able
to increase the walk mode share slightly through extensive traffic
calming. Further analysis has been hampered by a lack of data on
non-motorised travel.
5.1.4 The effects on both public transport and walking have been most
noticeable in cities that have supportive land uses (ie high density,
mixed land use patterns arising from past of present policies)
and/or have implemented some form of deterrent to car use.
5.1.5 All the cities, except Moscow, have parking restrictions, but it is
London and New York that have the most limited supply, highest
charges and strictest enforcement. Barcelona and Madrid have
gone some way with physical restrictions (Barcelona with access
controls and pedestrianisation, and Madrid with reallocating road
space to walking). Only London and Singapore have implemented
congestion charging as a punitive measure to manage car use.
5.1.6 The analysis demonstrates that Barcelona and London have been
most successful in bringing about a fall in the proportion of trips by
car, in both cases by encouraging a switch to public transport. The
strategies applied in these cities have been quite different;
Barcelona has invested heavily in rail-based public transport, used
land use policies to retain a compact existing city and focus new
development on rail hubs, reduced car parking provision for non-
residents and restricted access to the central area. London has
invested less in public transport and the focus has been on buses
PAGE 83 WORLD CITIES RESEARCH
5 Conclusions
and traffic management measures which have provided additional
capacity to accommodate the modal switch and the limited re-
routeing of vehicles around the zone.
5.1.7 The network extensions in Barcelona have increased the burden of
subsidy on the city and regional authorities, though the high
densities in the inner city and suburban developments have helped
to maintain the cost recovery rate. The congestion charging scheme
has generated a revenue stream that will be used to support
further improvements in local transport in London.
5.1.8 Singapore did not set out to reduce car use, rather to balance the
supply and demand for road space, which it has achieved with the
ERP. The public transport network extensions and integrated land
use development have ensured that accessibility has not declined
for those without access to a car.
5.2 Lessons for UK Cities
5.2.1 The key lessons arising from the research into the World Cities and
large comparators are the need to:
• Retain inner city populations so walking and cycling are
viable modes for many people, and there is less pressure
on radial transport links;
• Resist urban sprawl to slow the trend in rising journey
lengths and development in areas that are not served by
public transport as these factors lead to increased car use;
• Ensure high population densities to provide a sufficient
threshold for cost-effective mass transit;
• Balance investment in new transport provision with
restraints on car use – charging and access controls are the
most effective, but strict parking policies are also powerful;
• Invest in traffic calming and other improvements in walking
and cycling to slow the general declining trend in non-
motorised travel;
• Make public transport use easy to use with simplified fares,
integrated ticketing and passenger information and ensure
high levels of reliability to increase patronage.
5.2.2 Several cities have benefited from private sector contributions to
public transport investment and operations. There is potential for
UK cities to make more of this through opportunities for land value
capture around new stations.
5.3 Recommendations for Future Research
5.3.1 Despite the increasing attention on monitoring and the efforts that
have gone into benchmarking transport, particularly by European
PAGE 84 WORLD CITIES RESEARCH

5 Conclusions
Commission-funded programmes, there has been no improvement
in the availability of suitable indicators for measuring transport
outcomes and gauging success against policy objectives.
5.3.2 There is a particular lack of data tracking economic growth and
travel demand to understand the contribution of background factors
and active policies in changing travel patterns.
5.3.3 There is still no accepted measure of congestion; various proxy
measures of changes in average speed and average delay
additionally suffer from a lack of compatibility.
PAGE 85 WORLD CITIES RESEARCH