Embed Size (px)
Citation preview
Introduction
Page | 1
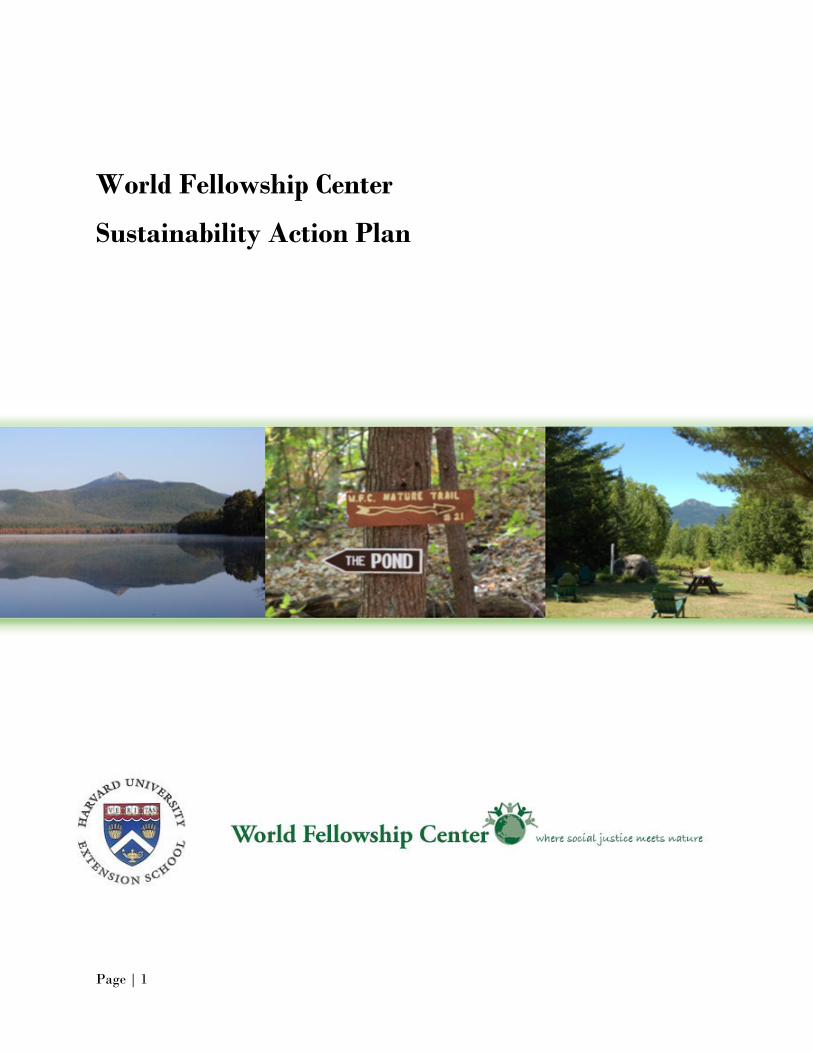
World Fellowship Center
Sustainability Action Plan
Introduction
Page | 2
Table of Contents Introduction ................................................................................................................................................ 4
World Fellowship’s Requirements .............................................................................................................. 4
Opportunities & Risks ................................................................................................................................. 4
Key Stakeholders ........................................................................................................................................ 5
Recommended Initiatives ........................................................................................................................... 6
New Hampshire Green Hospitality Program Membership ...................................................................... 6
Rain Barrel Installation ............................................................................................................................ 7
Energy Tracking (Electricity and Propane) .............................................................................................. 8
Sustainability Reporting .......................................................................................................................... 9
Energy Efficient Lighting Upgrades ....................................................................................................... 10
Lighting and Plug-load Controls ............................................................................................................ 12
Water Heater Insulating Blankets ......................................................................................................... 14
ENERGY STAR Replacements................................................................................................................. 15
Sustainability Branding & Marketing .................................................................................................... 17
Fostering Sustainable Behavior ................................................................................................................. 18
Sustainability Capital Reserve ................................................................................................................... 19
Performance Metrics & Reporting ............................................................................................................ 20
Future Initiatives ....................................................................................................................................... 22
Solar PV Installation .............................................................................................................................. 22
Solar Hot Water Installation.................................................................................................................. 23
Agriculture Expansion ........................................................................................................................... 25
Roadmap ................................................................................................................................................... 26
Addendum A ............................................................................................................................................. 27
Addendum B ............................................................................................................................................. 28
Addendum C ............................................................................................................................................. 29
Works Cited .............................................................................................................................................. 35

Introduction
Page | 3
Introduction
Page | 4
INTRODUCTION About World Fellowship Center
World Fellowship Center (WFC) is a nonprofit educational and cultural retreat and conference
center located in New Hampshire’s White Mountains with a mission to “promote social justice
and connections between people, communities, and nature through education, recreation, and
creative expressions.” World Fellowship recognizes the connection between environmental
stewardship and social responsibility. Since founding in 1941 World Fellowship has instituted
and modeled practices that reflect this commitment, such as organic gardening, reusing bath
towels, and maintaining their 455-acre land-holding as primarily undeveloped wilderness (to
name a few). Increasing energy costs, more frequent and intense drought conditions
accompanied by growing human demands on freshwater use, an accelerating rate of species
extinction, and plans to expand campus facilities and accommodations are all incentives for
World Fellowship's continued interest in sustainable practices.
WORLD FELLOWSHIP’S REQUIREMENTS
Reducing negative environmental and social impacts
Developing a mechanism to measure and report performance
Documenting benefits of current sustainable practices
Increasing dialogue and awareness surrounding current practices
Reduce waste (energy, water, post-consumption)
OPPORTUNITIES & RISKS The following are opportunities presented by “going green” and risks of not pursuing
sustainable practices.
Opportunities:
Reduce operating costs, increase profitability
Allocate savings from initiatives to fund future improvements
Increase staff and guest engagement with sustainability practices
Multiply impact of practices via guest/staff education and adoption
Enhance role as sustainability model by documenting results
Distinguish from competitors
Risks:
Impede innovation
Misspent funds on waste and delay development
Harm to organization image
Greater exposure to rising costs (energy, waste, supply chain)
Key Stakeholders
Page | 5
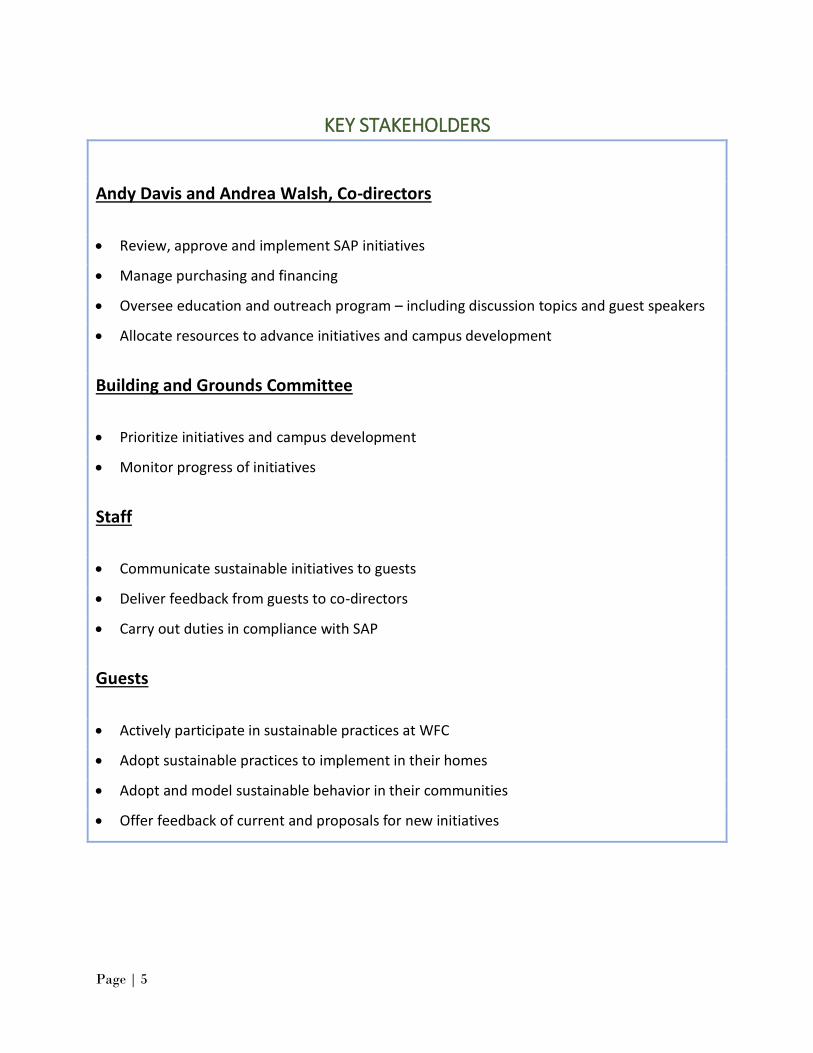
KEY STAKEHOLDERS
Andy Davis and Andrea Walsh, Co-directors
Review, approve and implement SAP initiatives
Manage purchasing and financing
Oversee education and outreach program – including discussion topics and guest speakers
Allocate resources to advance initiatives and campus development
Building and Grounds Committee
Prioritize initiatives and campus development
Monitor progress of initiatives
Staff
Communicate sustainable initiatives to guests
Deliver feedback from guests to co-directors
Carry out duties in compliance with SAP
Guests
Actively participate in sustainable practices at WFC
Adopt sustainable practices to implement in their homes
Adopt and model sustainable behavior in their communities
Offer feedback of current and proposals for new initiatives
Recommended Initiatives
Page | 6
RECOMMENDED INITIATIVES
New Hampshire Green Hospitality Program Membership
Background
The New Hampshire Green Hospitality Program (NHGHP) is a voluntary assessment for businesses
in the hospitality sector that wish to demonstrate and validate their commitment to
environmental stewardship and leadership in implementing sustainable practices. Applicants
complete a questionnaire to assess their businesses’ sustainability initiatives, which the program
describes as Environmental Best Management Practices (EBMP). Applicants must achieve all
mandatory EBMPs, complete a site visit, and identify at least one new EBMP to implement within
2 years, to receive membership. Higher levels of recognition are possible based on the number of
elective EBMPs achieved. The New Hampshire Department of Environmental Services (NHDES)
administers the program, and provides on-going technical assistance to reduce environmental
impacts while reducing operating costs, to members.
Costs Benefits $0
Free – no cost to apply, no membership fees.
Receive listing on the NHDES website and visitNH website link.
Validation as a Green, New Hampshire Hospitality Provider.
NHGHP logo to use for advertising.
Receive certificate in recognition of green initiatives, to display to guests.
Bi-annual surveys encourage continual improvement.
Discussion
Completing the NHGHP application is WFC’s next step in pursuing membership. The application’s
requirements, which guide or precede other work, justify placing it at the front of the list of
recommended initiatives. The NHGHP application is broken down into 10 sections: Administrative,
Waste Management, Water Conservation, Energy Conservation, Housekeeping, Landscaping, Pools
& Spas, Kitchen & Food, Other Initiatives, and Measurement (reporting). WFC can use descriptions
of current initiatives, provided in this plan’s appendix, to complete corresponding sections of the
application.
Completing the Administration section requires adopting an Environmental Policy Statement and
an Environmentally Preferable Purchasing Policy; examples of both are included in Addendum A.
The Administration section also requires designation of an Environmental Team or representative
and a proposal for a new initiative for implementation within 2 years of submitting the application.
Recommended Initiatives
Page | 7
The Measurement section assists the applicant in tracking energy usage, water usage, and waste
generation. Tracking use and generation in these areas facilitates decision-making, better
management, and allows monitoring of progress.
Recommendations
I recommend that WFC designate the Buildings and Grounds committee as being responsible for
overseeing initiative development and implementation, on the NHGHP application.
I suggest WFC adopt the example Environmental Policy Statement and Environmentally Preferable
Purchasing Policy, included in the appendix. WFC should feel empowered to edit either or both
policies, to fit their needs and practices.
WFC should include descriptions of current initiatives, considered elective on the application, to
receive credit and document actions taken.
Rain Barrel Installation
Background
Rain barrels collect water from a roof, or any other impervious surface, and store it for later use.
Homeowners use the collected water for watering lawns and gardens. The water collected would
otherwise become “storm water runoff”. Impervious surfaces restrict water from soaking into the
ground, prolonging contact with the land surface. Storm water runoff can become contaminated
with pollutants during the prolonged contact with land surfaces, and consequently transport these
pollutants to bodies of water. Storm water is of importance in urban and developed areas, where
there are fewer opportunities for runoff to seep into the ground and more opportunities for
contamination. In rural and minimally developed areas, impervious surfaces alter natural rainfall
runoff and can damage sensitive ecosystems.
Costs Benefits
Barrel $0.00 - $160.00
Accessories (spigot, diverter,
overflow kit) $12.00 - $30.00
Inexpensive and easy to install.
Reduces storm water runoff and associated water
pollution.
Rainwater is not treated (e.g. chlorine, fluoride).
Reduced waste water treatment costs
No salts added that can accumulate in soil
Conspicuous, easily reproduced, example of
environmental stewardship.
Recommended Initiatives
Page | 8
Recommendations
The rain barrel installation should occur within 2 years of submitting the New Hampshire Green
Hospitality Program membership application. Detailed instructions on rain barrel construction are
in the appendixi.
I recommend purchasing the rain barrel locally, at Clark’s Blue Seal, in Ossipee, New Hampshire
($16.95/55gal). The rain barrel can be installed next to Lloyd Lodge. A suitable location will be
under an existing downspout, conspicuous to visitors, and near existing garden beds. Decorating
the barrel provides an opportunity to engage with guests regarding water issues and actions WFC
is taking to address them.
Energy Tracking (Electricity and Propane)
Background
Measuring and tracking energy use will enable WFC to monitor and manage progress. Establishing
a baseline year helps in the decision-making process, when considering and comparing initiatives
to implement (i.e., larger use areas have the greatest potential for reduction). WFC can also use
baseline and annual use data to credit reductions to specific initiatives, based on the timing of
implementation and succeeding reduction.
Costs Benefits
$0 Identify high-impact areas for action.
Compare usage from year to year.
Attribute reductions to specific initiatives.
Implementation
Option 1: Eversource Green Button
Note: Green Button service only applies to electricity consumption.
The Green Button initiative came about in response to a White House call-to-action to provide
customers with streamlined, user-friendly, electronic access to their energy usage dataii. For WFC
to access their electricity usage via the Green Button, WFC must register for an online Eversource
account. WFC can consolidate all buildings to one online account. Once registered, WFC can opt
for paperless billing by signing-up for e-bill.
Recommended Initiatives
Page | 9
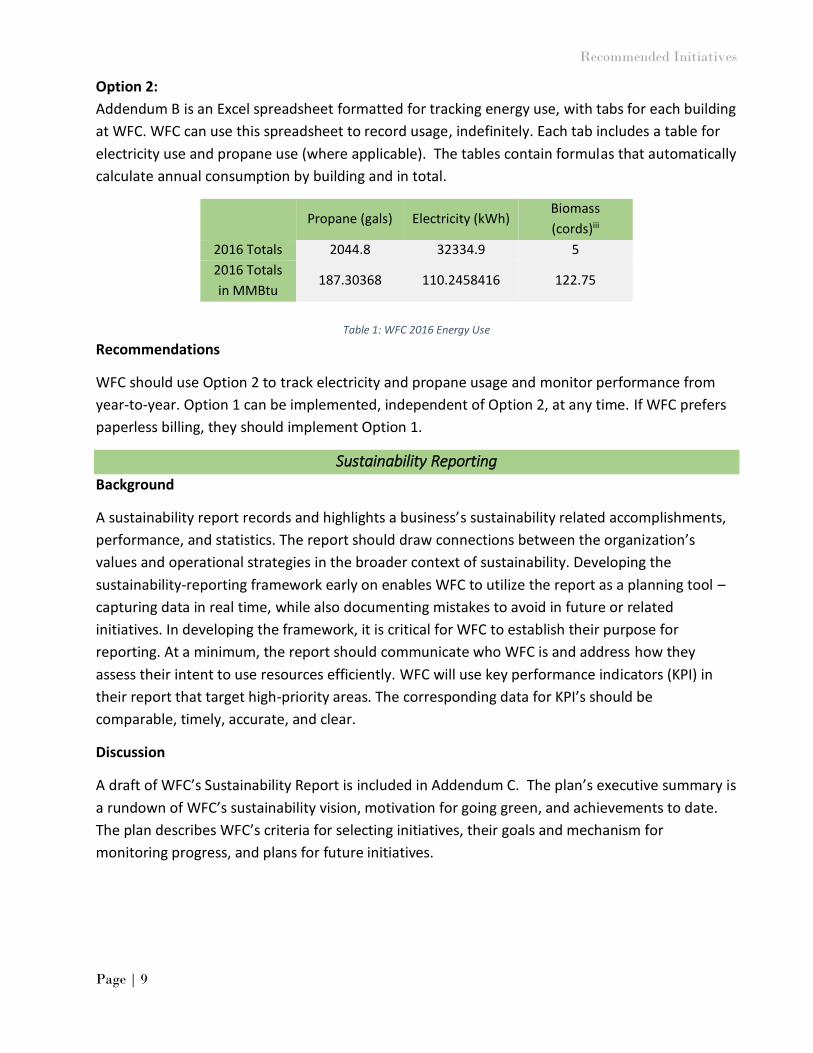
Option 2:
Addendum B is an Excel spreadsheet formatted for tracking energy use, with tabs for each building
at WFC. WFC can use this spreadsheet to record usage, indefinitely. Each tab includes a table for
electricity use and propane use (where applicable). The tables contain formulas that automatically
calculate annual consumption by building and in total.
Propane (gals) Electricity (kWh) Biomass
(cords)iii
2016 Totals 2044.8 32334.9 5
2016 Totals
in MMBtu 187.30368 110.2458416 122.75
Table 1: WFC 2016 Energy Use
Recommendations
WFC should use Option 2 to track electricity and propane usage and monitor performance from
year-to-year. Option 1 can be implemented, independent of Option 2, at any time. If WFC prefers
paperless billing, they should implement Option 1.
Sustainability Reporting
Background
A sustainability report records and highlights a business’s sustainability related accomplishments,
performance, and statistics. The report should draw connections between the organization’s
values and operational strategies in the broader context of sustainability. Developing the
sustainability-reporting framework early on enables WFC to utilize the report as a planning tool –
capturing data in real time, while also documenting mistakes to avoid in future or related
initiatives. In developing the framework, it is critical for WFC to establish their purpose for
reporting. At a minimum, the report should communicate who WFC is and address how they
assess their intent to use resources efficiently. WFC will use key performance indicators (KPI) in
their report that target high-priority areas. The corresponding data for KPI’s should be
comparable, timely, accurate, and clear.
Discussion
A draft of WFC’s Sustainability Report is included in Addendum C. The plan’s executive summary is
a rundown of WFC’s sustainability vision, motivation for going green, and achievements to date.
The plan describes WFC’s criteria for selecting initiatives, their goals and mechanism for
monitoring progress, and plans for future initiatives.
Recommended Initiatives
Page | 10
Recommendations
WFC can use the draft sustainability report as a starting point, filling in data for key performance
indicators as that information becomes available. WFC can make the adopted report available on
their website to meet the objective of transparent internal and external communications. The
document will also be useful for building sustainability branding.
Energy Efficient Lighting Upgrades
Background
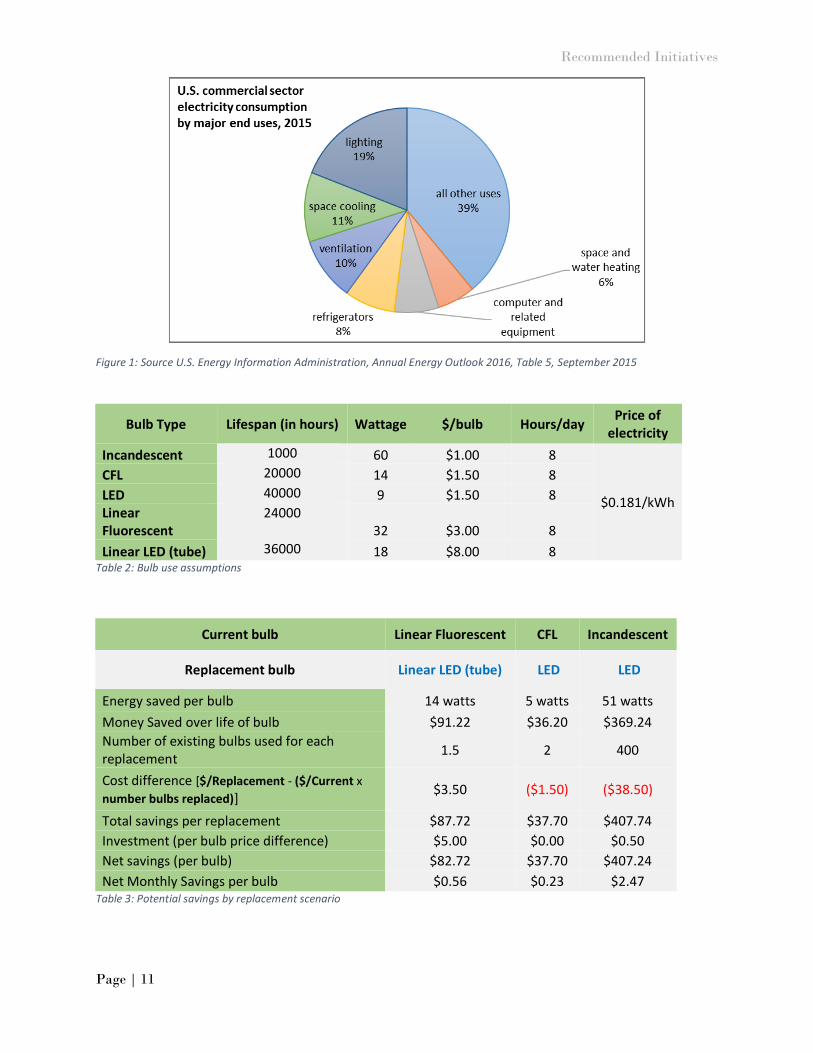
Electricity used for lighting is the largest end use category in the U.S. commercial sector and the
second largest end use category in the U.S. residential sectorvi. WFC has implemented an initiative
to replace all incandescent light bulbs with compact fluorescent lamps (CFLs) as they burn out.
WFC should revise this initiative to include replacing linear fluorescent (tube) lamps with light
emitting diode (LED) lamps, and replacing remaining incandescent bulbs with LEDs
Discussion
The potential savings listed in table 3 were estimated using a web base calculator, and the
assumptions described in table 2vii.
All scenarios result in reduced electricity consumption and cost savings. Cost savings is determined
by daily use, kWh price, and replacement bulb efficiency gain. Replacing bulbs as they burn out
distributes capital investment over time, making implementation more feasible, and fully utilizes
the bulb’s embodied energy. Replacing bulbs before burn out accelerates the acquisition of
savings. For example, in the incandescent to LED scenario, replacing an incandescent bulb 500
hours before burn out results in a $4.61 savings over the same period:
[51 watts x 500 hours x 0.001 kWh/watt x $0.181/kWh].
Costs
$1.50 - $8.00 per bulb
Labor
Benefits
LEDs have a longer lifespan
Reduced environmental impacts with LEDiv,v
Reduce operation cost
Recommended Initiatives
Page | 11
Figure 1: Source U.S. Energy Information Administration, Annual Energy Outlook 2016, Table 5, September 2015
Bulb Type Lifespan (in hours) Wattage $/bulb Hours/day Price of
electricity
Incandescent 1000 60 $1.00 8
$0.181/kWh
CFL 20000 14 $1.50 8
LED 40000 9 $1.50 8 Linear Fluorescent
24000 32 $3.00 8
Linear LED (tube) 36000 18 $8.00 8 Table 2: Bulb use assumptions
Current bulb Linear Fluorescent CFL Incandescent
Replacement bulb Linear LED (tube) LED LED
Energy saved per bulb 14 watts 5 watts 51 watts
Money Saved over life of bulb $91.22 $36.20 $369.24
Number of existing bulbs used for each replacement
1.5 2 400
Cost difference [$/Replacement - ($/Current x
number bulbs replaced)] $3.50 ($1.50) ($38.50)
Total savings per replacement $87.72 $37.70 $407.74
Investment (per bulb price difference) $5.00 $0.00 $0.50
Net savings (per bulb) $82.72 $37.70 $407.24
Net Monthly Savings per bulb $0.56 $0.23 $2.47 Table 3: Potential savings by replacement scenario
Recommended Initiatives
Page | 12
Recommendations
If incentives become available, lowering replacement costs, WFC should move forward with re-
lamping before burn out. Otherwise, WFC should continue replacing bulbs as they burn out,
using the replacement scenarios described in table 3.
Lighting and Plug-load Controls
Background
The U.S. Department of Energy identified lighting and plug-in load controls as target areas to
reduce wasted electricityviii.
Lighting controls turn lights on and off, automatically. Examples include occupancy sensors,
manual timers, and dimmers. Lighting controls can reduce electricity used for lighting by as
much as 30%ix. Turning lights off upon exiting, and using task lighting, furthers this initiative
where WFC cannot implement controls.
Plug-in loads account for roughly 33% of energy consumed in commercial and residential
buildingsx. Plug-in loads are primarily controlled by turning devices off when not in use. The
tendency to forget to power down devices can be managed with manual timers. This is more
practical when usage conforms to a predictable and static schedulexi. Some devices enter a
standby mode, by design, and continue to consume electricity – accounting for 5 -10 percent of
U.S. residential energy usexii. Advanced power strips (APS) and cooperative management can be
employed to reduce this “parasitic” load.
Costs Benefits
Advanced power strip - $9 Reduce wasted electricity
Occupancy sensors $15-$50 (Rebates available) Communicate sources of wasted electricity
Manual Timer - $13
Discussion
WFC can communicate practices to reduce wasted energy on their website, and at point of use
(e.g., turn off the light signage). Point of use signage should describe and encourage the
desired behavior, and communicate the benefits of complying. WFC can design signage to
include metrics regarding environmental and cost benefits. Communication is important in
managing plug-load, considering it is not feasible, or necessary, to unplug every electronic
Recommended Initiatives
Page | 13
device. Focusing on higher impact devices will conserve energy and is a manageable
approachxiii.
Advanced power strips use a control outlet and multiple accessory outlets. When a device
plugged into the control outlet is turned off, power is terminated to all accessory outlets. For a
computer station, an APS could conserve approximately 20 watts
by terminating power to speakers and a printer plugged into
accessory outlets.xiv. For a computer station that remains idle 16
hours/day, using an APS would save $21 annually:
[20 watts x 16 hours/day x 365 days x 0.001 kWh/watt x
$0.181/kWh].
This equates to a 5-month simple payback for a $9 APS.
WFC can use manual timers to manage plug-load control on
devices that conform to a schedule, for example, coffee makers
and lamps. Timers can control individual devices, or groups of
devices plugged into a single power strip. A typical coffee maker
and microwave consume a total of 2 watts and 3 watts,
respectivelyxv. Installing a manual timer to be off from 11pm –
5am (6hrs), would conserve 30 watts per day or $1.09 annually:
[30 watts/day x 200 days/year x 0.001 kWh/watt x $0.181/kWh].
This translates into a 12-year simple payback for a $13 timer.
Recommendations
WFC should purchase and install advanced power strips for the
office’s computer stations. Installing two APS will result in a $42
annual savings.
While installing manual timers would result in minor savings, I recommend not pursuing
implementation now, as they could be disruptive to guests.
The main tenet and value of this initiative lies in promoting energy conservation. Point of use
signage is a suitable means to inform efforts, and likely to lead to engagement with guests and
staff, compared with installing low-profile devices.
WFC can address power consumption of future purchases in their Purchasing Policy, by
requiring electronic equipment be ENERGY STAR qualified and/or Electronic Product
Environmental Assessment Tool (EPEAT) registered – which use less standby power compared
with standard equipment.
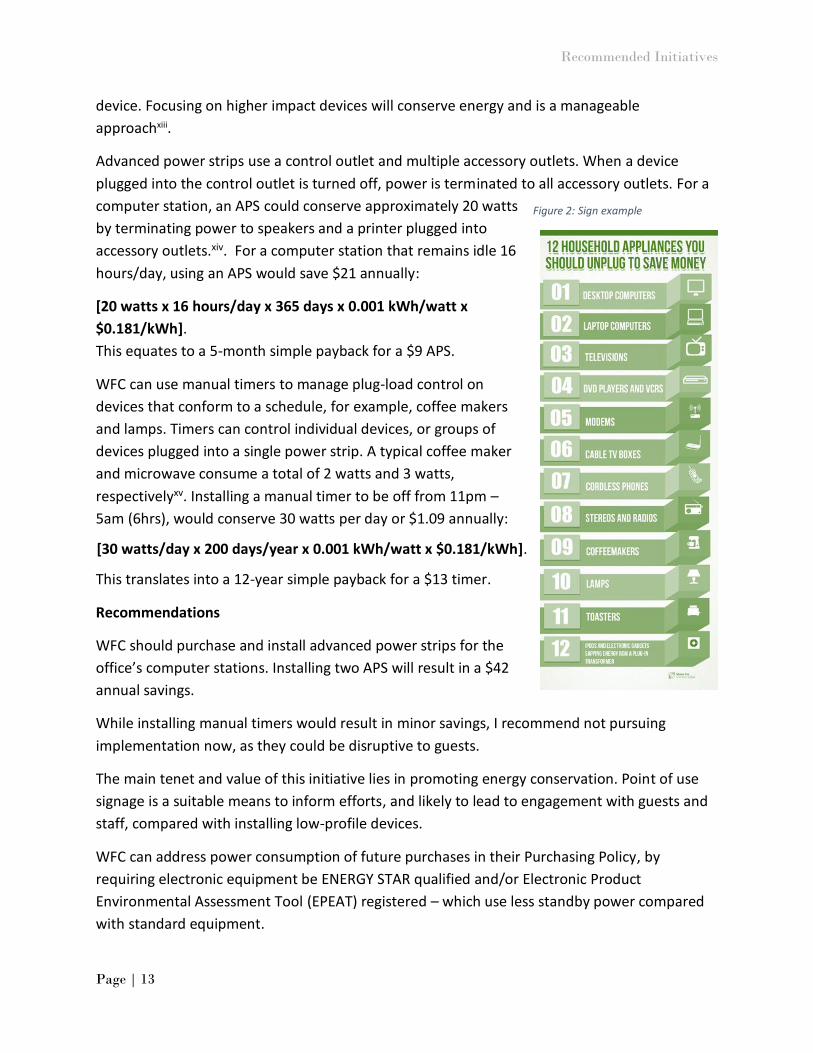
Figure 2: Sign example
Recommended Initiatives
Page | 14
The proposed Environmental policy indicates “WFC continually seeks out opportunities to
improve their energy conservation efforts.” Accordingly, for new construction, WFC should
consider incorporating lighting control technology where appropriate (e.g., bathrooms, storage
areas).
Water Heater Insulating Blankets
Background
Energy consumed for water heating accounts for 7% of U.S. commercial building total use, and
17% of U.S. residential building total usexvi. Among U.S. lodging facilities that report natural gas
usage, 51% of natural gas is used for water heating. (Note: no data could be found for propane.)
Insulating the water tank reduces standby heat loss and can cut water-heating costs by 7%-
16%xvii.
The water heater tank located in the Cape has an insulating blanket, which WFC installed prior
to this action plan. WFC should consider insulating eligible water heater tanks at Uphaus,
Weller, and the Cottage. The newest and most efficient system, located in Lloyd Lodge, would
not benefit from additional tank insulation and accounts for ~ 60% of hot water usage.
Costs Benefits $30/tank (materials) Reduced water-heating costs.
Labor - $20/hour
Discussion
The three tanks to be insulated account for 30% of WFC hot water use. Applying 2016 propane usage
(2045 gallons), a 7% reduction in water heating costs equates to a savings of $74.
[2045 gallons x 30% H.W. x 0.51 water heating x 0.07 reduction x $3.40/gallon]
Insulating the remaining three tanks would result in a simple payback of 2 years.
[Materials - $30 x 3 + Labor 3 hours @ $20/hour = $150]
Recommendations
I recommend installing an insulating blanket at Uphaus, which represents approximately 20% of hot
water use. An insulating blanket here would save 15 gallons of propane, and have a simple payback of
1 year.
Recommended Initiatives
Page | 15
ENERGY STAR Replacements
Background
ENERGY STAR is a U.S. Environmental Protection Agency (EPA) program that assesses products and
practices, based on their energy efficiency performance. ENERGY STAR qualified appliances and
electronics use 10-50% less energy than standard appliances, and often have improved performance
in other areas, such as reduced water usexviii.
Appliances and electronic devices under consideration for ENERGY STAR replacements in this
initiative are: refrigerators, dishwashers, clothes washers & dryers, pre-rinse sprayers, and
computers.
Costs Benefits
Cost of replacement Reduced energy consumption.
Reduced water consumption (dishwasher and
clothes washer).
Discussion
WFC should consider replacement costs along with the reduction of energy consumption, and
associated cost savings. Actual savings depends on replacement efficiency gains, and the amount of
time the appliance or device spends in use. Another way to consider this is in terms of simple
payback: [ 𝑖𝑛𝑖𝑡𝑖𝑎𝑙 𝑖𝑛𝑣𝑒𝑠𝑡𝑚𝑒𝑛𝑡
𝐴𝑛𝑛𝑢𝑎𝑙 𝑠𝑎𝑣𝑖𝑛𝑔𝑠 , 𝑤ℎ𝑒𝑟𝑒 𝐴𝑛𝑛𝑢𝑎𝑙 𝑠𝑎𝑣𝑖𝑛𝑔𝑠 =
$
𝑘𝑊ℎ∗ ((
𝐻𝑜𝑢𝑟𝑠 𝑈𝑠𝑒𝑑
𝑌𝑒𝑎𝑟 (Pcurrent - Preplacement )∗
0.001𝑘𝑊
𝑤𝑎𝑡𝑡), and P is power in watts]. The U.S. EPA and Department of Energy developed Excel-based
calculators to estimate the cost savings of upgrading to ENERGY STAR certified equipmentxix. The
results of this calculator, adjusted for WFC’s typical usage, are in table 3. These calculations deliver
the cost benefit of early equipment replacement – which is replacing the equipment before it stops
working. Cumulative savings is another way to assess cost benefits of early replacement. Cumulative
savings is the sum of the total annual cost savings, minus the initial investment. The early
replacement scenario contextually defines initial investment as the replacement purchase price. In
contrast, the scenario of replacing failed equipment defines initial investment as the price difference
between potential replacements. Positive cumulative savings or simple payback shorter than the
equipment’s assumed lifetime validate considering early replacement. The Purchasing Policy
addresses replacing failed or retired equipment, giving preference to products that conserve energy,
water, and other natural resources (i.e., ENERGY STAR units).
Cumulative savings = (Assumed lifetime x Annual Savings) - initial investment.
Early replacement Initial investment = Purchase price
Current unit end of life replacement
Initial investment= ENERGY STAR unit price - Conventional unit price
Recommended Initiatives
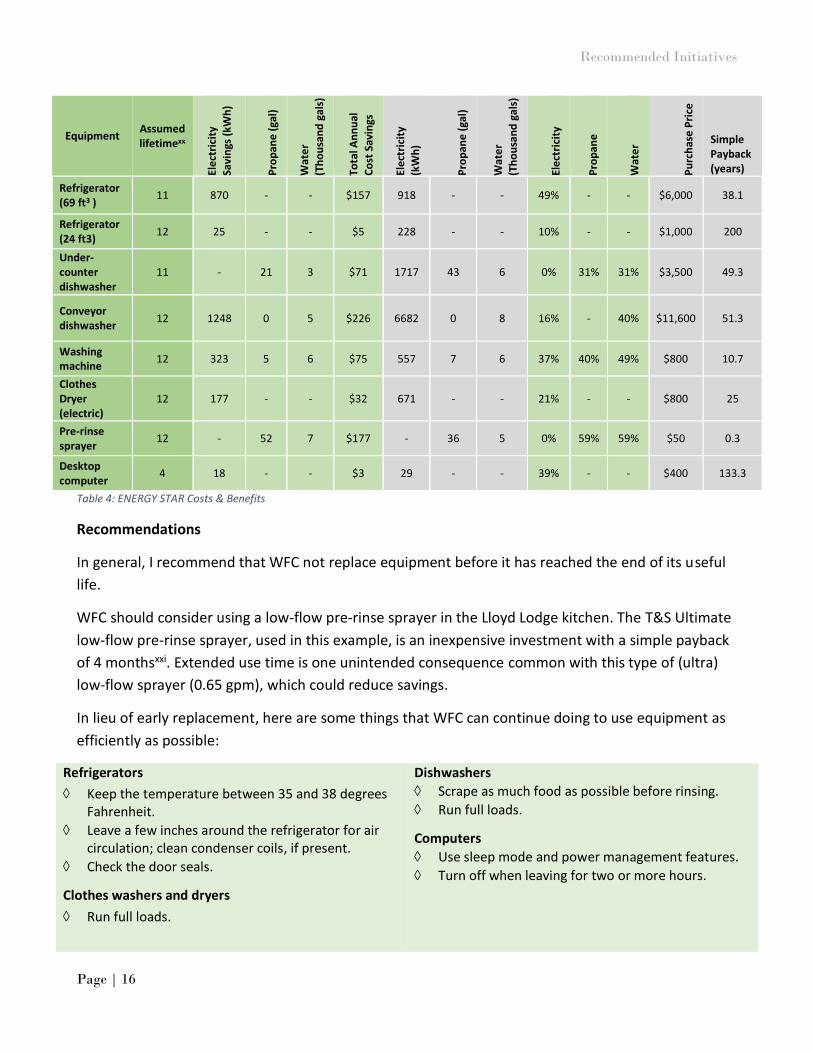
Page | 16
Equipment Assumed lifetimexx
Ele
ctri
city
Sa
vin
gs (
kWh
)
Pro
pan
e (
gal)
Wat
er
(Th
ou
san
d g
als)
Tota
l An
nu
al
Co
st S
avin
gs
Ele
ctri
city
(k
Wh
)
Pro
pan
e (
gal)
Wat
er
(Th
ou
san
d g
als)
Ele
ctri
city
Pro
pan
e
Wat
er
Pu
rch
ase
Pri
ce
Simple Payback (years)
Refrigerator (69 ft3 )
11 870 - - $157 918 - - 49% - - $6,000 38.1
Refrigerator (24 ft3)
12 25 - - $5 228 - - 10% - - $1,000 200
Under-counter dishwasher
11 - 21 3 $71 1717 43 6 0% 31% 31% $3,500 49.3
Conveyor dishwasher
12 1248 0 5 $226 6682 0 8 16% - 40% $11,600 51.3
Washing machine
12 323 5 6 $75 557 7 6 37% 40% 49% $800 10.7
Clothes Dryer (electric)
12 177 - - $32 671 - - 21% - - $800 25
Pre-rinse sprayer
12 - 52 7 $177 - 36 5 0% 59% 59% $50 0.3
Desktop computer
4 18 - - $3 29 - - 39% - - $400 133.3
Table 4: ENERGY STAR Costs & Benefits
Recommendations
In general, I recommend that WFC not replace equipment before it has reached the end of its useful
life.
WFC should consider using a low-flow pre-rinse sprayer in the Lloyd Lodge kitchen. The T&S Ultimate
low-flow pre-rinse sprayer, used in this example, is an inexpensive investment with a simple payback
of 4 monthsxxi. Extended use time is one unintended consequence common with this type of (ultra)
low-flow sprayer (0.65 gpm), which could reduce savings.
In lieu of early replacement, here are some things that WFC can continue doing to use equipment as
efficiently as possible:
Refrigerators
Keep the temperature between 35 and 38 degrees Fahrenheit.
Leave a few inches around the refrigerator for air circulation; clean condenser coils, if present.
Check the door seals.
Clothes washers and dryers
Run full loads.
Dishwashers
Scrape as much food as possible before rinsing.
Run full loads.
Computers
Use sleep mode and power management features.
Turn off when leaving for two or more hours.
Recommended Initiatives
Page | 17
Sustainability Branding & Marketing
Background
Identifying the target segment and Brand Purpose are critical elements to forming a sustainable
branding plan. Brand purpose is described by expanding on what WFC does better than similar
businesses, and how does WFC receive funds. WFC’s target segment are progressive minded
individuals, families, and organizations seeking immersion in New Hampshire’s beautiful White
Mountains. The marketing plan aims to penetrate the market segment and attract more guests,
visitors, and donors. In other words, the Branding Plan is about growth (profit and constituency) as
well as social awareness.
Building Sustainability Branding
Building the brand begins with the vision of how WFC wishes to be portrayed. WFC has a long history
of implementing and modeling sustainable best practices. That history and activism makes WFC more
than just a summer camp with a social conscience, and is important to communicate with potential
guests. Pursuing certification in the New Hampshire Hospitality Program will help WFC establish their
brand, and validates the sustainable initiatives WFC has implemented.
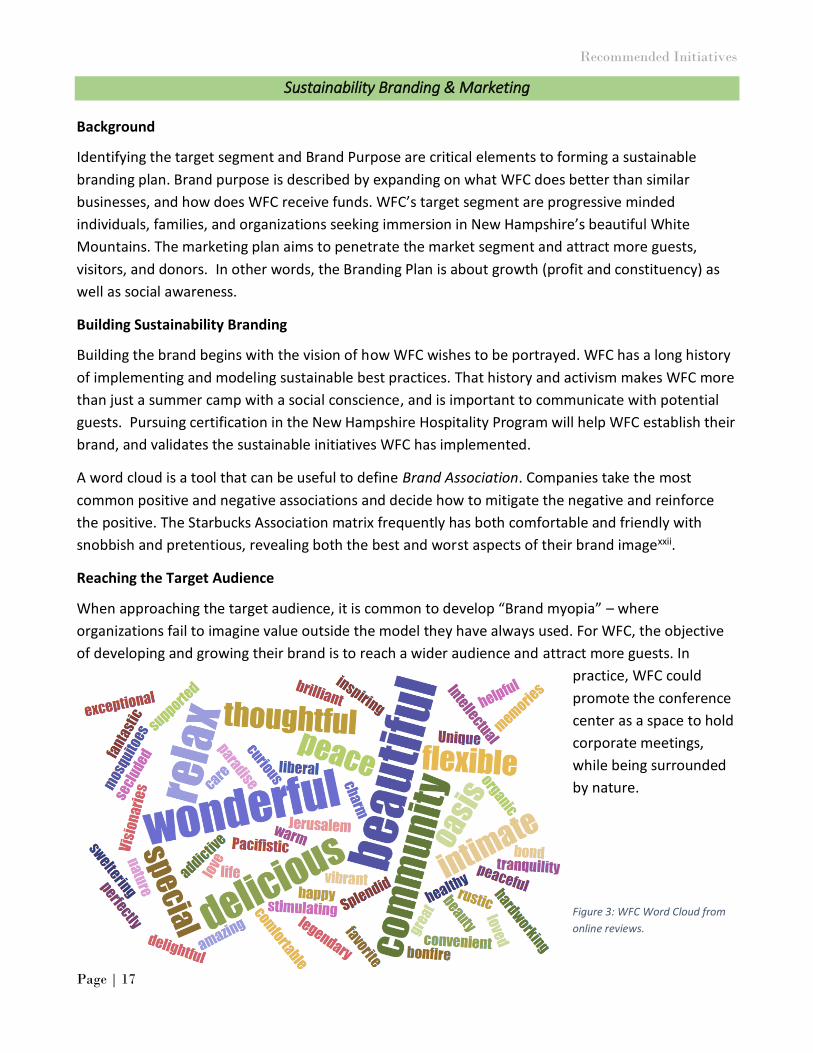
A word cloud is a tool that can be useful to define Brand Association. Companies take the most
common positive and negative associations and decide how to mitigate the negative and reinforce
the positive. The Starbucks Association matrix frequently has both comfortable and friendly with
snobbish and pretentious, revealing both the best and worst aspects of their brand imagexxii.
Reaching the Target Audience
When approaching the target audience, it is common to develop “Brand myopia” – where
organizations fail to imagine value outside the model they have always used. For WFC, the objective
of developing and growing their brand is to reach a wider audience and attract more guests. In
practice, WFC could
promote the conference
center as a space to hold
corporate meetings,
while being surrounded
by nature.
Figure 3: WFC Word Cloud from
online reviews.
Fostering Sustainable Behavior
Page | 18
Fostering Sustainable Behavior Behavior change is indispensable in achieving sustainability. A quick look at the history of World
Fellowship Center reveals that a deliberate intent to further change by providing a setting that
inspires models, and cultivates change has existed since the center’s conception. It was present
in the founding slogan “In a time of war, prepare for peace”, and reflected in their mission
today: to promote peace and social justice through education and dialogue inspired by nature.
WFC has intuitively engaged in an approach resembling the community-based social marketing
strategy described by McKenzie-Mohrxxiii. Community-based social marketing is broken down
into four steps: uncovering barriers and selecting behaviors, designing strategies, piloting, and
evaluating. The use of this systematic process at WFC is discussed below.
Uncovering Barriers and Selecting Behaviors
Key to developing a successful community-based social marketing strategy is deciding which
behaviors to promote, and identifying the barriers preventing the behavior’s adoption by the
community. WFC’s goal to minimize waste exposes multiple behaviors to target, for example,
reducing the use of disposable cups. Target behaviors should be non-divisible, end-state actions
– or the final desired action, rather than precursors to an outcome. Barriers here include
availability of reusable cups, and the inconvenience of returning cups for cleaningxxiv.
Designing Strategies
The objective of designing a community-based social marketing strategy is to reduce barriers,
while simultaneously raising awareness of the benefits associated with the target behaviorxxv.
Successful strategy development can take many forms, such as soliciting public commitment or
providing informational materials on benefits derived from the desired change. To reduce the
use of disposable cups, WFC simply stopped providing them to guests.
Piloting
The pilot phase tests the efficacy of the strategy designed in the prior step, within a restricted
audience. Strategies that proceed without a sound understanding of real or perceived barriers
have a greater probability of failing during the pilot phase. Conversely, an unsuccessful pilot is
an opportunity to revamp the strategy, and re-pilot until the desired level of change is realized.
Evaluation
Evaluation of strategy effectiveness underscores the importance of measuring outcomes (e.g.,
disposable cups purchased) rather than anecdotal evidence or personal testimony. WFC should
evaluate the recommended initiatives described within this SAP to confirm that they produce
the intended change. For example, kitchen staff may use the low-flow pre-rinse sprayer for
longer durations, resulting in no net change of water use, or worse, an increase.
Sustainability Capital Reserve
Page | 19
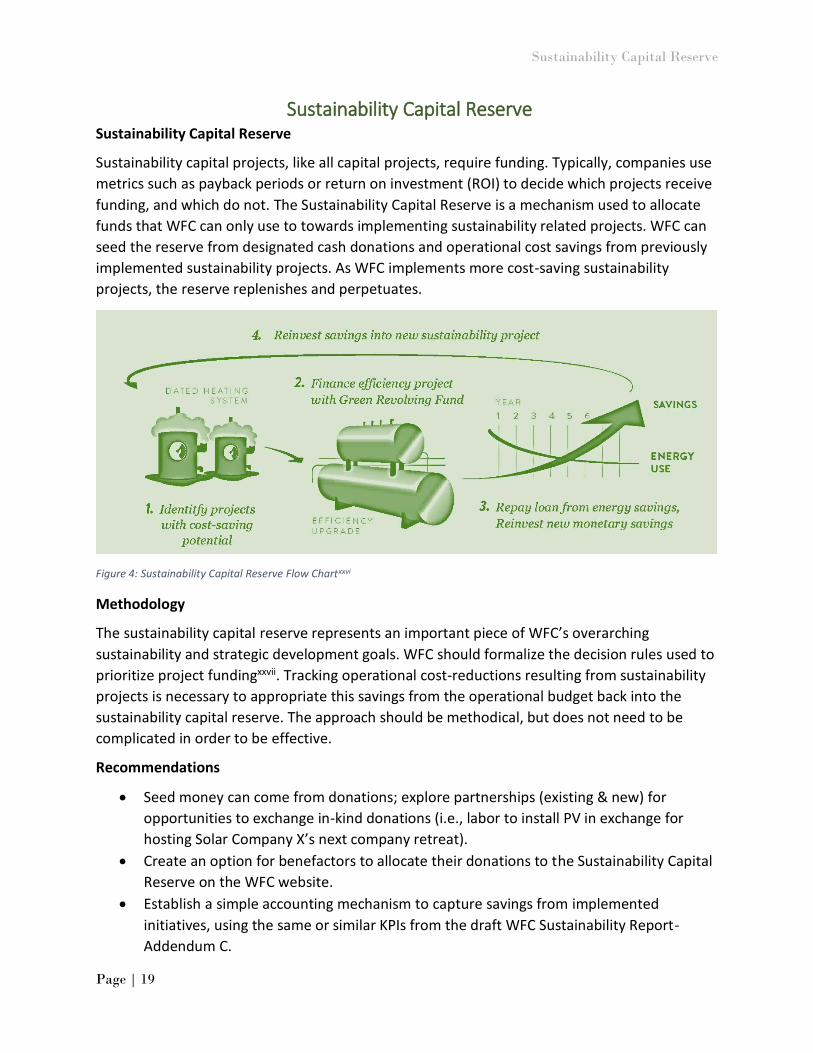
Sustainability Capital Reserve Sustainability Capital Reserve
Sustainability capital projects, like all capital projects, require funding. Typically, companies use
metrics such as payback periods or return on investment (ROI) to decide which projects receive
funding, and which do not. The Sustainability Capital Reserve is a mechanism used to allocate
funds that WFC can only use to towards implementing sustainability related projects. WFC can
seed the reserve from designated cash donations and operational cost savings from previously
implemented sustainability projects. As WFC implements more cost-saving sustainability
projects, the reserve replenishes and perpetuates.
Figure 4: Sustainability Capital Reserve Flow Chartxxvi
Methodology
The sustainability capital reserve represents an important piece of WFC’s overarching
sustainability and strategic development goals. WFC should formalize the decision rules used to
prioritize project fundingxxvii. Tracking operational cost-reductions resulting from sustainability
projects is necessary to appropriate this savings from the operational budget back into the
sustainability capital reserve. The approach should be methodical, but does not need to be
complicated in order to be effective.
Recommendations
Seed money can come from donations; explore partnerships (existing & new) for
opportunities to exchange in-kind donations (i.e., labor to install PV in exchange for
hosting Solar Company X’s next company retreat).
Create an option for benefactors to allocate their donations to the Sustainability Capital
Reserve on the WFC website.
Establish a simple accounting mechanism to capture savings from implemented
initiatives, using the same or similar KPIs from the draft WFC Sustainability Report-
Addendum C.
Performance Metrics & Reporting
Page | 20
Performance Metrics & Reporting Comparable, accurate key performance indicators (KPIs) are the infrastructure for measuring
performance. The draft WFC Sustainability Report (Addendum C) uses KPIs to communicate
current standings in WFC focus areas, with the intention of eventually comparing performance
at different time points. This function is critical to WFC’s ability to track progress towards
sustainability goals as well as initiative efficacy. WFC can use additional KPIs, to provide
perspective surrounding the conditions at WFC during the assessment period. For example,
occupancy percentage, or rooms occupied ÷ rooms available, for a specific period may explain
fluctuations in energy use, during that period. Another less tangible, yet useful, KPI is customer
satisfaction. Customer satisfaction can be difficult to measure, but will be helpful in adjusting
and creating buy-in with initiative planning.
Selecting Key Performance Indicators
As mentioned earlier, KPIs should be comparable, timely, accurate and clear. WFC can use the
KPIs listed in Table 5 to monitor and communicate their progress in key areas. The development
of new goals may require additional KPIs.
Key Performance Indicator Source Focus Area
Total electricity consumption Utility bills Energy consumption
Total propane consumption Utility bills Energy consumption
Renewable energy consumption Cord wood delivered; installed capacity (i.e., 5kW solar PV)
Source of energy
Scope 1&2 GHG emissions Calculated from utility bills GHG emissions
Percentage of organically maintained gardens/landscaping
Calculated ratio Impact to ecosystem
Total water consumption Water metering* Water conservation
Water consumed for agricultural activities
Water metering* Water conservation
Customer satisfaction Web based feedback form* Guest experience
Occupancy (“fill” measure) Rooms occupied ÷ rooms available
Contextualize other KPIs; justify increasing capacity
Average number of guests per night Calculated from occupancy ÷ time
Contextualize other KPIs
* Mechanism not currently available. Table 5: WFC Key Performance Indicators
Performance Metrics & Reporting
Page | 21
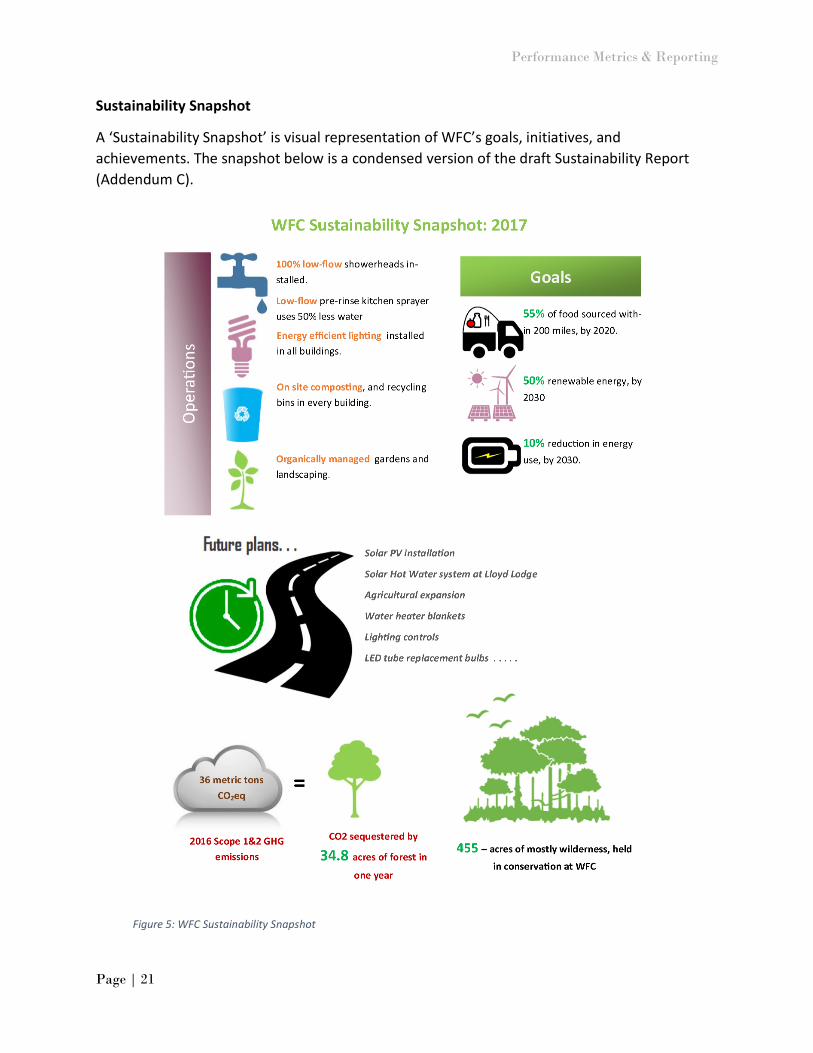
Sustainability Snapshot
A ‘Sustainability Snapshot’ is visual representation of WFC’s goals, initiatives, and
achievements. The snapshot below is a condensed version of the draft Sustainability Report
(Addendum C).
Figure 5: WFC Sustainability Snapshot
Future Initiatives
Page | 22
FUTURE INITIATIVES
Solar PV Installation
Background
Solar photovoltaic systems produce clean, renewable electricity at competitive prices. Grid-
connected systems contribute to the greater good by reducing peak loads, which in New
Hampshire coincide with times of principal solar productivity. Photovoltaics also have value for
off-grid applications, where providing electricity from existing utility lines is prohibitively
expensive. The solar PV marketplace is constantly changing – tax incentives described below
expire in 2019; more efficient and less expensive technologies are emerging; the New
Hampshire Public Utilities Commission is renegotiating the net metering exchange rate, such
that utilities would pay consumers wholesale rates rather than the current 1:1 model. Given the
dynamic climate of the PV market, it is more sensible to discuss static benefits of investing in
solar electricity – such as energy independence, cost savings, and no emissions.
Discussion
WFC can either purchase or lease solar photovoltaic panels. Solar panel leases or power
purchase agreements (PPAs) reduce or eliminate the upfront costs, and typically provide a 15-
30% cost savings for electricity, compared with utility provider rates. With a PPA, the installer
owns the equipment and receives all tax credits and other financial incentives, including
renewable energy credits (RECs). ReVision Energy is a local installer experienced in drafting
PPAs for non-profits. ReVision leverages federal tax credits, accelerated depreciation, and state
rebates to transfer ownership to the host as soon as possible. Alternatively, if the host is not
interested in owning the system, the same benefits are leveraged to reduce the price the host
pays for PV generated electricity.
WFC can finance the purchase of a solar system with a loan. For a 5kW system, loan payments
would be approximately the same as the cost of purchasing the electricity from the gridxxviii. As
a non-profit, WFC would need a tax equity partner in order to take advantage of federal tax
credits available for solar installations.
Costs Benefits
$3.36/watt (purchased) or $17k/5kW $0.12-0.14/kWh (PPA)
RECs $55/MWh 30% federal tax credit. Generates no CO2, SO2, NOx, Pb, Hg. NH Public Utilities Commission rebate - $0.65/watt, up to 25% of project cost. Added value to building/campus infrastructure. Net metering.
Future Initiatives
Page | 23
Recommendations
If WFC moves forward with purchasing a PV system, I recommend that they look for an eligible
tax equity partner internally (e.g., board members). The 30% federal tax credit on a $17,000
(5kW) system equals $5,100; NH Public Utilities Commission rebates on this same system are
$3250 - - bringing the cost of this system down to $8,650. I recommend siting the first
installation at the Cape, because it is occupied year round, and consumes electricity
consistently throughout the year.
If WFC is unable to find a tax equity partner, pursuing a PPA remains a good and viable option.
WFC pays the highest price for electricity used at Lloyd Lodge, in part because of intensity and
related demand charges. Lloyd Lodge accounts for 63% of the electricity consumed at WFC,
and because of demand charges has the highest kWh costs on campus. A leased solar
installation and PPA with a $0.04/kWh reduction would result in a cost savings of $812/year at
Lloyd Lodge.
20,292 𝑘𝑊ℎ ∗$0.04
𝑘𝑊ℎ= $811.68
WFC could sequester cost savings from the PPA in the Sustainability Capital Reserve, to finance
purchasing and installing additional PV systems. It is possible for WFC to pursue both
aforementioned options simultaneously – i.e. purchasing a PV installation and signing a PPA, to
accelerate growth of the Sustainability Capital Reserve and expedite implementation of future
projects.
Solar Hot Water Installation
Background
Propane is the primary fuel used to heat water at WFC. Solar hot water (SHW) systems take
advantage of the sun to heat water, reducing costs by displacing expensive fuel with free solar
energy. In 2015, WFC selected the propane fired hot water system installed at Lloyd Lodge in
part because of its readiness to tie-in with solar thermal collectors. Lloyd Lodge uses the most
hot water on campus, making it a prime location for a solar hot water installation.
Discussion
WFC’s main objective in pursuing SHW is to reduce propane consumption. The center
consumes approximately 2,100 gallons of propane per year for cooking and heating water.
Lloyd Lodge (presumably) accounts for 60% of this consumption; approximately half of that
propane, or 630 gallons, is consumed heating water. Therefore, the goal of the SHW system is
to abate this 630 gallons, potentially saving $2142/year [630 gal. x $3.40/gal.].
Future Initiatives
Page | 24
The 30% federal tax credit available for solar PV also applies to SHW installations. NH Public
Utilities Commission provides rebates equal to $0.12/rated kBtu/yearxxix.
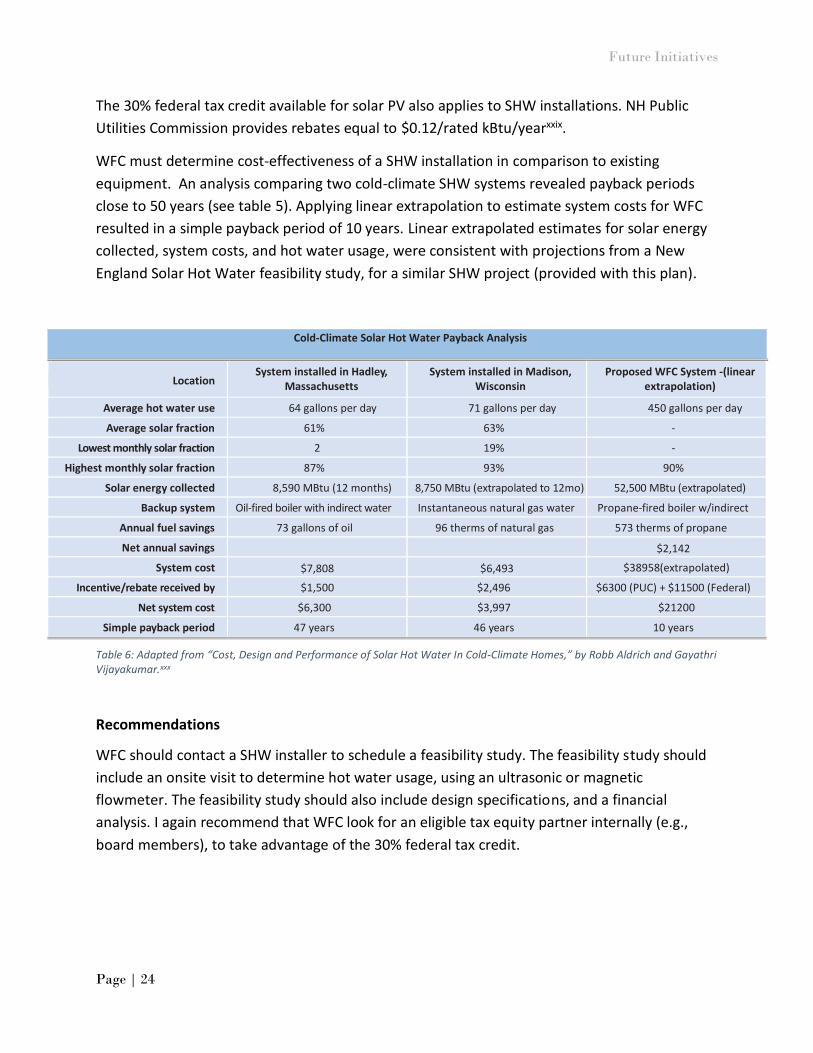
WFC must determine cost-effectiveness of a SHW installation in comparison to existing
equipment. An analysis comparing two cold-climate SHW systems revealed payback periods
close to 50 years (see table 5). Applying linear extrapolation to estimate system costs for WFC
resulted in a simple payback period of 10 years. Linear extrapolated estimates for solar energy
collected, system costs, and hot water usage, were consistent with projections from a New
England Solar Hot Water feasibility study, for a similar SHW project (provided with this plan).
Cold-Climate Solar Hot Water Payback Analysis
Location System installed in Hadley,
Massachusetts System installed in Madison,
Wisconsin Proposed WFC System -(linear
extrapolation)
Average hot water use 64 gallons per day 71 gallons per day 450 gallons per day
Average solar fraction 61% 63% -
Lowest monthly solar fraction (December)
28%
19% -
Highest monthly solar fraction (August)
87% 93% 90%
Solar energy collected 8,590 MBtu (12 months) 8,750 MBtu (extrapolated to 12mo) months)
52,500 MBtu (extrapolated)
Backup system Oil-fired boiler with indirect water heater
Instantaneous natural gas water heater
Propane-fired boiler w/indirect
Annual fuel savings 73 gallons of oil 96 therms of natural gas 573 therms of propane
Net annual savings $2,142
System cost $7,808 $6,493 $38958(extrapolated)
Incentive/rebate received by homeowner
$1,500 $2,496 $6300 (PUC) + $11500 (Federal)
Net system cost $6,300
0
$3,997 $21200
Simple payback period including rebate
47 years 46 years 10 years
Table 6: Adapted from “Cost, Design and Performance of Solar Hot Water In Cold-Climate Homes,” by Robb Aldrich and Gayathri Vijayakumar.xxx
Recommendations
WFC should contact a SHW installer to schedule a feasibility study. The feasibility study should
include an onsite visit to determine hot water usage, using an ultrasonic or magnetic
flowmeter. The feasibility study should also include design specifications, and a financial
analysis. I again recommend that WFC look for an eligible tax equity partner internally (e.g.,
board members), to take advantage of the 30% federal tax credit.
Future Initiatives
Page | 25
Agriculture Expansion
Background
WFC’s organic vegetable gardens were established under the leadership of Christoph and
Kathryn Schmauch, who directed the center from 1970-2001. The Schmauch’s used gardening
as a way to connect with the local community, and to produce vegetables for guest
consumption. WFC seeks to expand agricultural operations and cultivated land, initially for in-
house consumption, with a long-term goal of pursuing a community supported agriculture
(CSA) like model.
Discussion
Expanding gardening is harmonious with WFC’s mission and vision to promote environmental
harmony, provide opportunities to enjoy and learn about nature, and model organic
agricultural practices. Expansion offers cost-saving opportunities, and is a continuation of WFC’s
commitment to locally sourcing products. Agricultural activities will also help WFC differentiate
itself as a sustainable business, following the sustainable branding & marketing initiative
described earlier. Making parts of the agriculture operations (e.g.; harvesting, canning,
weeding) available for guest participation fulfills WFC’s vision, and resembles the well-
established agritourism business model, where agritourists participation in agricultural
activities is central to the business model.
Recommendations
1) Establish proportion of agriculture products currently provided by WFC gardens, as a
baseline key performance indicator.
2) Engage with guests and staff to determine their interest in participating in gardening
activities. There are several ways this can be accomplished –i.e., interviews, surveys,
questionnaires or question on guest registration.
3) Set S.M.A.R.T goals (Specific, Measureable, Attainable, Relevant, Timely) regarding
expansion (e.g., cultivate additional 1 acre for perennial berries by May 2018). The
measurability of the goal will allow progress to be quantified.
4) Canvass WFC contacts for advice and potential future partnerships.
a) Would Temple-Wilton Farm be interested in sharing resources with WFC?
5) Utilize resources available on the University of New Hampshire website for varietal
selection and planning. Another aspect to keep in mind during planning is how the
harvesting season aligns with occupancy. The implication being better crop utilization when
peak harvest times overlap with peak occupancy.
Roadmap
Page | 26
ROADMAP WFC can implement the initiatives described within this action plan using the roadmap outlined
below. The roadmap describes initiative objectives and a schedule to implement the
recommended initiatives.
Initiative Objectives Schedule
Adopt Environmental Policy Statement
NH Green Hospitality Program (NHGHP) prerequisite; define WFC's sustainability vision.
June 2017
Adopt Purchasing Policy NHGHP prerequisite; Standardize procurement decision rules.
June 2017
Designate environmental representative or team
Manage implementation of sustainability initiatives; NHGHP prerequisite.
June 2017
Submit NHGHP membership application
Sustainability Branding; 3rd party verification of sustainability practices.
June 2017
Agriculture Expansion – Survey
Gauge guest interest in participating with gardening.
June-August 2017
Low-flow pre-rinse sprayer
Conserve water; reduce propane used for heating water.
July 2017
Sustainability Capital Reserve
Capture savings from sustainability initiatives for future green projects.
August 2017
Solar Hot Water Feasibility Study
Provide financial analysis, design specs for SHW installation.
August 2017
Rain Barrel Installation Model of sustainable practice; conserve water.
September 2017
Energy Tracking Record energy consumption, monitor and reporting on performance.
Initiated. (Ongoing data entry)
Water Heater insulating blankets
Improve water heater performance; reduce propane usage.
October 2017
Lighting upgrades Reduce electricity used for lighting. Initiated and ongoing.
Lighting Controls for new construction
Reduce electricity used for lighting. Contemporaneous with
construction planning.
Guest Garden Beds Pilot garden expansion project. May 2018
Solar PV Installation Renewable energy source. Resiliency against energy price volatility.
May 2020
Addendum A
Page | 27
Addendum A Example of Environmental Policy/Mission Statement:
World Fellowship Center is committed to protecting the environment, the health and safety of our employees, and the community in which we conduct our business. It is our policy to seek continual improvement throughout our business operations to lessen our impact on the local and global environment by conserving energy, water and other natural resources; reducing waste generation; recycling and; reducing our use of toxic materials. We are committed to environmental excellence and pollution prevention, meeting or exceeding all environmental regulatory requirements, and to purchasing products which have greater recycled content with lower toxicity and packaging, that reduce the use of natural resources.
Environmentally Preferable Purchasing (EPP) Policy
Sample 1
Preference will be given to purchasing products and services that have the following environmentally friendly attributes with acceptable parameters for price, quality, and delivery:
Maximizes post-consumer recycled content.
Minimizes packaging and other wastes.
Minimizes toxicity.
Are durable and reusable.
Are more locally available to minimize transportation.
Are made from sustainably produced materials.
Are compostable or biodegradable.
Conserves energy, water, and other natural resources.
Sample 2
The goal of this policy is to ensure that products and services purchased or contracted for conform to the goals of our company’s environmental policy. We will strive, where feasible, to purchase environmentally preferable products and services to meet the company’s office and operational needs. We will also favor suppliers who strive to improve their environmental performance, provide environmentally preferable products, and who can document the supply chain impacts of their efforts.
Wherever possible, purchasing decisions will favor products and feedstocks that:
Reduce greenhouse gas emissions.
Are made with renewable energy.
Reduce pollution from all discharges (releases to air, water, and land).
Reduce the use of toxic materials hazardous to the environment, employees and public health.
Contain the highest possible percentage of post-consumer recycled content, followed by percentage of recycled content.
Reduce packaging and other waste.
Are energy efficient.
Conserve water.
Are reusable and/or durable.
Minimize transportation (local sources, concentrated products).
Serve several functions (for example, copiers/printers, multipurpose cleaners) to reduce the overall number of products purchased.
Environmentally preferable products and services that are comparable in quality to their standard counterparts will receive a purchasing preference. In situations where the most environmentally preferable product is unavailable or impractical, secondary considerations will include production methods and the environmentally and socially responsible management practices of suppliers and producers. Environmentally preferable purchasing is part of our long term commitment to the environment. By sending a clear signal to producers and suppliers about this commitment, we hope to support wider adoption of environmentally preferable products and practices.
Addendum B
Page | 28
Addendum B Energy Tracking (Electricity and Propane usage)
Electricity Consumption
Building & Year
Month kWh
January 0
February 0
March 0
April 0
May 0
June 0
July 0
August 0
September 0
October 0
November 0
December 0
Total
Propane Consumption
Propane (gallons)
December – January 20xx 0.0
Total Campus Electricity Consumption
Year
Month kWh
January 0
February 0
March 0
April 0
May 0
June 0
July 0
August 0
September 0
October 0
November 0
December 0
Total
In Excel, totals will populate from
Building & Year monthly entries, using
Excel formula: =sum(number 1, number
2, . . )
Addendum C
Page | 29
Addendum C
EXECUTIVE SUMMARY INITIATIVES ACCOUNTING FUTURE PLANS
Sustainability Vision
At WFC, sustainability is part of strategic development plan – but it does not stop there.
Sustainability is ever-present in our thoughts, shaping our decisions, and resulting in creative
solutions and new initiatives. For WFC, sustainability is a process of continuous improvement.
How can we use less energy? How can we reduce our water use? What can we do to
reduce waste? We ask these questions in the context of expanding capacity and improving
our guest’s experience.
Benefits
Our commitment to sustainable operations pays us back in a multitude of ways. We have
discovered and implemented initiatives to lower operating expenses, which also help us build
resiliency and self-sufficiency into operations. Savings from these initiatives allows us to do
more. From improving amenities and our physical campus to providing financial assistance to
kindred organizations with limited funding – the savings permits more action on our behalf,
while emphasizing efficient and responsible use of resources.
By modelling sustainability, we are taking a leadership position to help others uncover the
rewards of a sustainable lifestyle. This goes beyond promoting cost savings from switching out
light bulbs - - we are challenging ourselves, and our community to think about the
implications of our actions in a broader context.
Achievements
WFC has been busy putting sustainability into action! Here is a rundown of what we have
been doing: Applied to New Hampshire Green Hospitality Program (NHGHP) – this great program will
validate all of our sustainability initiatives and efforts. WFC will appear on their website as a
“Green Hospitality Provider” and can use the NHGHP logo for advertising.
Adopted an Environmentally Preferable Purchasing Policy – to standardize our procurement
processes and formally incorporate sustainability as part of this decision-making mechanism.
Established a baseline for current energy consumption – we crunched the numbers to
provide a starting point for setting energy efficiency improvement goals. You can see the
numbers in the Accounting section.
Created a Sustainability Capital Reserve – also referred to as a Green Revolving Fund, this
accounting tool tracks operational cost-reductions resulting from our sustainability projects,
and appropriates this savings to finance future sustainability improvements.
Installed a rain barrel at Lloyd Lodge - this allows us to use even less well water in caring for
our native, draught resistant landscaping around our main lodge. If you are interested in
installing your own rain barrel, here are some simple plans to get you started.
EXECUTIVE SUMMARY INITIATIVES ACCOUNTING FUTURE PLANS
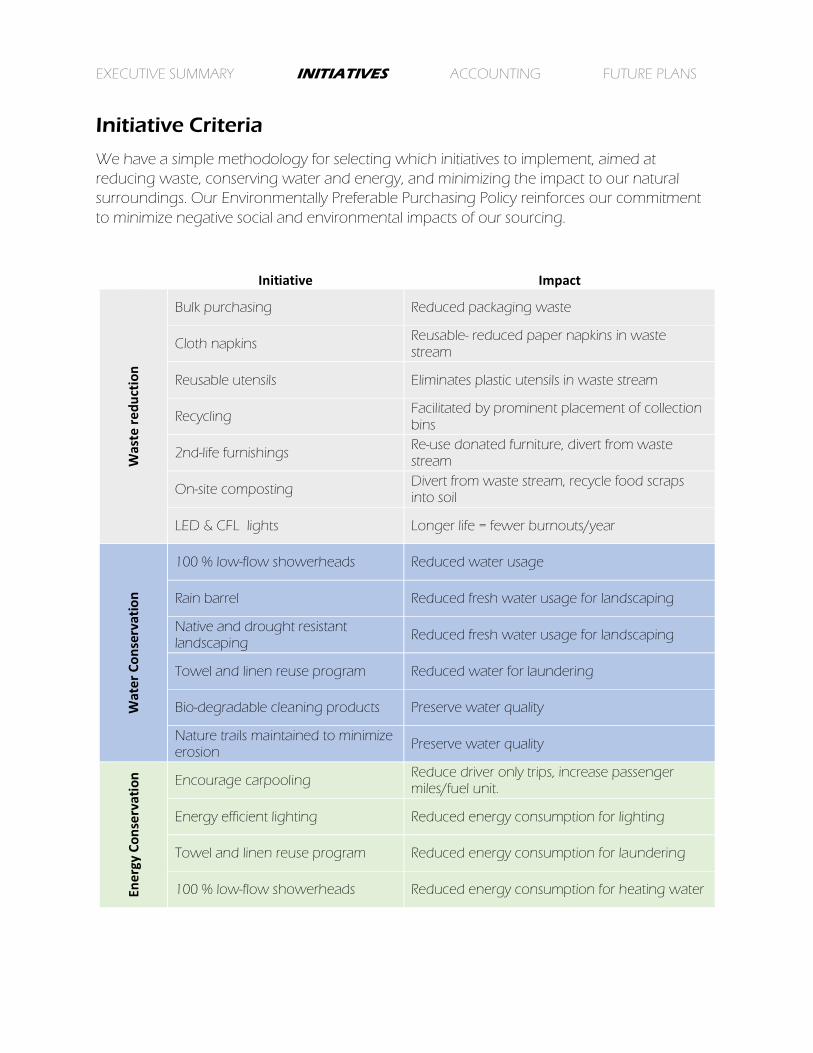
Initiative Criteria
We have a simple methodology for selecting which initiatives to implement, aimed at
reducing waste, conserving water and energy, and minimizing the impact to our natural
surroundings. Our Environmentally Preferable Purchasing Policy reinforces our commitment
to minimize negative social and environmental impacts of our sourcing.
Initiative Impact
Was
te r
ed
uct
ion
Bulk purchasing Reduced packaging waste
Cloth napkins Reusable- reduced paper napkins in waste stream
Reusable utensils Eliminates plastic utensils in waste stream
Recycling Facilitated by prominent placement of collection bins
2nd-life furnishings Re-use donated furniture, divert from waste stream
On-site composting Divert from waste stream, recycle food scraps into soil
LED & CFL lights Longer life = fewer burnouts/year
Wat
er
Co
nse
rvat
ion
100 % low-flow showerheads Reduced water usage
Rain barrel Reduced fresh water usage for landscaping
Native and drought resistant landscaping
Reduced fresh water usage for landscaping
Towel and linen reuse program Reduced water for laundering
Bio-degradable cleaning products Preserve water quality
Nature trails maintained to minimize erosion
Preserve water quality
Ene
rgy
Co
nse
rvat
ion
Encourage carpooling Reduce driver only trips, increase passenger miles/fuel unit.
Energy efficient lighting Reduced energy consumption for lighting
Towel and linen reuse program Reduced energy consumption for laundering
100 % low-flow showerheads Reduced energy consumption for heating water
Addendum C
Page | 32
“WFC uses only what is necessary, in an efficient and
thoughtful manner, always looking for new ways to
improve.”
EXECUTIVE SUMMARY INITIATIVES ACCOUNTING FUTURE PLANS
Goals
Total food expenditures grown/processed within 200 miles of WFC by 2020.
Reduction in Scope 1 & 2 greenhouse gas emissions by 2030.
Energy from renewable sources, by 2030.
Organic matter composted, by 2020.
Compostable matter sent to landfill, by 2020.
Performance Summary
We have set some ambitious goals to help us get where we want to be. We are tracking our
progress using 2016 as our baseline year, and the key performance indicators (KPI)
summarized below.
Total Electricity Consumption – 32,335
kWh
Scope 1&2 GHG Emissions – 36 metric
tons of CO2 equivalent (GtCO2eq)
Total Propane Consumption – 2045
gallons
Renewable Energy – 122.7 mmBTU (29%
of total)
Addendum C
Page | 33
EXECUTIVE SUMMARY INITIATIVES ACCOUNTING FUTURE PLANS
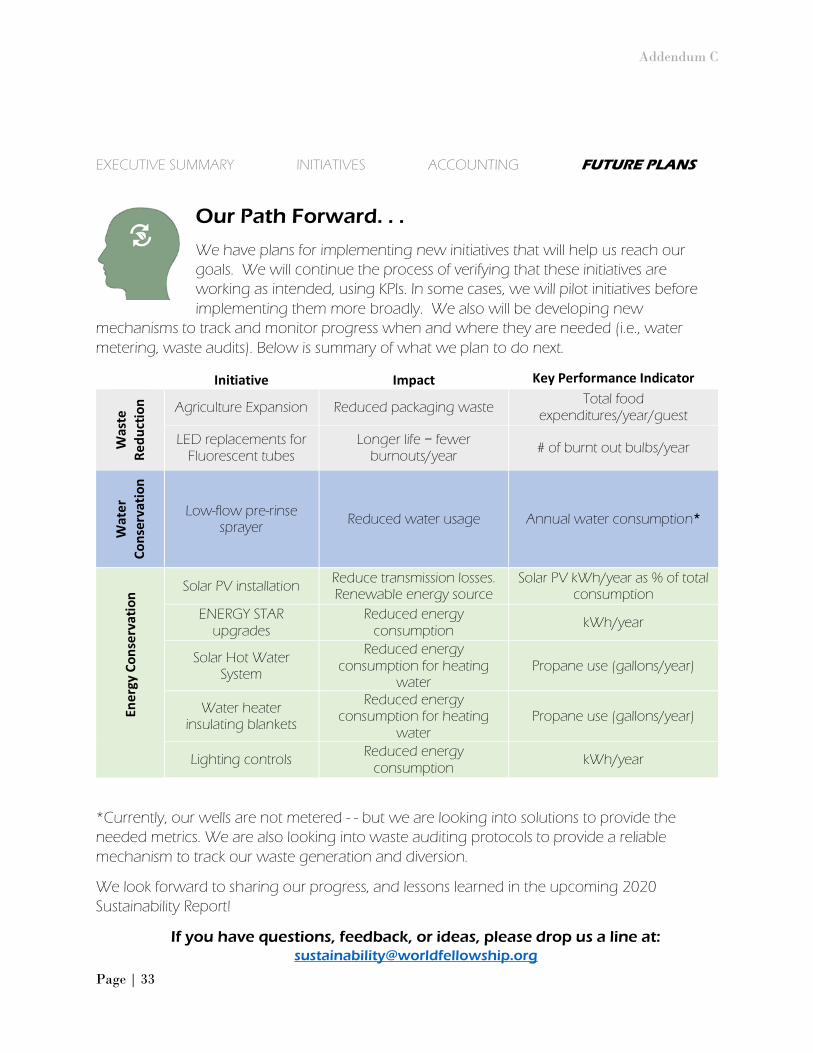
Our Path Forward. . .
We have plans for implementing new initiatives that will help us reach our
goals. We will continue the process of verifying that these initiatives are
working as intended, using KPIs. In some cases, we will pilot initiatives before
implementing them more broadly. We also will be developing new
mechanisms to track and monitor progress when and where they are needed (i.e., water
metering, waste audits). Below is summary of what we plan to do next.
Initiative Impact Key Performance Indicator
Was
te
Re
du
ctio
n
Agriculture Expansion Reduced packaging waste Total food
expenditures/year/guest
LED replacements for Fluorescent tubes
Longer life = fewer burnouts/year
# of burnt out bulbs/year
Wat
er
Co
nse
rvat
ion
Low-flow pre-rinse sprayer
Reduced water usage Annual water consumption*
Ene
rgy
Co
nse
rvat
ion
Solar PV installation Reduce transmission losses. Renewable energy source
Solar PV kWh/year as % of total consumption
ENERGY STAR
upgrades
Reduced energy
consumption kWh/year
Solar Hot Water System
Reduced energy consumption for heating
water Propane use (gallons/year)
Water heater insulating blankets
Reduced energy consumption for heating
water Propane use (gallons/year)
Lighting controls Reduced energy
consumption kWh/year
*Currently, our wells are not metered - - but we are looking into solutions to provide the
needed metrics. We are also looking into waste auditing protocols to provide a reliable
mechanism to track our waste generation and diversion.
We look forward to sharing our progress, and lessons learned in the upcoming 2020
Sustainability Report!
If you have questions, feedback, or ideas, please drop us a line at: [email protected]

Addendum C
Page | 34
Works Cited
Page | 35
Works Cited
i "Rain barrel construction." www.wku.edu/sustainability/documents/rainbarrelconstruction101.pdf. N.p., n.d. Web. 6 Feb. 2017. ii “Green Button Data” Green Button Alliance, 2015. www.greenbuttondata.org/index.html. Accessed 10 Feb. 2017. iii “Firewood BTU Ratings.” World Forest Industries, 2016. http://worldforestindustries.com/forest-biofuel/firewood/firewood-btu-ratings/. Accessed 11 Mar. 2017. iv Principi, Paolo, and Roberto Fioretti. "A Comparative Life Cycle Assessment of Luminaires for General Lighting for the Office – Compact Fluorescent ( CFL) Vs Light Emitting Diode ( LED) – a Case Study." Journal of Cleaner Production 83 (2014): 96-107. Print. v “Northeast ENERGY STAR® Residential Lighting Initiative.” Northeast Energy Efficiency Partnerships, 2016. www.neep.org/sites/default/files/resources/Northeast_Lighting_Incentive_Summary.pdf. Accessed 13 Mar. 2017. vi “How is Electricity used in U.S. Homes?” U.S. Energy Information Administration, 2016. https://www.eia.gov/tools/faqs/faq.php?id=96&t=3, Accessed 28 Mar. 2017. vii “Energy Savings Calculator.” Bulbs.com, 2017. www.bulbs.com/learning/energycalc.aspx. Accessed 14 Feb. 2017. viii “Decision Guides for Plug and Process Load Controls.” U.S. Department of Energy, 2015. From: https://betterbuildingssolutioncenter.energy.gov/sites/default/files/attachments/Decision_Guides_for_PPL_Controls_0.pdf. Accessed 27 Mar. 2017. ix “Lighting Controls.” U.S. Department of Energy, 2016. https://energy.gov/energysaver/lighting-controls. Accessed 27 Mar. 2017. x “Decision Guides for Plug and Process Load Controls.” U.S. Department of Energy, 2015. From: https://betterbuildingssolutioncenter.energy.gov/sites/default/files/attachments/Decision_Guides_for_PPL_Controls_0.pdf. Accessed 27 Mar. 2017. xi “Plug Load Control.” GSA Public Building Service, 2012. Accessed from: www.gsa.gov/graphics/pbs/PlugLoadControl_508c.pdf, On 20 Feb. 2017. xii “3 Tips to Reduce Your Standby Power Loads.” U.S. Department of Energy, 2016. https://energy.gov/energysaver/articles/3-easy-tips-reduce-your-standby-power-loads. Accessed 2 Mar. 2017 xiii “12 Household Appliances You Should Unplug to Save Money.” Visually, 2014. http://visual.ly/12-household-appliances-you-should-unplug-save-money. Accessed 10 Mar. 2017. xiv “Plug-in Equipment Efficiency.” NRDC Issue Brief. NRDC, 2015. Accessed from: www.nrdc.org/sites/default/files/home-idle-load-plug-in-efficiency-IB.pdf, On 20 Feb. 2017. xv “Ranges of Standby Power.” Lawrence Berkeley National Laboratory, 2015. http://standby.lbl.gov/summary-table.html. Accessed 5 Mar. 2017. xvi “Energy Explained: Use of Electricity.” U.S. Energy Information Administration, 2017. www.eia.gov/energyexplained/index.cfm/data/index.cfm?page=electricity_use. Accessed 17 Feb. 2017.
Works Cited
Page | 36
xvii “Savings Project: Insulate Your Water Heater Tank.” U.S. Department of Energy, 2016. https://energy.gov/energysaver/projects/savings-project-insulate-your-water-heater-tank. Accessed 24 Feb. 2017. xviii “About ENERGY STAR.” U.S. Environmental Protection Agency, U.S. Department of Energy, 2017. https://www.energystar.gov/about. Accessed 1 Mar. 2017. xix “Building & Plants: Step 4 Estimate your Potential Savings.” U.S. Environmental Protection Agency, U.S. Department of Energy, 2017. www.energystar.gov/buildings/facility-owners-and-managers/existing-buildings/save-energy/purchase-energy-saving-products. Accessed 18 Mar. 2017. xx “Tools and Resources.” U.S. Environmental Protection Agency, U.S. Department of Energy, 2017. www.energystar.gov/buildings/tools-and-resources. Accessed 18 Mar. 2017 xxi “T&S B-0107-C Ultimate Low Flow Pre-Rinse Spray Valve - 0.65 GPM.” Webstaurant Store, 2017. www.webstaurantstore.com/. Accessed 27 Mar. 2017. xxii Tom Murphy, MBA (Visiting Assistant Professor, Marketing and Management, Graduate School of Management, Clark University) in email with author, April 2017. xxiii Mckenzie-Mohr, Doug. "Promoting Sustainable Behavior: An Introduction to Community-Based Social Marketing." Journal of Social Issues 56.3 (2000): 543. Print. xxivMckenzie-Mohr, Doug. “Fostering sustainable behavior: Beyond Brochures.” Journal of Social Sciences, 2008. http://www.uwsp.edu/cnr-ap/UWEXLakes/Documents/ecology/shoreland/marketing/3_07_ijsc_practice_dmm.pdf. Accessed 14 Apr. 2017. xxv Mckenzie-Mohr, Doug. “Fostering sustainable behavior: Beyond Brochures.” Journal of Social Sciences, 2008.
http://www.uwsp.edu/cnr-
ap/UWEXLakes/Documents/ecology/shoreland/marketing/3_07_ijsc_practice_dmm.pdf. Accessed 14 Apr. 2017.
xxvi “Green Revolving Funds: An Introductury Guide to Implementation & Management.” ICF& Sustainable Endowments Institute, 2013. http://greenbillion.org/wp-content/uploads/2013/01/GRF_Implementation_Guide.pdf. Accessed 11 Apr. 2017. xxvii “Green Revolving Funds: An Introductury Guide to Implementation & Management.” ICF& Sustainable Endowments Institute, 2013. http://greenbillion.org/wp-content/uploads/2013/01/GRF_Implementation_Guide.pdf. Accessed 11 Apr. 2017. xxviii “Economics of Renewable Energy.” ReVison Energy, 2016. https://www.revisionenergy.com/solar-investment-benefits-well-non-solar-neighbors/. Accessed 28 Mar. 2017. xxix “Commercial and Industrial (C&I) Solar Incentive Program”. An Official Website for New Hampshire Government, 2017. https://www.puc.nh.gov/Sustainable%20Energy/RenewableEnergyRebates-CI.html. Accessed 14 Apr. 2017. xxx “Cost, Design, and Performance of Solar Hot Water in Cold-Climate Homes.” U.S. Department of Energy, 2016. https://www1.eere.energy.gov/buildings/publications/pdfs/building_america/solar_hot_water_cold_climate.pdf. Accessed 2 Apr. 2017.