Embed Size (px)
Citation preview

World Fertilizer Model—The WorldNPK Model
Francisco Rosas
Working Paper 11-WP 520
April 2011
Center for Agricultural and Rural Development Iowa State University
Ames, Iowa 50011-1070 www.card.iastate.edu
Francisco Rosas is a PhD candidate and research assistant in the Department of Economics and Center for Agricultural and Rural Development at Iowa State University. Acknowledgments: The author thanks the David and Lucile Packard Foundation and the Biobased Industry Center (BIC) at Iowa State University for project funding. This paper is available online on the CARD Web site: www.card.iastate.edu. Permission is granted to excerpt or quote this information with appropriate attribution to the authors. Questions or comments about the contents of this paper should be directed to Francisco Rosas, 573 Heady Hall, Iowa State University, Ames, IA 50010; Ph.: (515) 294-6357; E-mail: [email protected]. Iowa State University does not discriminate on the basis of race, color, age, religion, national origin, sexual orientation, gender identity, genetic information, sex, marital status, disability, or status as a U.S. veteran. Inquiries can be directed to the Director of Equal Opportunity and Compliance, 3280 Beardshear Hall, (515) 294-7612."

Abstract
We introduce a world fertilizers model that is capable of producing fertilizer demand
projections by crop, by country, by macronutrients, and by year. For each crop, the most relevant
countries in terms of production, consumption, or trade are explicitly modeled. The remaining
countries are modeled, for each crop, within a regional aggregate. The nutrient coverage includes
nitrogen (N), phosphorous (P), and potassium (K). In this report we present the data and
procedures used to set up the model as well as the assumptions made. The fertilizer model
interacts with the yield equations of the FAPRI-ISU model (Food and Agricultural Policy
Research Institute at Iowa State University), and by means of a set of production elasticities,
projects each nutrient’s application rate per hectare for each commodity and each country
covered by the FAPRI-ISU model. Then, the application rates and the areas projected by FAPRI-
ISU are used to obtain projections of fertilizer demand from agriculture on a global scale. With
this fertilizer module, policies that directly affect fertilizer markets, such as input taxes or
subsidies, quantity use restrictions, and trade restrictions, can now be explicitly formulated and
evaluated. The effects of these policies on global agricultural markets and on greenhouse gas
emissions can be evaluated with the FAPRI-ISU model and the Greenhouse Gas in Agriculture
Simulation Model (GreenAgSiM). Also, any other policy affecting commodity markets such as
input and output price shocks, biofuels mandates, and land-use change can now be evaluated
with regard to its impacts on the world fertilizer markets.
Keywords: agriculture, fertilizer, nitrogen, phosphorous, policy analysis, potassium, projections.
JEL codes: Q10, Q11, Q18

1
Introduction The rising demand for agricultural commodities in order to satisfy demand for food, feed, and fuel has increased interest in the supply side of agricultural commodity markets. Extended periods of growth in developing countries have driven up the demand for food and feed. Also, recent policies that encourage the use of biofuels have resulted in an increased demand for agricultural commodities. These changes in global commodity markets have several environmental consequences that have also been in the center of attention in the international community. Fertilizers play an important role in the recent changes in global agricultural commodity markets. Fertilizer use is directly connected to the forces driving crop supply through the increase in productivity. The use of fertilizers in agriculture also has direct and indirect consequences for the environment. For these reasons, it is important to understand how fertilizers respond to changes in the global economy and how fertilizers interact with the crops for which they are used. We have developed a world fertilizer model, the WorldNPK model, that by interacting with a broader model of international commodity markets supplied by the Food and Agricultural Policy Research Institute at Iowa State University—the FAPRI-ISU model—allows us to determine and project the use of fertilizers in agriculture. The WorldNPK model covers three macronutrients individually: nitrogen (N), phosphorous (P), and potassium (K); 15 crops; and the most relevant countries and regions for each commodity in terms of production, consumption, or trade. The objective of this report is to describe the procedures used to set up the world fertilizer model (WorldNPK), as well as to discuss the assumptions made in the model. We also explain the planned extensions and improvements. The construction of the fertilizer model is divided into two stages.
First Stage. The model projects the quantities of N, P, and K demanded for each crop and for each country/region covered by the FAPRI-ISU model. Demand for each nutrient is obtained by projecting a fertilizer application rate that is crop-specific and country-specific as a function of the relevant variables affecting the farmer’s fertilization decision. Then, we use the crop areas projected by FAPRI together with the nutrient application rates to obtain a crop- and country-specific quantity demanded for each N, P, and K. Second Stage. The output of the model will be projections of crop- and country-specific nutrient (N, P, and K) quantities demanded as described in the first stage, and projections of world fertilizer prices at the nutrient level, such that they are consistent with a zero excess demand in each nutrient world market. We do this by introducing a nutrient-specific world supply curve and solve for an endogenous fertilizer price of equilibrium that clears the mentioned market.
The WorldNPK Model: A Demand Model The FAPRI-ISU model covers supply, demand, and international trade of 15 crops worldwide. The crops are wheat, corn, rice, barley, oats, sorghum, rye, soybeans, canola, rapeseed, sunflower seed, oil palm,
2
cotton, sugarcane, and sugar beet. Either individually or within a region, every country in the world is covered in the FAPRI model. In terms of crop production, FAPRI reports projections of harvested areas (AHH) and yields (YHH) for each country/region, among other relevant variables. The objective of the fertilizer model is to provide projections of quantities of fertilizer demanded that are nutrient/crop/country-specific. Each quantity demanded is obtained as the product of a fertilizer application rate (in kilograms per hectare) and a harvested area (in hectares).1 Our procedure is as follows. We first generate a fertilizer application rate per nutrient, crop, and country for selected base years (2006/07 and 2007/08). Second, we collect and construct fertilizer prices for each nutrient at the country level. Then, we incorporate these fertilizer rates and prices into the existing FAPRI-ISU model as part of the variable cost of production in each crop yield equation of the model. When the FAPRI model runs, the fertilizer rate reacts to changes in the relevant variables of the fertilizer decision process, conditional on the parameters of the model. It also projects each fertilizer rate for future years according to the dynamics embedded in the model. Finally, we multiply these fertilizer rates by the harvested areas projected by FAPRI, in order to obtain the desired quantities demanded of fertilizer by nutrient, by crop, and by country. In the rest of the report, we describe (1) how we obtain these fertilizer rates for the base years (i.e., an accounting model of fertilizer demand), and (2) how the interaction is implemented in a way that is not only consistent with the rest of the FAPRI-ISU model but is also consistent with the economics of fertilizer use in agriculture. The major benefits of developing this world fertilizer model are improving the existing FAPRI model as a consequence of the specific treatment of fertilizers used in agriculture, and responding to the general interest in fertilizer application rates and fertilizer demand projections at the nutrient, country, and crop levels. The Accounting Model We obtained an application rate for each nutrient, N, P, and K, that is crop and country specific. We used, in order of importance, the following data sources.
1. “Assessment of Fertilizer Use by Crop at the Global Level 2006/07 – 2007/08,” Patrick Heffer, International Fertilizer Industry Association, April 2009 (hereafter IFA 2009)
2. “Fertilizers Europe data base on nutrient application rate by crop”. Fertilizers Europe 2010 3. “Fertilizer Use by Crop”. FAO 2006 (hereafter FAO 2006) 4. “Fertilizer Use by Crop”. FAO 2002 (hereafter FAO 2002) 5. “Fertilizer Use by Crop for Specific Countries” FAO 2002-2005 (hereafter FAO 2002-2005) 6. “Agricultural Census” Ministry of Agriculture - Government of India 1986, 1991, 1996, and 2001
The IFA 2009 report provides the worldwide fertilizer consumption of the 23 bigger fertilizer consumer countries and the rest of the world (ROW). For each country it provides the demand (by nutrient) for each of the following crops: wheat, corn, rice, other cereals, soybeans, oil palm, other oilseeds, cotton, sugar
1 Note that throughout the model we use the term fertilizer application rate to refer to the more appropriate term, fertilizer use per harvested hectare.

3
crops, fruits and vegetables, and other crops. The years covered are the campaigns 2006/07 and 2007/08. We made extensive use of these statistics because they span the world, and to our knowledge this is the most updated report. Appendix A shows this dataset. The FAO 2006 report provides statistics on fertilizer use by nutrient and for several countries, and in some cases summarizes information provided in the “Fertilizer Use by Crop” for specific countries’ reports (FAO 2002-2005). The FAO 2002 study provides area, fertilizer rates, percentage of fertilized area, and fertilizer consumption by nutrients and by crop for 88 countries and for their most important crops. While this report covers most of the countries and crops of interest, data are from 1996 to 2000. Finally, the “Fertilizer Use by Crop” for specific countries contains detailed expositions of the cropping systems, fertilizer industry, and fertilizer use of the corresponding country, but it usually provides data that can be found in the previous reports. The crop- and country-specific nutrient application rates for the base years were obtained in three steps. Results are shown in Appendix B for each nutrient and for the base year 2007/08. First, we directly associated each of the 23 higher fertilizer consuming countries from IFA 2009 with the FAPRI countries for the following crops: wheat, corn, rice, soybeans, oil palm, and cotton. When a country in IFA 2009 was not individually reported by FAPRI, it was added to the ROW, for example, Chile or Iran in wheat. Depending on the crop, these 23 countries accounted for about 90% of the world fertilizer demand of that crop. Second, and for the same crops, we allocated what was reported as ROW by IFA 2009 to each of the remaining countries or regions in the FAPRI model. While this allocation accounts for about 10% of the world fertilizer demand, a significant amount of effort was put into finding the most appropriate fertilizer rate for each country. The allocation was done one crop at a time and required finding the most updated fertilizer application rate, collected from different sources. We first found a fertilizer rate for the highest producing countries of that particular crop; then, the remaining countries were assumed to lie on the same production function, and a fertilizer rate was calculated for each of them, such that those with lower yields were assumed to have a lower rate, and those with higher yields were assumed to have a higher rate. Third, once we completed these crops, we turned to the nutrient demands of “Other Coarse Grains,” “Other Oilseeds,” and “Sugar” reported in IFA 2009 that had to be distributed into the remaining crops in the FAPRI-ISU model (barley, sorghum, oats and rye; rapeseed/canola, peanut and sunflower seed, sugar beet, and sugarcane). Note that the categories “Other Coarse Grains” and “Other Oilseeds” in the IFA 2009 report include some crops not covered by FAPRI, such as triticale, millet, mustard, and copra. While FAPRI does not project the harvested areas of these crops, their demand will be taken into account in the barley, sorghum, oats, rye, canola, peanut, rapeseed, and sunflower seed commodities because their rates will be slightly overestimated. In the case of “Other Coarse Grains,” we took one country at a time and distributed the fertilizer demand from IFA 2009 into the four cereals (barley, sorghum, oats, and rye) covered by FAPRI. If FAPRI covered only one cereal for a certain country, all the demand was assigned to that crop. If there was more than one cereal, the demand was distributed proportional to the fertilizer rates from the most reliable source (FAO 2006, FAO 2002, or FAO 2002-2005). Similarly, we distributed the fertilizer demand of “Other Oilseeds” from IFA 2009 among rapeseed/canola, peanut, and sunflower

4
seed for the countries covered by FAPRI. We used the same procedure for the IFA 2009 fertilizer demand of “Sugar” that we distributed among sugar beet and sugarcane. Demonstration of Procedures We present in this section the cases of China, India, EU-27, and Ukraine to illustrate the procedures used. The first three, shown in Table 1, will help demonstrate the procedure used when IFA reported the crop-specific fertilizer demand for a given country, as these three countries represent more than 50% of the world fertilizer consumption (IFA 2009). Ukraine was chosen to illustrate the methodology used for the cases when FAPRI reports a country that was not individually reported by IFA 2009. Table 1 shows how fertilizer use by nutrients is reported by IFA. In the cases of wheat, rice, corn, soybeans, and cotton, we took the harvested area from FAPRI and directly obtained the fertilizer application rate for each nutrient. Table 1. Fertilizer use by crop in 2006/07 in China, India, and EU-27, extracted from the IFA 2009 report
Then, according to the IFA 2009 report, “Other Coarse Grains” includes barley, oats, rye, sorghum, triticale, millet, etc. So, for example, we needed to allocate among these crops China’s demand of 302,000 tons of nitrogen and the EU-27’s 1,719,000 tons of nitrogen. We distributed this quantity only among those crops covered by FAPRI (barley, oats, rye, and sorghum) and ignored the other crops not covered because we would not be able to give projections of fertilizer demand. While this will overestimate their crop-specific fertilizer demand, it will be closer at the nutrient’s aggregate level. To make this allocation, we found the N, P, and K rates in China, India, and EU-27 for each of the four crops from the most reliable source and proportionally distributed each total nutrient demand. In China, barley is the only relevant crop among these according to FAPRI, so we directly calculated the N rate as the ratio between the 302,000 tons and the FAPRI harvested area. For the case of Europe, our most reliable source is “Fertilizers Europe” (2010), which reports fertilizer application rates by nutrients for all crops in 2007/08. Given that FAPRI reports harvested areas of barley, oats, and rye in the EU-27, a fertilizer application rate was found for each crop such that it maintains the relationship between rates given by Fertilizers Europe 2010, and when multiplied by the areas from the FAPRI-ISU model it gives a total demand of 1,719,000 tons of N, 491,000 tons of P, and 460,000 of K. The assumption that the proportionality of fertilizer rates between crops remains constant implies that there was no structural change in the cropping system that affected only one of these crops; if there was any, it affected all of them equally.
Total % of World % Qty % Qty % Qty % Qty % Qty % Qty % Qty % Qty % Qty % Qty % QtyChina N 30,200 31.5% 14.1% 4,258 18.2% 5,496 16.1% 4,862 1.0% 302 1.5% 453 0.0% 6 4.8% 1,450 4.1% 1,238 1.5% 453 30.0% 9,060 8.7% 2,621
P2O5 11,600 30.3% 16.5% 1,914 15.3% 1,775 6.6% 766 1.0% 116 3.3% 383 0.0% 2 5.0% 580 3.9% 452 2.2% 255 34.0% 3,944 12.2% 1,413
K2O 5,800 21.4% 4.4% 255 28.0% 1,624 2.2% 128 1.0% 58 1.0% 58 0.1% 6 2.3% 133 1.2% 70 4.8% 278 50.0% 2,900 5.0% 290
N+P+K 47,600 29.5% 13.5% 6,427 18.7% 8,895 12.1% 5,755 1.0% 476 1.9% 894 0.0% 14 4.5% 2,163 3.7% 1,760 2.1% 987 33.4% 15,904 9.1% 4,325India N 13,773 14.4% 21.0% 2,892 30.0% 4,132 2.5% 344 4.5% 620 1.0% 138 0.0% 0 4.5% 620 6.5% 895 5.0% 689 7.0% 964 18.0% 2,479
P2O5 5,543 14.5% 20.0% 1,109 25.0% 1,386 1.5% 83 5.0% 277 2.5% 139 0.0% 0 7.0% 388 8.0% 443 4.5% 249 11.0% 610 15.5% 859
K2O 2,335 8.6% 8.0% 187 34.0% 794 1.0% 23 2.5% 58 1.0% 23 0.0% 0 5.0% 117 5.5% 128 10.0% 234 22.0% 514 11.0% 257
N+P+K 21,651 13.4% 19.3% 4,188 29.2% 6,312 2.1% 451 4.4% 955 1.4% 300 0.0% 0 5.2% 1,125 6.8% 1,467 5.4% 1,172 9.6% 2,088 16.6% 3,595EU-27 N 10,746 11.2% 26.0% 2,794 0.4% 43 12.0% 1,290 16.0% 1,719 0.1% 11 0.0% 0 9.2% 989 0.5% 54 2.1% 226 7.5% 806 26.2% 2,815
P2O5 3,091 8.1% 19.5% 603 0.5% 15 13.2% 408 15.9% 491 0.3% 9 0.0% 0 8.2% 253 0.7% 22 3.6% 111 13.4% 414 24.7% 763
K2O 3,592 13.2% 12.7% 456 0.9% 32 11.9% 427 12.8% 460 0.3% 11 0.0% 0 9.9% 356 0.6% 22 5.9% 212 14.4% 517 30.6% 1,099
N+P+K 17,429 10.8% 22.1% 3,853 0.5% 91 12.2% 2,125 15.3% 2,671 0.2% 31 0.0% 0 9.2% 1,598 0.6% 97 3.1% 549 10.0% 1,737 26.8% 4,678
CEREALS OILSEEDSWheat Other CropsRice Other CG Oil Palm Other OS Sugar Crops Fruits & Veg.Maize Soybean Cotton

5
The same criterion was used to allocate each country’s fertilizer demand of “Other Oilseeds” from IFA 2009 into rapeseed, peanuts, and sunflower (others such as mustard and safflower were not considered because they are not projected by FAPRI). For example, the 1,450,000 tons of N in China were distributed among rapeseed, peanuts, and sunflower in a way consistent with the fertilizer application rates from FAO 2002, such that when the FAPRI harvested areas were multiplied by the calculated fertilizer rates, they add up to the 1,450,000 tons of N while maintaining the distance between the rates of each crop from FAO 2002. The same was done for the 580,000 and 133,000 tons of P and K, respectively. For the case of India, the fertilizer demand was distributed among peanuts and rapeseed, also using the rates from FAO 2002, while for EU-27 the fertilizer demand was distributed among rapeseed and sunflower using the rates from Fertilizers Europe 2010. Then “Sugar Crops,” composed only of sugarcane and sugar beet, were distributed according to the methodology described above and using the FAO 2002 report for the rates of China and India. The Fertilizers Europe 2010 report does not give rates for sugarcane, but according to FAPRI most of the area is devoted to sugar beet (99.98%), so the sugarcane fertilization rate from another developed country (Australia) was used to calculate the fertilizer demand attributed to sugarcane, and the rest was allocated to sugar beet (and its corresponding rates were obtained). Finally, FAPRI does not report harvested areas for the categories of “Fruits and Vegetables” (FV) and “Other Crops” (OC—roots and tubers, pulses, nuts, rubber, coffee, tea, tobacco, ornamentals, turf, pastures, forestry) from IFA 2009. However, they account for about 30% of the world fertilizer demand. In order to project an aggregated world nutrient demand of FV and OC, we assumed that world N, P, and K demand for FV and OC changes at the same rate as the world nutrient demand of all the remaining crops. So, for example, once we calculated the total demand of N for each crop and country reported by FAPRI, we obtained its rate of change with respect to the previous year and applied it to the demand of FV and OC. The same was done for P and K. Note that this demand projection is not country specific. The last step was to allocate, to all the remaining countries or regions for which FAPRI gives a harvested area and yield projection, the fertilizer demand reported by IFA 2009 as ROW. Also, when for a given crop there were countries reported by IFA 2009 but not reported individually by FAPRI, that nutrient demand was added to the ROW. Given that the FAPRI model’s coverage of countries is bigger than that of the IFA 2009 report, this had to be done for several countries or regions. As an illustrating example, we describe in detail how we obtained each N, P, and K application rate for Ukraine that is not individually reported by IFA 2009 but is individually reported by FAPRI as a producer of several crops (wheat, corn, sugar beet, rapeseed, sunflower, barley, oats, and rye). We could not find fertilizer application rates for Ukraine, other than some fertilizer recommended rates (FAO-FUBC-Ukraine 2005), which are far from the actual rates according to the statistics on the country’s fertilizer consumption (IFADATA). According to the FAO-FUBC-Ukraine report, wheat is planted throughout the country but is more concentrated in the eastern region (Forest-Steppe Right Bank and Steppe) on the border to Russia. Similarly, according to USDA-FAS, wheat in Russia “is grown mainly in the fertile chernozem (black soil) zone, which includes the Southern district, the southern tier of the Central district, and the southern and central Volga district” of the region on the border with Ukraine. Therefore, we used Russian application rates from the IFA 2009 report as a reference to calculate those of Ukraine.

6
The methodology applied consisted of assuming that there exists an underlying production function of wheat that is common to Ukraine and Russia, and both countries are positioned at some point along the curve describing the response of wheat yields to applications of fertilizer (one curve for each of the three nutrients). From the FAPRI model we know wheat yields from both countries so we know where they lie on the vertical axis. Given that we do not know the form of the underlying production function (it requires unavailable data to estimate it), we make the simplifying assumption that the production function is increasing and linear; therefore, we apply the percentage difference between both countries’ yields to the Russian fertilizer rate from IFA 2009. We could give this production function some curvature describing decreasing or increasing returns to scale, but the curvature imposed would also be an ad hoc assumption, unless we are able to find that curvature for each crop and for each country. Instead of considering the observed yield for 2006/07 and 2007/08, we used a proxy of the expected yield by taking the average of the yields from 2003/04 to 2007/08. This was done to avoid big swings in fertilizer rates due to big changes in yields caused by, for example, extreme weather events. Figure 1 shows why this is the case.
Let and be the observed Russian yield and nitrogen rate, respectively, on a given year and let be
that of Ukraine in the same year. We know these values from FAPRI and IFA 2009 data. Suppose that is low because of a bad weather event that affected only Russia but not Ukraine. This implies an
application rate for Ukraine of according to the procedure described above. Suppose now that in all
previous years Russian yields were actually higher, with the average equal to . In that case, the
application rate for Ukraine consistent with would be , which is lower. Because fertilization decisions are mostly made before weather is observed, using the average yield implies that the farmer is looking at an expected production function. Weather shifts the production function up and down (dashed lines), but at planting the farmer is concerned with a production function consistent with expected conditions (solid line). For a similar reason, we used an average of the Ukrainian yields between 2003/04 and 2007/08.
Figure 1. Example of obtaining the nitrogen application rate
for a country using the expected production function The same procedure was used to calculate the fertilizer application rates for corn in Ukraine. Regarding sugar crops and according to FAPRI, Ukraine only plants sugar beet and not sugarcane, so the fertilizer demand was calculated and subtracted from the ROW. The FAO-FUBC-Ukraine report gives one point of the sugar beet production for each nutrient in 2002. By assuming that this production function is linear and has not changed since 2002, each nutrient application rate was obtained for the years 2006/07 and 2007/08. In the case of “Other Oilseeds,” FAPRI reports that Ukraine produces rapeseed and sunflower.
7
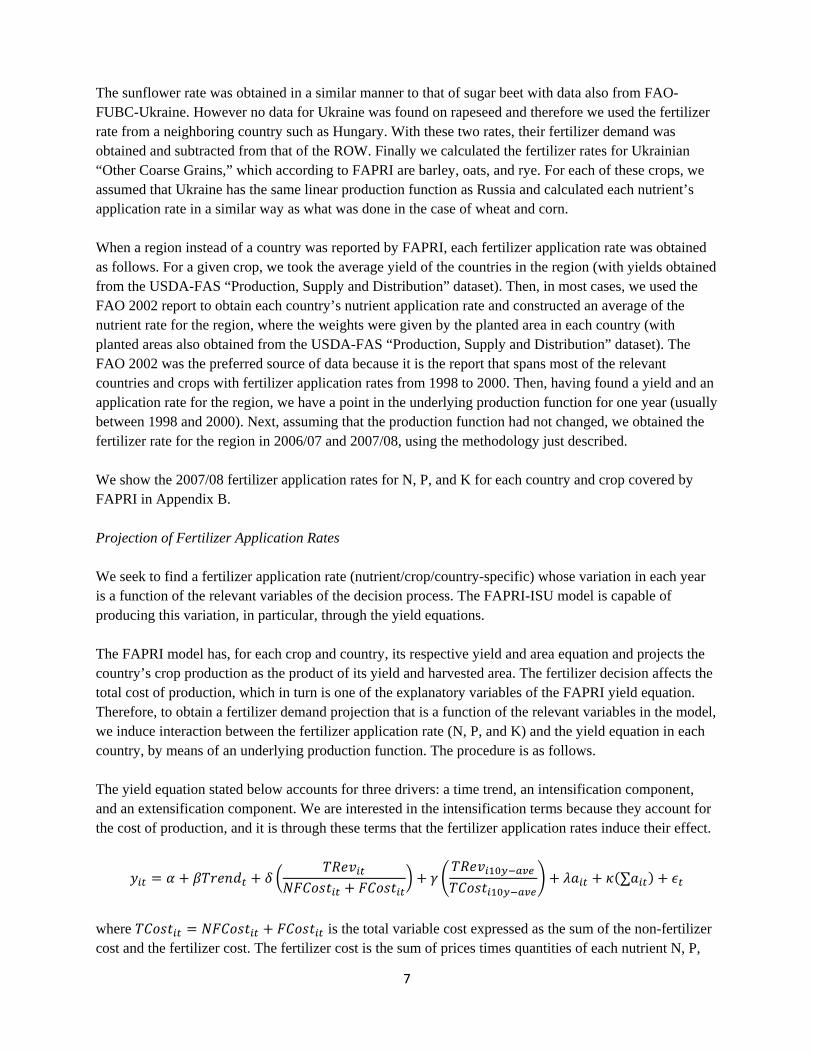
The sunflower rate was obtained in a similar manner to that of sugar beet with data also from FAO-FUBC-Ukraine. However no data for Ukraine was found on rapeseed and therefore we used the fertilizer rate from a neighboring country such as Hungary. With these two rates, their fertilizer demand was obtained and subtracted from that of the ROW. Finally we calculated the fertilizer rates for Ukrainian “Other Coarse Grains,” which according to FAPRI are barley, oats, and rye. For each of these crops, we assumed that Ukraine has the same linear production function as Russia and calculated each nutrient’s application rate in a similar way as what was done in the case of wheat and corn. When a region instead of a country was reported by FAPRI, each fertilizer application rate was obtained as follows. For a given crop, we took the average yield of the countries in the region (with yields obtained from the USDA-FAS “Production, Supply and Distribution” dataset). Then, in most cases, we used the FAO 2002 report to obtain each country’s nutrient application rate and constructed an average of the nutrient rate for the region, where the weights were given by the planted area in each country (with planted areas also obtained from the USDA-FAS “Production, Supply and Distribution” dataset). The FAO 2002 was the preferred source of data because it is the report that spans most of the relevant countries and crops with fertilizer application rates from 1998 to 2000. Then, having found a yield and an application rate for the region, we have a point in the underlying production function for one year (usually between 1998 and 2000). Next, assuming that the production function had not changed, we obtained the fertilizer rate for the region in 2006/07 and 2007/08, using the methodology just described. We show the 2007/08 fertilizer application rates for N, P, and K for each country and crop covered by FAPRI in Appendix B. Projection of Fertilizer Application Rates We seek to find a fertilizer application rate (nutrient/crop/country-specific) whose variation in each year is a function of the relevant variables of the decision process. The FAPRI-ISU model is capable of producing this variation, in particular, through the yield equations. The FAPRI model has, for each crop and country, its respective yield and area equation and projects the country’s crop production as the product of its yield and harvested area. The fertilizer decision affects the total cost of production, which in turn is one of the explanatory variables of the FAPRI yield equation. Therefore, to obtain a fertilizer demand projection that is a function of the relevant variables in the model, we induce interaction between the fertilizer application rate (N, P, and K) and the yield equation in each country, by means of an underlying production function. The procedure is as follows. The yield equation stated below accounts for three drivers: a time trend, an intensification component, and an extensification component. We are interested in the intensification terms because they account for the cost of production, and it is through these terms that the fertilizer application rates induce their effect.
∑
where is the total variable cost expressed as the sum of the non-fertilizer cost and the fertilizer cost. The fertilizer cost is the sum of prices times quantities of each nutrient N, P,
8
and K ( ). Suppose there exists an underlying production function
for country i that determines the yield at time t, . Holding everything else constant, except the application of nitrogen fertilizer, this production function is described by a curve of the form shown in
Figure 2. Therefore such a yield is consistent with a certain per hectare nitrogen application rate, . If we assume that the consistent nitrogen rate is the one found in the “Accounting Model,” we have one point on the production function curve. When the FAPRI-ISU model makes its first iteration (indexed by
the superscript), a new value for the yield is found ( ), which will be consistent with a different nitrogen
application rate ( ), consistency that is given by the curvature of the production function at that point. Therefore, we must know the curvature (elasticity of yields with respect to changes in N application rates) of the underlying production function for each country and each crop covered by FAPRI (these are explained in the next section).
Figure 2. Underlying production function to determine
yield response to nitrogen application rate Before the third iteration, the total cost of production ( ) has to be updated with the new nitrogen
application rate just found ( ); that is, 1 . where is the change in the
nitrogen rate and is the weight of nitrogen in the fertilizer cost. The value of is a function of the
elasticity of the production function. Then, a yield will be obtained in the third iteration ( ), which
according to the curvature of the production function determines a new nitrogen application rate of . This process continues until the market for this crop clears. Also, the process is repeated for each year projected by FAPRI, which allows us to obtain the fertilizer application rate projection. The obtained nitrogen application rate will then be multiplied by the projected harvested area to obtain the corresponding fertilizer demand projection. The case of phosphorous and potash is the same as that of nitrogen. Fertilizer Input Prices at the Country Level The variable cost of production is composed of fertilizer costs plus non-fertilizer costs. Fertilizer costs at the country level are obtained by multiplying the country-specific fertilizer rate of a given crop times a country-specific fertilizer price. In order to obtain fertilizer prices (landed nutrient prices), we took the world fertilizer price for each nutrient (assumed to be the U.S. price), multiplied by the exchange rate, and applied the import tariffs of the country of interest. U.S. fertilizer prices (urea, superphospate triple, and

9
potassium chloride) were obtained from USDA-NASS and projected using the “Cost of Production Model.” Exchange rates by country are readily available, and import tariffs were obtained from the World Trade Organization database. Production Function Elasticities for Each Crop We seek to find an underlying production function from which to obtain the response of crop yields to the application of fertilizer for each country. The ideal situation would be to estimate a country- and crop-specific production function, so that an elasticity of yields with respect to the application of nutrients can be obtained for each country. This is not possible with the available data because it requires cross-section or time-series data on input use by crop and by country. Therefore, we are forced to produce a less ambitious estimation. In this sense, for each commodity, we take the nutrient application rates from the Accounting Model or from other sources2 and the crop yield from FAPRI or from USDA-FAS and use these pairs to fit a “world” production function. This will give us a yield response curve for each nutrient and for each crop, and the elasticity will be given by where the country is located in the production function. Results will be conditional on the form of the production function chosen. We also assume that all countries share the same technology functional form for producing a given crop. We explain the procedure used with an example for corn. The production function with raw country data is plotted in blue in each of the nutrient dimensions, as shown in Figure 3. We fitted a Cobb-Douglas production function to these yield data as a function of the
three nutrients ( ). For this functional form, the elasticity with respect to each input is exactly its exponent. The estimation output showing statistically significant estimates of elasticities is shown in Table 2. Figure 3 shows the case of nitrogen, where the raw data used in the estimation is in blue and the fitted Cobb-Douglas production function is in red (graphs for phosphorous and potassium are in Appendix C). The higher elasticity with respect to nitrogen implies that nitrogen rates will be less
Figure 3. Corn yield response to nitrogen
2 USDA‐ERS, IFA, and Fertilizers Europe.
0.0
2.0
4.0
6.0
8.0
10.0
12.0
14.0
0 100 200 300 400 500
Yield, ton/ha
kg N/haRaw data Fitted Cobb‐Douglas

10
responsive to corn price changes than those of phosphorous and potassium. This is consistent with the country data of aggregate consumption of nutrients where the latter changes more from year to year. The explanation hinges on the fact that N has to be applied every year (so in that sense is more inelastic) while P and K are stored nutrients so the farmer can “wait” until price conditions are more favorable to purchase them. The lack of other input data at the crop and country level does not allow us to specify the technology as a function of other relevant inputs in the crop production process. Table 2. Estimated elasticities for corn (Equation: ln ln ln ln ln
Variable
Coefficient -1.396 0.480 0.174 0.067
Standard error 0.294 0.092 0.094 0.038
t-stat -4.744 5.201 1.850 1.787
p-value 0.000 0.000 0.068 0.077
For some commodities (sorghum, sunflower, and sugarcane) we estimated a production function of the form because we did not have enough observations of nutrient use but observations on aggregate nutrients use by crop were available, especially for India. In other cases (soybeans, rapeseed, and sugar beet) we estimated the following form of production function:
, because the estimate of the P or K elasticity was of the unexpected sign. The estimated Cobb-Douglas elasticities of yield with respect to fertilizer rate are shown in Table 3 for each nutrient and for each commodity. It is important to highlight that these elasticities are then multiplied by the share of fertilizers in the total cost of production, so that we are not attributing all the change in yields to changes in fertilizer application rates. Table 3. Estimated Cobb-Douglas Yield Elasticities
Wh
eat,
All
Cor
n
Bar
ley
Oat
s
Rye
Sor
ghu
m
Soy
bea
ns
Pea
nu
t
Rap
esee
d
Su
nfl
ower
Pal
m O
il
Ric
e, A
ll
Cot
ton
Su
gar
Bee
t
Su
gar
Can
e N 0.736 0.480 0.366 0.712 0.712 0.147 0.072 0.072 0.325 0.141 0.043 0.249 0.573 0.245 0.124
P 0.064 0.174 0.066 0.127 0.127 0.147 0.262 0.262 0.034 0.141 0.043 0.046 0.074 0.342 0.124
K 0.064 0.067 0.066 0.127 0.127 0.147 0.262 0.262 0.034 0.141 0.043 0.048 0.074 0.342 0.124
Our results will be improved as we find more country-specific data on input use by crop (fertilizer and other inputs), so that its own production function can be estimated. FAPRI U.S. Model. Within the FAPRI-ISU model, projections for the commodities covered in the U.S. come from another model, the “U.S. model.” These commodities are wheat, corn, oats, rye, sorghum, soybeans, rapeseed, sunflower, peanuts, sugar beet, sugarcane, rice, and cotton. Also, the model divides the U.S. into the following six regions: Central Plains, Corn Belt, Delta States, Lake-States Northeast, Northern Plains, and Southeast. As a result, each commodity and region requires a fertilizer application rate (by nutrient) and the elasticity of yields with respect to each nutrient.

11
From USDA-ERS, fertilizer use by nutrient, by crop, and by state is available for wheat, corn, soybeans, and cotton between 1980 and 2007. This dataset was used to calculate the N, P, and K application rates for the base years, and to estimate the required elasticities (note that yields by state and by crop are available at USDA-NASS). Below, in Table 4, we show our estimated elasticities for soybeans in the U.S. coming from a Cobb-Douglas production function in which P and K are lumped together and in which regional dummy variables are included (relative to the Southeast region). Table 4. Estimated elasticities for soybeans in the United States (Equation: ln lnln ln )
Variable CentralPlains
Corn Belt
Delta States
Lake States
North- east
Northern Plains
Coefficient -0.947 0.072 0.262 0.489 0.355 -0.004 0.410 0.219 0.373
Std. Error 0.282 0.029 0.061 0.058 0.029 0.033 0.044 0.099 0.071
t-stat -3.363 2.435 4.328 8.378 12.063 -0.115 9.357 2.223 5.284
p-value 0.001 0.015 0.000 0.000 0.000 0.909 0.000 0.027 0.000
Elasticities of yield are significant and with the expected sign. The low value of the elasticity with respect to N is reasonable because of the low response of soybean yields to the addition of nitrogen fertilizer. For the cases of soybeans, wheat, and cotton we estimated elasticities with data from the U.S. However, for the remaining commodities we applied the elasticities estimated from the world production function. These elasticities are shown in Table 5. Table 5. Estimated Cobb-Douglas yield elasticities for the United States
Wh
eat,
All
Cor
n
Bar
ley
Oat
s
Rye
Sor
ghu
m
Soy
bea
ns
Pea
nu
t
Rap
esee
d
Su
nfl
ower
Ric
e, A
ll
Cot
ton
Su
gar
Bee
t
Su
gar
Can
e
N 0.170 0.480 0.366 0.712 0.712 0.147 0.072 0.072 0.325 0.141 0.249 0.573 0.369 0.124
P 0.037 0.174 0.066 0.127 0.127 0.147 0.262 0.262 0.034 0.141 0.046 0.074 0.203 0.124
K 0.037 0.067 0.066 0.127 0.127 0.147 0.262 0.262 0.034 0.141 0.048 0.074 0.203 0.124
* ** ** ** ** ** * ** ** ** ** * ** **(*): Based on U.S. data only. (**): Corresponds with world production function.
Fertilizer Demand Baseline Projections
We present fertilizer demand projections by nutrient, by crop, and by year, for the world and a selected group of countries and crops. The complete set of projections, including all the countries and crops covered by the model, are available at http://www.fapri.iastate.edu/outlook/2011/ . Baseline projections are through year 2025/26. World fertilizer use in 2025/26 is projected to be 185 mmt, composed of 107 mmt of nitrogen (N) fertilizers, 43 mmt of phosphorous (P), and 35 mmt of potassium (K). This increase of 5.50% relative to the 2010/11 crop season reflects the expansion of the world’s cropland by 4.36% and also the more

12
intensive use of fertilizers at the world level in commodities such as corn, barley, rapeseed, peanut, and cotton. These are shown in the tables in Appendix D. World fertilizer use in corn is projected to be 17.20 mmt of N, 5.29 mmt of P, and 4.93 mmt of K, which represent increments of 4.63%, 8.01%, and 15.09%, respectively, relative to 2010/11. The higher percentage increase of P and K relative to N hinges upon their more elastic behavior relative to corn price changes. The higher fertilizer use in corn is due to the increase in both corn harvested areas and fertilizer application rates. World N use in soybean is projected at 1.43 mmt, 4.72 mmt of P, and 4.41 mmt of K in 2025. These imply similar levels of N and increases of 6.29% and 3.64% in P and K, respectively, relative to 2010. This is caused by the increase in soybean harvested area of 7.66% that offsets the decrease in nutrients application rates per hectare (induced by lower-than-2010 soybean prices projected to 2025). Fertilizer use in wheat at the world level is projected at 17.85 mmt of N, 6.25 mmt of P, and 2.11 mmt of K, which implies levels similar to 2010/11 because the increase in harvested areas of 0.88% compensates for the less intensive use of fertilizers in this crop. Fertilizer use in the U.S. increases by 6.09%, driven by the higher use of fertilizers in corn, sorghum, and rapeseed, as shown in Appendix D. Corn N use in the U.S. in 2025 is projected at 5.66 mmt, 2.42 of P, and 3.21 mmt of K, which represents increments of 10.45%, 12.39%, and 17.51%, respectively, with respect to 2010. Both the more intensive and extensive corn production contributes to these changes. Fertilizer use in soybean experiences a reduction of 2.96% because of the decrease in U.S. soybean areas in that period. The case of wheat is similar, with even a stronger reduction of 10.09%, but in this case this is induced by the reduction in area as well as the fertilizer application rates. China, India, the U.S., and the EU-27 countries account for more than two-thirds (65%) of the world’s fertilizer consumption in agriculture. China is the world’s top consuming country, followed by the U.S. China is characterized not only by large crop areas but also by an intensive use of fertilizers, which is comparable to (and even higher than in the cases of wheat, sunflower seed, peanuts, cotton, sugarcane, and sugar beet) those of the U.S. and EU-27 countries. India, on the other hand, is the third-largest fertilizer consumer, given its larger crop areas, but it has more moderate fertilizer application rates. China’s fertilizer use slightly increases from 2010 to 2025, induced by the increase in the use of N because there is a shift in area toward crops that are more intensive in the use of N, such as corn, sugar beet, and cotton. China is expected to use 33.70 mmt of N, 12.16 mmt of P, and 6.49 mmt of K, which represents increments of 3.00%, 0.55% and 2.91% respectively, with respect to 2010. Indian fertilizer use increases over the projected period, driven by higher uses in oilseeds, wheat, and sugarcane. India’s projected use in 2025 is 15.37 mmt of N, 5.78 mmt of P, and 2.75 mmt of K, which relative to 2010 is respectively 4.03%, 0.89% and 4.60% higher. Fertilizer demand projections are a function of projected fertilizer application rates and harvested areas. We report fertilizer application rates by nutrient for all countries and commodities from our WorldNPK model in http://www.fapri.iastate.edu/outlook/2011/. For illustration purposes we show the projection of China’s rates by crop in Appendix E. The main drivers of these rates are the variables included in the intensification component of each crop and country yield equation. Examples are the crop price and other input prices. We usually do not expect significant changes in the levels of these application rates, because small changes translate into sizable effects on a nutrient’s total demand. Corn N rates are expected to increase by 1.12%, P rates by 3.09%, and K rates by 8.16%. Rates for P and K in corn are more

13
responsive to output price changes than are N rates, and other cereals such as barley and wheat have similar rate responses. The reason is that while P and K are nutrients that can be stored in the soil, N has to be applied every year, and this makes it less elastic to changes in relevant variables. Soybean rates are expected to decrease over the projected period as a result of similar behavior of world soybean projected prices. An analogous result is expected for sunflower seed. Further Extensions (Step 2) So far, the model assumes a horizontal world supply of each nutrient such that changes in demand are satisfied without affecting fertilizer prices. We plan to introduce a supply curve, not only to overcome this simplified assumption but also to project a world fertilizer price of equilibrium that clears the world fertilizer market. The supply of fertilizers will have a short-term component that reflects capacity constraints in the industry and a long-term component that is more elastic with respect to prices to reflect capacity building. Therefore, the output of the model once this change is introduced will be a country- and crop-specific nutrient application rate that is a function of the relevant variables in the fertilizing decision process, and when multiplied by the harvested areas will give projections of fertilizer demands by crop and country. Also, we will be able to project an endogenous world price for each nitrogen, phosphorous, and potash component consistent with the fertilizer market clearing assumption.

14
References Fertilizers Europe. “Fertilizers Europe data base on nutrient application rate by crop”. 2010. Food and Agriculture Organization of the United Nations – FAO, 2002. “Fertilizer Use by Crop” Fifth edition. Food and Agriculture Organization of the United Nations – FAO, 2006. “Fertilizer and Plant Nutrition Bulletin: Fertilizer Use by Crop.” Food and Agriculture Organization of the United Nations – FAO, 2005. “Fertilizer Use by Crop in Ukraine.” Government of India - Ministry of Agriculture - “Agricultural Census” 1986, 1991, 1996, and 2001. Heffer, Patrick. “Assessment of Fertilizer Use by Crop at the Global Level 2006/07 – 2007/08,” International Fertilizer Industry Association - IFA, April 2009. International Fertilizer Industry Association (IFA), Statistics – IFADATA, 2009. Available at: http://www.fertilizer.org/ifa/Home-Page/STATISTICS (accessed September 2010). U.S. Department of Agriculture, Economic Research Service (USDA-ERS) “Fertilizer Use and Prices.” Available at http://www.ers.usda.gov/data/fertilizeruse/ (Accessed September 2010). U.S. Department of Agriculture, Foreign Agricultural Service (USDA-FAS). “Production Estimates and Crop Assessment. Russia: Agricultural Overview.” Available at: http://www.fas.usda.gov/pecad2/highlights/2005/03/Russia_Ag/index.htm (accessed September 2010). U.S. Department of Agriculture, Foreign Agricultural Service (USDA-FAS). “Production, Supply and Distribution Online.” Available at http://www.fas.usda.gov/psdonline/ (accessed September 2010). World Trade Organization - World Bank – World Integrated Trade Solutions (WITS). Available at http://wits.worldbank.org/WITS//index.html (accessed October 2010).

15
Appendix A. Worldwide Fertilizer Consumption (Source: IFA 2009)
Fertilizer Use by Crop ('000 t nutrients) Last update: 7 April 2009
2006 + 2006/07
Total % of World % Qty % Qty % Qty % Qty % Qty % Qty % Qty % Qty % Qty % Qty % QtyChina N 30,200 31.5% 14.1% 4,258 18.2% 5,496 16.1% 4,862 1.0% 302 1.5% 453 0.0% 6 4.8% 1,450 4.1% 1,238 1.5% 453 30.0% 9,060 8.7% 2,621
P2O5 11,600 30.3% 16.5% 1,914 15.3% 1,775 6.6% 766 1.0% 116 3.3% 383 0.0% 2 5.0% 580 3.9% 452 2.2% 255 34.0% 3,944 12.2% 1,413
K2O 5,800 21.4% 4.4% 255 28.0% 1,624 2.2% 128 1.0% 58 1.0% 58 0.1% 6 2.3% 133 1.2% 70 4.8% 278 50.0% 2,900 5.0% 290
N+P+K 47,600 29.5% 13.5% 6,427 18.7% 8,895 12.1% 5,755 1.0% 476 1.9% 894 0.0% 14 4.5% 2,163 3.7% 1,760 2.1% 987 33.4% 15,904 9.1% 4,325India N 13,773 14.4% 21.0% 2,892 30.0% 4,132 2.5% 344 4.5% 620 1.0% 138 0.0% 0 4.5% 620 6.5% 895 5.0% 689 7.0% 964 18.0% 2,479
P2O5 5,543 14.5% 20.0% 1,109 25.0% 1,386 1.5% 83 5.0% 277 2.5% 139 0.0% 0 7.0% 388 8.0% 443 4.5% 249 11.0% 610 15.5% 859
K2O 2,335 8.6% 8.0% 187 34.0% 794 1.0% 23 2.5% 58 1.0% 23 0.0% 0 5.0% 117 5.5% 128 10.0% 234 22.0% 514 11.0% 257
N+P+K 21,651 13.4% 19.3% 4,188 29.2% 6,312 2.1% 451 4.4% 955 1.4% 300 0.0% 0 5.2% 1,125 6.8% 1,467 5.4% 1,172 9.6% 2,088 16.6% 3,595USA N 11,970 12.5% 13.4% 1,604 1.9% 227 48.4% 5,793 3.4% 407 0.8% 96 0.0% 0 1.5% 180 2.4% 287 1.0% 120 4.2% 503 23.0% 2,753
P2O5 4,148 10.8% 13.7% 568 0.9% 37 48.6% 2,016 2.3% 95 7.4% 307 0.0% 0 2.1% 87 3.1% 129 1.1% 46 5.8% 241 15.0% 622
K2O 4,657 17.1% 4.8% 224 0.8% 37 50.0% 2,329 1.0% 47 10.8% 503 0.0% 0 2.0% 93 3.3% 154 2.9% 135 6.8% 317 17.6% 820
N+P+K 20,775 12.9% 11.5% 2,396 1.5% 302 48.8% 10,138 2.6% 549 4.4% 906 0.0% 0 1.7% 360 2.7% 570 1.4% 300 5.1% 1,060 20.2% 4,195EU-27 N 10,746 11.2% 26.0% 2,794 0.4% 43 12.0% 1,290 16.0% 1,719 0.1% 11 0.0% 0 9.2% 989 0.5% 54 2.1% 226 7.5% 806 26.2% 2,815
P2O5 3,091 8.1% 19.5% 603 0.5% 15 13.2% 408 15.9% 491 0.3% 9 0.0% 0 8.2% 253 0.7% 22 3.6% 111 13.4% 414 24.7% 763
K2O 3,592 13.2% 12.7% 456 0.9% 32 11.9% 427 12.8% 460 0.3% 11 0.0% 0 9.9% 356 0.6% 22 5.9% 212 14.4% 517 30.6% 1,099
N+P+K 17,429 10.8% 22.1% 3,853 0.5% 91 12.2% 2,125 15.3% 2,671 0.2% 31 0.0% 0 9.2% 1,598 0.6% 97 3.1% 549 10.0% 1,737 26.8% 4,678Brazil N 2,297 2.4% 3.0% 69 7.1% 163 29.4% 675 4.1% 94 3.8% 87 0.2% 5 0.1% 2 7.4% 170 23.3% 535 6.8% 156 14.8% 340
P2O5 3,149 8.2% 2.1% 66 4.6% 145 20.6% 649 2.0% 63 41.3% 1,301 0.1% 3 0.1% 3 4.5% 142 8.7% 274 5.0% 157 11.0% 346
K2O 3,460 12.7% 1.8% 62 4.1% 142 16.7% 578 0.9% 31 34.7% 1,201 0.2% 7 0.1% 3 4.1% 142 20.6% 713 5.4% 187 11.4% 394
N+P+K 8,906 5.5% 2.2% 197 5.1% 450 21.4% 1,902 2.1% 188 29.1% 2,588 0.2% 15 0.1% 9 5.1% 454 17.1% 1,522 5.6% 500 12.1% 1,081Pakistan N 2,649 2.8% 37.9% 1,004 9.4% 249 4.8% 127 0.6% 16 0.0% 0 0.0% 0 1.1% 29 18.8% 498 6.6% 175 3.8% 101 17.0% 450
P2O5 979 2.6% 35.2% 345 9.1% 89 6.2% 61 0.5% 5 0.0% 0 0.0% 0 1.5% 15 16.0% 157 8.1% 79 4.1% 40 19.3% 189
K2O 43 0.2% 34.0% 15 11.0% 5 11.0% 5 0.0% 0 0.0% 0 0.0% 0 0.0% 0 9.0% 4 11.0% 5 11.0% 5 13.0% 6
N+P+K 3,671 2.3% 37.1% 1,363 9.3% 343 5.2% 193 0.6% 21 0.0% 0 0.0% 0 1.2% 44 17.9% 659 7.1% 259 4.0% 146 17.6% 645Indonesia N 2,350 2.5% 0.0% 0 45.0% 1,058 15.0% 353 0.0% 0 0.4% 9 13.0% 306 1.0% 24 0.1% 1 2.0% 47 9.0% 212 14.6% 342
P2O5 480 1.3% 0.0% 0 22.0% 106 15.0% 72 0.0% 0 3.0% 14 25.0% 120 3.0% 14 0.2% 1 5.0% 24 10.0% 48 16.9% 81
K2O 800 2.9% 0.0% 0 14.0% 112 10.0% 80 0.0% 0 0.6% 5 48.0% 384 1.0% 8 0.1% 0 9.0% 72 12.0% 96 5.4% 43
N+P+K 3,630 2.3% 0.0% 0 35.1% 1,275 13.9% 505 0.0% 0 0.8% 29 22.3% 810 1.3% 46 0.1% 2 3.9% 143 9.8% 356 12.8% 466Canada N 1,758 1.8% 33.6% 591 0.0% 0 8.9% 156 14.7% 258 0.5% 9 0.0% 0 20.4% 359 0.0% 0 0.5% 9 0.6% 11 20.8% 366
P2O5 469 1.2% 36.9% 173 0.0% 0 8.8% 41 17.6% 83 6.2% 29 0.0% 0 16.9% 79 0.0% 0 0.6% 3 0.7% 3 12.3% 58
K2O 382 1.4% 9.4% 36 0.0% 0 22.5% 86 2.8% 11 8.1% 31 0.0% 0 20.8% 79 0.0% 0 0.6% 2 1.9% 7 33.9% 129
N+P+K 2,609 1.6% 30.6% 800 0.0% 0 10.9% 284 13.5% 352 2.6% 69 0.0% 0 19.8% 517 0.0% 0 0.5% 14 0.8% 21 21.2% 553Vietnam N 1,123 1.2% 0.0% 0 68.0% 764 12.0% 135 0.0% 0 0.7% 8 0.0% 0 1.5% 17 0.2% 2 4.0% 45 3.0% 34 10.6% 119
P2O5 600 1.6% 0.0% 0 72.0% 432 7.5% 45 0.0% 0 1.5% 9 0.0% 0 3.0% 18 0.1% 1 2.5% 15 4.0% 24 9.4% 56
K2O 408 1.5% 0.0% 0 66.0% 269 6.5% 27 0.0% 0 1.5% 6 0.0% 0 3.0% 12 0.1% 0 8.0% 33 5.0% 20 9.9% 40
N+P+K 2,131 1.3% 0.0% 0 68.7% 1,465 9.7% 206 0.0% 0 1.1% 23 0.0% 0 2.2% 47 0.2% 3 4.3% 93 3.7% 78 10.1% 216Turkey N 1,407 1.5% 41.5% 584 0.9% 13 6.8% 96 12.1% 170 0.1% 1 0.0% 0 4.6% 65 5.4% 76 2.0% 28 17.0% 239 9.6% 135
P2O5 605 1.6% 41.7% 252 0.9% 5 4.7% 28 13.1% 79 0.1% 1 0.0% 0 4.4% 27 5.2% 31 3.4% 21 14.4% 87 12.1% 73
K2O 99 0.4% 15.2% 15 0.5% 0 6.1% 6 2.9% 3 0.1% 0 0.0% 0 5.4% 5 4.2% 4 13.2% 13 40.4% 40 12.0% 12
N+P+K 2,111 1.3% 40.3% 851 0.9% 19 6.2% 130 12.0% 252 0.1% 2 0.0% 0 4.6% 97 5.3% 112 2.9% 62 17.4% 366 10.4% 220Australia N 858 0.9% 30.7% 263 0.0% 0 0.7% 6 24.1% 207 0.0% 0 0.0% 0 10.3% 88 0.7% 6 8.2% 70 8.4% 72 16.9% 145
P2O5 984 2.6% 28.9% 284 0.0% 0 0.4% 4 24.0% 236 0.0% 0 0.0% 0 7.7% 76 0.3% 3 3.1% 31 4.9% 48 30.7% 302
K2O 224 0.8% 12.6% 28 0.0% 0 0.2% 0 5.7% 13 0.0% 0 0.0% 0 3.4% 8 0.4% 1 19.8% 44 24.0% 54 33.9% 76
N+P+K 2,066 1.3% 27.9% 576 0.0% 0 0.5% 10 22.1% 456 0.0% 0 0.0% 0 8.3% 172 0.5% 10 7.0% 145 8.4% 174 25.3% 523Malaysia N 540 0.6% 0.0% 0 15.0% 81 0.5% 3 0.0% 0 0.0% 0 65.0% 351 0.2% 1 0.0% 0 0.3% 2 3.0% 16 16.1% 87
P2O5 230 0.6% 0.0% 0 19.0% 44 0.5% 1 0.0% 0 0.0% 0 55.0% 127 0.2% 0 0.0% 0 0.3% 1 6.0% 14 19.0% 44
K2O 1,000 3.7% 0.0% 0 5.0% 50 0.1% 1 0.0% 0 0.0% 0 85.0% 850 0.1% 1 0.0% 0 0.2% 2 2.0% 20 7.7% 77
N+P+K 1,770 1.1% 0.0% 0 9.9% 175 0.3% 5 0.0% 0 0.0% 0 75.0% 1,328 0.1% 2 0.0% 0 0.2% 4 2.8% 50 11.7% 207
CEREALS OILSEEDSWheat Other CropsRice Other CG Oil Palm Other OS Sugar Crops Fruits & Veg.Maize Soybean Cotton

16
Iran N 1,150 1.2% 36.0% 414 7.5% 86 5.5% 63 8.0% 92 0.2% 2 0.0% 0 4.5% 52 2.0% 23 3.5% 40 15.0% 173 17.8% 205
P2O5 500 1.3% 34.0% 170 5.5% 28 5.0% 25 7.5% 38 0.8% 4 0.0% 0 6.5% 33 1.5% 8 3.5% 18 23.0% 115 12.7% 63
K2O 200 0.7% 24.0% 48 4.0% 8 3.5% 7 5.5% 11 0.3% 1 0.0% 0 4.5% 9 1.5% 3 2.5% 5 44.0% 88 10.2% 20
N+P+K 1,850 1.1% 34.2% 632 6.6% 122 5.1% 95 7.6% 141 0.4% 7 0.0% 0 5.0% 93 1.8% 34 3.4% 63 20.3% 376 15.6% 289Thailand N 1,034 1.1% 0.0% 0 30.0% 310 7.0% 72 0.5% 5 0.1% 1 3.0% 31 1.0% 10 1.0% 10 5.0% 52 28.0% 290 24.4% 252
P2O5 333 0.9% 0.0% 0 25.0% 83 7.0% 23 0.5% 2 1.0% 3 6.0% 20 1.5% 5 1.0% 3 10.0% 33 30.0% 100 18.0% 60
K2O 341 1.3% 0.0% 0 5.0% 17 10.0% 34 0.5% 2 0.1% 0 10.0% 34 1.0% 3 1.0% 3 13.0% 44 36.0% 123 23.4% 80
N+P+K 1,708 1.1% 0.0% 0 24.0% 411 7.6% 130 0.5% 9 0.3% 5 5.0% 85 1.1% 19 1.0% 17 7.6% 129 30.0% 512 23.0% 392Bangladesh N 1,193 1.2% 1.2% 14 93.3% 1,113 0.3% 4 0.0% 0 0.0% 0 0.0% 0 0.8% 10 0.2% 2 0.7% 8 1.5% 18 2.0% 24
P2O5 285 0.7% 1.5% 4 83.0% 237 0.3% 1 0.0% 0 0.0% 0 0.0% 0 2.0% 6 0.2% 1 1.5% 4 5.0% 14 6.5% 19
K2O 170 0.6% 1.7% 3 81.0% 138 0.3% 1 0.0% 0 0.0% 0 0.0% 0 2.0% 3 0.4% 1 2.0% 3 5.0% 9 7.6% 13
N+P+K 1,648 1.0% 1.3% 21 90.2% 1,487 0.3% 5 0.0% 0 0.0% 0 0.0% 0 1.1% 19 0.2% 3 1.0% 16 2.5% 41 3.4% 56Russia N 956 1.0% 42.0% 402 1.2% 11 7.3% 70 22.0% 210 0.4% 4 0.0% 0 2.3% 22 0.0% 0 9.6% 92 1.0% 10 14.2% 136
P2O5 423 1.1% 40.0% 169 1.1% 5 5.5% 23 21.0% 89 1.1% 5 0.0% 0 7.1% 30 0.0% 0 15.0% 63 1.4% 6 7.8% 33
K2O 268 1.0% 26.0% 70 0.1% 0 5.7% 15 23.0% 62 0.8% 2 0.0% 0 4.1% 11 0.0% 0 24.0% 64 3.7% 10 12.6% 34
N+P+K 1,647 1.0% 38.9% 640 1.0% 16 6.6% 108 21.9% 361 0.6% 11 0.0% 0 3.8% 63 0.0% 0 13.3% 220 1.5% 25 12.3% 203Mexico N 1,120 1.2% 5.3% 59 0.5% 6 61.3% 687 1.8% 20 0.0% 0 1.2% 13 0.2% 2 0.5% 6 6.1% 68 14.9% 167 8.2% 92
P2O5 260 0.7% 2.9% 8 0.8% 2 40.0% 104 0.8% 2 1.2% 3 4.0% 10 0.2% 1 1.2% 3 8.8% 23 32.0% 83 8.1% 21
K2O 220 0.8% 1.2% 3 0.9% 2 9.0% 20 0.0% 0 0.9% 2 4.5% 10 0.0% 0 0.9% 2 27.8% 61 47.1% 104 7.7% 17
N+P+K 1,600 1.0% 4.3% 70 0.6% 10 50.6% 810 1.4% 22 0.3% 5 2.1% 34 0.2% 3 0.7% 11 9.5% 152 22.1% 354 8.1% 130Egypt N 1,260 1.3% 24.0% 302 9.0% 113 27.0% 340 4.5% 57 0.1% 1 0.0% 0 1.0% 13 3.5% 44 4.0% 50 19.0% 239 7.9% 100
P2O5 240 0.6% 14.5% 35 8.5% 20 10.5% 25 2.5% 6 0.2% 0 0.0% 0 1.5% 4 4.5% 11 3.0% 7 45.0% 108 9.8% 24
K2O 49 0.2% 20.0% 10 0.0% 0 15.0% 7 2.0% 1 0.1% 0 0.0% 0 0.5% 0 4.0% 2 15.0% 7 35.0% 17 8.4% 4
N+P+K 1,549 1.0% 22.4% 347 8.6% 134 24.1% 373 4.1% 64 0.1% 2 0.0% 0 1.1% 16 3.7% 57 4.2% 65 23.5% 365 8.2% 127Argentina N 759 0.8% 36.9% 280 0.7% 5 29.0% 220 5.3% 40 6.6% 50 0.0% 0 3.3% 25 0.7% 5 3.3% 25 7.2% 55 7.0% 53
P2O5 639 1.7% 25.8% 165 0.4% 3 17.2% 110 6.3% 40 34.4% 220 0.0% 0 3.1% 20 0.2% 1 0.2% 1 6.3% 40 6.1% 39
K2O 55 0.2% 2.2% 1 4.2% 2 2.2% 1 0.5% 0 2.0% 1 0.0% 0 0.9% 0 0.2% 0 10.0% 6 54.5% 30 23.3% 13
N+P+K 1,453 0.9% 30.7% 446 0.7% 10 22.8% 331 5.6% 81 18.7% 271 0.0% 0 3.1% 45 0.5% 7 2.2% 32 8.6% 125 7.2% 105South Africa N 429 0.4% 7.2% 31 0.0% 0 48.0% 206 1.4% 6 0.1% 0 0.0% 0 4.3% 18 0.3% 1 11.5% 49 11.5% 49 15.7% 67
P2O5 204 0.5% 10.0% 20 0.0% 0 41.0% 84 1.7% 3 0.7% 1 0.0% 0 6.2% 13 0.6% 1 13.0% 27 12.0% 24 14.8% 30
K2O 153 0.6% 4.6% 7 0.0% 0 13.5% 21 0.5% 1 0.3% 0 0.0% 0 1.1% 2 0.2% 0 43.0% 66 25.0% 38 11.8% 18
N+P+K 786 0.5% 7.4% 58 0.0% 0 39.5% 310 1.3% 10 0.3% 2 0.0% 0 4.2% 33 0.4% 3 18.0% 142 14.3% 112 14.7% 116Philippines N 520 0.5% 0.0% 0 40.0% 208 20.0% 104 0.0% 0 0.0% 0 0.5% 3 2.0% 10 0.0% 0 2.0% 10 20.0% 104 15.5% 81
P2O5 110 0.3% 0.0% 0 30.0% 33 12.0% 13 0.0% 0 0.0% 0 0.5% 1 5.0% 6 0.0% 0 6.0% 7 30.0% 33 16.5% 18
K2O 110 0.4% 0.0% 0 10.0% 11 5.0% 6 0.0% 0 0.0% 0 3.0% 3 3.0% 3 0.0% 0 15.0% 17 50.0% 55 14.0% 15
N+P+K 740 0.5% 0.0% 0 34.1% 252 16.6% 123 0.0% 0 0.0% 0 0.9% 6 2.6% 19 0.0% 0 4.5% 34 25.9% 192 15.4% 114Chile N 254 0.3% 18.0% 46 0.8% 2 12.0% 30 6.0% 15 0.0% 0 0.0% 0 0.8% 2 0.0% 0 1.6% 4 20.0% 51 40.8% 104
P2O5 143 0.4% 18.0% 26 1.3% 2 6.7% 10 6.0% 9 0.0% 0 0.0% 0 0.6% 1 0.0% 0 1.2% 2 10.0% 14 56.2% 80
K2O 95 0.3% 6.0% 6 2.0% 2 9.0% 9 2.0% 2 0.0% 0 0.0% 0 0.5% 0 0.0% 0 6.0% 6 45.0% 43 29.5% 28
N+P+K 492 0.3% 15.7% 77 1.2% 6 9.9% 49 5.2% 26 0.0% 0 0.0% 0 0.7% 3 0.0% 0 2.3% 11 21.9% 108 43.1% 212Morocco N 226 0.2% 28.0% 63 0.4% 1 3.0% 7 19.0% 43 0.0% 0 0.0% 0 2.2% 5 0.0% 0 5.5% 12 20.0% 45 21.9% 49
P2O5 153 0.4% 28.0% 43 0.3% 0 3.5% 5 19.0% 29 0.0% 0 0.0% 0 3.6% 6 0.0% 0 5.5% 8 18.0% 28 22.1% 34
K2O 53 0.2% 14.0% 7 0.0% 0 2.8% 1 11.0% 6 0.0% 0 0.0% 0 1.4% 1 0.0% 0 9.5% 5 50.0% 27 11.3% 6
N+P+K 432 0.3% 26.3% 114 0.3% 1 3.2% 14 18.0% 78 0.0% 0 0.0% 0 2.6% 11 0.0% 0 6.0% 26 23.0% 99 20.7% 89
ROW N 7,257 7.6% 13.0% 943 14.0% 1,016 13.0% 943 6.0% 435 0.5% 36 0.7% 51 5.0% 363 5.0% 363 5.0% 363 18.0% 1,306 19.8% 1,437
P2O5 3,070 8.0% 10.0% 307 12.0% 368 10.0% 307 6.0% 184 5.0% 154 1.0% 31 5.0% 154 5.0% 154 6.0% 184 20.0% 614 20.0% 614
K2O 2,643 9.7% 7.0% 185 12.0% 317 10.0% 264 4.0% 106 3.0% 79 4.0% 106 4.0% 106 3.0% 79 12.0% 317 25.0% 661 16.0% 423
N+P+K 12,970 8.0% 11.1% 1,435 13.1% 1,702 11.7% 1,515 5.6% 725 2.1% 269 1.4% 187 4.8% 622 4.6% 596 6.7% 864 19.9% 2,581 19.1% 2,474
World N 95,829 100.0% 17.3% 16,614 15.8% 15,098 17.3% 16,587 4.9% 4,718 0.9% 907 0.8% 765 4.5% 4,354 3.8% 3,682 3.3% 3,173 15.3% 14,679 15.9% 15,252
P2O5 38,238 100.0% 16.4% 6,261 12.6% 4,815 12.8% 4,904 4.8% 1,848 6.8% 2,582 0.8% 313 4.7% 1,816 4.1% 1,561 3.9% 1,486 17.8% 6,810 15.3% 5,843
K2O 27,157 100.0% 6.0% 1,617 13.1% 3,563 15.0% 4,075 3.2% 870 7.1% 1,924 5.2% 1,400 3.5% 955 2.3% 616 8.6% 2,344 21.7% 5,880 14.4% 3,914
N+P+K 161,224 100.0% 15.2% 24,492 14.6% 23,476 15.9% 25,566 4.6% 7,435 3.4% 5,412 1.5% 2,478 4.4% 7,125 3.6% 5,859 4.3% 7,002 17.0% 27,369 15.5% 25,009
Source: International Fertilizer Industry Association. AgCom/09/28
CEREALS OILSEEDSWheat Rice Maize Other CG Sugar Crops Fruits & Veg. Other CropsSoybean Oil Palm Other OS Cotton

17
Fertilizer Use by Crop ('000 t nutrients) Last update: 7 April 2009
2007 + 2007/08
Total % of World % Qty % Qty % Qty % Qty % Qty % Qty % Qty % Qty % Qty % Qty % Qty
China N 32,000 31.8% 13.5% 4,320 17.6% 5,632 15.8% 5,056 1.0% 320 1.4% 448 0.0% 6 4.5% 1,440 4.3% 1,376 1.6% 512 31.0% 9,920 9.3% 2,970
P2O5 12,000 30.5% 16.0% 1,920 15.0% 1,800 7.0% 840 1.0% 120 3.0% 360 0.0% 2 4.7% 564 4.1% 492 2.3% 276 34.0% 4,080 12.9% 1,546
K2O 6,200 21.5% 4.0% 248 28.0% 1,736 2.2% 136 1.0% 62 1.0% 62 0.1% 6 2.2% 136 1.3% 81 5.0% 310 50.0% 3,100 5.2% 322
N+P+K 50,200 29.8% 12.9% 6,488 18.3% 9,168 12.0% 6,032 1.0% 502 1.7% 870 0.0% 14 4.3% 2,140 3.9% 1,949 2.2% 1,098 34.1% 17,100 9.6% 4,838
India N 14,633 14.6% 21.0% 3,073 30.0% 4,390 2.5% 366 4.5% 658 1.0% 146 0.0% 0 4.5% 658 6.5% 951 5.0% 732 7.0% 1,024 18.0% 2,634
P2O5 5,726 14.6% 20.0% 1,145 25.0% 1,432 1.5% 86 5.0% 286 2.5% 143 0.0% 0 7.0% 401 8.0% 458 4.5% 258 11.0% 630 15.5% 888
K2O 2,657 9.2% 8.0% 213 34.0% 903 1.0% 27 2.5% 66 1.0% 27 0.0% 0 5.0% 133 5.5% 146 10.0% 266 22.0% 585 11.0% 292
N+P+K 23,016 13.6% 19.3% 4,431 29.2% 6,725 2.1% 478 4.4% 1,011 1.4% 316 0.0% 0 5.2% 1,192 6.8% 1,555 5.5% 1,255 9.7% 2,239 16.6% 3,814
USA N 11,610 11.5% 13.2% 1,533 2.2% 255 46.7% 5,422 3.5% 406 1.0% 116 0.0% 0 1.6% 186 2.2% 255 1.0% 116 4.4% 511 24.2% 2,810
P2O5 4,080 10.4% 14.7% 600 1.1% 45 43.9% 1,791 2.3% 94 10.5% 428 0.0% 0 2.1% 86 2.7% 110 1.1% 45 6.0% 245 15.6% 636
K2O 4,540 15.7% 5.0% 227 1.0% 45 45.8% 2,079 1.0% 45 14.9% 676 0.0% 0 2.1% 95 3.0% 136 2.9% 132 6.8% 309 17.5% 795
N+P+K 20,230 12.0% 11.7% 2,359 1.7% 346 45.9% 9,292 2.7% 546 6.0% 1,221 0.0% 0 1.8% 367 2.5% 502 1.4% 293 5.3% 1,064 21.0% 4,241
EU-27 N 11,617 11.6% 27.8% 3,230 0.4% 46 11.9% 1,382 16.7% 1,940 0.1% 12 0.0% 0 8.7% 1,011 0.5% 58 1.8% 209 7.1% 825 25.0% 2,904
P2O5 3,454 8.8% 21.8% 753 0.5% 17 13.0% 449 17.3% 598 0.3% 10 0.0% 0 7.9% 273 0.6% 21 3.1% 107 12.4% 428 23.1% 798
K2O 3,865 13.4% 14.3% 553 0.8% 31 12.2% 472 13.1% 506 0.3% 12 0.0% 0 9.8% 379 0.5% 19 5.3% 205 13.8% 533 29.9% 1,156
N+P+K 18,936 11.2% 24.0% 4,535 0.5% 95 12.2% 2,303 16.1% 3,044 0.2% 34 0.0% 0 8.8% 1,662 0.5% 98 2.8% 521 9.4% 1,786 25.7% 4,858
Brazil N 2,751 2.7% 2.9% 80 5.3% 146 31.1% 856 4.0% 110 3.9% 107 0.2% 6 0.1% 3 8.4% 231 22.3% 613 6.6% 182 15.2% 418
P2O5 3,659 9.3% 2.1% 77 3.9% 143 20.0% 732 1.9% 70 42.4% 1,551 0.1% 4 0.1% 4 4.4% 161 8.6% 315 5.0% 183 11.5% 421
K2O 4,175 14.5% 1.8% 75 3.7% 154 18.5% 772 1.0% 42 34.1% 1,424 0.2% 8 0.1% 4 3.7% 154 20.4% 852 5.3% 221 11.2% 468
N+P+K 10,585 6.3% 2.2% 232 4.2% 443 22.3% 2,360 2.1% 221 29.1% 3,082 0.2% 18 0.1% 11 5.2% 547 16.8% 1,780 5.5% 586 12.3% 1,307
Indonesia N 2,596 2.6% 0.0% 0 45.0% 1,168 15.0% 389 0.0% 0 0.4% 10 13.0% 337 1.0% 26 0.1% 1 2.0% 52 9.0% 234 14.6% 378
P2O5 510 1.3% 0.0% 0 22.0% 112 15.0% 77 0.0% 0 3.0% 15 25.0% 128 3.0% 15 0.2% 1 5.0% 26 10.0% 51 16.9% 86
K2O 850 2.9% 0.0% 0 14.0% 119 10.0% 85 0.0% 0 0.6% 5 48.0% 408 1.0% 9 0.1% 0 9.0% 77 12.0% 102 5.4% 45
N+P+K 3,956 2.3% 0.0% 0 35.4% 1,399 13.9% 551 0.0% 0 0.8% 31 22.1% 873 1.3% 50 0.1% 2 3.9% 154 9.8% 387 12.9% 509
Pakistan N 2,923 2.9% 37.0% 1,082 9.1% 266 4.8% 140 0.6% 18 0.0% 0 0.0% 0 1.2% 35 18.5% 541 7.9% 231 4.1% 120 16.8% 491
P2O5 627 1.6% 34.1% 214 8.5% 53 6.1% 38 0.5% 3 0.0% 0 0.0% 0 1.6% 10 15.7% 98 9.6% 60 4.8% 30 19.1% 120
K2O 29 0.1% 27.0% 8 11.0% 3 11.0% 3 0.0% 0 0.0% 0 0.0% 0 0.0% 0 8.0% 2 15.0% 4 15.0% 4 13.0% 4
N+P+K 3,579 2.1% 36.4% 1,303 9.0% 322 5.1% 182 0.6% 21 0.0% 0 0.0% 0 1.3% 45 17.9% 642 8.3% 295 4.3% 154 17.2% 615
Canada N 1,939 1.9% 29.6% 574 0.0% 0 10.5% 204 16.6% 322 0.5% 10 0.0% 0 22.9% 444 0.0% 0 0.5% 10 0.6% 12 18.8% 365
P2O5 508 1.3% 31.9% 162 0.0% 0 10.7% 54 20.6% 105 5.3% 27 0.0% 0 19.4% 99 0.0% 0 0.5% 3 0.6% 3 11.0% 56
K2O 354 1.2% 7.7% 27 0.0% 0 26.9% 95 3.1% 11 7.4% 26 0.0% 0 24.4% 86 0.0% 0 0.5% 2 1.8% 6 28.2% 100
N+P+K 2,801 1.7% 27.2% 763 0.0% 0 12.6% 353 15.6% 437 2.2% 63 0.0% 0 22.5% 629 0.0% 0 0.5% 14 0.8% 21 18.6% 520
Vietnam N 1,136 1.1% 0.0% 0 68.0% 772 12.0% 136 0.0% 0 0.7% 8 0.0% 0 1.5% 17 0.2% 2 4.0% 45 3.0% 34 10.6% 120
P2O5 631 1.6% 0.0% 0 72.0% 454 7.5% 47 0.0% 0 1.5% 9 0.0% 0 3.0% 19 0.1% 1 2.5% 16 4.0% 25 9.4% 59
K2O 433 1.5% 0.0% 0 66.0% 286 6.5% 28 0.0% 0 1.5% 6 0.0% 0 3.0% 13 0.1% 0 8.0% 35 5.0% 22 9.9% 43
N+P+K 2,200 1.3% 0.0% 0 68.8% 1,513 9.6% 212 0.0% 0 1.1% 24 0.0% 0 2.2% 49 0.2% 3 4.4% 96 3.7% 81 10.1% 223
Australia N 848 0.8% 30.7% 260 0.0% 0 0.7% 6 24.1% 204 0.0% 0 0.0% 0 10.3% 87 0.7% 6 8.2% 70 8.4% 71 16.9% 143
P2O5 982 2.5% 28.9% 284 0.0% 0 0.4% 4 24.0% 236 0.0% 0 0.0% 0 7.7% 76 0.3% 3 3.1% 30 4.9% 48 30.7% 301
K2O 227 0.8% 12.6% 29 0.0% 0 0.2% 0 5.7% 13 0.0% 0 0.0% 0 3.4% 8 0.4% 1 19.8% 45 24.0% 54 33.9% 77
N+P+K 2,057 1.2% 27.8% 573 0.0% 0 0.5% 10 22.0% 453 0.0% 0 0.0% 0 8.3% 171 0.5% 10 7.0% 145 8.5% 174 25.4% 522
Turkey N 1,356 1.3% 41.5% 563 0.9% 12 6.8% 92 12.1% 164 0.1% 1 0.0% 0 4.6% 62 5.4% 73 2.0% 27 17.0% 231 9.6% 130
P2O5 516 1.3% 41.7% 215 0.9% 5 4.7% 24 13.1% 68 0.1% 1 0.0% 0 4.4% 23 5.2% 27 3.4% 18 14.4% 74 12.1% 62
K2O 109 0.4% 15.2% 17 0.5% 1 6.1% 7 2.9% 3 0.1% 0 0.0% 0 5.4% 6 4.2% 5 13.2% 14 40.4% 44 12.0% 13
N+P+K 1,981 1.2% 40.1% 794 0.9% 17 6.2% 123 11.9% 235 0.1% 2 0.0% 0 4.6% 91 5.3% 105 3.0% 59 17.6% 349 10.4% 206
Russia N 1,175 1.2% 42.0% 494 1.2% 14 7.3% 86 22.0% 259 0.4% 5 0.0% 0 2.3% 27 0.0% 0 9.6% 113 1.0% 12 14.2% 167
P2O5 470 1.2% 40.0% 188 1.1% 5 5.5% 26 21.0% 99 1.1% 5 0.0% 0 7.1% 33 0.0% 0 15.0% 71 1.4% 7 7.8% 37
K2O 296 1.0% 26.0% 77 0.1% 0 5.7% 17 23.0% 68 0.8% 2 0.0% 0 4.1% 12 0.0% 0 24.0% 71 3.7% 11 12.6% 37
N+P+K 1,941 1.2% 39.1% 758 1.0% 20 6.6% 128 21.9% 425 0.6% 12 0.0% 0 3.7% 73 0.0% 0 13.1% 254 1.5% 29 12.4% 241
CEREALS OILSEEDSWheat Rice Maize Other CG Soybean Oil Palm Other OS Cotton Sugar Crops Fruits & Veg. Other Crops

18
Malaysia N 600 0.6% 0.0% 0 15.0% 90 0.5% 3 0.0% 0 0.0% 0 65.0% 390 0.2% 1 0.0% 0 0.3% 2 3.0% 18 16.1% 96
P2O5 250 0.6% 0.0% 0 19.0% 47 0.5% 1 0.0% 0 0.0% 0 55.0% 138 0.2% 1 0.0% 0 0.3% 1 6.0% 15 19.0% 48
K2O 1,050 3.6% 0.0% 0 5.0% 53 0.1% 1 0.0% 0 0.0% 0 85.0% 893 0.1% 1 0.0% 0 0.2% 2 2.0% 21 7.7% 80
N+P+K 1,900 1.1% 0.0% 0 10.0% 190 0.3% 5 0.0% 0 0.0% 0 74.7% 1,420 0.1% 2 0.0% 0 0.2% 5 2.8% 54 11.8% 224
Argentina N 903 0.9% 37.7% 340 0.6% 5 29.9% 270 5.5% 50 6.6% 60 0.0% 0 3.3% 30 0.6% 5 2.8% 25 6.6% 60 6.4% 58
P2O5 695 1.8% 25.9% 180 0.4% 3 17.3% 120 6.5% 45 34.5% 240 0.0% 0 2.9% 20 0.1% 1 0.1% 1 7.2% 50 5.1% 35
K2O 65 0.2% 2.3% 1 3.8% 2 1.5% 1 0.5% 0 2.0% 1 0.0% 0 0.9% 1 0.2% 0 10.8% 7 53.8% 35 24.2% 16
N+P+K 1,663 1.0% 31.4% 522 0.6% 11 23.5% 391 5.7% 95 18.1% 301 0.0% 0 3.0% 51 0.4% 6 2.0% 33 8.7% 145 6.6% 109
Bangladesh N 1,240 1.2% 1.1% 14 93.5% 1,159 0.4% 5 0.0% 0 0.0% 0 0.0% 0 0.8% 10 0.2% 2 0.6% 7 1.5% 19 1.9% 24
P2O5 220 0.6% 2.1% 5 78.0% 172 0.4% 1 0.0% 0 0.0% 0 0.0% 0 2.5% 6 0.2% 0 1.5% 3 6.0% 13 9.3% 20
K2O 170 0.6% 1.6% 3 80.3% 137 0.4% 1 0.0% 0 0.0% 0 0.0% 0 2.0% 3 0.4% 1 2.0% 3 5.0% 9 8.3% 14
N+P+K 1,630 1.0% 1.3% 21 90.0% 1,468 0.4% 7 0.0% 0 0.0% 0 0.0% 0 1.2% 19 0.2% 3 0.9% 14 2.5% 40 3.6% 59
Iran N 1,000 1.0% 36.0% 360 7.5% 75 5.5% 55 8.0% 80 0.2% 2 0.0% 0 4.5% 45 2.0% 20 3.5% 35 15.0% 150 17.8% 178
P2O5 440 1.1% 34.0% 150 5.5% 24 5.0% 22 7.5% 33 0.8% 4 0.0% 0 6.5% 29 1.5% 7 3.5% 15 23.0% 101 12.7% 56
K2O 180 0.6% 24.0% 43 4.0% 7 3.5% 6 5.5% 10 0.3% 1 0.0% 0 4.5% 8 1.5% 3 2.5% 5 44.0% 79 10.2% 18
N+P+K 1,620 1.0% 34.1% 553 6.6% 106 5.1% 83 7.6% 123 0.4% 6 0.0% 0 5.0% 82 1.8% 29 3.4% 55 20.4% 330 15.6% 252
Mexico N 1,140 1.1% 5.3% 60 0.5% 6 61.3% 699 1.8% 21 0.0% 0 1.2% 14 0.2% 2 0.5% 6 6.1% 70 14.9% 170 8.2% 93
P2O5 250 0.6% 2.9% 7 0.8% 2 40.0% 100 0.8% 2 1.2% 3 4.0% 10 0.2% 1 1.2% 3 8.8% 22 32.0% 80 8.1% 20
K2O 220 0.8% 1.2% 3 0.9% 2 9.0% 20 0.0% 0 0.9% 2 4.5% 10 0.0% 0 0.9% 2 27.8% 61 47.1% 104 7.7% 17
N+P+K 1,610 1.0% 4.4% 70 0.6% 10 50.8% 819 1.4% 23 0.3% 5 2.1% 34 0.2% 3 0.7% 11 9.5% 153 22.0% 353 8.1% 131
Egypt N 1,250 1.2% 24.0% 300 9.0% 113 27.0% 338 4.5% 56 0.1% 1 0.0% 0 1.0% 13 3.5% 44 4.0% 50 19.0% 238 7.9% 99
P2O5 244 0.6% 14.5% 35 8.5% 21 10.5% 26 2.5% 6 0.2% 0 0.0% 0 1.5% 4 4.5% 11 3.0% 7 45.0% 110 9.8% 24
K2O 50 0.2% 20.0% 10 0.0% 0 15.0% 8 2.0% 1 0.1% 0 0.0% 0 0.5% 0 4.0% 2 15.0% 8 35.0% 18 8.4% 4
N+P+K 1,544 0.9% 22.4% 345 8.6% 133 24.0% 371 4.1% 63 0.1% 2 0.0% 0 1.1% 16 3.7% 57 4.2% 65 23.6% 365 8.2% 127
Thailand N 872 0.9% 0.0% 0 30.0% 262 7.0% 61 0.5% 4 0.1% 1 3.0% 26 1.0% 9 1.0% 9 5.0% 44 28.0% 244 24.4% 213
P2O5 276 0.7% 0.0% 0 25.0% 69 7.0% 19 0.5% 1 1.0% 3 6.0% 17 1.5% 4 1.0% 3 10.0% 28 30.0% 83 18.0% 50
K2O 305 1.1% 0.0% 0 5.0% 15 10.0% 31 0.5% 2 0.1% 0 10.0% 31 1.0% 3 1.0% 3 13.0% 40 36.0% 110 23.4% 71
N+P+K 1,453 0.9% 0.0% 0 23.8% 346 7.6% 111 0.5% 7 0.3% 4 5.0% 73 1.1% 16 1.0% 15 7.6% 111 30.1% 437 23.0% 334
South Africa N 439 0.4% 8.0% 35 0.0% 0 41.0% 180 1.6% 7 0.3% 1 0.0% 0 5.7% 25 0.3% 1 13.0% 57 14.0% 61 16.1% 71
P2O5 192 0.5% 10.5% 20 0.0% 0 32.0% 61 1.8% 3 1.5% 3 0.0% 0 7.5% 14 0.6% 1 14.5% 28 15.5% 30 16.1% 31
K2O 137 0.5% 2.3% 3 0.0% 0 10.5% 14 0.5% 1 0.6% 1 0.0% 0 1.3% 2 0.2% 0 43.0% 59 28.0% 38 13.6% 19
N+P+K 768 0.5% 7.6% 58 0.0% 0 33.3% 256 1.5% 11 0.7% 5 0.0% 0 5.4% 41 0.4% 3 18.7% 144 16.9% 130 15.7% 120
Philippines N 530 0.5% 0.0% 0 40.0% 212 20.0% 106 0.0% 0 0.0% 0 0.5% 3 2.0% 11 0.0% 0 2.0% 11 20.0% 106 15.5% 82
P2O5 120 0.3% 0.0% 0 30.0% 36 12.0% 14 0.0% 0 0.0% 0 0.5% 1 5.0% 6 0.0% 0 6.0% 7 30.0% 36 16.5% 20
K2O 115 0.4% 0.0% 0 10.0% 12 5.0% 6 0.0% 0 0.0% 0 3.0% 3 3.0% 3 0.0% 0 15.0% 17 50.0% 58 14.0% 16
N+P+K 765 0.5% 0.0% 0 33.9% 260 16.5% 126 0.0% 0 0.0% 0 0.9% 7 2.6% 20 0.0% 0 4.6% 35 26.1% 200 15.4% 118
Chile N 268 0.3% 18.0% 48 0.7% 2 13.0% 35 6.0% 16 0.0% 0 0.0% 0 0.8% 2 0.0% 0 1.6% 4 20.0% 54 39.9% 107
P2O5 163 0.4% 18.5% 30 1.2% 2 7.5% 12 6.0% 10 0.0% 0 0.0% 0 0.6% 1 0.0% 0 1.2% 2 10.0% 16 55.0% 90
K2O 92 0.3% 5.7% 5 1.8% 2 8.5% 8 2.0% 2 0.0% 0 0.0% 0 0.5% 0 0.0% 0 5.7% 5 45.0% 41 30.8% 28
N+P+K 523 0.3% 16.0% 84 1.0% 5 10.5% 55 5.3% 28 0.0% 0 0.0% 0 0.7% 4 0.0% 0 2.2% 11 21.3% 111 43.0% 225
Morocco N 235 0.2% 32.0% 75 0.4% 1 1.8% 4 22.0% 52 0.0% 0 0.0% 0 1.7% 4 0.0% 0 5.0% 12 18.0% 42 19.1% 45
P2O5 158 0.4% 29.0% 46 0.4% 1 3.9% 6 20.0% 32 0.0% 0 0.0% 0 3.3% 5 0.0% 0 5.6% 9 17.0% 27 20.8% 33
K2O 53 0.2% 20.0% 11 0.0% 0 1.2% 1 13.0% 7 0.0% 0 0.0% 0 1.2% 1 0.0% 0 9.0% 5 46.0% 24 9.6% 5
N+P+K 446 0.3% 29.5% 132 0.4% 2 2.5% 11 20.2% 90 0.0% 0 0.0% 0 2.2% 10 0.0% 0 5.7% 25 21.0% 94 18.6% 83
ROW N 7,468 7.4% 13.0% 971 14.0% 1,046 13.0% 971 6.0% 448 0.5% 37 0.7% 52 5.0% 373 5.0% 373 5.0% 373 18.0% 1,344 19.8% 1,479
P2O5 3,316 8.4% 10.0% 332 12.0% 398 10.0% 332 6.0% 199 5.0% 166 1.0% 33 5.0% 166 5.0% 166 6.0% 199 20.0% 663 20.0% 663
K2O 2,703 9.4% 7.0% 189 12.0% 324 10.0% 270 4.0% 108 3.0% 81 4.0% 108 4.0% 108 3.0% 81 12.0% 324 25.0% 676 16.0% 432
N+P+K 13,487 8.0% 11.1% 1,492 13.1% 1,768 11.7% 1,573 5.6% 755 2.1% 284 1.4% 194 4.8% 647 4.6% 620 6.6% 897 19.9% 2,683 19.1% 2,574
World N 100,529 100.0% 17.3% 17,411 15.6% 15,673 16.8% 16,861 5.1% 5,135 1.0% 966 0.8% 834 4.5% 4,521 3.9% 3,955 3.4% 3,420 15.6% 15,680 16.0% 16,074
P2O5 39,324 100.0% 16.2% 6,362 12.3% 4,840 12.4% 4,883 5.1% 2,008 7.5% 2,969 0.8% 331 4.7% 1,857 4.0% 1,563 3.9% 1,545 17.9% 7,028 15.1% 6,100
K2O 28,875 100.0% 6.0% 1,741 13.3% 3,832 14.2% 4,087 3.3% 947 8.1% 2,327 5.1% 1,467 3.5% 1,011 2.2% 637 8.8% 2,547 21.5% 6,204 14.1% 4,073
N+P+K 168,728 100.0% 15.1% 25,514 14.4% 24,345 15.3% 25,832 4.8% 8,091 3.7% 6,261 1.6% 2,632 4.4% 7,389 3.6% 6,156 4.5% 7,512 17.1% 28,912 15.6% 26,248
Source: International Fertilizer Industry Association. AgCom/09/28
Sugar CropsCEREALS OILSEEDS
Fruits & Veg. Other CropsWheat Rice Maize Other CG Soybean Oil Palm Other OS Cotton

19
Appendix B. Fertilizer Application Rates, 2007/08 (Source: IFA 2009 and Author Calculations)
NITROGEN APPLICATION RATES (KG/HA of nutrients)
Sum of Rate 07/08 Column Labels
Row Labels Wheat, All
Corn
Barley
Oats
Rye
Sorghum
Soyb
eans
Pean
ut
Rapeseed
Sunflower Seed
Palm
Oil
Rice, A
ll
Cotton
Sugar Beet
Sugar Can
e
Africa 12
Algeria 28 17 10
Argentina 57 79 92 18 4 16 10 30 17 84
Australia 21 87 35 35 68 0 91 183
Bangladesh 104
Brazil 43 58 4 5 51 215 88
Cambodia 7
Cameroon 3
Canada 66 149 60 45 8 71 0 0 41
China 182 172 80 51 101 169 108 195 222 293 283
Cote d'Ivoire 5
Egypt 233 469 168 187 234
EU 131 164 98 105 105 34 137 34 110 139 116 183
Ghana 6
Guinea 14
Hong Kong 0
India 110 44 83 17 29 82 100 101 145
Indonesia 121 80 98 130 148
Iran 52 119 124 233
Iraq 49
Japan 68 16 77 14 118 124 0 145 45
Kazakhstan 87
Kenya 54
Malaysia 115 98 138 150
Mali 27
Mexico 84 95 7 10 0 58 86 52 104
Morocco 29 164 141
Mozambique 5
Myanmar 7
Nigeria 1 6
Pakistan 129 137 40 45 104 180 113 186
Paraguay 3
Philippines 39 49 27
Russia 20 66 16 17 18 0 103
Senegal 28
Sierra Leona 3
South Africa 55 32 54 0 186
South Korea 59 74 15 127 0
Taiwan 0 85 0 109 0
Tanzania 9
Thailand 61 25 43
Tunisia 34
Turkey 128 141 90
U.S. 74 155 67 56 101 4 45 268 47 230 60 148 123
Ukraine 27 73 17 19 18 105 31 100
Uruguay 65
Uzbekistan 184
Vietnam 119 104
Colombia 70
Cuba 58
Guatemala 76
Peru 69
Venezuela 113
Africa, Other 30 13 13 38 94 1 10 9 21 11 45 1 0 0 29
Americas, Other 46 58 126 129 143 139 17 9 123 17 47 76 21 228 101
Asia, Other 34 55 32 46 14 53 5 42 70 45 32 88 72 124 202
Europe, Other 54 71 27 32 22 0 9 0 11 5 0 69 28 31 0
Oceania, Other 124 141 171 34 43 0 19 13 68 13 59 0 0 0 183
World 80 105 48 53 61 31 11 37 112 28 78 101 120 118 123

20
PHOSPHOROUS APPLICATION RATES (KG/HA of nutrients)
Sum of Rate 07/08 Column Labels
Row Labels Wheat, All
Corn
Barley
Oats
Rye
Sorghum
Soybeans
Peanut
Rap
eseed
Sunflower Seed
Palm Oil
Rice, All
Cotton
Sugar Beet
Sugar Can
e
Africa 10
Algeria 17 25 8
Argentina 30 35 44 44 15 13 7 15 2 2
Australia 23 58 40 40 59 0 45 80
Bangladesh 15
Brazil 41 50 26 73 50 149 45
Cambodia 5
Cameroon 1
Canada 19 40 19 15 23 16 0 0 18
China 81 28 35 41 59 55 27 62 79 170 151
Cote d'Ivoire 2
Egypt 27 36 31 29 33
EU 30 53 34 24 24 30 35 13 41 50 59 80
Ghana 2
Guinea 10
Hong Kong 0
India 41 10 36 16 40 25 33 49 51
Indonesia 24 30 9 77 73
Iran 22 38 63 83
Iraq 21
Japan 20 5 72 50 216 52 0 267 18
Kazakhstan 54
Kenya 30
Malaysia 48 34 73 63
Mali 21
Mexico 10 14 1 1 48 13 30 27 33
Morocco 18 134 62
Mozambique 3
Myanmar 3
Nigeria 0 2
Pakistan 25 37 8 7 21 33 37 48
Paraguay 11
Philippines 5 8 18
Russia 8 20 9 2 3 0 64
Senegal 21
Sierra Leona 1
South Africa 19 20 23 0 91
South Korea 17 23 52 53 0
Taiwan 0 26 0 45 0
Tanzania 5
Thailand 19 7 27
Tunisia 21
Turkey 49 52 58
U.S. 29 51 16 13 23 17 42 121 11 40 26 53 53
Ukraine 10 22 9 3 3 23 37 95
Uruguay 59
Uzbekistan 46
Vietnam 41 61
Colombia 70
Cuba 40
Guatemala 61
Peru 69
Venezuela 75
Africa, Other 9 3 14 33 106 0 36 6 27 5 27 1 0 0 24
Americas, Other 13 31 77 50 21 37 62 23 109 16 29 32 3 104 21
Asia, Other 13 17 12 12 2 18 17 13 12 6 19 23 45 34 29
Europe, Other 12 21 15 4 4 0 11 0 10 6 0 29 17 16 0
Oceania, Other 36 43 196 24 30 0 69 23 59 23 36 0 0 0 80
World 29 31 21 16 13 12 33 29 34 14 31 31 47 68 52
21
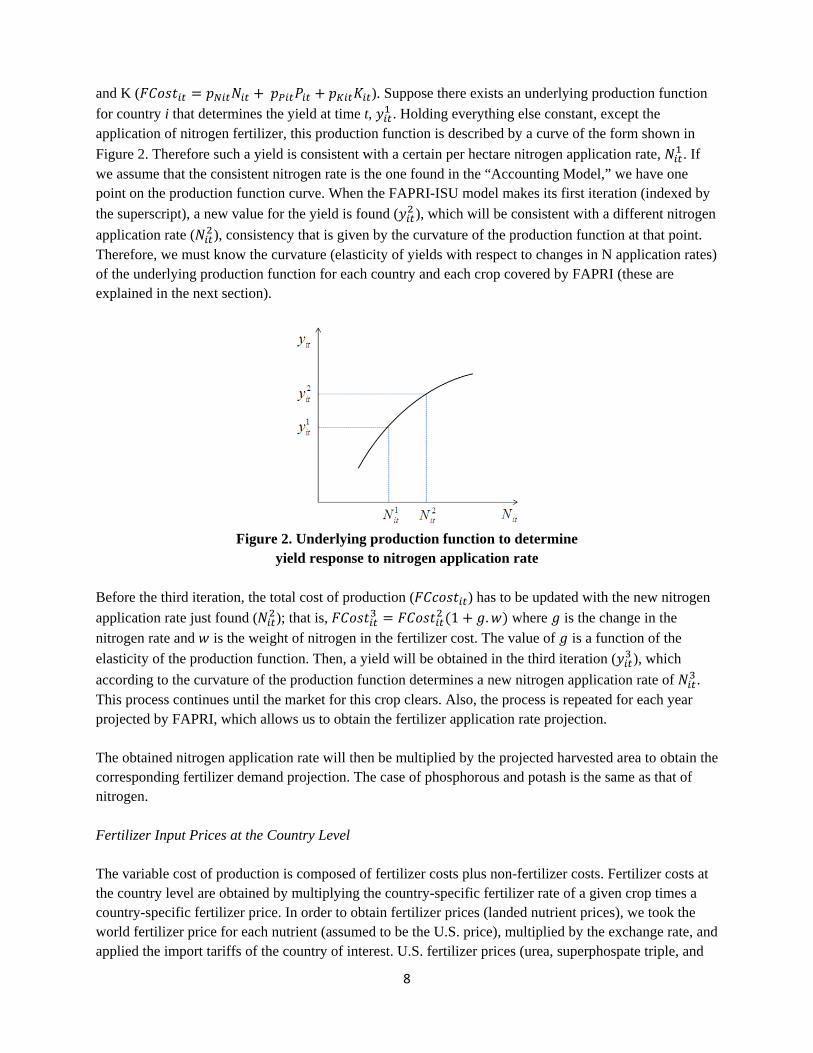
POTASSIUM APPLICATION RATES (KG/HA of nutrients)
Sum of Rate 07/08 Column Labels
Row Labels Wheat, All
Corn
Barley
Oats
Rye
Sorghum
Soybeans
Peanut
Rap
eseed
Sunflower Seed
Palm Oil
Rice, All
Cotton
Sugar Beet
Sugar Can
e
Africa 9
Algeria 4 3 1
Argentina 0 0 0 0 0 0 0 13 0 23
Australia 2 7 2 2 6 0 14 118
Bangladesh 12
Brazil 41 52 22 67 54 143 122
Cambodia 0
Cameroon 0
Canada 3 70 2 1 22 14 0 0 93
China 10 5 25 7 11 14 14 60 13 125 178
Cote d'Ivoire 0
Egypt 8 10 0 21 40
EU 22 56 28 21 21 34 54 8 73 46 113 118
Ghana 0
Guinea 8
Hong Kong 0
India 8 3 8 3 17 4 21 15 53
Indonesia 26 97 10 43 219
Iran 6 11 10 45
Iraq 20
Japan 25 5 74 33 107 51 0 132 12
Kazakhstan 29
Kenya 0
Malaysia 40 223 81 175
Mali 17
Mexico 4 3 0 0 31 0 30 18 92
Morocco 4 59 92
Mozambique 0
Myanmar 0
Nigeria 0 0
Pakistan 1 3 0 0 1 1 1 3
Paraguay 0
Philippines 2 3 44
Russia 3 13 6 1 2 0 65
Senegal 17
Sierra Leona 0
South Africa 4 4 5 0 192
South Korea 22 25 34 52 0
Taiwan 0 28 0 44 0
Tanzania 0
Thailand 31 1 39
Tunisia 5
Turkey 6 9 48
U.S. 11 59 4 4 14 26 82 97 13 41 32 76 279
Ukraine 4 14 7 1 2 23 11 110
Uruguay 19
Uzbekistan 6
Vietnam 24 39
Colombia 70
Cuba 83
Guatemala 38
Peru 69
Venezuela 75
Africa, Other 11 0 3 10 18 0 24 5 3 1 70 1 0 0 19
Americas, Other 17 25 7 0 19 46 40 19 62 16 74 31 1 278 144
Asia, Other 3 18 5 13 2 0 2 5 6 6 49 18 24 35 63
Europe, Other 11 24 10 2 2 0 5 0 3 2 0 28 9 31 0
Oceania, Other 46 47 11 3 4 0 45 3 6 3 91 0 0 0 118
World 8 26 11 7 11 4 26 12 22 6 137 25 19 86 92

22
Appendix C: Estimated Cobb-Douglas Production Function for Phosphorous and Potassium
Cobb-Douglas Production Function for Phosphorous
Cobb-Douglas Production Function for Potassium
0.0
2.0
4.0
6.0
8.0
10.0
12.0
14.0
0 20 40 60 80 100 120 140
Yield, ton/ha
kg P/haRaw data Fitted Cobb‐Douglas
0.0
2.0
4.0
6.0
8.0
10.0
12.0
14.0
0 20 40 60 80 100 120 140 160
Yield, ton/ha
kg K/haRaw data Fitted Cobb‐Douglas

23
Appendix D: Projected Fertilizer Use for the World, U.S., China, and India in the Period 2011-2025

24
World Fertilizer Use2010 2011 2012 2013 2014 2015 2016 2017 2018 2019 2020 2023 2025
Fertilizer UseCorn (Thousand Metric Tons) Nitrogen 16,435 16,735 16,504 16,788 16,829 16,995 17,009 17,043 17,062 17,110 17,125 17,160 17,195 Phosphorous 4,899 5,073 5,023 5,127 5,151 5,215 5,226 5,235 5,233 5,256 5,265 5,281 5,291 Potassium 4,284 4,508 4,511 4,628 4,679 4,770 4,812 4,826 4,822 4,864 4,882 4,915 4,931
Barley Nitrogen 2,390 2,450 2,574 2,510 2,554 2,545 2,558 2,552 2,557 2,558 2,554 2,560 2,557 Phosphorous 1,011 1,055 1,135 1,095 1,120 1,119 1,137 1,133 1,132 1,143 1,148 1,155 1,153 Potassium 486 505 536 525 533 535 540 539 540 544 545 546 545
Oats Nitrogen 625 650 669 678 668 677 667 675 669 675 672 676 678 Phosphorous 186 196 201 203 199 202 198 201 199 203 204 207 209 Potassium 81 85 87 87 86 87 87 88 88 89 89 91 92
Rye Nitrogen 358 406 437 428 450 449 464 463 476 477 488 501 511 Phosphorous 76 87 93 92 96 97 100 100 103 103 106 109 111 Potassium 61 70 75 74 78 78 81 81 83 84 86 89 91
Sorghum Nitrogen 1,088 1,146 1,077 1,110 1,071 1,083 1,064 1,071 1,068 1,076 1,076 1,087 1,098 Phosphorous 458 478 453 464 450 455 448 451 450 454 454 460 466 Potassium 183 198 185 194 188 191 188 190 189 190 190 191 193
Wheat, All Nitrogen 17,705 17,900 18,314 18,016 18,060 18,044 18,058 18,038 18,016 17,978 17,996 17,913 17,845 Phosphorous 6,416 6,452 6,615 6,409 6,394 6,367 6,364 6,350 6,312 6,304 6,326 6,289 6,254 Potassium 2,159 2,233 2,240 2,180 2,185 2,183 2,188 2,183 2,172 2,167 2,166 2,149 2,114
Soybeans Nitrogen 1,438 1,435 1,419 1,414 1,417 1,418 1,423 1,427 1,430 1,432 1,434 1,433 1,434 Phosphorous 4,436 4,444 4,407 4,413 4,441 4,456 4,481 4,500 4,523 4,549 4,579 4,657 4,715 Potassium 4,255 4,240 4,189 4,182 4,199 4,203 4,226 4,240 4,256 4,276 4,301 4,357 4,410
Rapeseed Nitrogen 3,592 3,656 3,650 3,659 3,674 3,680 3,692 3,712 3,730 3,746 3,761 3,806 3,834 Phosphorous 1,113 1,164 1,151 1,146 1,148 1,149 1,139 1,142 1,152 1,157 1,151 1,154 1,160 Potassium 689 725 716 714 719 723 723 728 736 742 739 750 759
Sunflower Seed Nitrogen 656 669 650 648 647 645 644 643 642 641 639 634 631 Phosphorous 334 342 336 336 336 336 336 337 338 338 338 339 339 Potassium 152 155 152 151 151 151 151 151 151 151 151 151 151
Peanut Nitrogen 837 854 865 877 886 898 907 915 922 924 925 925 923 Phosphorous 611 615 619 621 621 622 623 623 622 620 619 613 609 Potassium 247 252 254 255 255 256 257 257 257 257 257 257 257
Palm Kernel Nitrogen 1,081 1,140 1,164 1,179 1,203 1,227 1,234 1,236 1,256 1,268 1,274 1,318 1,358 Phosphorous 424 446 454 460 469 478 481 483 490 495 497 515 530 Potassium 1,855 1,945 1,977 1,997 2,035 2,073 2,084 2,080 2,113 2,133 2,144 2,217 2,282
Rice, All Nitrogen 15,805 15,603 15,585 15,547 15,569 15,564 15,566 15,566 15,552 15,543 15,535 15,578 15,536 Phosphorous 4,941 4,880 4,875 4,862 4,869 4,867 4,869 4,871 4,868 4,866 4,865 4,881 4,873 Potassium 3,797 3,734 3,726 3,710 3,713 3,709 3,709 3,707 3,702 3,698 3,696 3,704 3,692
Cotton Nitrogen 4,012 4,894 5,003 5,007 5,068 5,106 5,129 5,140 5,157 5,169 5,185 5,221 5,248 Phosphorous 1,533 1,689 1,678 1,656 1,661 1,667 1,672 1,674 1,680 1,685 1,694 1,715 1,729 Potassium 653 737 742 726 725 728 727 726 728 730 736 754 762
Sugar Cane Nitrogen 2,981 3,063 3,065 3,099 3,126 3,155 3,195 3,240 3,284 3,322 3,351 3,438 3,485 Phosphorous 1,293 1,329 1,331 1,346 1,359 1,373 1,392 1,413 1,434 1,452 1,466 1,509 1,531 Potassium 2,381 2,455 2,458 2,492 2,521 2,553 2,595 2,644 2,692 2,734 2,766 2,868 2,923
Sugar Beet Nitrogen 567 588 584 585 587 589 591 593 594 595 595 597 598 Phosphorous 321 332 330 331 332 333 334 335 336 337 337 338 338 Potassium 392 403 398 398 399 400 402 403 403 403 403 402 402
Crops, Other Nitrogen 32,141 32,894 33,063 33,059 33,181 33,305 33,362 33,415 33,461 33,507 33,551 33,664 33,703 Phosphorous 13,241 13,496 13,549 13,484 13,524 13,568 13,599 13,620 13,631 13,673 13,714 13,797 13,837 Potassium 10,602 10,885 10,877 10,909 10,985 11,072 11,135 11,168 11,208 11,270 11,315 11,457 11,533
TOTAL Nitrogen 101,708 104,081 104,621 104,605 104,990 105,381 105,562 105,729 105,877 106,021 106,161 106,510 106,632 Phosphorous 41,291 42,077 42,251 42,047 42,168 42,305 42,399 42,468 42,504 42,636 42,762 43,017 43,145 Potassium 32,278 33,129 33,123 33,223 33,453 33,713 33,904 34,010 34,139 34,331 34,467 34,899 35,136
* Other crops includes roots and tubers, pulses, nuts, rubber, coffee, tea, tobacco, ornamentals, turf, pasture, and forestry. World total fertilizer use projection of other crops is assumed to increase each year at the same rate as the world total nutrient use of the sum of all modeled commodities.
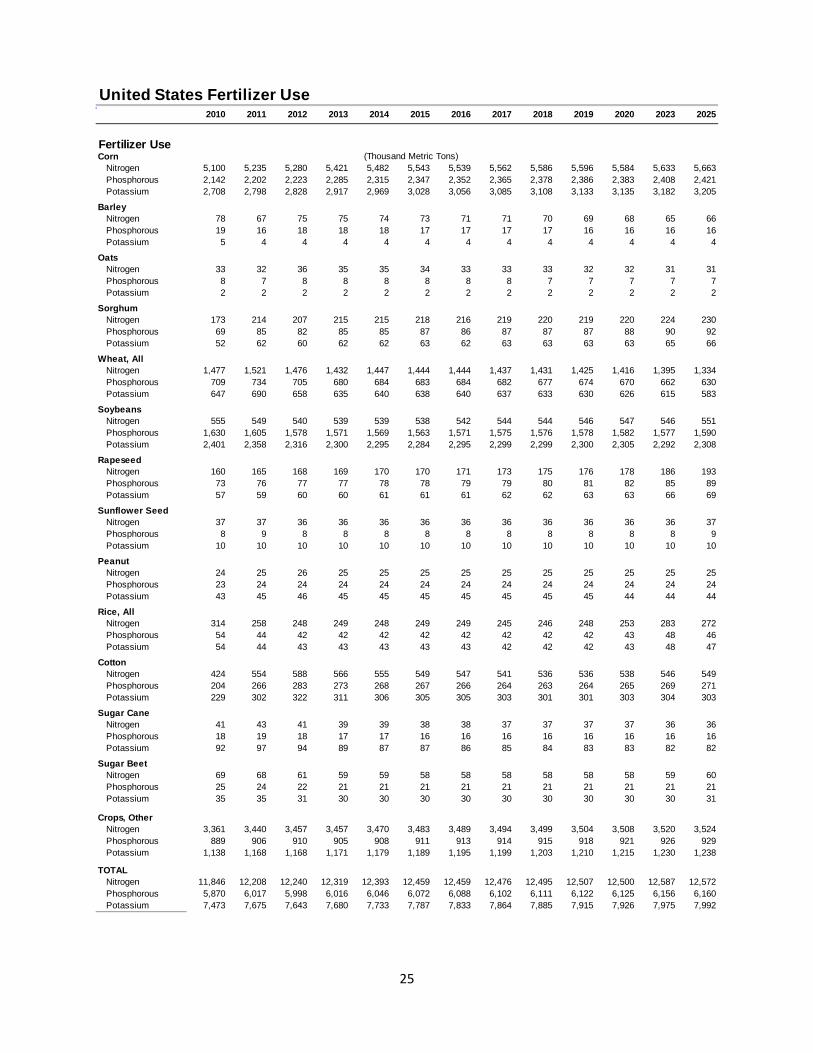
25
United States Fertilizer Use2010 2011 2012 2013 2014 2015 2016 2017 2018 2019 2020 2023 2025
Fertilizer UseCorn (Thousand Metric Tons) Nitrogen 5,100 5,235 5,280 5,421 5,482 5,543 5,539 5,562 5,586 5,596 5,584 5,633 5,663 Phosphorous 2,142 2,202 2,223 2,285 2,315 2,347 2,352 2,365 2,378 2,386 2,383 2,408 2,421 Potassium 2,708 2,798 2,828 2,917 2,969 3,028 3,056 3,085 3,108 3,133 3,135 3,182 3,205
Barley Nitrogen 78 67 75 75 74 73 71 71 70 69 68 65 66 Phosphorous 19 16 18 18 18 17 17 17 17 16 16 16 16 Potassium 5 4 4 4 4 4 4 4 4 4 4 4 4
Oats Nitrogen 33 32 36 35 35 34 33 33 33 32 32 31 31 Phosphorous 8 7 8 8 8 8 8 8 7 7 7 7 7 Potassium 2 2 2 2 2 2 2 2 2 2 2 2 2
Sorghum Nitrogen 173 214 207 215 215 218 216 219 220 219 220 224 230 Phosphorous 69 85 82 85 85 87 86 87 87 87 88 90 92 Potassium 52 62 60 62 62 63 62 63 63 63 63 65 66
Wheat, All Nitrogen 1,477 1,521 1,476 1,432 1,447 1,444 1,444 1,437 1,431 1,425 1,416 1,395 1,334 Phosphorous 709 734 705 680 684 683 684 682 677 674 670 662 630 Potassium 647 690 658 635 640 638 640 637 633 630 626 615 583
Soybeans Nitrogen 555 549 540 539 539 538 542 544 544 546 547 546 551 Phosphorous 1,630 1,605 1,578 1,571 1,569 1,563 1,571 1,575 1,576 1,578 1,582 1,577 1,590 Potassium 2,401 2,358 2,316 2,300 2,295 2,284 2,295 2,299 2,299 2,300 2,305 2,292 2,308
Rapeseed Nitrogen 160 165 168 169 170 170 171 173 175 176 178 186 193 Phosphorous 73 76 77 77 78 78 79 79 80 81 82 85 89 Potassium 57 59 60 60 61 61 61 62 62 63 63 66 69
Sunflower Seed Nitrogen 37 37 36 36 36 36 36 36 36 36 36 36 37 Phosphorous 8 9 8 8 8 8 8 8 8 8 8 8 9 Potassium 10 10 10 10 10 10 10 10 10 10 10 10 10
Peanut Nitrogen 24 25 26 25 25 25 25 25 25 25 25 25 25 Phosphorous 23 24 24 24 24 24 24 24 24 24 24 24 24 Potassium 43 45 46 45 45 45 45 45 45 45 44 44 44
Rice, All Nitrogen 314 258 248 249 248 249 249 245 246 248 253 283 272 Phosphorous 54 44 42 42 42 42 42 42 42 42 43 48 46 Potassium 54 44 43 43 43 43 43 42 42 42 43 48 47
Cotton Nitrogen 424 554 588 566 555 549 547 541 536 536 538 546 549 Phosphorous 204 266 283 273 268 267 266 264 263 264 265 269 271 Potassium 229 302 322 311 306 305 305 303 301 301 303 304 303
Sugar Cane Nitrogen 41 43 41 39 39 38 38 37 37 37 37 36 36 Phosphorous 18 19 18 17 17 16 16 16 16 16 16 16 16 Potassium 92 97 94 89 87 87 86 85 84 83 83 82 82
Sugar Beet Nitrogen 69 68 61 59 59 58 58 58 58 58 58 59 60 Phosphorous 25 24 22 21 21 21 21 21 21 21 21 21 21 Potassium 35 35 31 30 30 30 30 30 30 30 30 30 31
Crops, Other Nitrogen 3,361 3,440 3,457 3,457 3,470 3,483 3,489 3,494 3,499 3,504 3,508 3,520 3,524 Phosphorous 889 906 910 905 908 911 913 914 915 918 921 926 929 Potassium 1,138 1,168 1,168 1,171 1,179 1,189 1,195 1,199 1,203 1,210 1,215 1,230 1,238
TOTAL Nitrogen 11,846 12,208 12,240 12,319 12,393 12,459 12,459 12,476 12,495 12,507 12,500 12,587 12,572 Phosphorous 5,870 6,017 5,998 6,016 6,046 6,072 6,088 6,102 6,111 6,122 6,125 6,156 6,160 Potassium 7,473 7,675 7,643 7,680 7,733 7,787 7,833 7,864 7,885 7,915 7,926 7,975 7,992

26
China Fertilizer Use2010 2011 2012 2013 2014 2015 2016 2017 2018 2019 2020 2023 2025
Fertilizer UseCorn (Thousand Metric Tons) Nitrogen 5,371 5,354 5,261 5,325 5,327 5,395 5,425 5,453 5,479 5,515 5,547 5,583 5,619 Phosphorous 883 887 870 880 881 895 903 907 910 920 928 935 942 Potassium 140 143 140 141 141 145 147 148 148 151 153 155 156
Barley Nitrogen 55 56 60 56 58 57 57 57 57 57 57 56 55 Phosphorous 23 22 23 22 23 22 23 22 23 23 23 23 23 Potassium 16 16 17 16 16 16 16 16 16 16 16 16 16
Wheat, All Nitrogen 4,416 4,345 4,486 4,392 4,368 4,323 4,319 4,302 4,287 4,239 4,259 4,187 4,182 Phosphorous 1,919 1,899 1,978 1,912 1,906 1,892 1,894 1,884 1,874 1,862 1,876 1,844 1,838 Potassium 248 245 255 247 246 244 245 243 242 240 242 238 237
Soybeans Nitrogen 430 428 421 417 416 414 413 411 411 409 407 396 387 Phosphorous 346 343 339 336 335 334 333 331 330 329 327 319 312 Potassium 60 59 58 58 58 57 57 57 57 57 56 55 54
Rapeseed Nitrogen 1,217 1,232 1,213 1,207 1,203 1,196 1,189 1,184 1,179 1,173 1,166 1,138 1,113 Phosphorous 393 411 398 397 396 397 389 387 388 386 380 370 361 Potassium 102 107 104 103 103 103 101 101 101 100 99 96 94
Sunflower Seed Nitrogen 97 94 90 89 89 89 88 88 87 87 86 83 81 Phosphorous 24 24 23 23 23 22 22 22 22 22 22 21 21 Potassium 13 12 12 12 12 12 12 12 11 11 11 11 11
Peanut Nitrogen 476 486 491 500 508 517 523 528 532 531 530 521 513 Phosphorous 265 264 262 262 261 260 259 257 255 252 249 240 232 Potassium 51 51 50 50 50 50 50 49 49 48 48 46 45
Rice, All Nitrogen 5,716 5,584 5,569 5,507 5,498 5,466 5,448 5,430 5,403 5,373 5,350 5,301 5,227 Phosphorous 1,836 1,794 1,789 1,769 1,766 1,756 1,750 1,744 1,736 1,726 1,719 1,703 1,679 Potassium 1,726 1,686 1,682 1,663 1,660 1,650 1,645 1,640 1,631 1,622 1,615 1,600 1,578
Cotton Nitrogen 1,312 1,889 2,157 2,161 2,196 2,204 2,217 2,219 2,223 2,222 2,220 2,216 2,216 Phosphorous 420 481 489 482 484 486 488 489 490 490 489 488 488 Potassium 69 79 80 79 80 80 80 80 81 81 80 80 80
Sugar Cane Nitrogen 504 508 509 511 512 515 517 520 522 524 527 533 537 Phosphorous 269 271 272 273 273 275 276 277 279 280 281 284 287 Potassium 318 321 321 322 323 325 326 328 329 331 332 336 339
Sugar Beet Nitrogen 76 86 89 90 90 90 90 90 90 89 89 88 87 Phosphorous 44 50 51 52 52 52 52 52 52 52 52 51 51 Potassium 32 36 38 38 38 38 38 38 38 38 38 37 37
Crops, Other Nitrogen 13,047 13,352 13,421 13,419 13,469 13,519 13,543 13,564 13,583 13,601 13,619 13,665 13,681 Phosphorous 5,674 5,784 5,807 5,779 5,796 5,815 5,828 5,837 5,842 5,860 5,877 5,913 5,930 Potassium 3,531 3,625 3,622 3,633 3,658 3,687 3,708 3,719 3,733 3,753 3,768 3,815 3,841
TOTAL Nitrogen 32,717 33,413 33,768 33,675 33,734 33,784 33,828 33,846 33,853 33,821 33,857 33,767 33,698 Phosphorous 12,096 12,229 12,301 12,185 12,196 12,206 12,216 12,212 12,200 12,200 12,223 12,190 12,163 Potassium 6,305 6,380 6,379 6,362 6,386 6,408 6,425 6,431 6,436 6,449 6,461 6,487 6,488
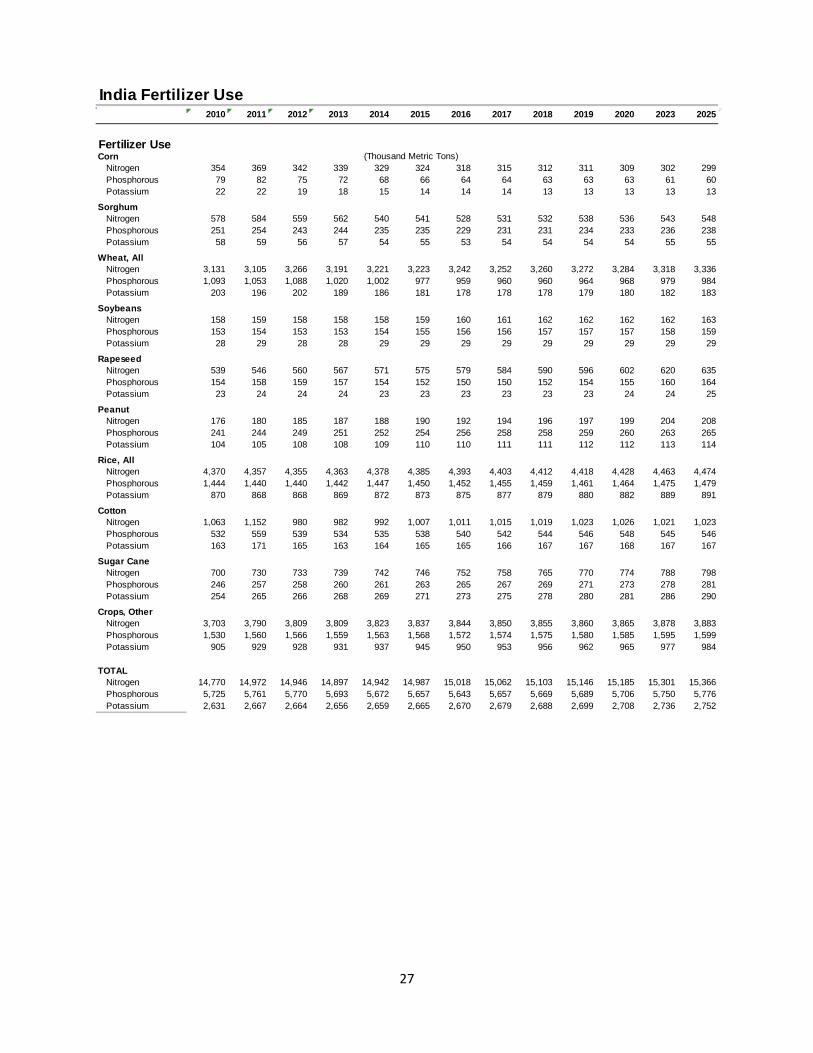
27
India Fertilizer Use2010 2011 2012 2013 2014 2015 2016 2017 2018 2019 2020 2023 2025
Fertilizer UseCorn (Thousand Metric Tons) Nitrogen 354 369 342 339 329 324 318 315 312 311 309 302 299 Phosphorous 79 82 75 72 68 66 64 64 63 63 63 61 60 Potassium 22 22 19 18 15 14 14 14 13 13 13 13 13
Sorghum Nitrogen 578 584 559 562 540 541 528 531 532 538 536 543 548 Phosphorous 251 254 243 244 235 235 229 231 231 234 233 236 238 Potassium 58 59 56 57 54 55 53 54 54 54 54 55 55
Wheat, All Nitrogen 3,131 3,105 3,266 3,191 3,221 3,223 3,242 3,252 3,260 3,272 3,284 3,318 3,336 Phosphorous 1,093 1,053 1,088 1,020 1,002 977 959 960 960 964 968 979 984 Potassium 203 196 202 189 186 181 178 178 178 179 180 182 183
Soybeans Nitrogen 158 159 158 158 158 159 160 161 162 162 162 162 163 Phosphorous 153 154 153 153 154 155 156 156 157 157 157 158 159 Potassium 28 29 28 28 29 29 29 29 29 29 29 29 29
Rapeseed Nitrogen 539 546 560 567 571 575 579 584 590 596 602 620 635 Phosphorous 154 158 159 157 154 152 150 150 152 154 155 160 164 Potassium 23 24 24 24 23 23 23 23 23 23 24 24 25
Peanut Nitrogen 176 180 185 187 188 190 192 194 196 197 199 204 208 Phosphorous 241 244 249 251 252 254 256 258 258 259 260 263 265 Potassium 104 105 108 108 109 110 110 111 111 112 112 113 114
Rice, All Nitrogen 4,370 4,357 4,355 4,363 4,378 4,385 4,393 4,403 4,412 4,418 4,428 4,463 4,474 Phosphorous 1,444 1,440 1,440 1,442 1,447 1,450 1,452 1,455 1,459 1,461 1,464 1,475 1,479 Potassium 870 868 868 869 872 873 875 877 879 880 882 889 891
Cotton Nitrogen 1,063 1,152 980 982 992 1,007 1,011 1,015 1,019 1,023 1,026 1,021 1,023 Phosphorous 532 559 539 534 535 538 540 542 544 546 548 545 546 Potassium 163 171 165 163 164 165 165 166 167 167 168 167 167
Sugar Cane Nitrogen 700 730 733 739 742 746 752 758 765 770 774 788 798 Phosphorous 246 257 258 260 261 263 265 267 269 271 273 278 281 Potassium 254 265 266 268 269 271 273 275 278 280 281 286 290
Crops, Other Nitrogen 3,703 3,790 3,809 3,809 3,823 3,837 3,844 3,850 3,855 3,860 3,865 3,878 3,883 Phosphorous 1,530 1,560 1,566 1,559 1,563 1,568 1,572 1,574 1,575 1,580 1,585 1,595 1,599 Potassium 905 929 928 931 937 945 950 953 956 962 965 977 984
TOTAL Nitrogen 14,770 14,972 14,946 14,897 14,942 14,987 15,018 15,062 15,103 15,146 15,185 15,301 15,366 Phosphorous 5,725 5,761 5,770 5,693 5,672 5,657 5,643 5,657 5,669 5,689 5,706 5,750 5,776 Potassium 2,631 2,667 2,664 2,656 2,659 2,665 2,670 2,679 2,688 2,699 2,708 2,736 2,752

28
Appendix E: Projected Fertilizer Application Rates for China in the period 2011-2025
China Fertilizer Use2010 2011 2012 2013 2014 2015 2016 2017 2018 2019 2020 2021 2022 2023 2024 2025
Rate of Application (Kilograms per Hectare)Corn Nitrogen 170.52 171.25 171.12 171.05 171.07 171.45 171.69 171.68 171.55 171.90 172.20 172.15 172.27 172.33 172.40 172.42 Phosphorous 28.04 28.37 28.31 28.28 28.29 28.46 28.57 28.56 28.51 28.67 28.80 28.78 28.84 28.86 28.90 28.90 Potassium 4.43 4.57 4.55 4.53 4.54 4.61 4.65 4.65 4.63 4.69 4.75 4.74 4.77 4.78 4.79 4.80
Barley Nitrogen 78.86 78.51 78.10 77.91 77.97 78.01 78.12 78.09 78.15 78.40 78.57 78.67 78.68 78.80 78.86 78.93 Phosphorous 32.31 31.52 30.62 30.21 30.33 30.43 30.65 30.58 30.71 31.25 31.63 31.86 31.87 32.14 32.28 32.45 Potassium 23.08 22.51 21.87 21.58 21.66 21.73 21.89 21.84 21.94 22.32 22.59 22.76 22.77 22.96 23.06 23.18
Wheat, All Nitrogen 181.73 181.83 181.98 181.76 181.81 181.86 181.89 181.88 181.83 181.92 181.97 181.97 181.96 181.97 181.96 181.93 Phosphorous 78.98 79.48 80.22 79.12 79.36 79.61 79.75 79.68 79.47 79.88 80.17 80.15 80.13 80.13 80.12 79.97 Potassium 10.20 10.27 10.36 10.22 10.25 10.28 10.30 10.29 10.27 10.32 10.36 10.35 10.35 10.35 10.35 10.33
Soybeans Nitrogen 51.15 51.39 51.21 50.97 50.96 51.04 51.00 51.02 51.11 51.16 51.08 51.07 51.07 51.07 51.06 51.05 Phosphorous 41.13 41.19 41.15 41.09 41.09 41.11 41.10 41.10 41.12 41.14 41.12 41.11 41.11 41.11 41.11 41.11 Potassium 7.08 7.09 7.09 7.08 7.08 7.08 7.08 7.08 7.08 7.08 7.08 7.08 7.08 7.08 7.08 7.08
Rapeseed Nitrogen 168.97 169.65 169.33 169.35 169.39 169.52 169.28 169.25 169.38 169.40 169.20 169.15 169.13 169.12 169.11 169.12 Phosphorous 54.54 56.65 55.61 55.68 55.79 56.21 55.45 55.35 55.77 55.83 55.20 55.03 54.98 54.93 54.90 54.93 Potassium 14.18 14.73 14.45 14.47 14.50 14.61 14.41 14.39 14.50 14.51 14.35 14.30 14.29 14.28 14.27 14.28
Sunflower Seed Nitrogen 104.17 103.38 101.95 101.65 101.40 101.23 100.93 100.74 100.66 100.54 100.28 100.24 100.19 100.15 100.09 100.03 Phosphorous 26.33 26.13 25.77 25.69 25.63 25.59 25.51 25.46 25.44 25.41 25.35 25.34 25.32 25.31 25.30 25.28 Potassium 13.69 13.58 13.40 13.36 13.32 13.30 13.26 13.24 13.23 13.21 13.18 13.17 13.16 13.16 13.15 13.14
Peanut Nitrogen 108.23 112.04 114.89 117.87 121.09 124.74 127.56 130.40 133.16 135.18 136.57 138.05 139.58 141.18 142.73 144.29 Phosphorous 60.31 60.89 61.31 61.75 62.21 62.72 63.11 63.49 63.86 64.12 64.31 64.50 64.69 64.90 65.09 65.29 Potassium 11.58 11.69 11.77 11.85 11.94 12.04 12.11 12.19 12.26 12.31 12.34 12.38 12.42 12.46 12.49 12.53
Rice, All Nitrogen 192.34 192.34 192.34 192.34 192.34 192.34 192.34 192.34 192.34 192.34 192.34 192.34 192.34 192.34 192.34 192.34 Phosphorous 61.79 61.79 61.79 61.79 61.79 61.79 61.79 61.79 61.79 61.79 61.79 61.79 61.79 61.79 61.79 61.79 Potassium 58.07 58.07 58.07 58.07 58.07 58.07 58.07 58.07 58.07 58.07 58.07 58.07 58.07 58.07 58.07 58.07
Cotton Nitrogen 257.23 338.71 388.73 396.45 401.68 401.87 401.87 401.87 401.87 401.87 401.87 401.87 401.87 401.87 401.87 401.87 Phosphorous 82.30 86.20 88.10 88.36 88.53 88.54 88.54 88.54 88.54 88.54 88.54 88.54 88.54 88.54 88.54 88.54 Potassium 13.54 14.18 14.50 14.54 14.57 14.57 14.57 14.57 14.57 14.57 14.57 14.57 14.57 14.57 14.57 14.57
Sugar Cane Nitrogen 283.40 283.53 283.59 283.72 283.84 283.97 284.07 284.16 284.26 284.32 284.32 284.32 284.33 284.32 284.30 284.28 Phosphorous 151.21 151.28 151.31 151.38 151.45 151.51 151.57 151.61 151.67 151.70 151.70 151.70 151.71 151.70 151.69 151.68 Potassium 178.83 178.91 178.94 179.03 179.10 179.18 179.25 179.30 179.37 179.41 179.41 179.41 179.41 179.41 179.40 179.38
Sugar Beet Nitrogen 293.64 293.87 293.94 294.05 294.14 294.23 294.30 294.37 294.45 294.52 294.56 294.58 294.61 294.62 294.63 294.64 Phosphorous 169.84 170.08 170.15 170.27 170.37 170.46 170.53 170.61 170.69 170.76 170.81 170.83 170.86 170.87 170.88 170.89 Potassium 124.79 124.97 125.02 125.11 125.18 125.25 125.30 125.36 125.42 125.47 125.50 125.52 125.54 125.55 125.56 125.56