Embed Size (px)
Citation preview

WIPRWorld Investment and Political Risk
2013
World Investment Trends and Corporate Perspectives
The Political Risk Insurance Industry
Breach of Contract

© 2014 The International Bank for Reconstruction and Development/The World Bank
1818 H Street, NW Washington, DC 20433 t. 202.473.1000 www.worldbank.org [email protected]
Some rights reserved 1 2 3 4 15 14 13 12
This work is a product of the staff of The World Bank with external contributions. Note that The World Bank does not necessarily own each component of the content included in the work. The World Bank therefore does not warrant that the use of the content contained in the work will not infringe on the rights of third parties. The risk of claims resulting from such infringement rests solely with you.
The findings, interpretations, and conclusions expressed in this work do not necessarily reflect the views of The World Bank, its Board of Executive Directors, or the governments they represent. The World Bank does not guarantee the accuracy of the data included in this work. The boundaries, colors, denominations, and other information shown on any map in this work do not imply any judgment on the part of The World Bank concerning the legal status of any territory or the endorsement or acceptance of such boundaries.
Nothing herein shall constitute or be considered to be a limitation upon or waiver of the privileges and immunities of The World Bank, all of which are specifically reserved.
Rights and Permissions: This work is available under the Creative Commons Attribution 3.0 Unported license (CC BY 3.0) http://cre-ativecommons.org/licenses/by/3.0. Under the Creative Commons Attribution license, you are free to copy, distribute, transmit, and adapt this work, including for commercial purposes, under the following conditions:
Attribution—Please cite the work as follows: World Investment and Political Risk 2013. Washington, DC: MIGA, World Bank Group. DOI: 10.1596/978-1-4648-0039-9 License: Creative Commons Attribution CC BY 3.0
Translations—If you create a translation of this work, please add the following disclaimer along with the attribution: This translation was not created by The World Bank and should not be considered an official World Bank translation. The World Bank shall not be liable for any content or error in this translation.
All queries on rights and licenses should be addressed to the Office of the Publisher, The World Bank, 1818 H Street NW, Washington, DC 20433, USA; fax: 202-522-2625; e-mail: [email protected].
ISBN (paper): 978-1-4648-0039-9ISBN (electronic): 978-1-4648-0146-4 DOI: 10.1596/978-1-4648-0039-9
Design, cover art, and document: Antoine A. Jaoude, MIGA/World Bank Group

2013World Investment and Political Risk
World Investment Trends and Corporate Perspectives
The Political Risk Insurance Industry
Breach of Contract

FOREWORD ....................................................................................................................................................... 1
ACKNOWLEDGMENTS .................................................................................................................................. 3
SELECTED ABBREVIATIONS ........................................................................................................................4
EXECUTIVE SUMMARY .................................................................................................................................. 5
CHAPTER ONEWorld Investment Trends and Corporate Perspectives .......................................................................................9 Economic recovery, investor hesitation ........................................................................................11 The bigger FDI picture: waiting, seeing ....................................................................................... 12 For developing economies: a glass half-full? ............................................................................... 12 Regional FDI into developing economies in 2013 ....................................................................... 14 New seats at the table? ................................................................................................................. 16 Keeping their powder dry? ............................................................................................................ 18 Political risks remain important ................................................................................................... 18 And everyone else? ........................................................................................................................22 A perpetual spring? ....................................................................................................................... 23 It’s (still) the economy ..................................................................................................................26
CHAPTER TWOThe Political Risk Insurance Industry .................................................................................................................27 Demand growth for PRI continues... ............................................................................................30 It’s a riskier world ...........................................................................................................................31 But don’t forget the supply side ................................................................................................... 32 Pricing grows, but only slowly ...................................................................................................... 34 Innovation, both public and private ............................................................................................. 35 No upswing in claims, yet? ...........................................................................................................36 A complementary product? .......................................................................................................... 37 Ever upwards? ............................................................................................................................... 38
CHAPTER THREE Breach of Contract ...............................................................................................................................................39 Investor concerns and trends in disputes ................................................................................... 41 A more comprehensive analysis ...................................................................................................44 What we do and what we expect to see ....................................................................................... 45 Some early findings ....................................................................................................................... 45 Contract-level issues .....................................................................................................................46 Country-level issues ......................................................................................................................48 Corporate-level approaches and perception of these risks .........................................................49 Towards a better handle on breach of contract ........................................................................... 52
ENDNOTES ...................................................................................................................................................... 55
APPENDICES Appendix 1 FDI Inflows, 2004–2012 ............................................................................................................... 58Appendix 2 MIGA-EIU Political Risk Survey 2013 .......................................................................................... 60Appendix 3 Berne Union, Prague Club Members and Lloyd’s Syndicates ....................................................79
Table of Contents

BOXESBox 2.1 Overview of the PRI market ................................................................................................................29Box 3.1 What is meant by breach of contract? ............................................................................................... 41Box 3.2 Potential triggers of contract breach: evidence from MIGA pre-claims ........................................... 50
TABLES Table 1 Major constraints to foreign investment over the next three years ................................................... 7Table 1.1 Global growth assumptions ................................................................................................................11Table 1.2 Regional FDI .........................................................................................................................................15Table 1.3 Recent survey findings regarding FDI prospects............................................................................... 19Table 1.4 Survey findings regarding political risks ............................................................................................20Table 2.1 Aggregate Berne Union PRI issuance by provider type, 2012 ........................................................... 32Table 2.2 Available private market capacity by tenor, total maximum per risk ............................................... 34Table 2.3 Key new and expanded market offerings, 2012 ..................................................................................35Table 3.1 Where is the risk? The most consistent determinants of contract breach identified by this analysis .........................................................................................49Table 3.2 Statistical analysis results ...................................................................................................................53
FIGURES Figure 1 Net FDI flows, 2001-2015 ................................................................................................................6Figure 1.1 Net private capital flows to developing economies .....................................................................13Figure 1.2 Composition of FDI flows to developing economies .................................................................. 14Figure 1.3 FDI flows to developing economies by region .............................................................................15Figure 1.4 FDI flows from developing economies ........................................................................................ 16Figure 1.5 Changes in foreign investment plans for South-based investors ................................................17Figure 1.6 Ranking of the most important constraints to FDI in developing economies for South-based investors ....................................................................................................................17Figure 1.7 Ranking of the most important constraints to FDI in developing economies .......................... 18Figure 1.8 Changes in foreign investment plans .......................................................................................... 21Figure 1.9 Types of political risk of most concern to investors in developing economies ......................... 21Figure 1.10 Impact of political risk on foreign investors ................................................................................ 22Figure 1.11 Financial losses incurred over the past three years on account of political risks ..................... 23Figure 1.12 Withdrawal of existing investments or cancellation of planned investments over the past twelve months due to political risks ............................................................................................ 23Figure 1.13 Impact of developments in MENA on future investment plans .................................................24Figure 1.14 Ranking of the most important political risks in the MENA region ...........................................24Figure 1.15 Perceived changes in the breach of contract risk in MENA ........................................................ 25Figure 2.1 Growth in PRI issuance by Berne Union members and in FDI flows ........................................ 30Figure 2.2 Ratio of PRI to FDI flows: global versus developing economies .................................................31Figure 2.3 PRI issuance by Berne Union members into developing economies, by type of provider ........ 32Figure 2.4 Available private market PRI capacity, total maximum per risk ...................................................33Figure 2.5 Ratio of premiums to average PRI exposure for Berne Union members ................................... 34Figure 2.6 Investment claims paid by Berne Union members ..................................................................... 36Figure 2.7 Recoveries by Berne Union members .......................................................................................... 37Figure 2.8 Tools/mechanisms used to mitigate political risk when investing in developing countries ..... 37Figure 3.1 Types of political risk of most concern to investors in developing economies .........................42Figure 3.2 Volume of private investment in infrastructure in low and middle-income countries .............. 43Figure 3.3 Number of investor-state investment disputes, 1990-2012 ........................................................ 43Figure 3.4 Proportion of disputed contracts in sample, by income level ....................................................46Figure 3.5 Probability of contract breach, by contract maturity ...................................................................46Figure 3.6 Survival estimates, by share of private ownership ...................................................................... 47Figure 3.7 Survival estimates, IFI involvement ............................................................................................. 47Figure 3.8 Survival estimates, energy sector versus non-energy sector projects ........................................48Figure 3.9 In which sector(s) have you experienced a breach of contract event? .......................................49Figure 3.10 Which of the following are the five most important risk factors for breach of contract events? .............................................................................................................................51Figure 3.11 Which of the following methods for addressing breach of contract events do you consider to be the most effective? ................................................................................................51Figure 3.12 What are the most effective tools/mechanisms available to your firm for alleviating each of the following risks?......................................................................................... 52

WIPR 13 | 2 1 | WIPR 13
I am pleased to have this opportunity to
highlight MIGA’s mission: to promote foreign
direct investment (FDI) into developing
countries to support economic growth,
reduce poverty, and improve people’s lives.
The report you are now reading plays an
important role in furthering these objectives.
Through the research and the survey con-
ducted for this report, MIGA seeks to
understand investors’ perceptions of
political risk as they affect FDI, as well as the
role of the political risk insurance industry
in mitigating these risks. We publicize our
findings broadly in order to contribute to
a thriving, informed investor community and
political risk insurance industry.
Foreword
Reflection on MIGA’s role is especially fitting this year,
as the Agency celebrates its 25th anniversary. Since our
inception, we have provided some $30 billion in guar-
antees for more than 700 projects in over 100 developing
countries. Looking beyond the numbers, I want to
emphasize that the investments we insure have positively
affected lives across the globe—creating jobs; providing
water, electricity, and other basic infrastructure;
strengthening financial systems; generating tax revenues;
transfering skills; and helping countries tap natural
resources sustainably. Many of these investments simply
would not have been able to go forward without political
risk insurance that gave the sponsors the confidence
they needed to operate in sometimes challenging envi-
ronments.
This year also marks the fifth year that MIGA has
published World Investment and Political Risk. These
years have been heady for both FDI and political risk,
and the report series has been an interesting barometer
during this tumultuous time.
WIPR 13 | 2 1 | WIPR 13
As in previous reports, this year we examine investors’
perceptions and risk-mitigation strategies as they make
decisions and plan for the future. We found that
investors continue to rank political risk as a key obstacle
to investing in developing countries, though—for the
first time since we launched the survey—investors
classify macroeconomic instability as their top concern
over the medium term.
The report confirms a continued increase in the use of
political risk insurance as a risk-mitigation tool and
reaffirms the industry’s health and resilience. Providers
have met the challenge of these years with new products
and innovative ways to use existing tools as well as
substantial capacity to meet growing demand.
This year World Investment and Political Risk also looks
at breach of contract risk and its causes. The report’s
original research can help guide investors and insurers
when they participate in a project that involves a
contract with a developing-country government entity.
As private and public sectors continue to increase their
cooperation in service of bringing important investments
to fruition, this research is particularly timely.
I hope that you find the report both insightful and helpful for your work.
Keiko Honda
Executive Vice President

WIPR 13 | 4 3 | WIPR 13
Acknowledgments
This report was prepared by a team led by Conor
Healy, under the overall coordination of Dan Biller
and Ravi Vish, comprising Persephone Economou,
Petal Jean Hackett, and Manabu Nose. Mallory Saleson,
Rebecca Post, and Cara Santos Pianesi edited; Antoine
A. Jaoude was in charge of graphic design. Cara Santos
Pianesi was the overall coordinator of the editorial and
production process. Khalid Alsuhaibani, Saodat
Ibragimova and Miranda von Reyn provided support.
This year’s World Investment and Political Risk report
benefitted from comments by MIGA’s senior man-
agement team and we thank Keiko Honda, Michel
Wormser, Ana-Mita Betancourt, Kevin Lu, Edith
Quintrell, Lakshmi Shyam-Sunder, Ravi Vish, and
Marcus Williams. Within MIGA, Marc Roex, Thomas
Mahaffey, and Gero Verheyen also provided feedback.
The World Bank’s Development Prospects Group,
under the guidance of Andrew Burns, provided the
macroeconomic data presented in the report. Dilek
Aykut (Senior Economist, Sub-Saharan Africa, World
Bank) and Eung Ju Kim (Financial Analyst, Development
Prospects Group, World Bank) provided support.
Daniel Villar of the World Bank’s Credit Risk Department
provided useful comments. The investor survey was
conducted on behalf of MIGA by the Economist
Intelligence Unit.
The analysis of the political risk insurance market
benefited from the gracious participation of political
risk brokers in a roundtable discussion in London
organized by Exporta Publishing and Events Ltd. Kevin
Godier and Peter Gubbins assisted with transcription.
Bilateral discussions with Toby Heppel (RFIB), Navaid
Farooq (Catlin), Murray Ross (Ace Group), Nick
Kilhams (Chaucer plc), Rupert Cutler (NMB), and
Bernie de Haldevang (Aspen Insurance) also provided
some background and context for the report. Arthur
J. Gallagher International and RFIB Group Limited
provided data on the private insurance market.
Shantayanan Devarajan (Chief Economist, Middle East
and North Africa, World Bank), Elena Ianchovichina
(Lead Economist, Middle East and North Africa, World
Bank), Allen Dennis (Senior Economist, Development
Prospects Group, World Bank), Michael Gestrin
(Programme Manager, OECD), Peter M. Jones
(Secretary General, Berne Union), Fabrice Morel
(Deputy Secretary General, Berne Union), Moritz
Zander (Vice President, Sustainability & Political Risk,
Swiss Re), Theodore H. Moran (Marcus Wallenberg
Chair at Georgetown University’s School of Foreign
Service), Gerald T. West (also at Georgetown University
as Adjunct Professor for the School of Foreign Service)
and Nathan Jensen (Associate Professor, Department
of Political Science, Washington University in St. Louis)
provided peer reviews.

WIPR 13 | 4 3 | WIPR 13
AdvReg Adverse regulatory changes
ASEAN Association of Southeast Asian Nations
BoC Breach of contract
BRIC Brazil, Russian Federation, India, and China
CD Civil disturbance
ECA Export credit agency
EIU Economist Intelligence Unit
EU European Union
Expro Expropriation
FDI Foreign direct investment
GCC Gulf Cooperation Council
GDP Gross domestic product
ICC International Chamber of Commerce
ICIEC Islamic Corporation for the Insurance of Investment and Export Credit
ICSID International Centre for Settlement of Investment Disputes
IFI International financial institutions
IMF International Monetary Fund
MENA Middle East and North Africa
MIGA Multilateral Investment Guarantee Agency
MNE Multinational enterprise
NHFO Non-honoring of financial obligations
OECD Organisation for Economic Co-operation and Development
OPIC Overseas Private Investment Corporation of the United States
PPI Private participation in infrastructure
PRI Political risk insurance
SCCAM Swiss Chambers’ Court of Arbitration and Mediation
SOE State-owned enterprises
T&C Transfer and convertibility restrictions
Terror Terrorism
UNCTAD United Nations Conference on Trade and Development
Dollars are current U.S. dollars unless otherwise specified.
Selected Abbreviations

WIPR 13 | 6 5 | WIPR 13
Global economic growth has continued its
weak path in 2013. The crisis in the euro zone
appears to have receded somewhat since last
year, with current concerns more focused
on the implications of the end of the
monetary cycle in the United States, rising
U.S. long-term yields, and a possible slowdown
in China. The possibility of monetary policy
change is posing fresh risks for emerging-
market economies, where activity could slow
and asset quality could weaken. Further, any
slowdown in Chinese growth would affect
many other economies, notably the com-
modity exporters among the developing
markets. At the same time, old problems––a
fragmented financial system in the euro area
and worrisomely high public debt in all major
advanced economies––remain unresolved and
could trigger new crises. With all of this in
mind, it is perhaps no surprise that foreign
direct investment (FDI) levels for developing
economies are seeing only a marginal increase
in 2013, and are expected to decline next year.
For a second straight year, FDI to developing economies remains soft, still below previous peaks (figure 1). After declining from the 2011 peak of $628 billion to $604 billion last year, 2013 is expected to see a 2 percent increase to an estimated $617 billion—a further in-crease is expected only in 2015. While there has been explosive FDI growth since the turn of the century—FDI was 337 percent higher in 2011 than in 2000—the
Executive Summary
rebound of 2009-10 looks more distant. FDI now appears stable and at high levels, but with persistent economic concerns and stuttering growth, it does not look likely to return to the growth rates of the mid 2000s anytime soon.
At a sub-regional level, trends are more diverse. Sub-Saharan Africa and South Asia have shown healthy growth this year, achieving 19 percent and 21 percent increases in FDI inflows, respectively. Other develop-ing regions are experiencing declines, particularly Europe and Central Asia, where FDI flows are expected to fall by 16 percent for the year. The other key success stories of recent years—increases in FDI from develop-ing economies and South-South investment—contin-ued. FDI outflows from developing economies reached a record level of $164 billion in 2012, representing a record share of 12 percent of global FDI outflows.
The mood of investor caution is further captured by the annual MIGA-EIU Political Risk Survey. For the first time since the survey was launched, investors classify macroeconomic instability as the key con-straint for investing into developing economies over the medium term. The persistent global economic uncertainty appears to have tainted the overall mood, with economic pessimism underpinning the expected stagnant FDI levels. Against this backdrop, the survey continues to find political risk to be a significant concern for investors operating in developing markets. Rather than recede in the face of more dominant concerns of the global economy, political concerns remain close to the levels of recent years. In both cases, MIGA’s analysis is further underpinned by other surveys, which also place these two issues at the top of the list of investor concerns.

WIPR 13 | 6 5 | WIPR 13
The fact that political risk continues to be perceived as an important constraint to investment into develop-ing countries remains a boon for the political risk insur-ance (PRI) industry. New issuance by members of the Berne Union—the leading association of public, private, and multilateral insurance providers—in-creased by 33 percent in 2012, even as FDI fell, and is on track for similar growth in 2013. To put this in context, the $100 billion of investment insurance issued in 2012 is at a historic high level and over three times the volume issued in 2005. The ratio of FDI to PRI now stands at 14.2 percent for developing economies, a marked increase on the low-water mark of nearly 5 percent in 1997, but still below the historic peak of 1982, when the ratio of PRI to FDI for developing economies exceeded 25 percent.
The growth in PRI issuance is driven by both supply and demand considerations. On the supply side, public providers continue to dominate Berne Union activity, with the top two providers accounting for 57 percent of total Berne Union issuance for the year. Private
capacity continues to grow too, with broader insurance market conditions making the comparatively higher premiums available in the PRI niche attractive for new entrants. On the demand side, the important drivers of new issuance include ongoing instability in the Middle East and North Africa that have raised the specter of unanticipated events in seemingly stable political regimes; high-profile expropriations and in-vestor-state disputes in Latin America; contract re-negotiations in resource-rich economies; and capital constraints and increased financial sector regulation, which make financing with PRI an attractive option.
MIGA’s annual roundtable of private insurers and brokers in 2013 highlighted a number of interesting trends in the private market. The growing capacity in the market, including several new entrants, continues to push participants to lengthen their tenors and to innovate in product offerings. Underwriters are entering into sizeable deals with tenors of up to 14 years, with even longer private-market tenors now possible. Discussions with the private insurers highlighted a
Figure 1 Net FDI flows to developing countries, 2001-2015
$ billion
Source: World Banke= estimate; f= forecast
0
100
200
300
400
500
600
700
05 06 0701 02 03 04 08 09 10 11 12 13e 14f 15f

WIPR 13 | 8 7 | WIPR 13
number of new comprehensive and more tailor-made products. A recurrent theme was the potential for wider market coverage if private and public insurers coop-erated more closely on co-insurance, a mutually ben-eficial exercise that could extend tenors for the private participants and increase the scope and size of cover overall, especially in more challenging markets.
This year’s report takes a close look at product offerings across the market. The evolving marketplace has seen a growing role for public providers, reflected in an expansion of their product lines, notably with MIGA offering its non-honoring product to state-owned enter-prises, and the Overseas Private Investment Corporation (OPIC) of the United States now covering investments by private equity funds (with other public providers also looking at such cover). As was the case last year, the elevated political risk perceptions of investors have continued the revival of demand for existing products. In light of the elevated political risk in the Middle East and North Africa, there has also been ongoing interest in coverage for existing
investments, while concerns about stress on public finances have led public providers to expand coverage for non-honoring of financial obligations. While the Lloyd’s market has been offering this coverage for some time, the expansion of public cover has permitted an increase in both capacity and tenors.
The claims picture is often a volatile one, with perhaps understandably lower levels of transparency across some parts of the market. As such, it is generally harder to make strong conclusions on the basis of available information, especially on a single-year basis. Notwithstanding this, the low levels of paid-out claims in 2012, at $125 million, are far below the highs seen in 2010 as a result of the global financial crisis, and considerably lower than the $179 million reported for 2011. Additional claims, which might be expected from a substantially expanded market, have not yet arrived.
Despite elevated perceptions of political and economic risk, the majority of respondents in the MIGA-EIU Political Risk Survey 2013 have no plans to withdraw
Table 1 Major constraints to foreign investment
over the next three years percent
2010 2011 2012 2013
Number of respondents 194 316 438 459
Limited size of the market 9 7 7 5
Lack of investment opportunities 7 - - -
Poor infrastructure 9 11 8 7
Lack of qualified staff 10 17 18 18
Lack of financing for investments in these countries 5 11 13 13
Political risk 21 18 22 19
Macroeconomic instability 16 15 20 21
Lack of information on the country’s business environment
2 - - -
Weak government institutions/red tape/corruption 19 13 8 10
Other 2 2 1 1
Increased government regulation in the aftermath of the global financial crisis - 5 3 4
Source: MIGA-EIU annual political risk surveys

WIPR 13 | 8 7 | WIPR 13
or cancel investments in developing markets. Within the range of political risks, breach of contract and regulatory risks once again top respondents’ concerns. Survey results show that these concerns are based on actual experience as well as sentiment, with respondents rating these factors as the key political risks that resulted in actual losses over the past three years.
Chapter three of this publication focuses on breach of contract risk and its causes. It combines, for the first time in a statistical analysis, both deal-specific factors (contract design, manner of award, sector) and country-specific factors (economic and political considerations, regime type) associated with this risk. The statistical analysis offers insight into the most significant correlates and triggers of contract breach. The results identify a number of key areas where investors (and insurers) should pay primary attention when they participate in investments that involve a contractual relationship with a public, developing-economy counterparty. Findings suggest that, even when controlling for other factors, risk of contract breach is higher in middle-income countries than low-income countries. Project sector, private own-ership stakes, and the presence of international financial institutions in the deal are important micro-correlates of contract viability. On the macro side, risk of breach is statistically related to economic downturns, dependence on primary commodities, and quality of political institutions. Results support the idea of the “obsolescing bargain,” suggesting that risk of breach of contract increases with years of contract life, before leveling (between the eighth and twelfth year of contract duration) and then rising again, albeit more slowly. An awareness of all of these relationships is a valuable starting point to help investors and insurers best mitigate and manage their risks.
The results of chapter three’s analysis are consistent with investor views as reflected in the MIGA-EIU Political Risk Survey 2013, as well as with MIGA’s own empirical pre-claims experience. MIGA’s analysis pre-sented in this report opens the field for further study to explore potential ranking of different risk elements across industries and structures and points investors to the key influencing variables and interactions in different projects.

CHAPTER onE
10 9
World Investment Trends and Corporate Perspectives

10 9
After a recovery following the 2008 global financial crisis, foreign direct investment (FDI) levels for developing economies rose marginally in 2013 and are expected to decline next
year. Improving growth forecasts hint at better numbers to come, but investors remain cautious, with only tentative signs of a stronger recovery. Private capital flows in these economies are also projected to remain stagnant, having been tempered recently by anticipated monetary consolidation led by the United States.
T he regional spread of FDI into developing economies offers a mixed picture, with sub-Saharan Africa and South Asia showing solid growth this year. In contrast, developing
economies in Europe and Central Asia continue to be affected by stagnant growth in the region’s high-income economies.
FDI from developing economies and South-South investment remain buoyant and increasing, largely reflecting the greater global role played by Brazil, the Russian Federation, India, and
China (BRIC). Alongside an increasing role played by sovereign wealth funds and state-owned enterprises, the profile of investors entering into developing economies appears to be undergo-ing a fundamental change. The resulting impact for risk appetites and sectoral preferences will be central to both the FDI and development stories for the foreseeable future.
The cautious mood of investors is captured by MIGA’s annual investor survey, the results of which place macroeconomic instability at the top of investor concerns for the first time.
The hesitancy regarding future investment is captured in a somewhat more cautious outlook for investment intentions, especially within the twelve-month horizon. MIGA’s survey results are corroborated by the findings of similar surveys, underlining the still tentative nature of the recovery.
While economic concerns currently dominate the investor mindset, political risks still rank highly. In particular, breach of contract and regulatory risks once again top survey re-
spondents’ political risk concerns. Survey results show that these concerns are based on actual experience as well as sentiment, with respondents rating these factors as the key political risks that resulted in actual losses over the past three years.
The Arab Spring story is becoming more complex as FDI flows declined in 2013. While the second wave of disturbances has kept political violence as the key investor concern, there
are hints that investors are ready to reengage fairly quickly once some degree of resolution is achieved. At the same time, breach of contract concerns are on the rise, possibly because of the fear of post-recovery “tail effects.”

WoRld Investment tRends and coRPoRate PeRsPectIves | 12 11 | WoRld Investment tRends and coRPoRate PeRsPectIves
Five years on from the global financial crisis, MIGA’s annual review of global investor perceptions of
developing economies sees an environment where caution appears to have increased. While developing economies have generally weathered the crisis better than their developed counterparts, persistent global softness is affecting the investor mood. This softness is impacting the FDI numbers, with flows hovering around the $600 billion mark. At a sub-regional level, only the developing economies of sub-Saharan Africa and South Asia have witnessed significant growth in these flows. While South-South investment has picked up some of the slack—marking an interesting trend—it is the story of rising interest rates in the developed economies that could impact the topline number for FDI into developing economies for the immediate future. The mood of caution is further captured by the annual MIGA-EIU Political Risk Survey. Macroeconomic instability rates at the top of investor concerns for the first time and this concern has tempered the historically bullish investor sentiment. Against this backdrop, the survey finds that political risk remains a significant concern for investors operating in developing markets, something that countries will be under new pressure to address if the current mood persists.
Economic recovery… investor hesitation
Despite more optimistic global growth scenarios, the hesitant nature of that growth and expected monetary retrenchment in the United States have cast new clouds over the outlook for developing economies. Investor caution and sluggish FDI also moderate the optimistic outlook. This year’s MIGA-EIU Political Risk Survey, the fifth such survey commissioned by MIGA (see appendix 2),1 reinforces these concerns, with macroeconomic instability for the first time arising as the leading worry for investors going into developing economies.
Recent months have witnessed strengthening growth and an overall improvement in business confidence in high-income countries (table 1.1), as the euro zone slowly emerges from recession. Yet, despite these “green shoots,” global economic recovery remains fraught, with persistently weak growth in many high -income economies in Europe (France, Italy, United Kingdom), recession in European countries undermined by the sovereign debt crisis, high unemployment rates, and ongoing banking sector restructuring. Economic activity in the euro zone continues to suffer from the combined effects of low demand and confidence compared to
Table 1.1 Global growth assumptions*
Real GDP growth in percent
2012 2013e 2014f 2015f 2016f
World 2.5 2.3 3.2 3.4 3.5
High-income countries 1.5 1.2 2.1 2.4 2.5
Developing countries 4.7 4.8 5.5 5.7 5.7
East Asia and Pacific 7.4 7.0 7.2 7.1 7.1
Europe and Central Asia 2.0 3.1 3.7 4.3 4.6
Latin America and Caribbean 2.6 2.5 3.8 3.8 3.3
Middle East and North Africa 1.4 0.9 2.5 3.3 3.7
South Asia 4.1 4.4 5.6 6.3 6.7
Sub-Saharan Africa 3.4 4.8 5.3 5.4 5.5
Source: World Bank Global Economic Prospects Group staff estimatese= estimate; f= forecast*As of October 2013

WoRld Investment tRends and coRPoRate PeRsPectIves | 12 11 | WoRld Investment tRends and coRPoRate PeRsPectIves
levels prior to the 2008 global financial crisis, but growth has strengthened in Japan.
Growth in developing economies2 has moderated, driven by a slowdown in the largest economies of Brazil, China, and India. Developing economies with significant domestic imbalances and large current account deficits have been particularly vulnerable to currency depreciations and inflationary pressures. As commodity prices have stabilized or eased, com-modity exporting countries (for example, Brazil, Indonesia, Malaysia, and South Africa) have been negatively affected. Although the reverse holds true for commodity-importing countries, an exacerbation of the conflict in Syria and the possibility of oil supply disruptions are expected to have a negative impact on their economic growth. Additional risks to the growth of developing economies include excessive leveraging in select countries in Asia (Indonesia, Malaysia, and Thailand) that could give rise to domestic banking stress, and if there were a dis-orderly unwinding of the current Chinese investment lending boom.
The bigger FDI picture: waiting, seeing...
Against the backdrop of little growth in 2013, global FDI flows are estimated to have increased slightly. In 2013, FDI flows worldwide were an estimated $1.5 trillion, slightly above the level reached in 2012. That level in itself represented an 18 percent decline from 2011, mostly due to a strong retrenchment of FDI flows into high-income economies, especially in Europe, as growth prospects and financial markets in these countries were subdued. Global greenfield FDI—investment in projects involving a new physical presence in the country—is expected to see a decline of around 20 percent in 2013,3 having already come to a halt in 2012.
While global FDI flows have yet to reach the record level of $2 trillion of 2007, the picture in 2013 remains dramatically better than that of 2000. On average, FDI flows in 2006-2012 were nearly double what they were in 2000-2005, despite the global financial crisis, resultant economic recession, the Arab Spring, and renewed political uncertainty in many countries
in the second period. At least in part, this upward trend represents a growing internationalization of production, as companies from high-income and developing economies alike looked overseas for new growth opportunities. The question that surrounds the flows today is whether the last two years mark a punctuation within a longer-term story of dramatic success, or whether global hesitancy will persist. This is a question that reflects uncertainty within the global economy more generally.
For developing economies: a glass half-full?
The improving performance of high-income economies may have some paradoxically negative consequences for developing ones. Critically, improved growth in high-income economies has increased the likelihood that their monetary easing policies will come to an end in the near future. In anticipation of that, yields on United States Treasury bills have been rising, increasing their attractiveness to investors and causing a portfolio shift from developing to high-income economies. This has caused a reduction in private funds moving to developing economies, and countries that have relied on foreign private flows are now especially vulnerable. The quest for yield had applied both to debt as well as to equity flows. Between 2007 and 2013, sub-Saharan African countries raised $14 billion from sovereign bond issues. The global low interest rate environment was a boon to these efforts to raise capital. While such cheaper finance now looks to be waning, evidence indicates that the reduction is temporary and reflects a shorter-term adjustment process to the end of the monetary cycle, following which it could be expected to recover, reflecting the ongoing yield potential in developing economies. Estimates for 2013 and 2014 indicate that private capital flows have stagnated; a rebound is projected in 2015 (figure 1.1). However, risks arise if the adjustment process in developing economies is too rapid, or if it exposes serious vulnerabilities in the countries where it occurs. While some countries may be more at risk than others, overall developing economies appear better equipped than previously to withstand the effects of private capital outflows, should these occur on a larger scale than in the past.

WoRld Investment tRends and coRPoRate PeRsPectIves | 14 13 | WoRld Investment tRends and coRPoRate PeRsPectIves
Net private capital inflows to developing economies are already stagnant (figure 1.1). This has mainly been driven by concerns about the anticipated end of accommodative monetary policy in high-income economies, as mentioned above, coupled with improved economic prospects in these economies and a less favorable outlook for developing economies. Net private capital flows to developing economies are projected to remain at an estimated $1 trillion in 2014. The current outlook is for these flows to rebound in 2015, assuming that the adjustment to the winding down of monetary easing proceeds smoothly. While this is the current expec-tation, should that not be the case, net private capital flows into developing economies could decline.
Under the current composition of net private capital flows, FDI continues to be the most important private capital flow to developing economies in relation to portfolio investment and private debt. The anticipated end of monetary easing in high-income economies would manifest in a fall in net portfolio investment and net private debt flows into developing economies, but would not necessarily have a
significant impact on FDI, which is driven by long-term business considerations. Over the longer term, sustained growth in the developed world will have a more positive impact.
The FDI story for developing economies matches that for the global economy (figure 1.2) Developing economies4 are experiencing a moderate 2 percent increase in FDI flows in 2013, reaching an estimated $617 billion. This follows a decline of 6 percent in 2012. Again, it is possible to see the glass half-full. The levels remain impressive by historical standards. Despite recent declines, the past 13 years have wit-nessed a steep upward trend of FDI flows into developing economies, which reflects, at least in part, attractive investment opportunities in terms of both new markets and cost considerations, as well as a greater openness to such investment. Furthermore, since 2000, developing economies have been attracting a larger share of global FDI flows, culmi-nating to a share of an estimated 41 percent reached in 2013. Also, FDI flows have averaged 2.9 percent of the combined size of developing economies as measured by GDP during 2000-2012.5
Figure 1.1 Net private capital flows to developing economies
$ billion
Source: World Banke= estimate; f= forecast
-200
0
200
400
600
800
1000
1200
Net debt flowsNet FDI inflowsNet portfolio equity inflowsCumulative
05 06 07 08 09 10 11 12 13e 14f 15f00 01 02 03 04

WoRld Investment tRends and coRPoRate PeRsPectIves | 14 13 | WoRld Investment tRends and coRPoRate PeRsPectIves
Before looking at a regional breakdown, an emerging trend of the FDI data is apparent (figure 1.2). While equity investments by parent firms into new or existing foreign affiliates continue to account for the bulk of FDI flows, the share of reinvested earnings in total FDI flows has increased steadily since 2000—accounting for about a quarter of these investments in 2012. The countercyclical nature of these flows now becomes an important consideration: significantly, they rose at the onset and aftermath of the financial crisis when both equity investment and intra-company loans declined. The countercyclical nature has already proved to be an important backstop for investment into these countries in challenging times. The numbers would have been even more worrying for developing economies if it had not been so.
The growth of FDI flows into developing economies has been dominated by Brazil, China, and India. Together these countries have accounted for just over half of all FDI flows received by developing economies during 2000-2012. This concentration is still evident.
Figure 1.2 Composition of FDI flows to
developing economies $ billion
Source: World Banke= estimateNote: Only those developing economies that report a breakdown of FDI flows by these components are included in this figure. They accounted for 94 percent of FDI flows into developing economies in 2012
00 01 02 03 04 05 06 07 08 09 10 11 12e
0
50
100
150
200
250
300
350
400
450
EquityReinvested earningsIntracompany loans
Nevertheless, over the past decade a second layer of developing economies has experienced accelerated FDI growth. Significant examples include Ghana, Indonesia, Kazakhstan, and Nigeria, where the growth rate of FDI flows has exceeded that for all developing economies. An assessment of the regional variation for 2013 adds some color to this picture.
Regional FDI into developing economies in 2013
While the overall FDI picture for developing economies shows marginal improvement in 2013, the regional picture has been somewhat mixed (figure 1.3). South Asia stands out with the biggest expected percentage increase in FDI flows, and Europe and Central Asia with the biggest decline (table 1. 2). Prospects remain broadly favorable as opportunities for market-seeking investors, favorable cost considerations, and still-elevated commodity prices are expected to continue to drive investment. A rebound is projected in 2015 to $659 billion.
In 2013, South Asia’s FDI flows are forecast to rise to an estimated $33 billion and that level is expected to continue rising in 2014 and 2015. India is by far the largest recipient of FDI in South Asia and changes in its flows influence the picture for the entire region. No estimates for 2013 are available at the country level, but judging from the level of actual FDI flows received by India in January through March 2013,6 that increase likely reflects a rebound of investment in response to new investment policies for select sectors, such as telecoms and insurance. Estimates for 2013 show a comeback for Pakistan, whose flows fell a remarkable 35 percent in 2012, but the extent to which investor confidence will be improved following successful elections and a finally agreed IMF program remains uncertain.
FDI flows into developing Europe and Central Asia (excluding the Russian Federation from the region’s FDI data because of its reclassification as a high-income economy) are declining to an estimated $47 billion in 2013. In 2012, FDI flows also declined because of weak growth in Europe and the negative impact of the euro-zone recession on FDI flows into Southeast Europe. A rebound is forecast for 2015 as economic performance in the euro zone is expected to improve and resource-rich countries remain attractive to investors in light of still-elevated commodity prices.

WoRld Investment tRends and coRPoRate PeRsPectIves | 16 15 | WoRld Investment tRends and coRPoRate PeRsPectIves
Table 1.2 Regional FDI
Region 2013e Report card
East Asia and Pacific ↑2%
South Asia ↑21%
Europe and Central Asia
↓16%
Latin America and Caribbean
↑4%
Middle East and North Africa
↓15%
Sub-Saharan Africa ↑19%
Source: World Bank e= estimate
In 2013, East Asia and the Pacific continues to be the largest FDI-receiving region in the developing world, accepting an estimated $320 billion. However, this figure represents only a 2 percent increase over 2012 as growth in many of the top recipient countries moderated. In 2012, China, with $253 billion in 2012, was again the top FDI destination among developing countries, though that figure represented a 9 percent decline over the previous year. China will remain the top destination in 2013, but a slowdown in its economy could dampen prospects for FDI for 2014. Improved economic performances in high-income economies—including Japan, a traditional investor in the region—are projected to contribute to an estimated rebound to $345 billion into East Asia and the Pacific in 2015. While not likely to affect the topline FDI number, better growth prospects in the members of the Association of Southeast Asian Nations (ASEAN) and new investment opportunities emerging in Myanmar and Lao PDR also bode well for the region.
FDI flows in Latin America and the Caribbean (excluding Chile and Uruguay from the region’s FDI data because of their reclassification as high-income economies) have increased to a new record level of an estimated $156 billion in 2013. The region has fared well despite moderate growth, as economic conditions overall continue to be favorable for FDI. Flows had also increased in 2012, including in Brazil, the largest recipient in the region. Mexico experienced a 34 percent decline in FDI flows, with the topline FDI number reduced in net terms partly by the sale through an initial public offering of a 25 percent stake in the Mexican subsidiary of Spain’s Banco Santander.7 Despite divestments by Spain, the European Union and the United States continue to be the largest investors in the region. FDI flows in the Caribbean were influenced by sovereign debt concerns in some island states, limited investments in the tourism sector despite the recovery of tourism in the aftermath of the financial crisis, and renewed interest in mining investments.
For sub-Saharan Africa, the story has been one of growth in FDI, with flows jumping by an estimated 19 percent in 2013, having stagnated in 2012. The 2013 figure represents a more than six-fold increase from the level of 2000. More vigorous growth, improved business environments, and more investment
Figure 1.3 FDI flows to developing
economies by region $ billion
Source: World Banke= estimate; f= forecast
00 01 02 03 04 05 06 07 08 09 10 11 12 13e 14f 15f
East Asia and PacificLatin America and CaribbeanEurope and Central AsiaSouth AsiaSub-Saharan AfricaMiddle East and North AfricaAll developing countries
0
100
200
300
400
500
600
700

WoRld Investment tRends and coRPoRate PeRsPectIves | 16 15 | WoRld Investment tRends and coRPoRate PeRsPectIves
opportunities have all played an important role. Within the region, there were some noteworthy fluctuations in 2012. Nigeria, the largest FDI recipient, registered a 20 percent decline in FDI flows, perhaps reflecting concerns about heightened political risk. In contrast, FDI flows into the Democratic Republic of the Congo increased by 81 percent to $2.9 billion, driven by ongoing natural resource-based investment. Angola continued to register a net divestment for the third consecutive year, while FDI flows into South Africa declined by 21 percent, to around $4.6 billion. The need for continuing FDI to sustain the growth levels of recent years means that the 2013 breakdowns at a country level will be awaited with interest.
Persisting political and economic uncertainty affected inflows into the developing economies of the Middle East and North Africa (MENA). The region has been adversely affected by dete-riorating trade, tourism, real estate, finance, and banking prospects, in addition to the war in Syria (especially for Jordan and Lebanon), increased sec-tarian violence (for example, in Iraq and Lebanon), security concerns, political polarization (such as in Egypt), and a generally bumpy transition process. The region has seen FDI flows decline by 15 percent to an estimated $17 billion in 2013. However, recent history shows that a quick and strong rebound in FDI is possible. After plummeting in 2011 from an earlier peak in 2008, flows into the MENA region rebounded by 43 percent in 2012 to reach $19 billion, reflecting underlying investor durability even in the face of political risk. The rebound was particularly strong in Egypt, which had been adversely affected by a deteriorating economy, an uncertain political outlook, and significant downside risks. FDI flows there reached nearly $3 billion in 2012, having reg-istered net divestments in the previous year.
New seats at the table?
The profile of FDI continues to change, with developing economies now a recognized presence at the head table of investors. While global FDI outflows declined in 2012, there was much going on underneath this, with FDI outflows from developing economies reaching both a new record level of $164 billion in 2012 and a new record share of 17 percent of global FDI outflows (figure 1.4). Despite mod-erating economic growth, more and more firms
Figure 1.4 FDI flows from developing
economies $ billion
Source: World Bank
00 01 02 03 04 05 06 07 08 09 10 11 12
Developing countriesBrazil, China, India
0
4060
20
80
120
140
100
160
180
based in developing economies continued to expand overseas in search of investment opportunities. With outflows of $68 billion in 2012, Brazil, China, and India continued to account for the bulk of FDI from developing economies and their firms continued to extend their global reach. (The Russian Federation’s outward FDI flow of $51 billion is not included in the data reported here due to the country’s reclassifi-cation as a high-income economy.) For example, China has emerged as one of the largest investors in Latin America in recent years, despite having limited investments in that region a few years ago. Other developing economies are also emerging as sizeable outward investors, notably Indonesia, Hungary, Malaysia, and Mexico. This next tier of upper-middle income economies accounts for another 36 percent of outflows from developing economies. With more than $5 trillion in assets, sovereign wealth funds—many of which are based in developing countries—have also become more important actors in the global FDI landscape, having invested $127 billion to date. State-owned enterprises (SOEs) based in developing economies are also venturing overseas. It is no longer possible to ignore the role played by these newcomers. Indeed, understanding the different nature of their approach will be critical to better anticipating their investment and risk appetite.
WoRld Investment tRends and coRPoRate PeRsPectIves | 18 17 | WoRld Investment tRends and coRPoRate PeRsPectIves
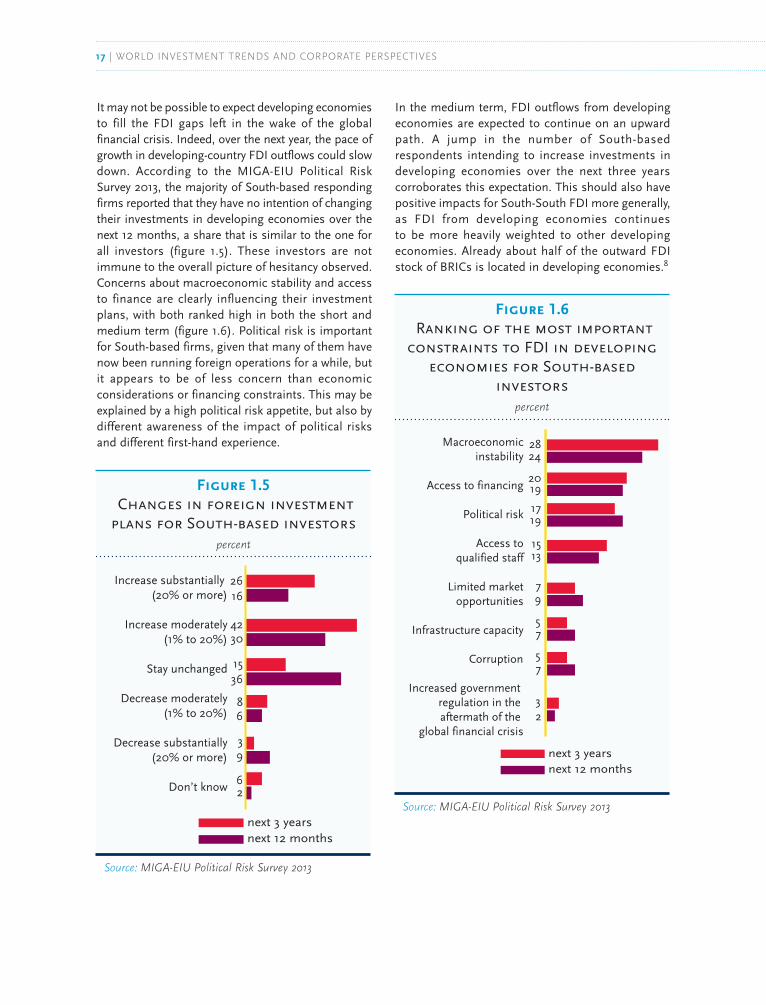
It may not be possible to expect developing economies to fill the FDI gaps left in the wake of the global financial crisis. Indeed, over the next year, the pace of growth in developing-country FDI outflows could slow down. According to the MIGA-EIU Political Risk Survey 2013, the majority of South-based responding firms reported that they have no intention of changing their investments in developing economies over the next 12 months, a share that is similar to the one for all investors (figure 1.5). These investors are not immune to the overall picture of hesitancy observed. Concerns about macroeconomic stability and access to finance are clearly influencing their investment plans, with both ranked high in both the short and medium term (figure 1.6). Political risk is important for South-based firms, given that many of them have now been running foreign operations for a while, but it appears to be of less concern than economic considerations or financing constraints. This may be explained by a high political risk appetite, but also by different awareness of the impact of political risks and different first-hand experience.
Figure 1.5 Changes in foreign investment plans for South-based investors
percent
Source: MIGA-EIU Political Risk Survey 2013
next 3 yearsnext 12 months
16 2630 4236 156 89 32 6
2616
4230
3615
8
9
62
3
6
Increase substantially (20% or more)
Increase moderately(1% to 20%)
Stay unchanged
Decrease moderately(1% to 20%)
Decrease substantially(20% or more)
Don’t know
Figure 1.6 Ranking of the most important
constraints to FDI in developing economies for South-based
investorspercent
Source: MIGA-EIU Political Risk Survey 2013
next 3 yearsnext 12 months
2824
2019
1719
1513
7
57
57
32
9
Macroeconomicinstability
Access to financing
Political risk
Access toqualified staff
Limited marketopportunities
Infrastructure capacity
Corruption
Increased government regulation in the aftermath of the
global financial crisis
In the medium term, FDI outflows from developing economies are expected to continue on an upward path. A jump in the number of South-based respondents intending to increase investments in developing economies over the next three years corroborates this expectation. This should also have positive impacts for South-South FDI more generally, as FDI from developing economies continues to be more heavily weighted to other developing economies. Already about half of the outward FDI stock of BRICs is located in developing economies.8

WoRld Investment tRends and coRPoRate PeRsPectIves | 18 17 | WoRld Investment tRends and coRPoRate PeRsPectIves
Keeping their powder dry?
The World Bank projects that FDI flows to developing economies will decline in 2014 and increase by 12 percent in 2015.9 Despite uncertainties in the short term, developing countries continue to offer favorable medium-term growth prospects, a large and growing consumer base, natural resources, and relatively low labor costs, all of which make them potentially attractive destinations to foreign investors. These factors favor a rebound, especially if macroeconomic conditions strengthen and political challenges are addressed.
Increased investor hesitation regarding expanding investments in developing countries is evident in the findings of the MIGA-EIU Political Risk Survey 2013. For the first time since the survey was launched, concerns about macroeconomic stability were con-sidered as the most important constraint to investment over both the short and medium terms (figure 1.7). These results support the World Bank projections of FDI flows over the next couple of years. While the majority of respondents (47 percent) planned an increase in FDI, a significant share (37 percent) intended to neither increase nor decrease investments over the next 12 months(figure 1.8), somewhat higher levels than in the past couple of years for this survey. That picture changes consid-erably over the next three years, when the over-whelming majority of investors (70 percent) expressed the intention of increasing investments and the share of respondents that do not plan to increase or decrease their investments is more than halved (15 percent).
These findings are corroborated by external surveys carried out in the course of this year (table 1.3). The consensus is that, while FDI flows will likely remain subdued this year and next, they are poised for an increase, especially if economic recovery strengthens in key source and recipient countries. What also bodes well for FDI prospects, ultimately, is the record level of cash held by companies.10 An A.T. Kearney survey found that only one third of respondents cited lack of funds as the reason for holding back investments. Firms from Canada, Japan, and the United States are currently holding large levels of cash, which could be deployed to fuel a new surge in FDI flows once confidence resumes. UNCTAD’s World Investment Prospects Survey 2013–2015 is
also supportive of the medium-term outlook findings of the MIGA-EIU Political Risk Survey 2013, with half of the respondents forecasting an increase in each of the subsequent three years over the 2012 levels of FDI expenditure.
Political risks remain important
As mentioned, economic concerns lead the list of the most important constraints investors believe they face in developing economies. This does not mean that political risks do not occupy investors’ minds. According to this year’s survey, political risk still ranks second place among possible impediments to FDI (figure 1.7). Other corporate surveys—and the thriving political risk insurance sector, more generally—also corroborate its ongoing importance (table 1.4).
Figure 1.7 Ranking of the most important
constraints to FDI in developing economies
percent
Source: MIGA-EIU Political Risk Survey 2013
2021
1919
1818
1613
9
97
75
24
11
10
Macroeconomicinstability
Political risk
Access toqualified staff
Access to financing
Corruption
Infrastructurecapacity
Limited marketopportunities
Increased governmentregulation in theaftermath of the
global financial crisis
Other
next 3 yearsnext 12 months

WoRld Investment tRends and coRPoRate PeRsPectIves | 20 19 | WoRld Investment tRends and coRPoRate PeRsPectIves
Table 1.3 Recent survey findings regarding FDI prospects
Survey Main findings
A.T. Kearney Foreign Direct Investment Confidence Index 201311
r Caution over the next three years, with investors holding back.
r Concerns about the fiscal situation of the United States, the euro zone, and China’s economic slowdown.
r Only a third of the investors surveyed said that their com-pany’s FDI has returned to its pre-financial crisis level.
r Another quarter expected the return to occur within the year.
UNCTAD World Investment Prospects Survey 2013–201512
r Half of all respondents remain neutral about the 2013 global investment outlook.
r Picture improved sharply for 2014 and 2015. Half of the respondents forecast an increase in intended FDI expenditures over the 2012 level in each of the next three years.
r Concerns about the economy in BRICs and the United States.
MIGA-EIU Political Risk Survey 2013 (appendix 2)
r While 34 percent of the 459 surveyed firms intend to increase their investments moderately and 13 percent substantially over the next 12 months, 37 percent intend not to undertake any new investments or decrease existing ones.
r Over the next three years, 44 percent of the surveyed firms intend to increase their investments moderately and 26 percent substantially, while 15 percent intend not to undertake any new investments or decrease existing ones.
Foreign investor perceptions of political risk remain influenced by a continuation of existing trends and some new economic and political developments. Disaggregating political risks,17 the respondents to the MIGA-EIU Political Risk Survey 2013 once again iden-tified the risks of adverse regulatory changes and breach of contract to be of most concern (figure 1.9). The former has ranked persistently as a top investor concern, yet it remains largely uncovered by the political risk insurance industry. Analyzing this risk—and under-standing both the contract and country-level factors that determine it—forms the basis for chapter three of
this publication. The breach of contract risk has also consistently appeared as an important investor concern and is linked to adverse regulatory changes, which can lead to contract breaches. Worries about economic per-formance and financial crises have also raised concerns about restrictions on the convertibility and transfer of profits and other funds.
Adverse regulatory changes and breach of contract are two risks that are especially relevant for the extractive industries. While not a new phenomenon, resource nationalism continues to gain in prominence as

WoRld Investment tRends and coRPoRate PeRsPectIves | 20 19 | WoRld Investment tRends and coRPoRate PeRsPectIves
Table 1.4 Survey findings regarding political risks
Survey Objective Main findings
Aon, Global Risk Management Survey 201313
Assess the top risks facing organizations today
r Political risk ranked in tenth place out of 49 risks.
r The first time that political risk entered the list of the top 10 risks.
r Projects that political risk will move to sixth place three years from now.
Ernst &Young, Business risks facing mining and metals 2012 – 201314
Assess the top business risks for mining and metals
r Resource nationalism moved to first place in the list of the top 10 business risks facing the mining and metals sector in 2012, up from eighth place in 2008.
Protiviti and North Carolina State University’s ERM Initiative15
Obtain views through ratings as to what risks are expected to affect business organizations over the next 12 months
r Risk that uncertainty surrounding political leadership in national and international markets will limit growth was third out of 20 risks.
r Regulatory changes and heightened regulatory scrutiny and its effect on product and service production and delivery were in first place.
Association for Financial Professionals and Oliver Wyman Risk Survey 201316
Assess the factors expected to have the greatest impact on organizations’ earnings over the next three years
r Political risk ranked in fourth place among 20 factors expected to have the greatest impact on organizations’ earnings over the next three years.
r Political risk also ranked in fourth place in terms of its difficulty to forecast.
governments around the world seek a greater share of returns in the extractive industries. Commodity prices remain elevated and fluctuating, and competition for critical resources is acute. Recent examples include regulatory changes in the mining sector in several emerging Asian economies in an effort to protect mineral wealth and create benefits for local populations. As the survey by Ernst & Young found (table 1.4), resource nationalism has become the top business risk in the mining and metals sector, as host governments are keen to retain ownership of their natural resources (chapter three).
Resource nationalism, together with contract renego-tiations, has exacerbated political risk perceptions in developing economies. This trend also supports a more general pendulum swing towards greater pro-tectionism, attested by the increased restrictiveness of national FDI policies introduced over the past few years.18 One positive development is the increased transparency permeating the sector as contract dis-closures by some resource-rich countries (such as Ghana, Guinea, and Sierra Leone) are gaining prom-inence. The Extractive Industries Transparency Initiative now claims 23 countries that meet all of its

WoRld Investment tRends and coRPoRate PeRsPectIves | 22 21 | WoRld Investment tRends and coRPoRate PeRsPectIves
Figure 1.9 Types of political risk of most
concern to investors in developing economies
percent
Source: MIGA-EIU Political Risk Survey 2013
5856
4545
4337
3330
3127
2419
1311
76
Adverse regulatorychanges
Breach of contract
T&C restrictions
Civil disturbance
NHFO
Expropriation
Terrorism
War
next 3 years
next 12 months
requirements, another 16 candidate countries that have not yet become compliant, and over $1 trillion in revenues reported.19 Transparency is becoming a key plank of reform: for example, in February 2013 Guinea made the decision to publish details of all of its mining contracts as a step to improve overall gov-ernance in the sector.
The scramble for resources extends outside the extractive industries, notably to such basic neces-sities as food and water. Demand for farmland is increasing in response to population growth, rising incomes, high agricultural prices, and the growing use of biofuels. There is strong foreign investor interest in agriculture, emanating from a mixed group of organizations that includes SOEs, sov-ereign wealth funds, and the private sector. Although FDI in farming is a small proportion of the total FDI in agricultural value chains, it is particularly sen-sitive, especially in countries with poor land gov-ernance, tenuous property rights, and weak institu-tional capacity. Access to water for consumption, irrigation, and power generation is also important, and competition for water can trigger conflict. This
was illustrated recently by heightened tensions between Egypt and Ethiopia regarding the threat to the former’s water supply stemming from the hydropower dam in the latter.
Civil disturbance ranks in fourth place as an investor concern, perhaps reflecting the recognition that—while the risk generally causes severe losses—it is often localized in a narrow group of countries. Territorial disputes, elevated political tensions, religious or political polarization (as manifested for example in the ongoing turmoil in the MENA region),
can all lead to an increased risk of civil disturbance. Even in developing economies with legitimate gov-ernments, popular discontent can be expressed through protests against economic mismanagement or a wasteful state. Although of less concern to the survey respondents, the conflict in Syria and impli-
Figure 1.8 Changes in foreign investment
plans
percent
Source: MIGA-EIU Political Risk Survey 2013
1
7
78
4
4
3715
3444
1326
next 3 years next 12 months
Increase substantially (20% or more)
Increase moderately(1% to 20%)
Stay unchanged
Decrease moderately(1% to 20%)
Decrease substantially(20% or more)
Don’t know

WoRld Investment tRends and coRPoRate PeRsPectIves | 22 21 | WoRld Investment tRends and coRPoRate PeRsPectIves
Figure 1.10 Impact of political risk on
foreign investors
percent
Source: MIGA-EIU Political Risk Survey 2013
T&C 29
31
19
7 14
War
2227
2412
16
30
24
37
26
103
AdvReg
1017
26
25
22Terror
14
31
15
14
27NHFO
26
30
20
10 15
CD
32
6
25 32
17
620
BoC
13
18
26
26
18
Expro
1 (Very high impact)2345 (No impact)
cations for neighboring countries; territorial disputes and nationalistic tensions toward investors in several Asian economies; and competition for hydro-carbons, minerals, and other extractives have impli-cations for conflict-related losses to investments. The risks of war and civil disturbance are strongest in very weak or failing countries, such as those ranked either as being in a critical state or in danger of failing according to the Failed States Index.20 In 2013, the number of countries in those two cate-gories reached 16, the second highest since the inception of the index in 2005. Some of these countries have been listed in these two categories for several years in a row, suggesting a persistent political violence risk.
And everyone else
Political risk is important not only because of its impact on foreign investment intentions based on investor perceptions, but also because of its effects on the companies that have actually invested abroad. For example, the 2013 Association for Financial Professionals Risk Survey found that political risk ranked fourth among 20 factors expected to have the greatest impact on organizations’ earnings over the next three years (table 1.4).
The MIGA-EIU Political Risk Survey 2013 found that, among the eight political risks listed, adverse regu-latory changes and breach of contract carried the biggest impact on companies engaged in FDI into developing economies (figure 1.10). However, respondents might have also factored in the like-lihood of these risks in their responses to this question, which might explain why a significant share of respondents indicated no or little impact arising from the risk of expropriation, even though expropriation might be generally expected to rank high as having a significantly negative effect on investments. Adverse regulatory changes and breach of contract were also found to be the most important risks causing financial losses for investors in developing economies over the last three years (figure 1.11). Finally, of all eight political risks, most respondents singled out adverse regulatory changes and breach of contract as the risks that have caused cancellations, withdrawals of investments, or both, over the past 12 months (figure 1.12).

WoRld Investment tRends and coRPoRate PeRsPectIves | 24 23 | WoRld Investment tRends and coRPoRate PeRsPectIves
Figure 1.11 Financial losses incurred over
the past three years on account of political risks
percent
Source: MIGA-EIU Political Risk Survey 2013
40Adverse regulatory
changes
Breach of contract
T&C restrictions
Civil disturbance
NHFO
Expropriation
Terrorism
War
6
6
5
16
34
25
20
Figure 1.12 Withdrawal of existing
investments or cancelation of planned investments over the past
twelve months due to political risks
percent
Source: MIGA-EIU Political Risk Survey 2013
Adverse regulatory changes
4941
27
61
59
51
58
66
68
24
35
26
19
17
10
14
14
14
15
16
661716
15
Neither withdraw nor cancelWithdraw, cancel or bothDon’t know
NHFO
Expropriation
Breach of contract
Civil disturbance
T&C restrictions
War
Terrorism
A perpetual spring?
The MIGA-EIU Political Risk Survey 2013 again asked investors a series of questions concerning the ongoing turmoil and uncertainty facing several developing economies in the MENA region. Despite a rebound in 2012, the evolving political landscape again took a toll on regional economic growth in 2013. The underlying economic conditions that brought about the Arab Spring events have failed to improve appreciably. The macroeconomic picture in most of these countries has deteriorated with high fiscal and trade deficits, increasing indebtedness, persistently high unemployment rates (especially among young people), deteriorating trade and tourism, and spiking inflation rates. This picture has been accentuated by high oil prices that until recently have pushed up bills for both energy and government subsidies. With more than two years since the onset of the Arab Spring, the countries undergoing transitions continue to be in varying phases of the democratic process, some facing setbacks and delays, and all struggling to stabilize or boost their economies. The Syrian crisis has affected neighboring countries like Lebanon and
Jordan, which are also faced with a large influx of refugees, imposing additional burdens on their economies. Importantly, the conflict itself is spilling over into neighboring countries, worsening an already-frail security situation.
For the most part, investors in the MENA region continue to hold back, following a “wait and see” approach. Dim growth forecasts, coupled with concerns about security, political violence, and government instability have clearly affected their willingness to boost investments. In response to the developments in this region over the past year, the majority of respondents in the MIGA-EIU Political Risk Survey 2013 expect to make no changes to planned investments across all countries (figure 1.13). Other evidence suggests a

WoRld Investment tRends and coRPoRate PeRsPectIves | 24 23 | WoRld Investment tRends and coRPoRate PeRsPectIves
Figure 1.14 Ranking of the most important
political risks in MENA
percent
Source: MIGA-EIU Political Risk Survey 2013
Expropriation
Terrorism
NHFO
War
T&C restrictions
Breach of contract
Adverse regulatory changes
North AfricaMiddle EastGCC
74
11
5
14
51
4
13
6
6
55
10
10
9
9
10
10
13
15
27
17
diversity of appetite, with resource-seeking investors less risk averse, perhaps because of geographically-tied opportunities.21
Planned investments may remain quite sizeable for the member countries of the Gulf Cooperation Council (GCC), mostly high-income economies, but not so for the rest of the countries in the region. Furthermore, a significant minority of investors planned to withdraw investments (14 percent and 10 percent, respectively). Although the GCC members currently seem to have escaped the perceived risks associated with the region, the survey shows that a significant minority of investors remain uncertain even there. Nonetheless, a significant minority of investors was also less concerned about the sit-uation in GCC members and planned to increase investments there.
Figure 1.13 Impact of developments in MENA
on investment plans
percent
Source: MIGA-EIU Political Risk Survey 2013Note: Syria was excluded from this year’s survey
Middle East
446
2710
553
2814
1358
255
Increase planned investmentsNo change to planned investmentsWithdraw planned investmentsDon’t know
North Africa
GCC

WoRld Investment tRends and coRPoRate PeRsPectIves | 26 25 | WoRld Investment tRends and coRPoRate PeRsPectIves
Figure 1.15 Perceived changes in the breach
of contract risk in MENA percent
Source: MIGA-EIU Political Risk Survey 2013
Not surprisingly, political violence (war, civil dis-turbance, and terrorism) was the risk of most concern in the Middle East and North Africa, with two thirds of the survey’s respondents citing it as the most important constraint (figure 1.14). Interestingly, breach of contract also ranked high. Changes in gov-ernments as electoral processes unfold, the emergence of new political actors and the shake-up of the status quo—coupled with rising public spending, fiscal deficits, and economic concerns—appear to have shaken confidence in governments’ willingness to honor their contractual obligations with foreign investors. As discussed above, the region as a whole saw a rebound of 43 percent in inward investment in 2012, especially into Egypt, before declining by 15 percent this year amidst renewed uncertainty. Despite stated concerns, it seems that investors were willing to return quickly to this anchor market. This raises questions as to whether such behavior could be repeated once the dust settles in the region as a whole. Do these surveys understate the preparedness of investors to return? With the resurgence of uncertainty in Egypt, are investors likely to jump back again so suddenly a second time?
Breach of contract and adverse regulatory changes were also cited as the most important risks in the GCC countries by survey respondents. Given that these countries are not undergoing political tran-sitions in the same manner or magnitude as other countries in the MENA region, this finding suggests that such perceptions have not been triggered by recent events. The majority of survey respondents did not see an increase in the breach of contract risk for this group of countries, which suggests that it may have been present for some time (figure 1.15).
The perception that breach of contract risk in developing economies in the MENA region has been increasing is noteworthy since most of the focus to-date has been on the risk of political violence. Foreign investors are clearly watching how transition governments are treating new and existing con-tractual obligations and are concerned that this risk may be on the rise. This is especially evident in North African countries, where the majority of respondents indicated a significant increase in this risk, although this is likely in reference to select countries.
Significantly increasedModerately increasedUnchangedModerately decreasedSignificantly decreased
GCC
5 GCC
7
29
56
53
North Africa
NA
41
32
224 1
Middle East
4132
4 122
ME
Significantly increasedModerately increasedUnchangedModerately decreasedSignificantly decreased
GCC
5 GCC
7
29
56
53
North Africa
NA
41
32
224 1
Middle East
4132
4 122
ME

WoRld Investment tRends and coRPoRate PeRsPectIves | 26 25 | WoRld Investment tRends and coRPoRate PeRsPectIves
It’s (still) the economy...
Five years since the financial crisis, the recovery of the global economy is proceeding on shaky grounds and with downside risks. Like other private capital flows, FDI was affected by the financial crisis, and is struggling to rebound. Developing economies have fared better than high-income economies in terms of a rapid return to growth and a recovery in FDI inflows, but the picture is moderating on both fronts. Despite the economic downturn, developing economies have continued to pursue their overseas expansion plans, registering record levels of FDI outflows. Corporate foreign investment intentions are hesitant for the near future, but remain more optimistic in the medium term. Also reflecting a pre-occupation with economic developments, corpo-rations have expressed a somewhat greater concern over macroeconomic instability as a constraint to foreign investment plans than political risk. However, they continued to recognize the importance of political risk not only in their investment intentions, but also in terms of its impact on their businesses, such as incurring financial losses. Investors were also concerned about the risks of adverse regulatory changes and breach of contract, with the latter becoming a growing apprehension in the Middle East and North Africa.
CHAPTER TWO
28 27
ThePolitical RiskInsuranceIndustry

28 27
The dramatic increase in political risk insurance (PRI) issuance of recent years has continued, rising 33 percent in 2012 and on track for similar growth in 2013. PRI issuance has once again
exceeded the pace of increase in foreign direct investment (FDI) flows into developing economies over the same period.
Market trends – demand side: Demand for PRI continues to be driven by concerns related to general market turbulence, including the still-unfolding Arab Spring, high-profile expropriations,
persistent resource nationalism, capital constraints, and regulation. The expansion of FDI (and more generally, the “quest for yield”) in frontier markets has also been accompanied by greater demand for PRI products.
Market trends – supply side: Increased product lines, longer tenors, and new entrants formed the basis of the increase in capacity on the supply side, keeping premiums soft, though the
relative higher yields of PRI premiums still look attractive compared to the broader insurance business. Concerns have been raised about the durability and experience of the new private entrants. On the public side, activity has also increased, responding to greater demand from traditional clientele.
Market offerings – changing role of public providers: export credit agencies (ECAs) and multilaterals have expanded their product lines, notably with MIGA offering its non-honoring
product to state-owned enterprises, and the Overseas Private Investment Corporation of the United States (OPIC) now covering investments by private equity funds (with other public providers also looking at such cover). The Islamic Corporation for the Insurance of Investment and Export Credit (ICIEC) has developed a dedicated sukuk insurance product. Across the market, ECAs are looking to develop new tools to provide liquidity to the export credit business and to reassure domestic businesses investing overseas.
Market offerings – product innovation by private providers: Like the public providers, private insurers are facing greater pressures to offer comprehensive covers. They have also expanded
their tenors across several markets. Product innovations include a new PRI cover for senior secured project finance debt by AIG.
Claims – Notwithstanding the Arab Spring and other high-profile events, claims only inched up in 2012. The substantial expansion of PRI cover does not yet appear to have any substantial
impact on claims.

29 | the PolItIcal RIsk InsuRance IndustRy
Box 2.1 Overview of the PRI market
Source: Berne Union; Lloyd’sa A partial risk guarantee covers private lenders against the risk of government failure to honor contractual obligations
relating to private projects. b The Berne Union’s Prague Club was started in 1993 with funding from the European Bank for Reconstruction and
Development. It is an information exchange network for new and maturing insurers of export credit and investment. The Prague Club supports members’ efforts to develop their export credit and investment insurance facilities by hosting technical discussions at twice-yearly meetings, as well as ad hoc information exchanges. A number of Prague Club members have gone on to meet the requirement for full Berne Union membership.
The PRI market includes three broad categories of providers and covers both export or trade credit and investment insurance. For the purposes of this report, PRI refers to investment insurance. The public PRI market comprises
both national and multilateral PRI providers. The private market’s PRI falls into two main categories: (i) political risk activities similar to those of public and multilateral insurers, such as coverage for investments in developing countries against expropriation, political violence, and other such risks; and (ii) developing-country non-payment insurance covering contract frustration and default by governments.
Public PRI Providers: They comprise national export credit agencies and investment insurance entities. They focus on cross-border trade and investment, generally for constituents in their own countries.
Multilaterals: These include the African Trade Insurance Agency, the Asian Development Bank, the Inter-American Development Bank, the Inter-Arab Investment Guarantee Corporation, the Islamic Corporation for the Insurance of Investments and Export Credit, and MIGA. The World Bank, the Asian Development Bank, and the Inter-American Development Bank also provide risk-mitigation instruments, such as partial risk guarantees.a
Private PRI Providers: The majority of private insurers are based in three insurance centers—London, Bermuda, and the United States (primarily New York City)—and several of the larger insurers have offices in Singapore; Hong Kong SAR, China; and Australia (Sydney), among other places. In addition to traditional PRI for equity investment, the private market offers protection for a wide variety of payment risks in developing countries, either for political perils alone, or comprehensive non-payment cover. Brokers play an important role in promoting and sourcing PRI for the private market. This market segment is dynamic: over the past year, some players have exited the PRI market, while new entrants have appeared.
The Reinsurers: Reinsurance companies write PRI-related coverage for both trade and investment. Reinsurance is an underlying factor driving both pricing and capacity in the private market. Some of the top reinsurers include Munich Re and Hannover Re of Germany, Swiss Re of Switzerland, and Berkshire Hathaway/General Re of the United States. Export credit agencies and multilaterals also participate as reinsurers of PRI, although on a smaller scale.
The Berne Union: The Berne Union was founded in 1934 in order to promote international acceptance of sound principles in export credit and investment insurance and to exchange information relating to these activities. Today, the Berne Union has 86 members, including Prague Clubb members, comprising mainly export credit agencies, multilateral organizations, and private insurers.The Berne Union plays an important role in bringing together the public and private insurers to enhance cooperation and information sharing. Members meet on a regular basis to discuss industry trends and challenges. In recent years, there has been a concerted effort on the part of the Berne Union Secretariat to promote transparency and disclosure in the industry and to represent member interests in order to promote global trade and investment.
Lloyd’s: An insurance “marketplace” where members join together to insure political risks for cross-border investment, such as confiscation of property, inconvertibility of currency, and political violence. Only a small number of Lloyd’s syndicates offer investment insurance.

the PolItIcal RIsk InsuRance IndustRy | 30
Figure 2.1 Growth in PRI issuance by Berne Union members and in FDI flows
index (2005=1000)
Source: Berne Union Secretariat and World Bank
05 06 07 08 09 10 11 12
100
150
250
350
Total PRI coverFDI inflows into developing economiesGlobal FDI inflows
As in previous years, this chapter explores the dynamics of the expanding PRI business, assessing both demand and supply trends and exploring both the private and public market. A greater focus is offered this year on new product lines. The chapter will conclude with a look at the future, assessing current corporate approaches to risk management, as reflected in the MIGA-EIU Political Risk Survey 2013, and examining the most recent claims data.
Demand growth for PRI continues...
The PRI industry experienced another year of dramatic growth in 2012. Berne Union members issued $100 billion in investment insurance over the year, an increase of 33 percent over the previous year, and more than double the 13 percent increase in issuance observed for 2010-11.22 Private PRI members outside the Berne Union reported similar trends. To put this in an even longer context, the volume of new PRI issued by Berne Union members in 2012 is over three times the volume issued in 2005. In the context of the decline in international investment (total recorded FDI fell by 18 percent in
2012), such growth is impressive. PRI coverage reached $54.3 billion in the first half of 2013, suggesting that 2012 levels of issuance could well be reached again in 2013.
Developing economies dominate cover: In 2012, the vast majority of PRI cover, $85 billion of total issuance, was for investment into developing economies. In percentage terms, this was stable over the year and up slightly from 2010 (85 percent and 82 percent of total PRI issuance was into developing economies in 2011 and 2010, respectively).
PRI increases as FDI stutters: In contrast to the significant increase in PRI issuance, global FDI flows declined in 2012, as mentioned earlier. As has been the case since the global financial crisis, FDI into developing economies held up better than that into higher-income economies. Notwithstanding this, FDI into developing economies still declined by 6 percent in 2012 from the 2011 level (figure 2.1). As a result, FDI flows into developing countries were a larger component of overall FDI in 2012 (43 percent versus 36 percent in 2011). Moreover, FDI inflows into developing economies continue to be covered by PRI to a much greater extent than global FDI, the

31 | the PolItIcal RIsk InsuRance IndustRy
bulk of which remains uncovered. During the last year, however, there was a sharp uptick in the ratio of global PRI to global FDI, as PRI issuance increased even while FDI declined (figure 2.2).
The ongoing growth in PRI issuance is impressive, but a longer historic perspective is perhaps relevant also here. While levels of PRI issuance are unprecedentedly high and the share of FDI has grown in recent years, at 14.2 percent this latter number does not (yet?) come close to previous peaks. For example, it remains below the proportion seen in 1982, when the ratio of PRI to FDI exceeded 25 percent.
It’s a riskier world
New investment insurance issued by members of the Berne Union reached another record in 2012, against the backdrop of a series of global political events, driving demand-side considerations.
Figure 2.2 Ratio of PRI to FDI flows: global
versus developing economies
percent
Source: Berne Union Secretariat and World Bank
PRI to FDI, developing economiesPRI to FDI, global
05 06 07 08 09 10 11 120
2
4
6
8
10
12
14
16
PRI to FDI, developing economiesPRI to FDI, global
05 06 07 08 09 10 11 120
2
4
6
8
10
12
14
16
r War and civil disturbance: The ongoing civil war in Syria has had devastating consequences internally and has increased uncertainty in neighboring countries. At the same time, turmoil in Egypt produced a second regime change within 12 months and Kenya was rocked by the Westgate Mall attacks. The year was also marked by a series of uprisings in Western and Central Africa, with the Central African Republic, Guinea-Bissau, and Mali experiencing forced regime changes.
r Resource nationalism: Governments of select resource-rich economies in Asia and Africa have sought to secure larger local shares in existing or proposed agreements with foreign firms in extractive industries.
r Expropriation and investor-state disputes: High-profile expropriations coupled with ongoing arbitrations in Latin America have impacted investor confidence in those economies. On a broader, related note, 2012 also saw a record 58 investor-state disputes filed in arbitration courts under international investment agreements.23 Most of these treaty-based cases have been brought by entities headquartered in developed countries and name developing or transition countries as respondents. The increase in investor-state dispute settlement cases serves not only as a sign of fractures in existing relationships, but as a caution to investors considering new projects in developing economies.
r Financial regulation: Challenges in the banking markets persisted into 2012, as institutions in the advanced economies dealt with the ongoing effects of the economic slowdown and the sovereign debt crises, including difficulties in securing long term, dollar-denominated funding. European banks were particularly motivated to increase capital ratios in preparation for the Capital Requirements Directive, given its restrictions on leverage. Instruments offering capital relief, including PRI for investments, attracted increased attention during the year.
Demand for PRI from Berne Union members continued to be particularly strong for investments in Asia and the Middle East and North Africa (MENA) region. However the interest in cover for developed-country political risk has also continued, reflecting the protracted nature of the global financial and sovereign debt crises.

the PolItIcal RIsk InsuRance IndustRy | 32
In the immediate aftermath of the global financial crisis, the growth in cover by public providers and multilaterals significantly outpaced that of private providers. However, 2012 saw a reversal of this trend, as issuance by private providers outpaced the other provider classes (figure 2.3; see appendix 3 for a listing of Berne Union members by type). However this analysis excludes Lloyd’s market participation, so the difference in relative shares of public and private issuance across the entire PRI provider market may not be as marked as the Berne Union data suggest.
Table 2.1 Aggregate Berne Union PRI
issuance by provider type, 2012
Type of ProviderCover Provided 2012 ($ million)
Top 5 Private providers
17,821.4
Top 5 Public providers
73,855.3
Top 2 Multilateral providers
2,916.7
Source: Berne Union Secretariat
But don’t forget the supply side
The PRI market is served by a mix of public providers, private providers, and multilaterals, where public providers are typically ECAs and other specialist investment promotion agencies funded by
Figure 2.3 PRI Issuance by Berne Union
members into developing economies, by type of provider
$ million
Source: Berne Union Secretariat
10,000
30,000
50,000
70,000
90,000
05 06 07 08 09 10 11 12 13 h1
MultilateralPublicPrivate
governments. Table 2.1 presents the aggregate PRI issuance according to the Berne Union for the top five public providers, the top five private providers, as well as the active multilaterals in the sector during 2012. Among them, these 12 entities accounted for 95 percent of PRI issuance over the year.
Overall, public providers dominate Berne Union activity. These entities have the benefit of enormous backing from their sovereign sponsors and as a result have access to large amounts of funding. The top two public providers account for 77 percent of total Berne Union public issuance, equivalent to an impressive 57 percent of overall Berne Union issuance for the year. While shares of private ownership are similarly skewed, these providers account for a much lower absolute amount of issuance—the top two private providers account for 71 percent of private Berne Union issuance, equivalent to approximately 13 percent of overall Berne Union PRI issuance in 2012.
Given the position of PRI as a specialty line within the space of general insurance, private capacity in this market is heavily influenced by conditions in the wider insurance market. Broadly, insurers remain well-capitalized, and largely untroubled by requirements under the Solvency II and Basel III regulations. Low interest rates continued throughout 2012, depressing investment returns and keeping the attractiveness of higher-yielding insurance segments like PRI at elevated levels. Generally stable premiums (more on this below) have also attracted interest from insurers.
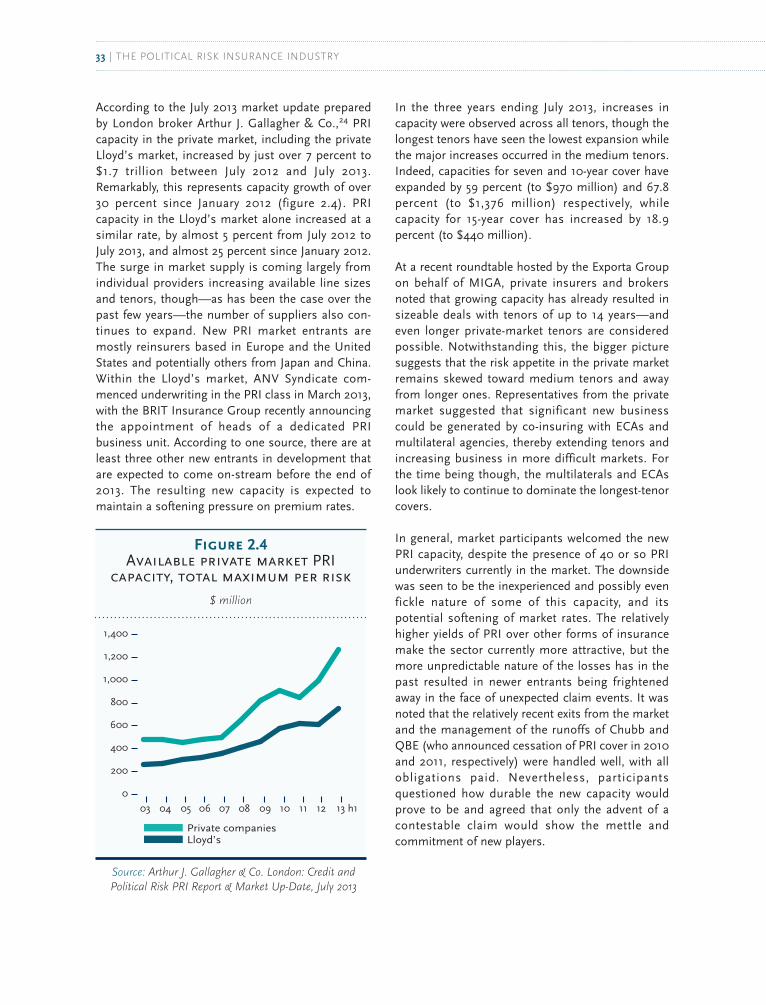
33 | the PolItIcal RIsk InsuRance IndustRy
According to the July 2013 market update prepared by London broker Arthur J. Gallagher & Co.,24 PRI capacity in the private market, including the private Lloyd’s market, increased by just over 7 percent to $1.7 trillion between July 2012 and July 2013. Remarkably, this represents capacity growth of over 30 percent since January 2012 (figure 2.4). PRI capacity in the Lloyd’s market alone increased at a similar rate, by almost 5 percent from July 2012 to July 2013, and almost 25 percent since January 2012. The surge in market supply is coming largely from individual providers increasing available line sizes and tenors, though—as has been the case over the past few years—the number of suppliers also con-tinues to expand. New PRI market entrants are mostly reinsurers based in Europe and the United States and potentially others from Japan and China. Within the Lloyd’s market, ANV Syndicate com-menced underwriting in the PRI class in March 2013, with the BRIT Insurance Group recently announcing the appointment of heads of a dedicated PRI business unit. According to one source, there are at least three other new entrants in development that are expected to come on-stream before the end of 2013. The resulting new capacity is expected to maintain a softening pressure on premium rates.
In the three years ending July 2013, increases in capacity were observed across all tenors, though the longest tenors have seen the lowest expansion while the major increases occurred in the medium tenors. Indeed, capacities for seven and 10-year cover have expanded by 59 percent (to $970 million) and 67.8 percent (to $1,376 million) respectively, while capacity for 15-year cover has increased by 18.9 percent (to $440 million).
At a recent roundtable hosted by the Exporta Group on behalf of MIGA, private insurers and brokers noted that growing capacity has already resulted in sizeable deals with tenors of up to 14 years—and even longer private-market tenors are considered possible. Notwithstanding this, the bigger picture suggests that the risk appetite in the private market remains skewed toward medium tenors and away from longer ones. Representatives from the private market suggested that significant new business could be generated by co-insuring with ECAs and multilateral agencies, thereby extending tenors and increasing business in more difficult markets. For the time being though, the multilaterals and ECAs look likely to continue to dominate the longest-tenor covers.
In general, market participants welcomed the new PRI capacity, despite the presence of 40 or so PRI underwriters currently in the market. The downside was seen to be the inexperienced and possibly even fickle nature of some of this capacity, and its potential softening of market rates. The relatively higher yields of PRI over other forms of insurance make the sector currently more attractive, but the more unpredictable nature of the losses has in the past resulted in newer entrants being frightened away in the face of unexpected claim events. It was noted that the relatively recent exits from the market and the management of the runoffs of Chubb and QBE (who announced cessation of PRI cover in 2010 and 2011, respectively) were handled well, with all obligations paid. Nevertheless, participants questioned how durable the new capacity would prove to be and agreed that only the advent of a contestable claim would show the mettle and commitment of new players.
Figure 2.4 Available private market PRI
capacity, total maximum per risk
$ million
Source: Arthur J. Gallagher & Co. London: Credit and Political Risk PRI Report & Market Up-Date, July 2013
0
200
400
600
800
1,000
1,200
1,400
03 04 05 06 07 08 09 10 11 12 13 h1
Private companiesLloyd’s

the PolItIcal RIsk InsuRance IndustRy | 34
Table 2.2 Available private market capacity by tenor, total maximum per risk
July 2010 – July 2013, $ million
Maximum Tenor (Years)
Jul-10 Jan-12 Jul-13 3-year growth
15 370 440 440 18.9%
10 610 705 970 59.0%
7* 820 915 1,376 67.8%
5*** 1,180 1,350 1,694 43.6%
3 1,223 1,383 1,742 42.4%
Source: Arthur J. Gallagher & Co. London: Credit and Political Risk PRI Report & MarketUp-Date, July 2013 *Some providers offering this tenor will extend to 7.75 years** Some providers offering this tenor will extend to 5.5 years
Pricing grows, but only slowly…
Capacity in the general insurance market is still plentiful. However an increase in demand for general insurance resulting from a return to growth in the industrialized economies, as well as increased underwriting discipline, have led to a modest growth in general insurance premiums even under such conditions. According to the World Insurance in 2012 report prepared by Swiss Re,25 2012 saw modest premium growth of 2.6 percent in the non-life segment. As has been the case over recent years, this is primarily driven by emerging markets, where premiums grew by 8.6 percent. Within this broad economic class, emerging Asia (13 percent premium growth) and Latin America and the Caribbean (7.8 percent growth) were key drivers.
Within the PRI niche, premium income to Berne Union members increased by approximately 5 percent over the year. However, consistent with the record increases in issuance, total exposure among such entities rose by almost double this amount, with the result that the premium-exposure ratio again declined in 2012 (figure 2.5).
Figure 2.5 Ratio of premiums to average PRI exposure for Berne Union
members
Source: Berne Union Secretariat and World Bank
Prospects for the wider market are mixed. Softening economic growth in emerging markets and continued capacity expansion could weigh on premiums moving forward. However, a return to growth in the advanced economies may see a return to premium growth in larger markets.
00 01 02 03 04 05 06 07 08 09 10 11 12
0.4
0.5
0.6
0.7
0.8
0.9
1.0

35 | the PolItIcal RIsk InsuRance IndustRy
Table 2.3 Key new and expanded market
offerings, 2012
Public and Multilateral Providers
MIGA: Non-honoring of financial obligations product to SOEs
ICIEC: Sukuk insurance policy
OPIC: PRI facilities for private equity funds
Various ECAs: Working capital cover to banks; expanded securitization/refinancing cover
Private Providers
Zurich: PRI-inclusive comprehensive supply chain cover; cyber risk cover
AIG: PRI cover for senior secured project finance debt
Various: expanded forced abandonment; political evacuation; PRI-inclusive comprehensive products
Innovation, both public and private
Well-publicized political events such as those described earlier have reinforced the high profile that PRI has attained since the onset of the Arab Spring. This, coupled with the challenges in the banking market, has sparked a range of product innovations from both public and private providers over the past year.
ECAs and other public providers are finding themselves playing new roles. Over the last year, ECAs have stepped up to supplement the banking market in an effort to support local firms, with many now offering working capital cover to banks and introducing or expanding securitization guarantee products. OPIC has launched PRI coverage for private equity funds, expanding the options available to these investment vehicles.
In response to increased investor interest in non-payment insurance on financial obligations from sovereign obligors, MIGA has now expanded its non-honoring of financial obligations product to cover financing provided directly to state-owned enterprises and sub-sovereign borrowers. This product is Basel II compliant, allows for tenors of up to 15 (in some cases 20) years, and claims—while subject to defined waiting periods—do not require investors to have received an arbitral award. The market reacted positively to this extension of MIGA’s product line, and hopes are that MIGA can use its market position to extend the cover into more difficult markets and expand tenors in the existing market space. The product also opens new avenues for collaboration between MIGA and ECAs, as was demonstrated when MIGA made use of the non-honoring product to guarantee up to €380 million in payments to be made in connection with medium-term notes issued by Magyar Export-Import Bank, the Hungarian export credit agency.
In the private provider space, insurers have continued to develop products that incorporate PRI alongside other types of coverage, providing a greater variety of comprehensive offerings and offering solutions to banks looking for different varieties of capital relief. Zurich has recently launched a comprehensive (PRI-inclusive) supply-chain protection product, as well as coverage for cyber risks, which may be linked to political events. AIG has introduced a comprehensive product for senior debt tranches of project finance and infrastructure credit arrangements, opening up to
cover for financing provided to private special purpose vehicles. Subject to certain terms and conditions, this product covers failure by a borrower to pay a commercial lender for any reason, commercial or political, and is available for tenors up to 15 years. Various other providers are also expanding portfolio products, covering multiple investments (by investors as well as funds) both in a single country as well as across multiple countries. A key sticking point remains that pricing for such deals is often on the basis of first-to-default structures, whereas clients are often seeking something closer to a (lowest risk) last-to-default price. Finally, there is discussion once again within the Lloyd’s market concerning the regulations relating to trade that constrain the PRI business. Traditional PRI is linked to trade, with the investment insured typically entailing the import of capital goods. This is one reason that national ECAs have such prominence in the market. Given this history, transactions that have no linkage to trade and are used to improve the rating of a capital market transaction, such as cover for non-honoring of financial obligations, are typically not eligible for Lloyd’s PRI support. These developments are summarized in table 2.3 below.

the PolItIcal RIsk InsuRance IndustRy | 36
No upswing in claims…yet?
Political risk claims paid by Berne Union members totaled $125 million in 2012, far below the highs seen in 2010 as a result of the global financial crisis and considerably lower than the $179 million reported for 2011. While in 2011 about half of the claims ($91 million) were for the risk of political violence, mainly due to turmoil in the MENA region, in 2012 political violence claims dropped to $43 million—about 34 percent of total claims (figure 2.6). This suggests that while the events that continue to unfold in the MENA region are distressing and serious, the majority of the devastation is not being felt, or perhaps not yet being felt, in the form of losses to insurers. Such a sentiment was shared by insurers at the MIGA roundtable, though with the reservation that there may be a “longer tail” on such claims. The subsequent resurgence of instability in Egypt, and concerns about contractual relations with any new regimes, add credence to this caution. Overall, while there are no data available for claims and recoveries in the Lloyd’s market, the impression from the roundtable event was that the claims experience over the past couple of years has mirrored that of the Berne Union.
In terms of geographical distribution of claims, most were paid out for investments in Libya (a total of $27 million, or just under 22 percent of 2012 claims), with Vietnam, Brazil, Myanmar, and the Netherlands rounding out the top five. In 2012, the majority of claims were in fact for unspecified covers. Claims of $64 million have so far been reported for the first half of 2013, suggesting that claims levels may match the pace of last year. Also mirroring 2012, these claims are mostly for political violence and unspecified covers ($29.3 million, or 46 percent, in each case) with a smaller amount ($5 million or 8 percent of the total) registered for expropriation. The big potential claims story of the past couple of years has been the trade-related payment arrears for petroleum imports for a Nigerian public entity. A plan to resolve this has now been put into effect, however, and is understood to be working.
Recoveries increased to $107 million in 2012 from $25 million in 2011, an increase of 324 percent (figure 2.7). This was partially driven by recoveries on expro-priation claims, which increased by a factor of 10 over the year (rising from $5 million in 2011 to $51
Figure 2.6 Investment claims paid by Berne
Union members
$ million
Source: Berne Union Secretariat and World Bank
Unspecified Transfer restrictionPolitical violenceExpropriationBreach of contract
50
150
250
350
05 06 07 08 09 10 11 12 13 h1
100
200
300
0
million in 2012), though recoveries of unspecified covers also increased substantially, tripling to $54 million in 2012. Almost half of the recoveries in 2012 ($50 million) related to earlier investment claims in Venezuela, with the United Arab Emirates, Kazakhstan, Ukraine, and Mexico accounting for the rest of the top five.
The available claims and recoveries data suggest that, even though PRI issuance has expanded over the last few years, there has been no discernible uptick in claims. Even market turbulence post-2008, rising resource nationalism, and political turmoil in the MENA region do not yet appear to have brought a significant increase in claims events or recoveries. Additional claims, which might be expected from a substantially expanded market, have not arrived yet.

37 | the PolItIcal RIsk InsuRance IndustRy
Figure 2.8 Tools/mechanisms used to
mitigate political risk when investing in developing countries
percent
Source: MIGA-EIU Political Risk Survey 2013
Invested gradually while developing familiarity with
the local environment
Use of joint venture or alliance with
local company
Political/economic risk analysis
Engagement with government
in host country
Engagement with local communities
Scenario planning
Develop close relationships with
political leaders
Use of third-party consultants
Engagement with non-governmental
organizations
Operational hedging (e.g., setting up
multiple plants to spread risk)
Political risk insurance
Credit default swaps
Provide support to a well-connected
political figure
We don’t use any tools or products
to mitigate political risk
Don’t know
Other
46
54
40
44
44
37
26
25
16
12
6
4
2
15
1
25A complementary product?
To add one final dimension, looking at the sector from a corporate perspective, the choice of risk-miti-gation tools again does not seem to have changed radically from recent years, with the proportion of investors interested in PRI only changing marginally. Notwithstanding the increased issuance over the last few years, according to MIGA’s annual survey, only 15 percent of respondents identify it as their key strategy, compared to market-testing smaller investments (54 percent), joint ventures (46 percent), risk analysis (44 percent), or engagement with the local government (between 40 and 44 percent, depending on the level of government). This echoes the share of issuance of PRI as a pro-portion of FDI into developing economies (14.2
Figure 2.7 Recoveries by
Berne Union members
$ million
Source: Berne Union Secretariat and World Bank
25
50
75
100
125
0
150
05 06 07 08 09 10 11 12 13 h1Unspecified Transfer restrictionPolitical violenceExpropriationBreach of contract
percent), but comes nowhere close to similar share numbers for the early 1980s. It appears, moreover, that PRI represents a complement to other risk-miti-gation mechanisms for investors, rather than as a primary risk mitigant (see figure 2.8). Survey partic-ipants also suggested that PRI was most effective in relation to political violence and expropriation risks, and less so in cases of breach of contract and adverse regulatory changes.

the PolItIcal RIsk InsuRance IndustRy | 38
In the current market environment, economic concerns appear to dominate over political ones for investors into developing economies. However, the two sets of issues remain closely linked, as investors identify breach of contract and regulatory risk most closely with economic deterioration. This is a perception borne of experience, as can be seen from the relatively higher costs incurred by such political risks according to the survey. Moreover, it is an intuition supported by the statistical analysis described in the final chapter of this publication. Once again, this appears to be the key area where risks now lie. If the PRI industry is to continue its expansion, this could also represent opportunity.
Ever upwards?
In conclusion, the high growth of the PRI sector, both public and private, appears resistant even to lulls in FDI growth. The market continues to be dynamic and, while premiums remain somewhat soft, this is largely because of the internal market supply considerations as existing entrants expand and new entrants rush to meet demand in novel, flexible ways. Issuance levels seem to be expanding ever further, while claims remain stable and recoveries are good, despite a few significant scares and possibly more inexperienced players. These remain heady times still for the PRI sector. The question remains: how long can it last?

CHAPTER THREE
40 39
Breach of Contract

40 39
Breach of contract and regulatory concerns remain the most important political risks for foreign investors according to the MIGA-EIU Political Risk Survey 2013.
This chapter focuses on the risk and causes of breach of contract. It combines for the first time in a statistical analysis both deal-specific factors (contract design, manner of award,
sector) and country-specific factors (for example, economic and political considerations, regime type) that affect this risk.
This marks a departure from traditional deal-specific and country-specific analysis and sets a benchmark for a more comprehensive understanding of breach of contract triggers for
both insurers and investors.
Assessed together, both deal and country-specific factors are found to be important determinants of contract breach, some of them less critical than traditionally regarded.
The importance of an “obsolescing bargain” in contractual agreements is confirmed. All other things being equal, public contractual agreements will face an increasing risk of
breach in their early years, leveling out over the middle (8-12 years) period before rising again (but more slowly) after that. In assessing contract vulnerability, age should therefore remain a consideration.
Sector, private ownership stakes, and the presence of international financial institutions (IFIs) in the deal are significant factors influencing breach of contract risk.
Breach of contract risk is significantly correlated with downturns (such as economic cycles and the terms of trade during the contractual period), even when controlling for contract
design, sector, and other variables. This result backs up the views of investors, who place breach of contract among the most important risks.
Breach of contract risk appears to be higher in middle-income countries than in low-income countries.
Investors are likely to face higher breach of contract risk in public utilities than in other sectors.
While there is an overlap in the determinants of expropriation and breach of contract, deal-specific factors play an independently important role in breach of contract risk.

bReach of contRact | 42 41 | bReach of contRact
Box 3.1 What is meant by breach of contract?
This term is interpreted in slightly different ways across providers. For MIGA, breach of contract cover protects against losses arising from a government (including, in certain cases, state-owned
enterprises) breach or repudiation of a contract with an investor, but requires that the investor invoke the dispute-resolution mechanism (for example, an arbitration) set out in the underlying contract. Coverage is also extended to cases where, after a specified period of time, the investor has been unable to obtain an award due to the government’s interference with the dispute-resolution mechanism (denial of recourse), or has obtained an award but the investor has not received payment under the award (non-payment of an award).
For other providers, particularly in the private market, some elements of this type of risk are captured by contract frustration cover, which is typically offered separately from cover against failure to honor an arbitral award.
In the analysis that follows, project data samples are broad and breach events include instances of contract cancellation (with termination of operation or construction following revocation of the license or repudiation of the contract, or with removal of management from project enterprises), as well as cases where the government or the operator has either requested contract termination or they are in international arbitration.
Investor concerns and trends in disputes
This chapter offers an empirical analysis of the causes of breach of contract by a public counterparty. Employing a combination of databases, the analysis looks at both deal and country-specific triggers of breach. As such, it marks a departure from most of the existing literature, which until now has treated these approaches separately, and provides a new framework to understand this key political risk. The chapter outlines the most important factors at each level and draws a stronger distinction between the factors that affect expropriatory versus regulatory and breach actions.
Once again, in 2013, breach of contract and regulatory issues remain the most important political risk concerns for investors into developing economies, according to the annual MIGA-EIU Political Risk Survey. Forty-five percent of respondents named breach of contract and 58 percent named adverse regulatory changes as the most important political risks they face in the next three years.
This is the fourth consecutive year that this survey has identified these as the top political risks facing investors in developing economies. Moreover, the survey again identified these reasons as the top causes of actual losses related to political risk over the past three years. Forty percent of the survey respondents mentioned that they experienced financial losses through adverse regulatory changes, and 34 percent through breach of contract over the past three years.
Since the early 1980s, there has been a shift in the roles of the public and private sectors in the provision of infrastructure (electricity, water and sanitation, telecommunications, roads, railroads, ports, and airports), first resulting from the wave of privatizations seen in that decade, and subsequently changing to reflect the various forms of public-private collaborations that emerged in the following decade. Such collaborations, which include public-private partnerships, public finance initiatives, and others, came to the fore as they facilitated substantial public participation while allowing for risk-sharing between the public and private sectors and relieving fiscal balances.

bReach of contRact | 42 41 | bReach of contRact
In the power sector, these types of projects have included independent power producers using various contract structures (build-operate-transfer, build-own-operate, etc.), but with core similarities, generally including, for example, a government or public off-taker. In other public services such as transport and water and sewage, private participation has included construction and operation of roads and/or other facilities. As with power projects, the key concern for the private investors involved in such projects has been the payment reliability of the public counterpart. Overall, commitments for private participation in infrastructure (PPI) totaled $182 billion in 2012 (figure 3.2).
While the majority of these projects have involved advanced-economy firms and developing-economy public entities, there is an increasingly important “South-South” investment trend. Chinese and Brazilian companies, notably, are increasingly present in infrastructure projects across the developing world.
Alongside growth in public-private collaborations in infrastructure, investments in natural resources have also kept pace, generally involving some concession or other similar contractual relationship with governments. In 2012, 9 percent of foreign direct investment was into projects relating to mining, quarrying, and petroleum. Booming commodity and oil prices have been a boon to economies such as Angola, Gabon, and Zambia (to name but three), with investors keen to exploit the potential of developing-market reserves. The prominence of the BRIC (Brazil, Russia, India, China) countries, especially China, has driven this higher. The role of the host government has therefore evolved alongside that of the investor, with greater awareness on the part of governments of the importance of participation, sharing of upstream and downstream benefits, and “balanced” contracts—as well as of the role to be played by regulation. In natural resources, transparency too has increasingly become a theme.
Figure 3.1 Types of political risk of most concern to investors in
developing economiespercent
Source: MIGA-EIU Political Risk Survey 2013
58
45
43
33
31
24
13
7
56
45
37
30
27
19
11
6next 3 yearsnext 12 months
Adverse regulatorychanges
Breach of contract
T&C restrictions
Civil disturbance
NHFO
Expropriation
Terrorism
War

bReach of contRact | 44 43 | bReach of contRact
It is not surprising over this long time period that investors, with more at stake in contractual arrangements directly or indirectly involving sovereigns, have become more interested in understanding political risk, especially its impact upon contractual or regulatory matters. With government in some cases subcontracting its traditional functions to private players and in others explicitly accepting private participation in project companies, it is also not surprising that political risk concerns might begin to shift from pure or even “creeping” expropriation to contractual and regulatory risk. Once again, the facts back up the story, with a reduction in outright expropriations from the 1990s onwards, falling from their peak in the previous two decades (see WIPR 2011 for a fuller discussion of this).
Just as expropriations have declined overall (notwithstanding some dramat ic recent occurrences), there is evidence of an increase in the incidence of breach of contract events. The most striking evidence has been the steady rise in international arbitration during the past 20 years with the current climate marking a spike in new cases, sparked by the prolonged global economic crisis (figure 3.3). While this increase is partially driven by greater levels of foreign direct investment, this phenomenon is also driven by the fact that more investment treaties are binding on investor-state relationships and that investor-state contracts now tend to specify dispute resolution procedures. At the London Court of International Arbitration, filings of
Figure 3.2 Volume of private investment in
infrastructure in low and middle-income countries
$ billions (adjusted by U.S. CPI)
Source: World Bank and PPIAF, PPI Project Database
93
94
95
90
91
92
96
97
98
99
00
01
02
03
04
05
06
07
08
09
10 11 12
0
50
100
150
200
0
100
50
150
250
350
450
200
300
400
Water and sewageTransport TelecommunicationsEnergyNumber of projects (right axis)
Figure 3.3 Number of investor-state
investment disputes, 1990-2012
Source: UNCTAD, World Investment Report 2013
* Non-ICSID cases do not include data from all of
the arbitral bodies
0
10
20
30
40
50
60
0
100
200
300
400
500
600
93
94
95
91
92
90
96
97
98
99
00
01
02
03
04
05
06
07
08
09
10 11 12
Non-ICSID*ICSID All cases cumulative (right axis)
0
10
20
30
40
50
60
0
100
200
300
400
500
600
93
94
95
91
92
90
96
97
98
99
00
01
02
03
04
05
06
07
08
09
10 11 12
Non-ICSID*ICSID All cases cumulative (right axis)

bReach of contRact | 44 43 | bReach of contRact
new cases for breach of contract increased by 55 percent between 2007 and 2008, and again by another 14 percent in 2009, to 243 cases. Statistics from the Paris-based International Chamber of Commerce (ICC) and the Swiss Chambers’ Court of Arbitration and Mediation (SCCAM) tell the same story. ICC’s new cases involving breach of contract increased 11 percent in 2008 and a further 23 percent in 2009, to 817 new claims. New SCCAM cases rose 15 percent in 2008, before leaping 53 percent in 2009, to 104 requests for arbitration (the majority of which involved non-Swiss parties). The Dubai International Arbitration Centre reported a doubling of cases in 2009 compared with 2008, as the economic crisis finally caught up with the Middle East. Similar trends have also been observed in Asia. Investor concerns about breach of contract appear to be grounded in hard experience.
A more comprehensive analysis26
A review of the research into breach of contract risk indicates two distinct schools:
r A first set of investigations looks at deal-specific issues relating to the contracts themselves.27 Such considerations might be whether the contract was awarded on a bid or a no-bid basis, the contract design, the level of public ownership in the project, participation of international financial institutions (IFIs), or the sector-specific risks associated with the deal. Finally, a separate and slightly distinct line of analysis looks at deal-specific considerations more in terms of what has been termed in the literature “obsolescing bargain.” As the contract ages, the investor faces a larger risk of being forced to change contractual terms as the original bargain becomes obsolete. In essence, this means that the “state of the world” will change, but the contract stays the same, increasing its vulnerability over time.
r A second approach to understanding breach of contract has been to look at country-specific factors.28 Here political and economic considerations seem to dominate. Politically, ideology, regime change, and quality of governance have an impact upon a government’s reliability as a contractual counterpart. From an economic perspective, the wealth of the country and the role played by various economic shocks (positive as well as negative) are
at the forefront of analysis. Under this approach, the framework for understanding contractual, and regulatory risk generally, closely resembles approaches to understanding pure and “creeping” expropriation risk. The implication may be that the form of government intervention has changed, but the underlying motivations of government and its incentive structures remain broadly the same for both kinds of risk.
There has been little overlap in applying these two approaches to understanding breach of contract risk. In part, this has been a function of the nature of the information available. For pure contract-level analysis, the lack of large-scale contract data and the hetero-geneity of the contracts themselves has perhaps shaped an approach that has generally been more qualitative and has entailed looking at specific kinds of contracts and their consequences. For these reasons, aggregation of data was considered prohibitively dif-ficult and it was not altogether clear what it could yield.
Conversely, for country-level data, the economic and political information available lent itself precisely to “large-n” quantitative analysis, often evolving quite naturally from earlier expropriation risk models. Macroeconomic variables were easily available and widely accepted measures of regime type, ideology, and governance could be applied to the problem. As both sets of analysis ultimately relate to the same risk, however, viewing these alongside each other and merging them, to the extent possible, to get a sense of relative and absolute importance permits a clearer overall picture of the determinants of this risk.
In order to look at contract and country-level cases together, contractual dispute information from several datasets has been gathered to form a universe of dispute cases. Two main datasets are merged to establish the baseline sample. The core dataset is the World Bank’s Private Participation in Infrastructure Database,29 which has details on contractual arrangements for 5,302 public-private infrastructure projects from 1984 to 2011. This is merged with data from the UNCTAD Database of Treaty-based Investor-State Dispute Settlement Cases30 adding an additional 394 observations covering disputed cases from 1987-2010. This rich set of project-level data is then combined with cross-country panel data that contains various macroeconomic variables and country-level political and institutional indicators from various sources.
bReach of contRact | 46 45 | bReach of contRact
What we do and what we expect to see
The approach taken is to identify the most important triggers so that investors going into a country would be in a better place to know what risks would be most relevant for them. To this end, the basic potential relationships have been identified and incorporated into a benchmark regression that includes both project-level and country-level concerns.
The statistical approach taken is called “hazard analysis,” a form of analysis that uses as its dependent variable the likelihood of contract dispute in the next period (given that the contract has operated without dispute up to the present) as it is affected probabilistically by each of the explanatory variables. 31 Contract-level variables in the estimation of the “hazard function” include age, procurement type, share of private investment, involvement of international finance institutions, and sector controls. Country-level factors include income level, changes in income, changes in terms of trade, previous year input costs, previous year windfall prices, and region controls.
Expectations about the nature of the relationship between these variables and the probability of a breach event are clearer in some cases than in others:
r More breach events are expected among projects in low-income countries, as these countries might face issues of both ability and willingness in their reliability as contractual counterparts. Capacity to pay, greater vulnerability to shocks, as well as fragility and governance issues in the lower-income bracket, might be expected to be the key drivers of breach.
r Breach events are expected to be more common among projects in countries with high-income inequality. Societies where the “haves” are significantly outnumbered by the “have-nots” may be more subject to social tensions, which could create pressures on the state to extract more value by renegotiating contracts across the contract life-cycle.
r Competitively bid projects are expected to be less likely to suffer breach of contract, as competition should result in lower prices—or a higher income share—to the public counterparts, reducing the attractiveness of breach of contract.
r International financial institution (IFI) involvement, by raising the reputational costs of breach, should be associated with lower probability of breach of contract.
r A high share of private involvement in the project is likely to be associated with higher probability of breach of contract events, as the intuition generally is that a government stake in a project (that is, a claim to earnings in the project enterprise, or “skin in the game”) incentivizes the public partner to honor the contractual terms.
Some early findings
Before undertaking the statistical analysis, the correlation between the observed proportion of contracts in dispute and host country income levels is examined (see figure 3.4). A provocative takeaway is that, contrary to prior expectations, as income levels in the project country rise, up to the upper middle-income level, the incidence of contract breach seems to rise.
To examine whether this result is a reflection of the dataset itself, we examine the characteristics of the dataset more closely. Firstly, in PPI data collection, there is an explicit, concerted effort to obtain data on all developing countries individually, so that no country remains uncovered. Secondly, while PPI data collection depends on publicly available information by country, which may introduce underrepresentation of cases in countries that have a less-developed media sector and limited public outreach or transparency, typically projects with disputes are reported upon more prominently than others in a constrained information environment. As a result, any net underrepresentation is expected to be limited—and the dataset is expected to be broadly representative of the nature of investor-state infrastructure investment relations.
This correlation therefore implies that the willingness, rather than ability, of the public counterparty must be the driving factor, with middle-income governments being more demanding, or having more resources and opportunities to enforce changes or make demands on existing contractual arrangements.

bReach of contRact | 46 45 | bReach of contRact
Interestingly, expectations about the effect of income inequality are not similarly supported by the analysis. Instead, there appears to be no statistically significant relationship between income inequality, measured by the Gini coefficient, and the probability of a contract breach. The richness of the dataset adds power even to this non-parametric observation, and is worth examining more closely, beyond the terms of this research.
Results of the statistical analysis are shown in table 3.2 at the end of this chapter. Right from the start and across a number of specifications, it is clear that both project and country-level explanatory variables are significant. In both cases, when controlling for the effects of that level of analysis, the other level yields significant variables. It is clear that important understanding would be lost if project and country determinants were looked at in isolation. Applying a purely macro-variable approach evolving out of traditional expropriation models would be inadequate.
Contract-level issues
The evidence appears to support the obsolescing bargain hypothesis. The “hazard curve” is shown in figure 3.5 below. This curve describes the estimated likelihood of a breach of contract event given that no such event has occurred to the current period. In this case, it is sloped upwards, meaning that the risk of contract failure exponentially increases as the project matures. As discussed above, the “state of the game” changes as economic and political cycles or shocks erode the viability of the original contract, making it more vulnerable to breach. Figure 3.5 also shows that the rate of this erosion increases substantially in the first few years, flattening out over the middle years of a generic contract (approximately in year eight) before rising again in the later years. As will be seen below, the probability of breach differs across sectors and according to different conditions.
Figure 3.5 Probability of contract breach,
by contract maturity
0
0.1
0.2
0.3
0 10 20 30
Haz
ard
rat
e
Duration in years
Figure 3.4 Proportion of disputed contracts
in sample, by income level
Note: Avg income per capita is calculated for all available years between 1984-2011
0
0.1
0.2
0.3
0.4
0.5
0 10000 20000 30000 40000
Avg income per capita−PPP $
Sh
are
of
dis
pu
tes

bReach of contRact | 48 47 | bReach of contRact
However, for investors assessing the risk of their contractual agreements, further analysis of this basic relationship might offer a better sense of where and when they are at risk.
Figure 3.6 looks at the relationship between own-ership-sharing and contract success and shows the “survival curve” for contracts. This shows the prob-ability that a contract remains unaffected by a breach event (that is, “survives”) in each time period. This is calculated by dividing the number of contracts sur-viving in a period (the number of contracts in force at the start of the period—those surviving to the current time—minus those that suffer a breach event during the period) divided by the number of contracts in force at the start of the period.32 For each value of the explanatory variable, the higher the curve, the greater the overall chances of contract survival. In this case, lower levels of private own-ership are associated with higher survival curves,
consistent with the intuition explained above. Not only is there a positive relationship between contract success and government participation, using dif-ferent specifications, it seems to become more pro-nounced the larger the government share.
Figure 3.6 Survival estimates, by share
of private ownership
Figure 3.7 Survival estimates,
IFI involvement
0 10 20 30
IFI not involvedIFI involved
0
0.25
0.50
0.75
1
Su
rviv
al r
ate
Duration
Equally, IFI participation in the deal, which in this analysis is defined as any participation by an IFI in the project (including credit provision, equity participation, or project guarantees, as in the case of MIGA) is likely to enhance the chances of contract success, adding to the durability across the life-cycle of the deal (figure 3.7).
From a sectoral viewpoint, energy-sector deals (such as power purchase agreements and independent power production) prove to be more at risk of contract failure than projects outside of the sector (figure 3.8). Introducing variables to measure sectoral success, only in this sector is the
0 10 20 30
Private share less than 50%Private share between 50% and 80%
Private share less than 90%Private share more than 90%
0
0.25
0.50
0.75
1
Su
rviv
al r
ate
Duration

bReach of contRact | 48 47 | bReach of contRact
Figure 3.8 Survival estimates,
energy sector versus non-energy sector projects
0
0.25
0.50
0.75
1
0 10 20 30
Energy sectorNot energy sector
Su
rviv
al r
ate
Duration
negative effect consistently significant. In some respects, this result is also notable for what is not there: there appears to be no significant, negative risk of increased breach events for oil, gas, and mining sector projects. Resource nationalism may
once again be on the rise, but for this sample at least, there appears to be no additional incremental risk in the sector. This may imply that this recent phenomenon is not fully captured in this series.
In the current specifications, there is no consistent positive or negative relationship between likelihood of contract success and whether a project was competitively bid. As already mentioned, the outcome one might generally expect is that such projects would be more robust over the life cycle. This analysis does not offer any support for or against such a proposition, which is most likely an artifact of the limited available data, but this question is worthy of further study.
Country-level issues
Looked at together with the contract-level explanatory variables, a number of core variables remain significant in determining contract durability. These include both economic and political variables. Also notable is the different impact that non-structural shocks or changes can have depending on the structural backdrop, espe-cially the effects of positive or negative terms-of-trade and commodity shocks.
Backing up the intuition from figure 3.4, the rela-tionship between income per capita and contract risk is not linear. Instead, the most statistically significant specifications suggest that the strongest relationship between income per capita and contract durability is likely to be an inverse U-shape, with risk actually rising as income levels increase and then falling away again at higher income levels. Once again, this unexpected rela-tionship merits further examination and is useful knowledge for investors as they enter into contract arrangements in an unfamiliar country.
Alongside income, GDP growth is another variable that the analysis finds to be consistently related to contract success. Once again the intuition here is straight-forward, with contracts under more stress when the public counterparty is faced with slow growth and is looking for additional sources of revenue. The rela-tionship is most heightened during economic crises, as large reductions in GDP put the greatest pressure on government balances. Even controlling for com-modity shocks, basic wealth, and institutional structure, the relationship holds and remains robust.
Both the level of democracy and the ideology of the government have statistically significant impacts on contract durability. WIPR 2011 found that the type of political regime is a major driver of expropriation risk, with democratic regimes being more investor friendly, likely due to institutional characteristics such as rule of law, checks and balances of power, multiple players with veto power, and the importance of reputation to policymakers. Another study commissioned by MIGA (and cited in WIPR 2012) similarly found a higher risk of expropriatory behavior in countries under the control of political parties conventionally described as “left wing.” The analysis here supports an extension of these prop-ositions beyond expropriation, and finds that even con-trolling for contract-level and other variables, such rela-tionships hold up for pure contract risk as well.

bReach of contRact | 50 49 | bReach of contRact
A terms-of-trade shock, such as an unexpected increase in fuel price volatility, might create a higher risk of project cost overrun–increasing the contract risk, especially for fuel-importing countries. Conversely, a commodity price boom could increase profit margins in resource-based sectors, putting pressure on existing contracts and raising the risk of breach of contract. Under different specifications, the input shock is indeed positively related with the greater risk of contract failure. In the original specifi-cation of the model used here the windfall story does not hold up as a significant relationship. Most notable, though, are the results when the change in the terms-of-trade variable is interacted with institu-tional considerations. The positive commodity shock becomes statistically significant in non-democratic and in conflict-affected and fragile countries with an increase in breach of contract risk in those circum-stances. Therefore closer examination suggests that the impact of a commodity boom is very much context-specific, with investors needing to be partic-ularly conscious of the structural backdrop to determine the level of risk at contract signing.
This last point holds across the analysis more gen-erally, with a deeper use of this approach potentially reaping other results across different structures and contexts. Ultimately, this approach can bring a better understanding of the risks investors might face at a country and project level, the extent of those risks, and—by implication—how these might be managed.
Table 3.1 Where is the risk?
the most consistent determinants of contract breach
identified by this analysis
Contract-level risksProject sector, lower share of public ownership, absence of IFI
Country-level risksEconomic downturns, country dependence on primary commodities, quality of political institutions
Other forms of risksImportance of age of contract
Figure 3.9 In which sector(s) have you
experienced a breach of contract event?
percent
Source: MIGA-EIU Political Risk Survey 2013*None of the remaining categories are above 5 percent. The most prominent “other” categories are financial services, real estate/construction, and IT/technology
Oil, gas, and miningElectricity and powerTelecommunications
Transportation
24
19
16
12
6
34
We have not experienceda breach of contract event
Water and sanitation
Other*
8
Corporate-level approaches and perception of these risks
Risk Perception and Experience
Against this backdrop, it is interesting to revisit some of the questions on the MIGA-EIU Political Risk Survey 2013 that relate to breach of contract and regulatory risks. As discussed above, more survey respondents had experienced losses through these two events than any of the other political risk events. Across a sample of 203 respondents, those that had experienced a breach or renegotiation had been operating for an average of nine years before experiencing the breach event. Moreover, the spread of the data in this answer underlines an increasing attrition rate—that of an obsolescing bargain—beyond the early contract years. Unlike the statistical analysis, the surveys suggest that projects in the extractive industries and the power sector experience the highest likelihood of breach of contract (figure 3.9).

bReach of contRact | 50 49 | bReach of contRact
Box 3.2 Potential triggers of contract breach:
evidence from MIGA pre-claims
Since the establishment of MIGA just over 25 years ago, over 100 guaranteed projects have experienced some difficulty that had potential to result in a loss and claim by the investor (these are referred to as “pre-claim” events). Of the recorded total, 32 have occurred within the last seven years. Focusing on the more recent cases, the largest share of disputed projects was in the services and manufacturing sector, with transportation/infrastructure, telecommunications, and financial services also featuring. The majority of the events relate to projects in sub-Saharan and Sahel African countries.
Narrowing further to recent pre-claims events involving potential breach of contract, these are dominated by government services, energy (specifically power), and infrastructure projects, consistent with the results of the statistical model. Interestingly, these were more likely to relate to projects in Latin America than the total population of events, though sub-Saharan Africa rated second in number of events. A deeper examination of the events suggests that three major factors are associated with reduced contract viability:
r Financing difficulties
r Inconsistent public policy
r Tariff disputes
These factors are broadly in line with the empirical findings presented in this chapter. Financing difficulties and the attendant contracting challenges often arise in the context of shrinking GDP, which again reflects our findings that GDP growth is related to contract success. Weaker institutions and poor policy coordination are correlated with non-democratic structures, while our findings show that contracts have a greater likelihood of being sustained in countries characterized by democratic regimes. Tariff adjustments appear on the list as a result of the high number of power-related breach of contract pre-claims events. This appears to be the most contentious contracting issue in power projects, despite the flexibility for price changes being clearly embedded in many contracts. It is a useful illustration of the obsolescing bargain principle, as in this sector volatility in international fuel prices and inflation levels can quickly move the agreed contract out of line with financially and politically acceptable levels.

bReach of contRact | 52 51 | bReach of contRact
Figure 3.10 which of the following are the five most important risk factors for breach of contract events?
percent
Source: MIGA-EIU Political Risk Survey 2013
Economic crisis
Political regime change in the destination country
Corruption/red tape
Sovereign default
Political instability/war
Non-discriminatory regulatory or policy change
(e.g., increase in tax rate, subsidy cut, deprival of license)
Change in input prices (e.g., fuel cost)
Lack of transparency incontract award process
Other contract-specific disputes(due to longer contract period,
fixed price contract, currency mismatch, etc.)
Sovereign credit rating downgrade
Contract for which government owns a large profit share
(e.g., contract with a state-owned enterprise)
Relation of host country to your firm’s country of origin
29
14
11
10
9
6
5
5
3
3
2
1
1
0
Change in end-product output prices (e.g., oil/gas/mineral price)
Poor business relationship with the host government in the past
Risk Mitigation
The risk mitigation strategies undertaken by investors in the face of these risks are also interesting to review in this context (figure 3.12). It is notable that for breach of contract risk, a “joint venture with local enterprises” is considered by 24 percent of respondents—more than for any other option—to be the most effective risk-mitigation tool. While the survey questions do not permit this level of clarity, the response could also encompass the public-private joint ventures that figure so strongly in the contract-level results. Other forms of engagement and rela-tionship are not considered as relevant, with only “risk analysis” coming close (21 percent) as a mechanism for alleviating risk. Notable for breach of contract, just as for the other political risks, political risk insurance (PRI) remains a somewhat niche product, with only 10 percent of respondents nomi-nating it as the most effective risk alleviator. A follow-up question on the impact of breach itself reinforces this impression, with contract renegotiation being suggested by a full 47 percent of respondents as the most effective response to a contractual dispute and only 21 percent suggesting arbitration and 13 percent selecting PRI (figure 3.11). The high costs of bringing disputes to arbitration and the lengthy process might also weigh in the responses.
Figure 3.11 Which of the following methods
for addressing breach of contract events do you consider to be the
most effective?
percent
Source: MIGA-EIU Political Risk Survey 2013
Contract renegotiationInternational arbitration
Local arbitrationPolitical risk insurance
47
21
19
13
Looking at the most important perceived triggers for breach of contract, the traditional macro factors dominate, with economic crisis—cited by 29 percent of respondents—being by far the most important factor (figure 3.10). Notable in this survey are the small roles considered to be played by contract-specific factors, government ownership stakes, and product output prices, all of which were significant and important in the MIGA model. The difference between this perception and the empirical evidence presented earlier could prove useful for further analysis.

bReach of contRact | 52 51 | bReach of contRact
Figure 3.12 what are the most effective tools/
mechanisms available to your firm for alleviating each of the
following risks?
percent
Source: MIGA-EIU Political Risk Survey 2013
T&C
AdvReg
NHFO
War
Expro
Terror CD
BoC
21810
16
15 6
24
2115
10
13
10
7
24
12
2610
16
17
7
3
3 3 85
21
41214
36
214
4
11
4
13
17
19
16
46
45
612
9
2012
13
2521
10
5
19
2111
1114
Engage with local public entitiesJoint venture with local enterprisesRisk analysis/monitorRelationship with key poliltical leadersPolitical risk insuranceRisk is not significant for my projectsNo existing tool can alleviate this risk
Other
10
16
10
221
38
4
Towards a better handle on breach of contract
In conclusion, this statistical analysis, useful in its combination of deal and country-specific factors, offers insight into the most significant correlates and triggers of contract breach. The results identify a number of key areas where investors (and insurers) should pay primary attention when becoming involved in an investment that features a contractual rela-tionship with a public, developing-economy coun-terparty. Findings suggest that, even controlling for other factors, risk of contract breach is higher in middle-income countries rather than lower-income countries. Project sector, private ownership stakes, and IFI presence in the deal are important micro-cor-relates of contract viability. On the macro side, risk of breach is statistically related to economic downturns, dependence on primary commodities, and quality of political institutions.
Results support the idea of the obsolescing bargain, suggesting that risk of breach of contract increases with years of contract life, before leveling (around the eighth to twelfth years of contract duration) and then rising again, albeit more slowly. An awareness of all of these relationships is a valuable starting point to help investors and insurers best mitigate and manage their risks. The results are consistent with investor views as reflected in the MIGA-EIU Political Risk Survey 2013 as well as with MIGA’s own empirical pre-claims expe-rience. Further study in this area will explore potential ranking of these different risk elements across industries and structures, which would point investors to the key influencing variables and interactions in particular projects.

bReach of contRact | 54 53 | bReach of contRact
Table 3.2 Statistical analysis results
(1) (2) (3) (4) (5) (6) (7) (8)
Variables Total Sample Excl. Government-Guaranteed Contracts
Micro Factors
IFI involved-0.234***
(0.0453)0.136
(0.1030)-0.0666
(0.1090)-0.0518
(0.1110)-0.558***(0.1870)
0.0422(0.1260)
-0.125(0.1140)
-0.0265(0.1140)
Priv.Share>50% 0.115*(0.0620)
Priv.Share>80% = x0.433***(0.0457)
0.523***(0.0410)
0.475***(0.0423)
0.481***(0.0432)
0.321***(0.0731)
0.494***(0.0496)
0.343***(0.0444)
0.474***(0.0447)
x * IFI involved -0.437***(0.1140)
-0.301**(0.1200)
-0.295**(0.1220)
0.193(0.2070)
-0.383***(0.1400)
-0.183(0.1260)
-0.352***(0.1260)
Competitive bidding-0.0997
(0.0622)
OGM sector 0.038 0.0319 -0.00218 0.035 -0.171 0.125* -0.150** 0.111*(0.0618) (0.0618) (0.0626) (0.0633) (0.1280) (0.0683) (0.0645) (0.0635)
Energy sector 0.235*** 0.235*** 0.190*** 0.211*** 0.173*** -0.0248 0.203*** 0.129***(0.0321) (0.0321) (0.0329) (0.0341) (0.0580) (0.0405) (0.0359) (0.0358)
Macro Factors
Democracy -0.561***(0.0466)
-0.575***(0.0466)
-0.502***(0.0533)
-0.551***(0.0543)
-0.134(0.0955)
-0.762***(0.0715)
-0.144**(0.0593)
-0.452***(0.0593)
Log Income pc in 2000 = y
4.136***(0.6140)
4.191***(0.6350)
2.761**(1.2100)
5.619***(0.8550)
4.806***(0.7270)
4.994***(0.6850)
y2 -0.263***(0.0365)
-0.265***(0.0378)
-0.178**(0.0726)
-0.356***(0.0510)
-0.314***(0.0430)
-0.321***(0.0405)
Change in real pc GDP growth-3.482***(0.3160)
-3.369***(0.3240)
-1.154*(0.6090)
-4.749***(0.4250)
-3.261***(0.3300)
-3.705***(0.3250)
Change in TOT -0.075(0.0509)
-0.069(0.0520)
-0.652***(0.1540)
0.212***(0.0656)
Right wing gov’t (last year)-0.393***
(0.0595)
Increase in input cost (avg)13.55***(0.5710)
Commodity windfall revenue (avg)3.601***(0.5710)
Increase in input cost (last year)0.843***
0.3000
Commodity windfall revenue (last year) -0.126(0.2130)

bReach of contRact | 54 53 | bReach of contRact
Table 3.2 (cont’d) Statistical analysis results
(1) (2) (3) (4) (5) (6) (7) (8)
Variables Total Sample Excl. Government-Guaranteed Contracts
Region Dummy
EAP-0.0895
(0.0626)-0.0826
(0.0626)-0.129
(0.0909)-0.145
(0.0931)0.161
(0.1790)-0.0247
(0.1270)-0.437***(0.0937)
-0.232**(0.0947)
ECA 0.0668(0.0682)
0.0702(0.0681)
0.376***(0.0946)
0.383***(0.0965)
0.489***(0.1810)
0.298**(0.1270)
0.347***(0.0957)
0.406***(0.0981)
LAC-0.195***(0.0613)
-0.185***(0.0614)
0.143(0.0885)
0.121(0.0908)
0.128(0.1780)
0.391***(0.1170)
0.289***(0.0900)
0.128(0.0953)
MENA-0.00765(0.1100)
0.007(0.1100)
-0.127(0.1310)
-0.208(0.1360)
-0.22(0.2200)
0.679***(0.2260)
-0.338**(0.1330)
-0.113(0.1350)
South Asia 0.554***(0.0664)
0.566***(0.0665)
0.432***(0.0842)
0.398***(0.0878)
0.735***(0.1560)
0.378***(0.1150)
-0.234***(0.0902)
0.138(0.0922)
Constant -4.135***(0.0937)
-4.102***(0.0855)
-20.34***(2.5450)
-20.68***(2.6330)
-14.19***(4.9680)
-28.40***(3.5390)
-25.17***(3.0380)
-24.46***(2.8610)
Observations 4,923 4,923 4,695 4,382 1,570 3,291 4,102 4,102
Ln(α)0.529***(0.0120)
0.530***(0.0120)
0.560***(0.0123)
0.575***(0.0128)
0.553***(0.0201)
0.951***(0.0142)
0.868***(0.0135)
0.736***(0.0130)
Standard errors in parentheses *** p<0.01, ** p<0.05, * p<0.1

WIPR 13 | 56 55 | WIPR 13
END NOTES
1 The MIGA-EIU Political Risk Survey 2013 contains the responses of 459 foreign investors with investments in developing economies. The region or origin and sector breakdown of those investors reflects the dis-tribution of FDI stock. The bulk of respondents were from the services sector (including financial services), followed by manufacturing and the primary sector.
2 Every year the World Bank revises its classification of the world’s economies based on estimates of gross national income per capita for the previous year. In the 2013 revision, Chile, Lithuania, the Russian Federation, and Uruguay were reclassified as high-income countries, while Hungary was reclassified as an upper-middle income country. The growth as-sumptions reported here reflect these changes.
3 fDi Intelligence. The fDi Report 2013: Global Greenfield Investment Trends.
4 FDI data for developing economies reported in this publication exclude Chile, Lithuania, the Russian Federation, and Uruguay, reclassified as high- income countries, and include Hungary, reclassified as an upper-middle income country, following the reclas-sifications specified in endnote 2, unless otherwise specified.
5 The ratio of FDI to GDP has fluctuated between 2.3% and 3.7% during that period. For individual countries, especially low-income economies, that figure may be higher.
6 FDI flows quadrupled between FY2012-13 Q4 (Jan-Mar 2013) over the FY2011-12 Q4 to $5.7 billion, according to Reserve Bank of India Monthly Bulletin, September 2013.
7 ECLAC. Foreign Direct Investment in Latin America and the Caribbean. May 2013.
8 UNCTAD. World Investment Report 2013. Chapter one. p. 5.
9 The IMF’s World Economic Outlook (April 2013) esti-mated a small increase in net FDI inflows in emerging economies to $507 billion in 2014 from $477 billion in 2013. The Institute of International Finance’s Capital Flows to Emerging Market Economies (June 2013) forecasted a small decline to $523 billion in 2014 compared with $541 billion in 2013 for 30 major emerging economies.
10 According to S&P Capital IQ, 202 members of Standard and Poor’s 500-stock index have $1 billion or more in cash. “Companies awash in cash, when will they spend it?” USA Today, May 30, 2013.
11 Ranks countries according to how political, econom-ic, and regulatory changes affect FDI. Based on a survey of 302 executives from 28 high-income and developing economies. Available online at http://www.atkearney.com/research-studies/foreign-direct-investment-confidence-index.
12 Ascertains investment intentions and provides in-sights into the medium-term prospects for FDI flows. Based on a survey of executives among the largest 5,000 non-financial multinational enterprises and professionals working in 245 national and subna-tional investment promotion agencies. Available online at http://unctad.org/en/PublicationsLibrary/webdiaeia2012d21_en.pdf.
13 Aon. Global Risk Management Survey 2013 (http://www.aon.com/2013GlobalRisk/2013-Global-Risk-Management-Survey-updated-05-01-2013.pdf ). Universe: 1,415 respondents.
14 Ernst &Young. Business risks facing mining and metals 2012 – 2013 (http://www.ey.com/GL/en/Industries/Mining---Metals/Business-risks-facing-mining-and-metals-2012---2013).
15 Available online at http://poole.ncsu.edu/vol2/erm/ee/i/weblogs/research-documents/NC-State-Protiviti-Survey-Top-Risks-2013.pdf. Universe: More than 200 business executives (primarily board members and C-suite).
WIPR 13 | 56 55 | WIPR 13
16 Available online at http://www.afponline.org/risksur-vey/
17 The political risks listed here are those typically covered by the political risk insurance industry (see chapter three). Universe: 547 respondents, compris-ing senior financial professionals from a range of organizations across North America.
18 UNCTAD. World Investment Report 2013. op. cit.19 EITI website (http://eiti.org/countries).20 Failed States Index 2013 (http://www.foreignpolicy.
com/articles/2013/06/24/2013_failed_states_interac-tive_map).
21 World Bank. Investing in Turbulent Times, Middle East and North Africa Economic Developments and Prospects. October 2013.
22 Berne Union figures presented throughout the chapter reflect those for total INV (investment insurance) per the Berne Union Secretariat, as of September 2013.
23 UNCTAD. World Investment Report 2013. p.110.24 Gallagher London. Credit and Political Risk – PRI
Report and Market Update. July 2013. Accessed at: http://www.ajginternational.com/media-and-in-sights/publications/2013/credit-and-political-risks-market-update-july-2013/
25 Swiss Re. World Insurance in 2012. Accessed at: http://media.swissre.com/documents/sigma3_2013_en.pdf
26 The analysis undertaken is presented in full in: Nose, M. 2013. Triggers of Contract Breach: Contract Design, Shocks or Institutions? (Working paper.)
27 Theoretical models of contracting tend to focus on optimal contracting designs, as in Tirole, J. (1999) “Incomplete Contracts: Where Do We Stand?” Econometrica. 67(4). pp. 741-781. Empirical studies include: Woodhouse, E. (2006) “The Obsolescing Bargain Redux? Foreign Investment in the Electric Power Sector in Developing Countries.” International Law and Politics, 38, pp. 121-220; and Vernon, R. (1971). Sovereignty at Bay. New York: Basic Books.
28 See, for example: Jensen, N. and Johnston, N. (2011) “Political Risk, Reputation and the Resource Curse.” Comparative Political Studies. 44(6). pp. 662-688; Frankel, J. (2012) “The Natural Resource Curse: A Survey of Diagnoses and Some Prescriptions,” in Chapter 2, “Commodity Price Volatility and Inclusive Growth in Low-Income Countries.” IMF; Besley, T. and Persson, T. (2009) “The Origins of State Capacity: Property Rights, Taxation, and Politics.” American Economic Review, 99(4). pp. 1218-1244; and Besley, T. and Persson, T. (2010) “State Capacity, Conflict, and Development.” Econometrica, 78(1). pp. 1-34.
29 This database is publicly available at: http://ppi.worldbank.org/explore/Report.aspx
30 This database is publicly available at: http://iiadb-cases.unctad.org/
31 In this analysis, the probability density function of contract duration is assumed to follow a Weibull distribution. This distribution has several attractive properties, and is widely used in survival analysis across multiple fields. For more information, see Cox, D.R. and Oakes, D. 1984. Analysis of Survival Data. London: Chapman and Hall.
32 Contracts that conclude are censored, meaning they are not taken into account in the analysis. The overall probability of a contract surviving to a given age is calculated by multiplying the successive probabilities estimated for each year up to that age (for example, the estimated probability of a contract surviving into year two is calculated by multiplying the probability of contract survival in year one by the probability of contract survival in year two given that there was no breach in year one).

57
Appendices

aPPendIces | 58
Appendix 1 FDI Inflows, 2004–2012
$ billion
2004 2005 2006 2007 2008 2009 2010 2011 2012e
World 713.6 1,027.3 1,521.5 2,041.1 1,829.3 1,209.6 1,499.6 1,751.8 1,417.3
Developed countries 518.2 738.5 1,168.4 1,573.7 1,280.9 826.3 967.4 1,108.4 813.7
Developing countries 195.4 288.8 353.1 467.3 548.4 383.3 532.2 643.4 603.6
Latin America and the Caribbean 59.3 66.6 63.4 100.2 121.5 71.2 110.9 145.0 150.3
Argentina 4.1 5.3 5.5 6.5 9.7 4.0 7.8 10.7 12.1
Brazil 18.2 15.5 19.4 44.6 50.7 31.5 53.3 71.5 76.1
Colombia 3.0 10.3 6.7 9.5 10.2 7.1 6.8 13.4 15.6
Costa Rica 0.8 0.9 1.5 1.9 2.1 1.3 1.5 2.2 2.6
Dominican Republic 0.9 1.1 1.5 2.3 2.7 1.7 2.1 2.2 3.9
Mexico 24.8 24.5 20.2 31.6 27.9 16.6 22.6 23.6 15.5
Nicaragua 0.3 0.2 0.3 0.4 0.6 0.4 0.5 1.0 0.8
Panama 1.0 1.1 2.9 2.0 2.5 1.1 2.2 3.2 3.4
Peru 1.6 2.6 3.5 5.5 6.9 6.4 8.5 8.2 12.2
Venezuela, R.B. de 1.5 2.7 0.2 2.5 1.3 (2.6) 1.9 3.9 2.2
East Asia and the Pacific 77.6 129.3 151.7 195.6 211.2 154.5 291.1 339.9 313.7
China 62.1 104.1 124.1 156.2 171.5 131.1 243.7 280.1 253.5
Indonesia 1.9 8.3 4.9 6.9 9.3 4.9 13.8 19.2 19.6
Malaysia 4.6 3.9 7.7 9.1 7.6 0.1 10.9 15.1 9.7
Philippines 0.7 1.7 2.7 3.2 1.4 2.7 1.6 1.8 2.8
Thailand 5.9 8.1 9.5 11.3 8.5 4.9 9.1 9.0 10.7
Vietnam 1.6 2.0 2.4 6.7 9.6 7.6 8.0 7.4 8.4
South Asia 7.8 11.2 26.2 32.7 50.9 39.5 31.2 40.4 27.4
Bangladesh 0.4 0.8 0.7 0.7 1.0 0.7 0.9 1.1 1.2
India 5.8 7.3 20.0 25.2 43.4 35.6 27.4 36.5 24.0
Pakistan 1.1 2.2 4.3 5.6 5.4 2.3 2.0 1.3 0.9
Sri Lanka 0.2 0.3 0.5 0.6 0.8 0.4 0.5 1.0 0.9
Europe and Central Asia 30.0 45.1 67.9 80.7 91.0 54.1 44.5 64.5 55.8
Azerbaijan 3.6 4.5 4.5 4.6 4.0 2.9 3.4 4.5 5.3 Belarus 0.2 0.3 0.4 1.8 2.2 1.9 1.4 4.0 1.5 Bulgaria 2.7 4.1 7.9 13.9 10.3 3.9 1.9 2.1 2.1 Georgia 0.5 0.5 1.2 1.9 1.6 0.7 0.9 1.1 0.8

59 | aPPendIces
Appendix 1 (cont’d) FDI Inflows, 2004–2012
$ billion
2004 2005 2006 2007 2008 2009 2010 2011 2012e
Kazakhstan 4.2 2.5 7.6 12.0 16.8 14.3 7.5 14.3 15.1
Romania 6.4 6.9 11.5 10.3 13.8 4.9 3.2 2.6 2.0
Serbia 1.0 2.1 5.0 3.4 3.0 1.9 1.3 2.7 0.4
Turkey 2.8 10.0 20.2 22.0 19.8 8.7 9.0 16.0 12.5
Turkmenistan 0.4 0.4 0.7 0.9 1.3 4.6 3.6 3.4 3.2
Ukraine 1.7 7.8 5.6 10.2 10.7 4.8 6.5 7.2 7.8
Uzbekistan 0.2 0.2 0.2 0.7 0.7 0.8 1.6 1.5 1.1
Middle East and North Africa 9.7 16.8 27.2 27.9 29.6 26.3 22.3 13.7 19.3
Algeria 0.9 1.2 1.8 1.8 2.7 3.1 2.3 2.7 1.6
Egypt, Arab Rep. 1.3 5.4 10.0 11.6 9.5 6.7 6.4 (0.5) 2.8
Iran, Islamic Rep. 2.9 3.1 1.6 2.0 1.9 3.0 3.6 4.2 4.9
Jordan 0.9 2.0 3.5 2.6 2.8 2.4 1.7 1.5 1.5
Lebanon 1.9 2.6 2.7 3.4 4.3 4.8 4.3 3.5 3.7
Morocco 0.8 1.7 2.5 2.8 2.5 2.0 1.2 2.5 2.8
Syrian Arab Republic 0.3 0.5 0.7 1.2 1.5 2.6 1.5 .. ..
Tunisia 0.6 0.7 3.2 1.5 2.6 1.5 1.3 0.4 1.6
Sub-Saharan Africa 11.0 19.9 16.7 30.3 44.3 37.7 32.2 40.0 37.0
Angola 1.4 (1.3) (0.0) (0.9) 1.7 2.2 (3.2) (3.0) (6.9)
Botswana 0.7 0.3 0.5 0.5 0.5 0.1 (0.0) 0.4 0.3
Chad 0.5 (0.1) (0.3) (0.3) 0.5 0.4 0.3 0.3 0.3
Congo, Dem. Rep. 0.4 0.2 0.2 1.8 1.7 (0.3) 2.7 1.6 2.9
Congo, Rep. (0.0) 0.8 1.5 2.6 2.5 1.9 2.2 3.1 2.8
Ghana 0.1 0.1 0.6 1.4 2.7 2.4 2.5 3.2 3.3
Liberia 0.1 0.1 0.1 0.1 0.3 0.1 0.5 1.3 1.4
Madagascar 0.1 0.1 0.3 0.8 1.2 1.1 0.8 0.8 0.9
Mozambique 0.2 0.1 0.2 0.4 0.6 0.9 1.3 2.8 5.2 Niger 0.0 0.0 0.0 0.1 0.3 0.6 0.8 1.1 0.8 Nigeria 1.9 5.0 4.9 6.0 8.2 8.6 6.0 8.8 7.1 Seychelles 0.0 0.1 0.1 0.0 0.0 0.0 0.0 0.1 0.0 South Africa 0.7 6.5 0.6 6.6 9.9 7.6 3.7 5.9 4.6 Sudan 1.5 3.3 4.1 4.2 6.7 5.6 6.1 2.6 2.5 Tanzania 0.2 0.9 0.4 0.6 1.4 1.0 1.8 1.2 1.7 Uganda 0.3 0.4 0.6 0.8 0.7 0.8 0.5 0.9 1.7 Zambia 0.4 0.4 0.6 1.3 0.9 0.7 1.7 1.1 1.1
Source: World Banke= estimate. Note: Figures in parentheses represent negative numbers

aPPendIces | 60
Appendix 2
MIGA-EIU Political Risk Survey 2013
The data provided herein are based on a survey conducted on behalf of MIGA by
the Economist Intelligence Unit (EIU). The survey, which was carried out in July
and August of 2013, contains the responses of 459 senior executives from multi-
national enterprises investing in developing countries. Quota sampling was used
to ensure that the industry and geographic composition of the survey sample approximates
the composition of actual FDI outflows to developing countries. Following a first round of
responses to the questionnaire, additional email campaigns targeting respondents in specific
industries or geographic locations were conducted until all demographic quotas were met. For
some questions, percentages add up to more than 100 percent because of multiple selections.
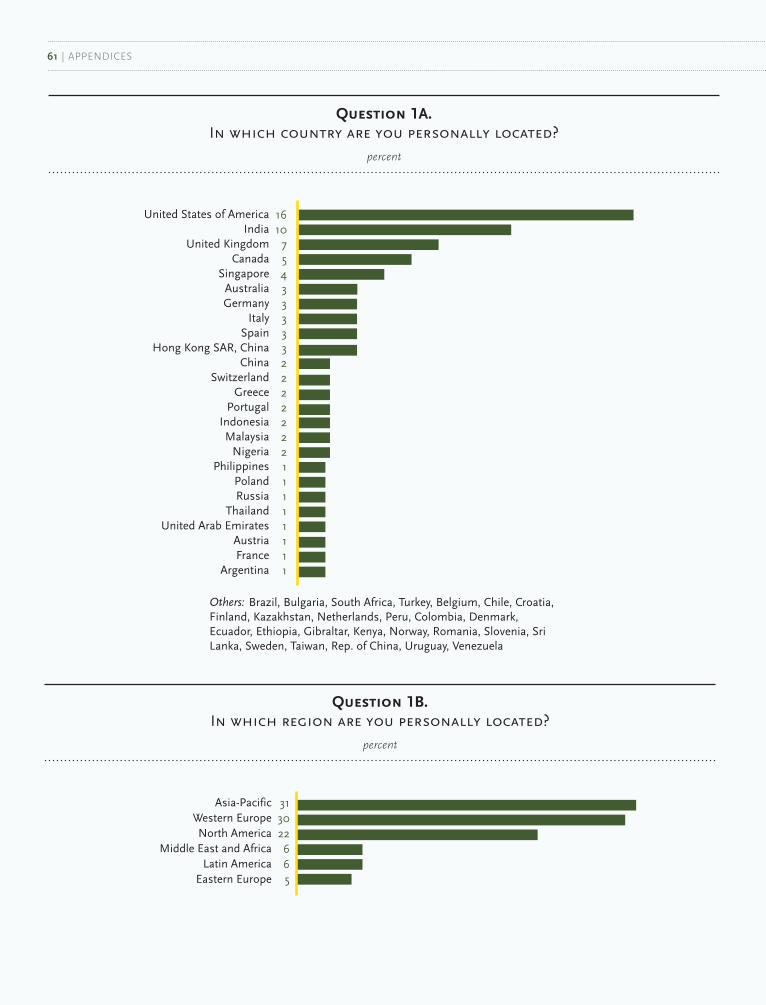
61 | aPPendIces
Asia-PacificWestern EuropeNorth America
Middle East and AfricaLatin America
Eastern Europe
313022665
United States of AmericaIndia
United KingdomCanada
SingaporeAustraliaGermany
ItalySpain
Hong Kong SAR, ChinaChina
SwitzerlandGreece
PortugalIndonesiaMalaysia
NigeriaPhilippines
PolandRussia
ThailandUnited Arab Emirates
AustriaFrance
Argentina
161075433333222222211111111
Others: Brazil, Bulgaria, South Africa, Turkey, Belgium, Chile, Croatia, Finland, Kazakhstan, Netherlands, Peru, Colombia, Denmark, Ecuador, Ethiopia, Gibraltar, Kenya, Norway, Romania, Slovenia, Sri Lanka, Sweden, Taiwan, Rep. of China, Uruguay, Venezuela
Question 1A. In which country are you personally located?
percent
Question 1B. In which region are you personally located?
percent

aPPendIces | 62
Question 1A. In which country are you personally located?
percent
Question 1B. In which region are you personally located?
percent
Financial sectorOther services
Business activitiesMining, quarrying, and petroleum
Utilities, transport, storage, and communicationsTrade
Food, beverages, and tobaccoOther manufacturing
Electrical and electronic equipmentElectricity, gas, and water
Health and social servicesEducation
Chemicals and chemical productsConstruction
Motor vehicles and other transport equipmentMetals and metal productsMachinery and equipment
Agriculture, hunting, forestry, and fishingHotels and restaurants
Textiles, clothing, and leatherRubber and plastic products
Publishing, printing, and reproduction of recorded mediaPublic administration and defense
Coke, petroleum products, and nuclear fuelNon-metallic mineral products
Community, social, and personal service activitiesWood and wood products
Precision instruments
2710107744333222222221111110000
ServicesFinance sectorManufacturing
PrimaryUtilities, transport,
storage, and communications
36272287
Question 2A. What is your primary industry?
percent
Question 2B. What is your primary (sector) industry?
percent

63 | aPPendIces
$500m or less
$500m to $1bn
$1bn to $5bn
$5bn to $10bn
$10bn or more
41
15
18
7
19
United States of America
United Kingdom
India
Canada
Australia
Italy
Germany
Singapore
Hong Kong, SAR China
Switzerland
Spain
Greece
Netherlands
Denmark
France
Malaysia
Portugal
Austria
China
Nigeria
Sweden
Belgium
Chile
Indonesia
Poland
26
7
7
6
3
3
3
3
2
2
2
2
2
2
2
2
2
1
1
1
1
1
1
1
1
Others: Russia, Thailand, Argentina, Croatia, Japan, Norway, Philippines, Turkey, United Arab Emirates, Bulgaria, Colombia, Ecuador, Ethiopia, Finland, Islamic Republic of Iran, Kazakhstan, Kenya, Peru, Sri Lanka, Ukraine, Venezuela, Albania, Bahrain, Belarus, Bolivia, British Virgin Islands, Brunei Darussalam, Cayman Islands, Dominican Republic, Isle of Man, Israel, Kiribati, Kuwait, Malta, New Zealand, Oman, Pakistan, Panama, Seychelles, Slovakia, Slovenia, Solomon Islands, South Africa, Uruguay
Question 3. What are your organization’s global annual revenues in US dollars?
percent
Question 4A. In which country is your company headquarters located?
percent
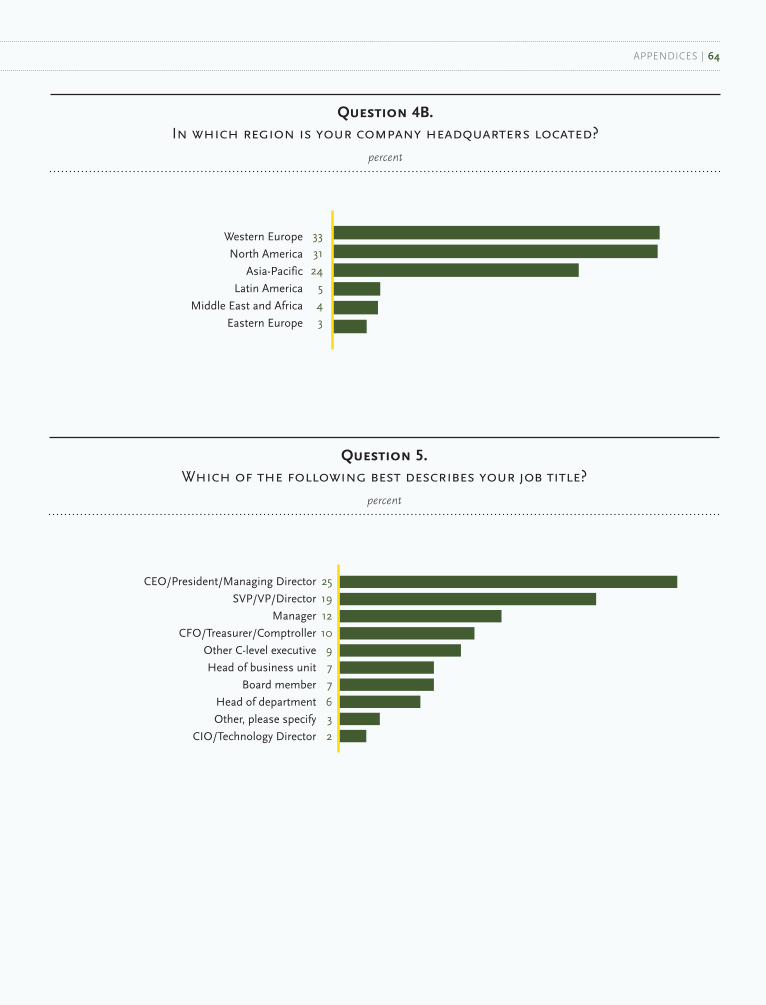
aPPendIces | 64
Question 3. What are your organization’s global annual revenues in US dollars?
percent
Western Europe
North America
Asia-Pacific
Latin America
Middle East and Africa
Eastern Europe
33
31
24
5
4
3
Q 5 Which of the following best describes your job title?
CEO/President/Managing Director
SVP/VP/Director
Manager
CFO/Treasurer/Comptroller
Other C-level executive
Head of business unit
Board member
Head of department
Other, please specify
CIO/Technology Director
25
19
12
10
9
7
7
6
3
2
Question 4B. In which region is your company headquarters located?
percent
Question 5. Which of the following best describes your job title?
percent

65 | aPPendIces
Question 6A.
In which developing countries is your firm presently investing?
percent
China
India
Brazil
Indonesia
Russian Federation
Malaysia
Mexico
Thailand
Turkey
South Africa
Vietnam
Philippines
Saudi Arabia
Argentina
Chile
Nigeria
Ukraine
Colombia
Romania
Peru
Egypt, Arab Rep.
Kazakhstan
Cambodia
Pakistan
Bulgaria
Ghana
Bangladesh
Morocco
Serbia
Angola
Algeria
Uruguay
Albania
Bahrain
Belarus
Tunisia
Kuwait
Jordan
Costa Rica
Tanzania
Others: Bosnia and Herzegovina, Democratic Republic of Congo, Dominican Republic, Panama, Uzbekistan, Iraq, Lebanon, Zambia, Georgia, Lithuania, Oman, Turkmenistan, Republic of the Congo, Guatemala, Montenegro, Uganda, Armenia, El Salvador, Jamaica, Madagascar, Sudan, Honduras, Islamic Republic of Iran, Republic of Yemen, Syrian Arab Republic
41
40
29
21
20
20
19
18
17
17
15
15
11
11
10
9
9
8
8
7
7
6
6
6
6
5
5
5
5
5
4
4
3
3
3
3
3
3
3
3
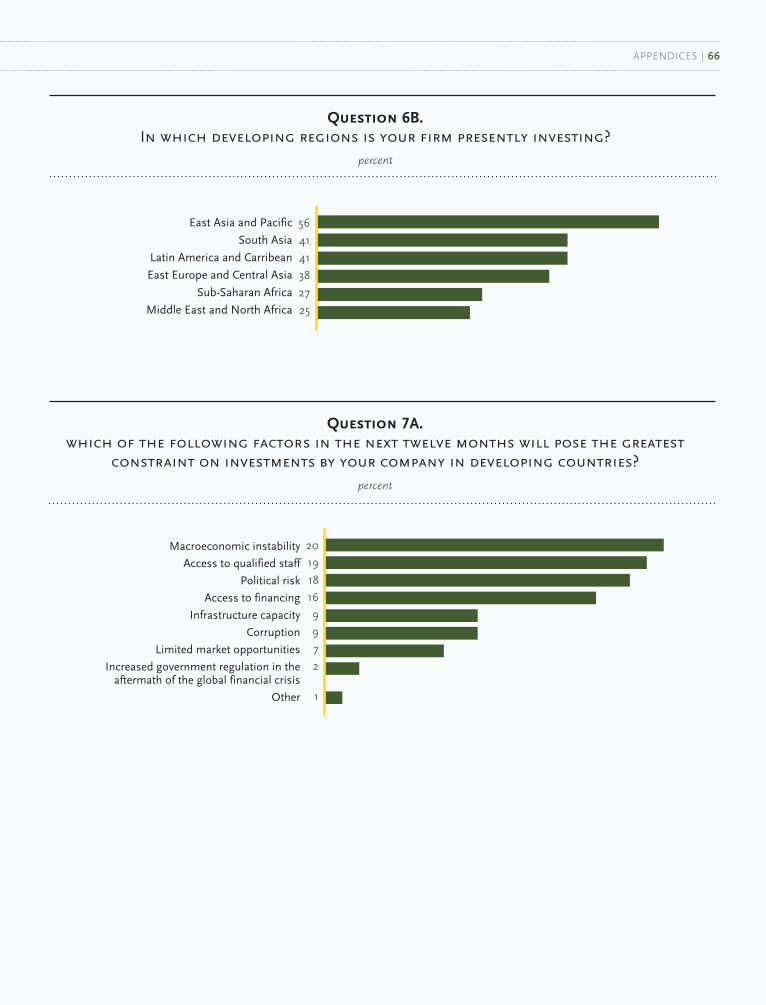
aPPendIces | 66
East Asia and Pacific
South Asia
Latin America and Carribean
East Europe and Central Asia
Sub-Saharan Africa
Middle East and North Africa
Western Europe
North America
Asia-Pacific
Latin America
Middle East and Africa
Eastern Europe
56
41
41
38
27
25
Macroeconomic instability
Access to qualified staff
Political risk
Access to financing
Infrastructure capacity
Corruption
Limited market opportunities
Increased government regulation in the aftermath of the global financial crisis
Other
20
19
18
16
9
9
7
2
1
Question 7A. which of the following factors in the next twelve months will pose the greatest
constraint on investments by your company in developing countries?
percent
Question 6B. In which developing regions is your firm presently investing?
percent

67 | aPPendIces
Increase moderately (e.g., increase more than 1% but less than 20%)
Increase substantially (e.g., increase 20% or more)
Stay unchanged
Decrease moderately (e.g., decrease more than 1% but less than 20%)
Decrease substantially (e.g., decrease 20% or more)
Don’t know
44
26
15
8
4
4
Stay unchanged
Increase moderately (e.g., increase more than 1% but less than 20%)
Increase substantially (e.g., increase 20% or more)
Decrease moderately (e.g., decrease more than 1% but less than 20%)
Decrease substantially (e.g., decrease 20% or more)
Don’t know
37
34
13
7
7
1
Question 8B. How do you expect your company’s planned investments in emerging markets to
change over the next three years compared with the previous three years?
percent
Question 8A.
How do you expect your company’s planned investments in emerging markets to change this year compared with last year?
percent
Macroeconomic instability
Political risk
Access to qualified staff
Access to financing
Corruption
Infrastructure capacity
Limited market opportunities
Increased government regulation in the aftermath of the global financial crisis
Other
21
19
18
13
10
7
5
4
1
Question 7B. which of the following factors in the next three years will pose the greatest
constraint on investments by your company in developing countries?
percent

aPPendIces | 68
Adverse regulatory changes
Breach of contract
Transfer and convertibility restrictions
Civil disturbance
Non-honoring of government guarantees
Expropriation/nationalization
Terrorism
War
56
45
37
30
27
19
11
6
Adverse regulatory changes
Breach of contract
Transfer and convertibility restrictions
Civil disturbance
Non-honoring of government guarantees
Expropriation/nationalization
Terrorism
War
58
45
43
33
31
24
13
7
Question 9B. In your opinion, which types of political risk are of most concern to your company
when investing in emerging markets in the next three years?
percent
Question 9A. In your opinion, which types of political risk are of most concern to your company
when investing in emerging markets in the next twelve months?
percent

69 | aPPendIces
Question 10. In your opinion, in the developing countries where your firm invests presently,
how do each of the risks listed below affect your company?
percent
Question 11. In the past three years has your company experienced financial losses due to
any of the following risks?
percent
T&C 29
31
19
7 14
War
2227
2412
16
30
24
37
26
103
AdvReg
1017
26
25
22Terror
14
31
15
14
27NHFO
26
30
20
1015
CD
32
6
25 32
17
620
BoC
13
18
26
26
18
Expro1 (Very high impact)
234
5 (No impact)
Adverse regulatory changes
Breach of contract
Transfer and convertibility restrictions
Civil disturbance
Non-honoring of government guarantees
Terrorism
Expropriation/nationalization
War
40
34
25
20
16
6
6
5

aPPendIces | 70
Question 10. In your opinion, in the developing countries where your firm invests presently,
how do each of the risks listed below affect your company?
percent
Question 11. In the past three years has your company experienced financial losses due to
any of the following risks?
percent
Question 12. To your knowledge, have any of the following risks caused your company to
withdraw an existing investment or cancel planned investments over the past 12 months?
percent
51
12
14 7
15
T&C BoC
14 4
33
6
61
15
War
16
66
36
926
1149
10 4
AdvReg
8162
68
7
Terror
14
58
15
9NHFO
8
59
14 316
CD
7
9
66
15
ExproWithdraw existing investment
Cancel planned investmentsBoth withdraw and cancel
Neither withdraw nor cancelDon’t know

71 | aPPendIces
Question 13. What tools/mechanisms does your company use to mitigate political risk when
investing in developing countries?
percent
Invested gradually while developing familiarity with the local environment
Use of joint venture or alliance with local company
Political/economic risk analysis
Engagement with government in host country
Engagement with local communities
Scenario planning
Develop close relationships with political leaders
Use of third-party consultants
Engagement with non-governmental organizations
Operational hedging (e.g., setting up multiple plants to spread risk)
Political risk insurance
Credit default swaps
Provide support to a well-connected political figure
We don’t use any tools or products to mitigate political risk
Don’t know
Other
54
46
44
44
40
37
26
25
25
15
12
6
2
1
16
4

aPPendIces | 72
Question 13. What tools/mechanisms does your company use to mitigate political risk when
investing in developing countries?
percent
Question 14. In your opinion, in the countries where your company invests,
what are the most effective tools/mechanisms available to your firm for alleviating each of the following risks?
percent
T&C
AdvReg
NHFO
War
Engage with local public entitiesJoint venture with local enterprises
Risk analysis/monitorRelationship with key poliltical leaders
Political risk insuranceRisk is not significant for my projectsNo existing tool can alleviate this risk
Expro
Terror CD
BoC
21810
16
15 6
24
2115
10
13
10
7
24
12
2610
16
17
7
3
3 3 8
Other
4 10
16
10
221
38
5
21
41214
36
214
4
11
4
13
17
19
16
46
45
612
9
2012
13
2521
10
5
19
2111
1114

73 | aPPendIces
Question 15. Have you ever experienced a breach of contract event or had to renegotiate a
contract with a host government?
percent
Question 16. Approximately how many years had you been doing business in the host
country prior to the latest breach of contract or contract renegotiation event?
Bre
ach
of
con
trac
t
NO69%
yes 31%
NO69
yes 31
Co
ntract ren
ego
tiation
Co
ntract ren
ego
tiation
Bre
ach
of
con
trac
t
NO60%
NO60
yes 40%
yes 40
avG yeaRs 9
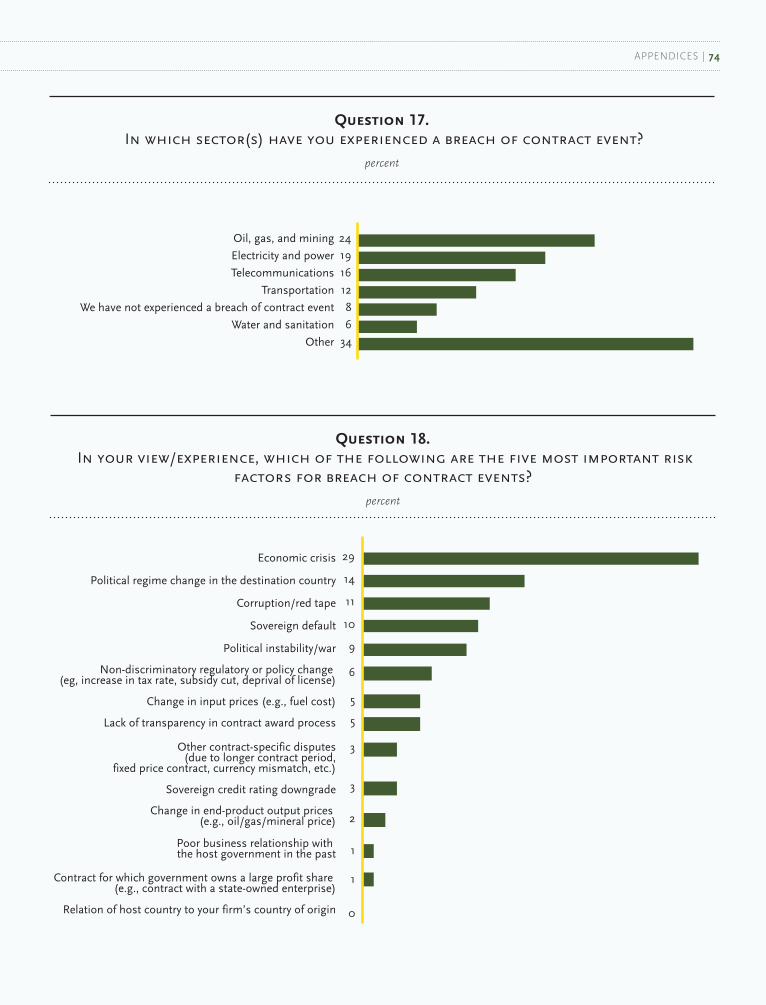
aPPendIces | 74
Question 17. In which sector(s) have you experienced a breach of contract event?
percent
Question 18. In your view/experience, which of the following are the five most important risk
factors for breach of contract events?
percent
Oil, gas, and mining
Electricity and power
Telecommunications
Transportation
We have not experienced a breach of contract event
Water and sanitation
Other
24
19
16
12
8
6
34
Economic crisis
Political regime change in the destination country
Corruption/red tape
Sovereign default
Political instability/war
Non-discriminatory regulatory or policy change (eg, increase in tax rate, subsidy cut, deprival of license)
Change in input prices (e.g., fuel cost)
Lack of transparency in contract award process
Other contract-specific disputes(due to longer contract period,
fixed price contract, currency mismatch, etc.)
Sovereign credit rating downgrade
Contract for which government owns a large profit share (e.g., contract with a state-owned enterprise)
Relation of host country to your firm’s country of origin
29
14
11
10
9
6
5
5
3
3
2
1
1
0
Change in end-product output prices (e.g., oil/gas/mineral price)
Poor business relationship with the host government in the past

75 | aPPendIces
Question 19. Which of the following methods for addressing breach of contract events do you
consider to be the most effective?
percent
Question 20. In your view, what are the key limiting factors that might make contract
renegotiation preferable to other dispute resolution methods?
percent
Contract renegotiation
International arbitration
Local arbitration
Political risk insurance
47
21
19
13
Easier to keep good business relationship with the host country (e.g., your company already has investment outlays in the
host country and leaving would be difficult)
Long wait time expected until arbitration will be awarded
Lack of trust in the arbitration process
No bilateral investment treaty or other international agreement embedded in the contract
Established market position and good business relationship with the host country in the past will help renegotiation process
Contract renegotiation
International arbitration
Local arbitration
Political risk insurance
48
13
13
12
15

aPPendIces | 76
Question 21A. How have the developments in the Middle East and North Africa region over the past
year affected your organization’s current plans for investment?
percent
Question 21B. How have the developments in the Middle East and North Africa region over the past
year affected your organization’s future plans for investment?
percent
Middle East GCC North Africa
Increase current investmentsNo change to current investments
Withdrew current investmentsDon’t know
GCCME
63
7
27 3
2NA 13
285 54
2616
55
Increase current investmentsNo change to current investments
Withdrew current investmentsDon’t know
NA GCCME
59
10
27 4
5
14
28 553
25 13
58
Middle East GCC North Africa

77 | aPPendIces
Question 22A. What are the five most important political risks for the Middle East region?
percent
Question 22B. What are the five most important political risks for the North Africa region?
percent
War and civil disturbance
Terrorism
Breach of contract
Adverse regulatory changes
Non-honoring of financial obligations
Transfer and convertibility restrictions
Expropriation
55
11
10
9
6
5
4
War and civil disturbance
Terrorism
Breach of contract
Expropriation
Adverse regulatory changes
Non-honoring of financial obligations
Transfer and convertibility restrictions
51
14
13
7
6
5
4
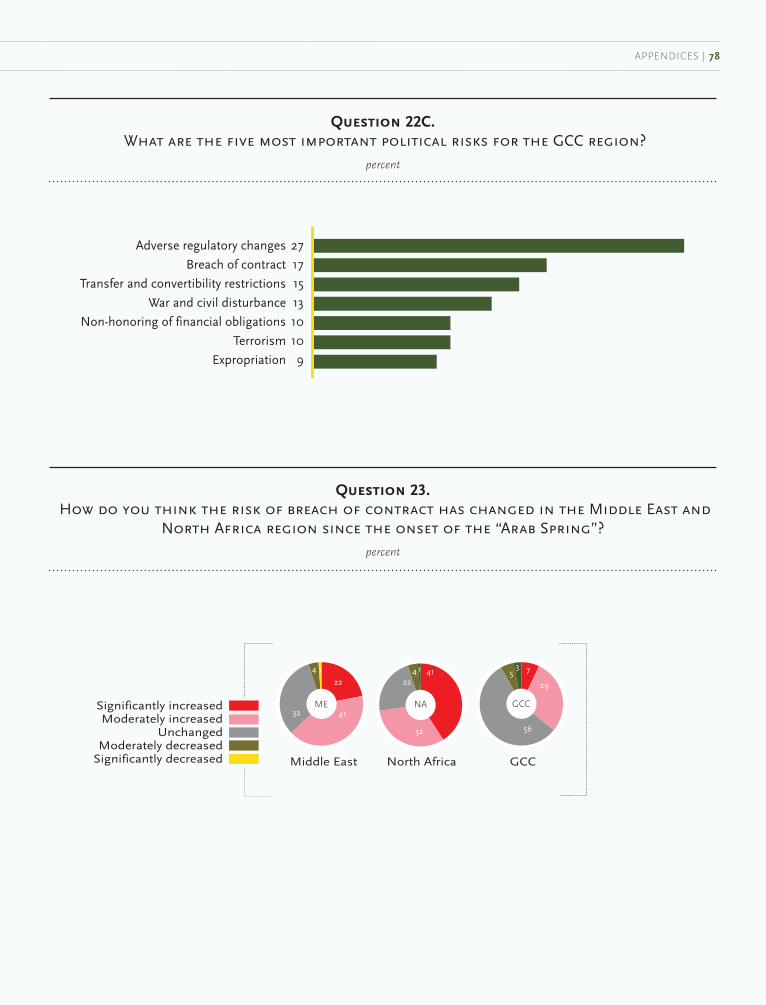
aPPendIces | 78
Question 23. How do you think the risk of breach of contract has changed in the Middle East and
North Africa region since the onset of the “Arab Spring”?
percent
Question 22C. What are the five most important political risks for the GCC region?
percent
Adverse regulatory changes
Breach of contract
Transfer and convertibility restrictions
War and civil disturbance
Non-honoring of financial obligations
Terrorism
Expropriation
27
17
15
13
10
10
9
Significantly increasedModerately increased
UnchangedModerately decreased
Significantly decreased
5 GCCNA
41 7
29
56
53
32
224 1
4132
4 122
ME
Middle East GCC
North Africa

79 | aPPendIces
Company Country
Public
ASEI Indonesia
ASHRA Israel
CESCE Spain
COFACE France
COSEC Portugal
ECGC India
ECIC SA South Africa
EDC Canada
EFIC Australia
EGAP Czech Republic
EKF Denmark
EKN Sweden
EXIM HUNGARY Hungary
EXIM J Jamaica
EXIMBANKA SR Slovak Republic
FINNVERA Finland
GIEK Norway
HKEC Hong Kong SAR, China
KSURE Korea, Rep. of
KUKE Poland
MEXIM Malaysia
NEXI Japan
ODL Luxembourg
OeKB Austria
ONDD Belgium
OPIC United States
PwC Germany
SACE Italy
SBCE Brazil
SERV Switzerland
SID Slovenia
SINOSURE China
SLECIC Sri Lanka
TEBC Taiwan, China
THAI EXIMBANK Thailand
TURK EXIMBANK Turkey
UK EXPORT FINANCE United Kingdom
US EXIMBANK United States
Company Country
Private
AIG United States
ATRADIUS Netherlands
ECICS Singapore
EH GERMANY Germany
FCIA United States
HISCOX Bermuda
SOVEREIGN Bermuda
ZURICH United States
Multilateral
ATI Multilateral
ICIEC Multilateral
MIGA Multilateral
Appendix 3 Berne Union Members
aPPendIces | 80
Company Country
Public
AOFI Serbia
BAEZ Bulgaria
BECI Botswana
ECGA Oman
ECGE Egypt, Arab Rep.
ECIC SA South Africa
ECIE United Arab Emirates
ECIO Greece
EGAP Czech Republic
EGFI Iran, Islamic Rep. of
EXIAR Russian Federation
EXIM HUNGARY Hungary
EXIM R Romania
EXIMBANKA SR Slovak Republic
EXIMGARANT Belarus
HBOR Croatia
IGA Bosnia and Herzegovina
JlGc Jordan
KECIC Kazakhstan
KREDEX Estonia
KUKE Poland
LGA Latvia
MBDP Macedonia, FYR
NAIFE Sudan
NZECO New Zealand
PHILEXIM Philippines
SEP Saudi Arabia
SID Slovenia
TASDEER Qatar
THAI EXIMBANK Thailand
UKREXIMBANK Ukraine
UZBEKINVEST Uzbekistan
Company Country
Private
LCI Lebanon
Multilateral
ATI Multilateral
DHAMAN Multilateral
ICIEC Multilateral
Appendix 3 (cont’d) Prague Club Members

81 | aPPendIces
Company
ACE
Amlin
ANV
Ark
Ascot
Aspen
Beazley
Canopius
Catlin
Chaucer
CV Starr
Hiscox
Jubilee
Kiln
Liberty
MAP
Marketform
Markel
Novae
O'Farrell
Pembroke
Talbot
XL
Appendix 3 (cont’d) Lloyd’s Underwriting Syndicates
InsurIng Investments r ensurIng opportunItIes

1818 h street, nW Washington, dc 20433 usa
t. 202.458.2538f. 202.522.0316
www.miga.org/wipr