Embed Size (px)
Citation preview

World Investment Report 2007Transnational
Corporations, Extractive Industries
and Development
Masataka FujitaChief, Investment Trends and Data SectionUNCTAD16 October 2007 EMBARGO 16 October 2007
17:00 hrs GMT
20th Meeting for the IMF Committee on Balance of Payments Statistics,
October 29, 2007
BOPCOM 07/05

2
Part IWidespread growth
in FDI

3
Global FDI flows approach their 2000 peak level
($ billion)
Global FDI flows grew for the third consecutive year to $1,306 billion.
Inflows to developed country rose by 45% ($857 billion).
Developing countries recorded a 21% growth rate ($379 billion).
Inflows to South-East Europe and CIS countries jumped by 68%.
FDI inflows, global and by group of economies, 1980-2006

4
Widespread growth of FDI inflows in 2006 due to:
(strong economic growth; increased corporate profits; increasing commodity prices; rise of cross-border
M&As; and the weakening of dollar)
FDI inflows ($ billion)
In developing regions: FDI inflows in Africa: a new
record level (due to buoyant global demand for commodities).
Inward FDI to Latin America and the Caribbean: unchanged if offshore financial centers are excluded.
The FDI inflows to South, East and South-East Asia: maintained upward trend.
Turkey and oil-rich states accounted for most of the FDI increase to West Asia.
Flows to Asia accounted for most of the FDI increase in developing countries.
FDI flows by region, 2005 and 2006

5
In developing countries FDI continues to be the most important
source of external financing
($ billion)
Total net resource flows to developing countries, by type of flow, 1990-2006

6
Top 10 recipients of FDI inflows
($ billion)
United States regained first rank (M&As).
Belgium, for the first time, the fourth world largest FDI recipient.
China lowered its ranking compared to 2005.
FDI inflows to Canada more than doubles (mainly in extractive industries).

7
Largest 10 sources of FDI outflows
($ billion)
United States became the largest investor.
Spain: record levels for the first time.
Honk Kong (China) ranked within top ten investors.
Brazil ranked 12th
($28 bil), Russian Federation 17th ($18 bil), China 18th ($16 bil) in the world.

8
Bahrain and Tajikistan entered the top 20 rankings for inward FDI performance
As to the potential index, there are no notable changes compare to last year indices
Some country improved their FDI position in performance, potential or both (e.g. Botswana, Croatia, Lithuania)
Economy 2005 2006
Luxembourg 5 1Hong Kong, China 4 2Suriname 3 3Singapore 7 4Malta 11 5Iceland 13 6Bulgaria 8 7Jordan 20 8Estonia 6 9Belgium 12 10
Inward FDI Performance Index ranking
Economy 2005 2006
United States 1 ..Singapore 2 ..United Kingdom 3 ..Canada 4 ..Luxembourg 5 ..Germany 6 ..Norway 7 ..Sweden 8 ..Qatar 9 ..Iceland 10 ..
Inward FDI Potential Indexranking
Indices of inward FDI performance and potential

9
Indices of outward FDI performance
Economy 2005 2006
Iceland 1 1Hong Kong, China 3 2Luxembourg 2 3Switzerland 8 4Belgium 7 5Netherlands 6 6Panama 4 7Ireland 10 8Azerbaijan 5 9Bahrain 9 10
Outward FDI Performance Index ranking
Hong Kong (China) remained one of the top outward FDI perfomers.
Israel and Estonia entered the top 20 for outward FDI performance

10
Main reasons for continued rise in cross-border M&As
Global cross-border M&As, 1988-2006rising corporate
profits
higher stock market valuations (in developed countries and in emerging markets)
favorable financing conditions
increased participation of private equity funds/firms

11
Main features of cross-border M&As
Cash and debt financing rather than exchange of shares
Doubled in value in North America due to deals in mining
In Europe • the United Kingdom - the main target • Spanish companies - active acquirers
Increasingly acquisitions by developing countries and economies in transition TNCs
Emerging economies, awash with petrodollar (e.g. United Arab Emirates) and with foreign exchange (e.g. China) are active in cash-based acquisitions
Growing importance of private equity funds

12
Growing importance of private equity funds in cross-border
M&As
Benefiting from ample liquidity
Some equity funds are listed in the stock markets
Doubts of their sustainability in FDI activity
competition is becoming stronger (lower returns)
financial instability (too much borrowing from banks; rising interest rates)
tax treatments being examined
Cross border M&As by private equity funds

13
Current FDI surge resulted in further
growth in international production
Selected indicators of FDI and international production, 2005-2006
Nearly 20% rise in FDI stock and assets of foreign affiliates
Foreign affiliates accounted for 10% of world GDP (2006)
Employment of foreign affiliates account for 3% of global employment
14
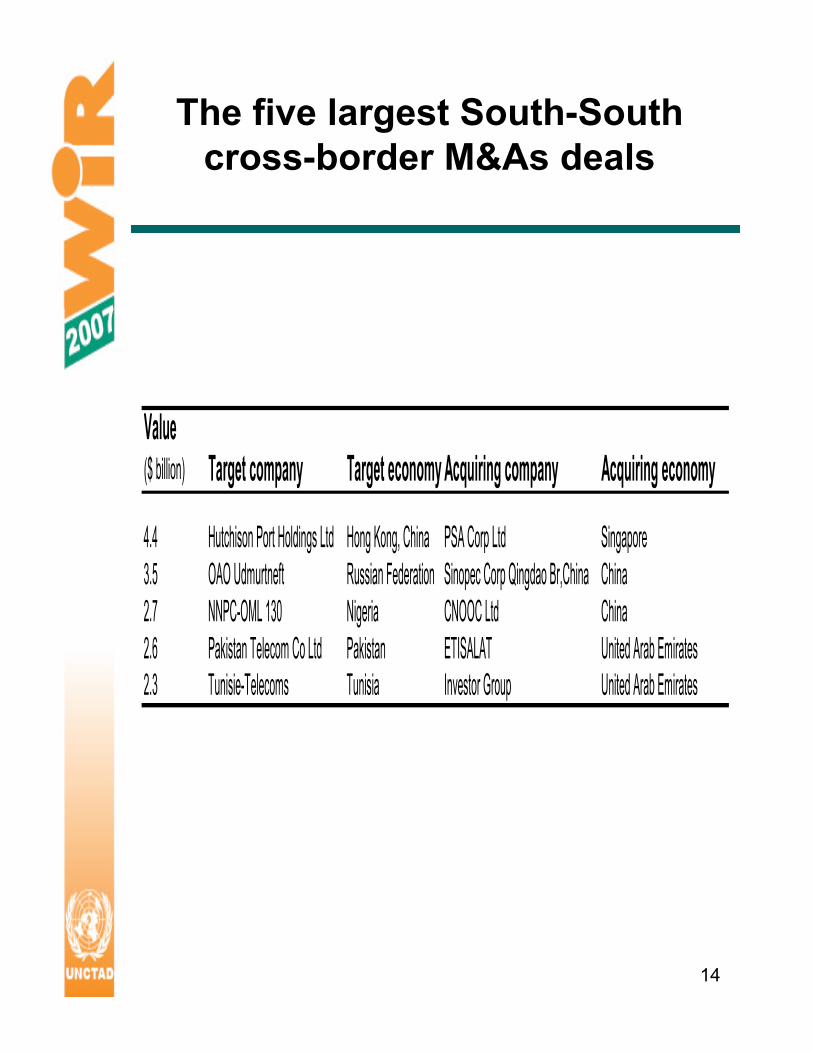
The five largest South-South cross-border M&As deals
Value ($ billion) Target company Target economy Acquiring company Acquiring economy
4.4 Hutchison Port Holdings Ltd Hong Kong, China PSA Corp Ltd Singapore3.5 OAO Udmurtneft Russian Federation Sinopec Corp Qingdao Br,China China2.7 NNPC-OML 130 Nigeria CNOOC Ltd China2.6 Pakistan Telecom Co Ltd Pakistan ETISALAT United Arab Emirates2.3 Tunisie-Telecoms Tunisia Investor Group United Arab Emirates
15
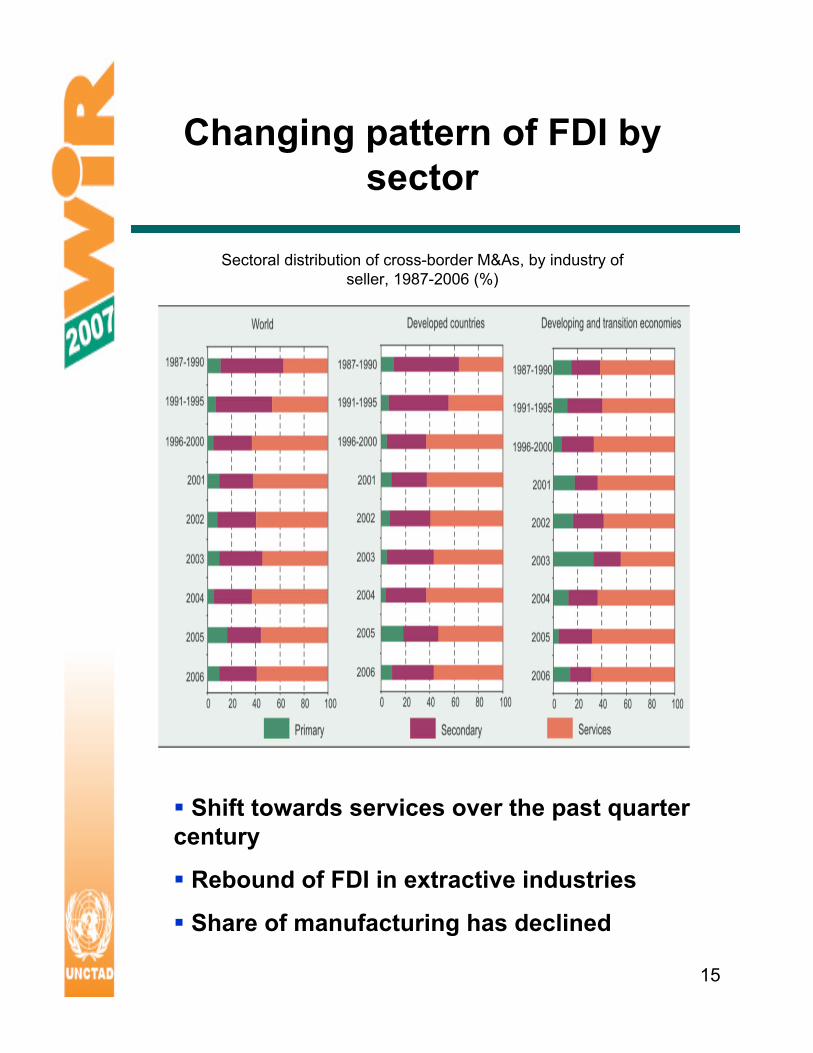
Changing pattern of FDI by sector
Sectoral distribution of cross-border M&As, by industry of seller, 1987-2006 (%)
Shift towards services over the past quarter century
Rebound of FDI in extractive industries
Share of manufacturing has declined

16
Top 20 bilateral FDI relationships, 1985, 2005
(FDI stock, $ billion)
Geographical proximity has become important (e.g. in the top 50 pairs of countries with the strongest links in terms of bilateral inward FDI stock, in 2005 22 were from Europe compared to 17 in 1995)
Geographical pattern of FDI towards greater South-South FDI (e.g. the second largest bilateral FDI stock was held in China by Hong Kong investors in 2005)
Changing pattern of FDI by country

17
FDI intensity ratio (R) = ijij ExpFDFDI
FDIij = Actual amount of FDI stock from country i to j.
ExpFDIij = Expected value of FDI stock from country i to country j
wwww
iw
ww
wj FDIFDIFDI
FDIFDI
**=
where,
=wjFDI Total inward stock in the j country;
=iwFDI Total outward FDI stock of i country in the world; and
=wwFDI Worldwide inward or outward FDI stock.
If the intensity ratio is greater than 1, the FDI relationship is stronger than would be expected based on the relative importance of the two economies as home and host; if it is less than 1 it is weaker than expected.
FDI relationship between host and home countries: how to measure?: an FDI intensity to
compare the actual value and the expected value

18
The FDI intensity of United States as home: with its traditional partners such as Japan, Canada, and the United Kingdom is higher than one;while there is a growing importance of Asian host economy partners, the intensity with Latin American countries has fallen more than expected.
Japan’s FDI intensity with respect to Asian developing countries is more stronger than other developing countries and has increased over the past decade.
Bilateral FDI relationships between European countries have increased from 1995 to 2005.
Home developing countries have established stronger than expected FDI intensity with other developing countries (e.g. China - Hong Kong (China); Malaysia - Cambodia; the Republic of Korea - China)
FDI intensity index (results)

19
The world largest non-financial TNCs
Top 100 account for 10%, 17% and 13% of estimated foreign assets, sales and employment of all TNCs
Foreign sales and employment increase faster than domestic ones
($ billion and number of employees)

20
Five largest TNCs account for one third of all foreign assets ofthe top 100 TNCs of developing countries
Hong Kong (China) and Taiwan Province of China dominate as home of top 100 TNCs of developing countries
The most important industry is electrical/electronic equipment,followed by petroleum
($ billion and number of employees)
The largest non-financial TNCs from developing economies

21
Most policy changes in 2006 continue to favour FDI
• 184 policy changes were introduced in 93 countries, 80% of which were favorable to FDI
• 59% of regulatory changes were adopted in developing countries
• Introduction of new promotional incentives (e.g. India, Brazil)
• Opening up of industries to FDI (e.g. services sectors in Italy; telecommunication in Botswana, Cape Verde and Kenya; banking industry in Belarus and Mali)
• Some restrictions emerging:
• in extractive industries (e.g. Bolivia, Peru and Venezuela)
• nationalization (e.g. Venezuela) or restrictions (e.g. Russian Federation) in “strategic sectors”

22
Prospects for FDI flows remain positive
Prospects for global FDI flows in 2007-2009:
UNCTAD survey responses (%)
However several risk could hinder FDI flows
• global current account imbalances
• high and volatile oil prices
• real estate market in the United States

23
Part 2Transnational Corporations,
Extractive Industries and Development

24
Why Extractive Industries Matter
• Minerals are essential to all economies
• Mineral resourcesare unevenlydistributed
• Many low-incomecountries dependon mineralresources
• Current boom: a window of opportunity
• TNCs key playersfor both host and home countries
Oil and gas reserves, consumption and production, 2005
0
10
20
30
40
50
60
70
80
Developedcountries
Developingcountries
South-EastEurope and the
CIS
%
Reserves
Production
Consumption

250 25 50 75
Russian Fed.
Mongolia
Bangladesh
Argentina
Chile
South Africa
United Rep. of Tanzania
Venezuela
Kazakhstan
Oman
Botswana
Bolivia
Nigeria
Papua New Guinea
Syrian Arab Rep. 90.3
79.5
Some Countries Receive Much FDI into the Extractive
Industries
• Globally: share of EIsonly 9% of inward FDI…
• …but share ishigh in somecountries
Share of extractive industries in inward FDI stock, 2005 or latest
year, %
%

26
TNCs Involvement Different in Mining
and Oil/Gas
Metal mining
• Developed-country TNCs dominateworld production
• Top 3 (2005): BHP Billiton, Rio Tinto, CVRD
• Concession – main form of TNC involvement
Oil and gas
• SOEs fromdeveloping and transition economiesdominate world production
• Top 3 (2005): Saudi Aramco, Gazprom, NIOC
• Production-sharing agreements –most commonform of TNC involvement
27
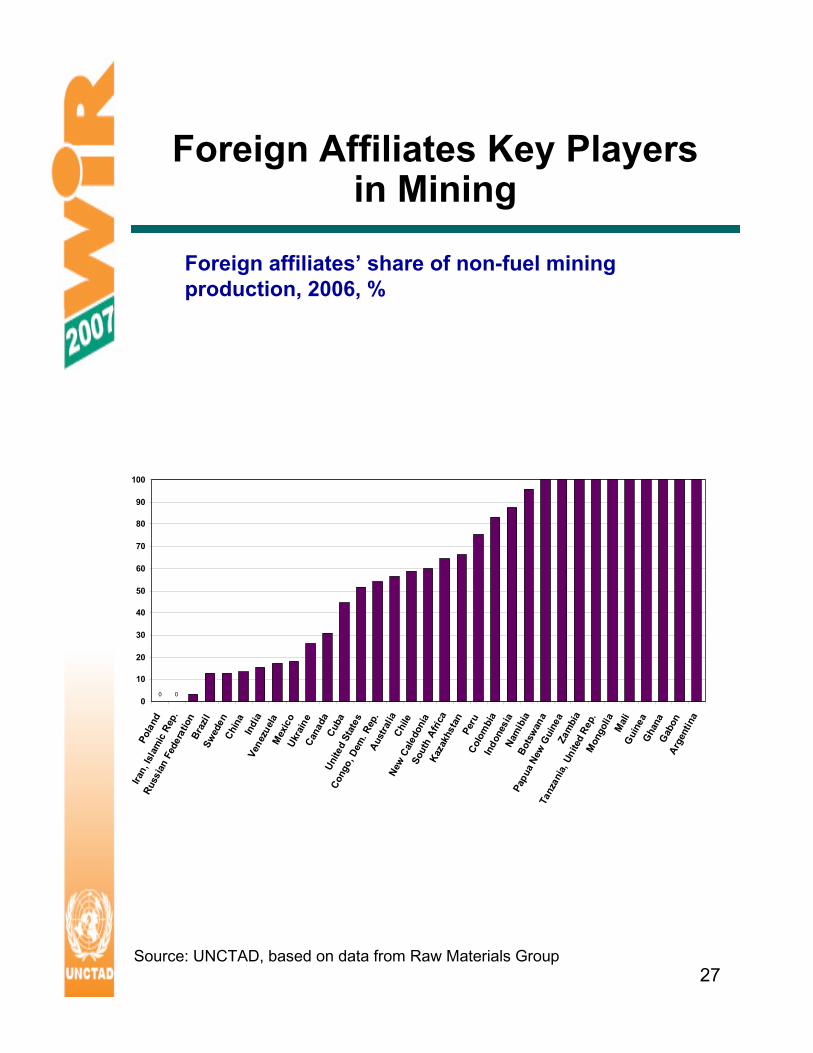
Foreign Affiliates Key Playersin Mining
000
10
20
30
40
50
60
70
80
90
100
Pola
nd
Iran,
Isla
mic
Rep
.
Russ
ian F
eder
atio
nBr
azil
Swed
enCh
ina
Indi
aVe
nezu
elaM
exic
oUk
rain
eCa
nada
Cuba
Unite
d St
ates
Cong
o, D
em. R
ep.
Aust
ralia
Chile
New
Cal
edon
iaSo
uth
Afric
aKa
zakh
stan
Peru
Colo
mbi
aIn
done
sia
Nam
ibia
Bots
wan
a
Papu
a New
Gui
nea
Zam
bia
Tanz
ania
, Uni
ted
Rep.
Mon
golia
Mali
Gui
nea
Gha
naG
abon
Arge
ntin
a
Foreign affiliates’ share of non-fuel mining production, 2006, %
Source: UNCTAD, based on data from Raw Materials Group

28
0
20
40
60
80
100
K u w a it I r aq
S a ud i A
r a bM e xi c o
B r a z i l
I r an , I s
l a mi c
R e pC h i n a
V e ne z
u e lU z b
e ki s t
R u s s ian F e d
e rN e th e r l
a nd
A l g e r iU n i te
d Ar a b
E m iC a n a d Q a t aN o rw
a
L i b y an A r a b
J am a
E g y pt
U n i t ed S
ta tN i g e r iM a l a
y si
K a z a kh s t
U n i ted K
i n g dSu d a n
A n g o lI n d o n
e s iA r g e n t i n
E q u a tor i a
l Gu i
Foreign Companies LessProminent in
Oil & Gas Production
Share of foreign companies in oil and gas production, selected countries, 2006, %
Source: UNCTAD, based on data from IHS

29
SOE TNCs in Oil & Gas are Expanding Abroad But From
Low Level
35
35
46
46
49
53
66
98
114
129
188
366
512
550
584
1 291
1 045
749
1 427
0 200 400 600 800 1 000 1 200 1 400
ONGC
Norsk Hydro
Lukoil
CNOOC
Sinopec
Statoil
Petrobras
Petronas
BG
Inpex
CNPC/Petro China
Repsol-YPF
ConocoPhillips
Chevron
ENI
Total
Royal Dutch Shell
BP
ExxonMobil
Oil and gas production of selected TNCs outside their home country, 2005,
million barrels of oil equivalent
Source: UNCTAD, based on data from IHS

30
Foreign Production Locations of Oil & Gas TNCs from Emerging Economies
1995
Source: UNCTAD, based on data from IHS

31
…and in
2005
Source: UNCTAD, based on data from IHS
32
Key Development Challenges
• The economic challenge – To create value from the mineral
deposits – To capture that value locally– To manage and use revenues
efficiently and equitably.
• The environmental challenge
• The social challenge – How to protect human rights,
compensate for resettlement and loss of traditional livelihoods;
– How to address health concerns and workers’ safety.
• The political challenge – How to avoid corruption and the
apparition of “rentier States”, unaccountable to their citizens and authoritarian.

33
Implications of Involving TNCs
• Potential economic impacts:Capital, technology, management skills, income, government revenueShare of rent, repatriation of profits, few linkages, few jobs
• Environmental, social and political impacts implies need for appropriate policies as well as corporate social responsibility
• Net outcome depends on: global market conditions; host country’s policies and institutions; TNC behaviour
• Challenge: – Take advantage of TNCs as a catalysts for
economic development while minimizing the costs
– Balance social and environmental concerns against economic considerations.

34
Addressing Development Challenges Requires Concerted Effort From All
Stakeholders
Host-country gov’t
• Governance, institutions
• Sectoral policies and institutions
• TNC-specific policies(entry and operations, contracts, taxation,IIAs)
Making minerals work for sustainable development
Extractive activities
TNCs
• Abide by local laws
• Uphold highstandards whenlocal governance isweak
Home-country gov’t
• PromoteresponsibleTNC behaviour
• Assist host countries
Int. Community
• Guidelines• Pressure,
sanctions• Assist host
countries
Civil society
• Monitor TNCs and governments
• Provideexpertise

35
Many International Initiatives Exist
• Extractive Industry TransparencyInitiative
• Kimberley Process
• UN Global Compact
• Voluntary Principles on Security and Human Rights
• Global Reporting Initiative
But for greater impact, more firms -and more countries- need to beinvolved

36
Some Policy Recommendations
• Strengthen host-country governance and capacity to design and implementappropriate policies
• Strengthen capability to negotiate withTNCs
• Involve all stakeholders in decision-making process
• Use progressive taxation to cope withprice fluctuations and avoid need for renegotiation
• More countries and companies shouldcommit to enhanced revenue transparency
• Promote the use of high corporatebehavioural standards
37
Thank You!
Visit UNCTAD websites:
www.unctad.org
and
www.unctad.org/wir
www.unctad.org/fdistatistics