Embed Size (px)
Citation preview
E c o n
World Population
Ageing 2013
United Nations
o m i c &
S
o c
i a l A f f
a i r
s

ST/ESA/SER.A/348
Department of Economic and Social Affairs Population Division
World Population Ageing 2013
United Nations • New York, 2013
DESA The Department of Economic and Social Affairs of the United Nations Secretariat is a vital
interface between global policies in the economic, social and environmental spheres and
national action. The Department works in three main interlinked areas: (i) it compiles,
generates and analyses a wide range of economic, social and environmental data and
information on which Member States of the United Nations draw to review common
problems and take stock of policy options; (ii) it facilitates the negotiations of Member
States in many intergovernmental bodies on joint courses of action to address ongoing or
emerging global challenges; and (iii) it advises interested Governments on the ways and
means of translating policy frameworks developed in United Nations conferences and
summits into programmes at the country level and, through technical assistance, helps
build national capacities.
Note The designations employed in this report and the material presented in it do not imply the expression of any opinion whatsoever on the part of the Secretariat of the United Nations concerning the legal status of any country, territory, city or area or of its authorities, or concerning the delimitation of its frontiers or boundaries. The term “country” as used in the text of this publication also refers, as appropriate, to territories or areas.
The designations “developed” and “developing” countries or areas and “more developed”, “less developed” and “least developed” regions are intended for statistical convenience and do not necessarily express a judgement about the stage reached by a particular country or area in the development process. Suggested Citation: United Nations, Department of Economic and Social Affairs, Population Division (2013). World Population Ageing 2013. ST/ESA/SER.A/348.
ST/SEA/SER.A/348 United Nations publication Copyright © United Nations, 2013 All rights reserved
United Nations Department of Economic and Social Affairs ǀ Population Division iii
Preface
The Population Division of the Department of Economic and Social Affairs of the United Nations
Secretariat is responsible for providing the international community with up-to-date and objective information on population and development. The Population Division provides guidance to the United Nations General Assembly, the Economic and Social Council and the Commission on Population and Development on population and development issues. The Division also undertakes regular studies on population levels, trends and dynamics, including trends in population ageing, changes in population policies and the interrelationships between population and development.
In the area of population ageing, the Population Division prepares national, regional and global estimates and projections of older populations, monitors levels and trends in population ageing and collects and analyses information on the relationship between population ageing and development. The Population Division also organizes expert group meetings on various aspects of population ageing.
This report is the fourth in the series World Population Ageing. The first report was released in 2002
in conjunction with the Second World Assembly on Ageing. The present report, which updates the 2007 and 2009 editions, provides a description of global trends in population ageing and includes new features on the socio-economic and health aspects of ageing. This report is accompanied by an interactive database on the Profiles of Ageing 2013.
This report was prepared by a team led by Jorge Bravo, including Hantamalala Rafalimanana and
Mun Sim Lai, who carried out research and drafted chapters. Ivan Prlincevic contributed programming and data processing and Donna Culpepper and Neenah Koshy provided formatting and editorial support. John Wilmoth provided key guidance and useful comments on the draft report. The Population Division acknowledges the valuable research inputs provided by Luis Rosero-Bixby and Maliki Achmad.
The present report has been issued without formal editing. Responsibility for the World Population
Ageing 2013 report rests with the Population Division. This report, as well as the profiles of ageing and data on older persons, can be accessed on the
Population Division’s website at www.unpopulation.org. Questions and comments concerning this publication should be addressed to the Director, Population Division, Department of Economic and Social Affairs, United Nations Secretariat, New York, NY 10017, U.S.A. by telephone at +1 (212) 963-3209, fax at +1 (212) 963-2147, or e-mail at [email protected].
iv World Population Ageing 2013
Sources, methods and classifications
Data on demographic trends used in the present report are taken from the 2012 Revision of the
official United Nations world population estimates and projections (United Nations, Department of Economic and Social Affairs, Population Division, 2013). In addition, data on labour force participation were obtained from the International Labour Organization (2011) and data on statutory retirement age from the United States Social Security Administration (2013). Data on living arrangements and marital status were compiled from United Nations (2012).
The population estimates and projections, which are prepared biennially by the Population Division
of the Department of Economic and Social Affairs of the United Nations Secretariat, provide the standard and consistent set of population figures that are used throughout the United Nations system as the basis for activities requiring population information. In the 2012 Revision of the World Population Prospects, standard demographic techniques were used to estimate the population by age and sex, as well as trends in total fertility, life expectancy at birth, infant mortality and international migration for the years 1950 through 2010, from data available from censuses and post-enumeration surveys; demographic and health surveys; population and vital registration systems; scientific reports and data collections; and from data and estimates provided by international agencies. The resulting estimates provided the basis from which the population projections follow. In the 2012 Revision, the population projections are based on a probabilistic (Bayesian) method for projecting total fertility and life expectancy at birth. This method is based on empirical fertility and mortality trends estimated for all countries of the world for the period 1950 to 2010. The present report draws on the medium variant population projections through the year 2050.1
The countries and areas identified as statistical units by the Statistics Division of the United Nations
and covered by the above estimates and projections, are grouped geographically into six major areas: Africa; Asia; Europe; Latin America and the Caribbean; Northern America; and Oceania. Those major areas are further divided geographically into 21 regions. In addition, the regions are summarized, for statistical convenience, into two general groups―more developed and less developed―on the basis of demographic and socio-economic characteristics. The less developed regions include all regions of Africa, Asia (excluding Japan), Latin America and the Caribbean, and Oceania (excluding Australia and New Zealand). The more developed regions include all other regions plus the three countries excluded from the less developed regions. The group of least developed countries, as defined by the United Nations General Assembly in its resolutions (59/209, 59/210 and 60/33) in 2007, comprises 49 countries. See Annex II for further detail.
1 Further information about data sources and methods underlying the estimates and projections of population can be found on the Internet at http://esa.un.org/wpp/sources/country.aspx and http://esa.un.org/unpp/index.asp?panel=4
United Nations Department of Economic and Social Affairs ǀ Population Division v
Contents Page
Preface .......................................................................................................................................... iii
Sources, methods and classifications ........................................................................................... iv
Explanatory notes ......................................................................................................................... ix
Executive summary ...................................................................................................................... xi
Introduction .................................................................................................................................. 1 Chapter I. DEMOGRAPHIC DETERMINANTS AND SPEED OF POPULATION AGEING ............................ 3 II. THE CHANGING BALANCE AMONG AGE GROUPS ............................................................. 17 III. DEMOGRAPHIC PROFILE OF THE OLDER POPULATION ..................................................... 31
IV. CHARACTERISTICS OF THE OLDER POPULATION ............................................................. 43 V. INTERGENERATIONAL TRANSFERS AND WELL-BEING IN OLD AGE .................................. 59
Conclusion ................................................................................................................................... 75
References .................................................................................................................................... 77
Annexes
I. Definition of the indicators of population ageing ........................................................... 83
II. Classification of major areas and regions ....................................................................... 85
III. Annex tables .................................................................................................................... 89
Text tables
5.1. Poverty headcount ratio (percentage of population living in households with an income below the national poverty line) for the whole population, the older population and children, selected countries in Latin America, late 2000s…………………………………………………………………………….. 67 5.2. Poverty headcount ratio (percentage of population living in households with an equivalised income below half of the national median equivalised income) for the whole population and the older population, selected countries in Latin America, late 2000s…………………………………………………………………………….. 69
vi World Population Ageing 2013
Page 5.3. Poverty headcount ratio (percentage of population living in households with an equivalised income below half of the national median equivalised income) for the whole population and the older population, OECD countries……………………….. 71
Text figures 1.1. Total fertility rate: world and development regions, 1950-2050 ................................ 4 1.2. Annual number of births by development region, 1950-2100 .................................... 5 1.3. Life expectancy at birth: world and development regions, 1950-2050 ....................... 6 1.4. Life expectancy at ages 60 and 80: world and development regions, 2010-2015, 2020-2025 and 2045-2050 ....................................................................... 7 1.5. Male and female life expectancy at birth and gender gap: world and development regions, 1950-2050 ..................................................................................................... 9 1.6. Population pyramids of the less and more developed regions: 1970, 2013 and 2050 ................................................................................................... 10 1.7. Population aged 60 years or over by development region, 1950-2050 ....................... 11 1.8. Proportion of the population aged 60 years or over: world and development regions, 1950-2050 ................................................................................ 12 1.9. Distribution of countries by the proportion of the population that is aged 60 years or over in the less and more developed regions, 1970-2050 ........................ 12 1.10. Speed of population ageing (percentage point increase): world and development regions, 1980-2010 and 2010-2040 ....................................................... 13 1.11. Average annual growth rate of the population age 60 years or over: world and development regions, 1950-2050 ............................................................... 14 1.12. Distribution of world population aged 60 years or over by development
region, 1950-2050 ....................................................................................................... 15 2.1. Population by broad age group: world and development regions, 1950-2100 ............ 18 2.2. Distribution of population by broad age group: world and development regions, 1950-2100 ..................................................................................................... 19 2.3. Median age of the population: world and development regions, 1950, 2010, 2025 and 2050 ............................................................................................................. 21 2.4. Dependency ratio: world and development regions, 1950-2050 ................................. 22 2.5. Composition of dependency ratio: world and development regions, 1950-2050........ 23 2.6. Old-age support ratio: world and development regions, 1950-2050 ........................... 24 2.7. Old-age support ratio by major area, 1950, 2010 and 2050 ........................................ 25 2.8. Economic life cycle for the less and more developed regions .................................... 26 2.9. Economic support ratio by development region, 1950-2050 ...................................... 28 2.10. Demographic dividend (demographically induced economic growth rates) by development region, 1950-2050 ............................................................................ 29 3.1. Distribution of population aged 60 years or over by broad age group: world, 1950-2050 ........................................................................................................ 31
United Nations Department of Economic and Social Affairs ǀ Population Division vii
Page 3.2. Population aged 80 years or over in the less and more developed regions, 1950, 2013, 2025 and 2050 ......................................................................................... 32 3.3. Top ten countries with the largest population aged 80 or over in 2013 ...................... 33 3.4. Sex ratios at ages 60 years or over, 65 years or over, and 80 years or over:
world, 2010-2050 ........................................................................................................ 34 3.5. Sex ratio at age 60 years or over by development region, 1950-2050 ........................ 34 3.6. Sex ratios for the population aged 60 years or over and 80 years or over:
world and major areas, 2013 ....................................................................................... 35 3.7. Proportion currently married among persons aged 60 years or over by sex: world and development regions, 2005-2008 ............................................................... 36 3.8. Proportion currently married among men and women aged 60 years or over:
major areas, 2008 ........................................................................................................ 37 3.9. Proportion living independently (alone or with spouse only) among persons
aged 60 years or over by sex: world and development regions, 2005 ........................ 39 3.10. Independent living and percentage of older persons, around 2005 ............................. 40 3.11. Proportion of “subordinate” older persons (neither the older person nor his or her
spouse is the household head) by sex: world and development regions, 2005 ........... 41 4.1. Crude death rates: world and development regions, 1950-2050 ................................. 44 4.2. Annual number of deaths: world and development regions, 1950-2050..................... 44 4.3a. Distribution of deaths by age group and major area, 1950-1955 ................................ 45 4.3b. Distribution of deaths by age group and major area, 2005-2010 ................................ 46 4.4. Distribution of deaths among persons aged 60 years or over by cause, 2008 ............. 47 4.5. Old-age dependency ratio and per capita expenditure on health ($PPP): selected countries and regions, 2010 ........................................................................... 48 4.6. Labour force participation of persons aged 65 years or over by sex and development region, 1980-2020 ................................................................................. 49 4.7. Labour force participation of persons aged 65 years or over, 1980-2020 ................... 50 4.8. Labour force participation of persons aged 65 years or over by major area, 1980, 2010 and 2020 ................................................................................................... 51 4.9. Labour participation of men aged 65 years of over, 1980 and 2010 ........................... 52 4.10. Labour participation of women aged 65 years of over, 1980 and 2010 ...................... 53 4.11. Distribution of countries by statutory retirement age for men: major areas, 2013…... 55 4.12. Distribution of countries by statutory retirement age for women: major areas, 2013 ........................................................................................................ 55 4.13. Distribution of countries by statutory retirement age of men and women and
Old-age support ratio: world, 2010 ............................................................................. 56 5.1. Consumption of older population financed by labour income. ................................... 60 5.2. Consumption of older population financed by net public transfers ............................ 62 5.3. Consumption of older population financed by net familial transfers .......................... 63 5.4. Consumption of older population financed by net asset-based reallocations ............. 64 5.5. Ratio of the poverty rate of older persons to the poverty rate of the general population, Sub-Saharan Africa, late 1990s-early 2000s ............................................ 68 5.6. Ratio of the poverty rate of older persons to the poverty rate of the general population, Latin America, late 2000s ........................................................................ 68
viii World Population Ageing 2013
Page 5.5. Ratio of the poverty rate of the older persons to the poverty rate of the general
population, OECD countries, late 2000s ..................................................................... 73
Annex tables
A.III.1. Population aged 60 years or over, 65 years or over, and 80 years or over by sex (thousands): world, major areas and regions, 2013 ......................................... 91 A.III.2. Percentage of population aged 60 years or over, 65 years or over, and 80 years or over by sex: world, major areas and regions, 2013 ................................................ 92 A.III.3. Selected indicators of ageing: world, development groups, major areas and regions, 2013 ............................................................................................................... 93 A.III.4. Country ranking by percentage of population aged 60 years or over, 2013 ............... 95
United Nations Department of Economic and Social Affairs ǀ Population Division ix
Explanatory notes
Symbols of United Nations documents are composed of capital letters combined with figures. The following symbols have been used in the tables throughout this report: Two dots (..) indicate that data are not available or are not separately reported. An em dash (—) indicates that the amount is nil or negligible. A hyphen (-) indicates that the item is not applicable. A minus sign () before a figure indicates a decrease. A point () is used to indicate decimals. A slash () indicates a crop year or financial year, for example, 2010/15. Use of a hyphen (-) between dates representing years, for example, 2010-2015, signifies the full
period involved, including the beginning and end years. Details and percentages in tables do not necessarily add to totals because of rounding. Reference to “dollars” ($) indicates United States dollars, unless otherwise stated.
The term “billion” signifies a thousand million.

United Nations Department of Economic and Social Affairs ǀ Population Division xi
Executive summary
This report updates prior World Population Ageing2 editions. The series originated as part of the United Nations activities connected to the Second World Assembly on Ageing in April 2002,3 where the Political Declaration and the Madrid International Plan of Action on Ageing (MIPAA) were adopted. MIPAA represented a milestone in addressing the challenge of building a society for all ages. The Plan focuses on three priority areas: older persons and development; advancing health and well-being into old age; and ensuring enabling and supportive environments. MIPAA links population ageing and the well-being of older persons to international frameworks for social and economic development and human rights, particularly those agreed to at the United Nations conferences and summits of the 1990s.
Issues related to population ageing and older persons have played an important role in the several
major international conferences during the past two decades, including the International Conference on Population and Development (ICPD) held in 1994, which recognized the economic and social impact of population ageing in all societies.4 Subsequently, the Key Actions for the Further Implementation of the Programme of Action of the ICPD, adopted in 1999, reiterated the need for all societies to address the significant consequences of population ageing in the coming decades.5 In 2007, the United Nations Commission on Population and Development (CPD) dedicated its 40th session to the changing age structures of populations and their implications for development and adopted a resolution covering a range of policy issues related to ageing. The resolution also requested the Secretary-General to continue his substantive work on changing age structures and their implications for development.6
The United Nations Commission on Social Development (CSD) undertook the first review and
appraisal of progress made in implementing the Madrid Plan of Action on Ageing in 2007 and 2008, and carried out a second cycle of review and appraisal of MIPAA during the 51st session of the CSD in 2013. The Secretary-General’s report for that session renewed the call to “ensure social integration of older persons and that the promotion and protection of their rights form an integral part of the development agenda at the national and global levels”.7
This report provides the demographic foundation for the follow-up activities of the Second World
Assembly on Ageing and the aforementioned mandates of ICPD, the Commission on Population and Development and the Commission on Social Development. It considers the process of population ageing for the world as a whole, for more and less developed regions and major areas and regions.
2 World Population Ageing, 1950-2050 (United Nations publication, Sales No. E.02.XIII.3); World Population Ageing,
2007 (United Nations publication, Sales No. E.07.XIII.5); World Population Ageing 2009 (United Nations publication, Sales No. E.10.XIII.5).
3 Report of the Second World Assembly on Ageing, Madrid, 8-12 April 2002 (United Nations publication, Sales No. E.02.IV.4), chap. I, resolution 1, annex II.
4Population and Development, vol. 1: Programme of Action adopted at the International Conference on Population and Development, Cairo, 5-13 September 1994 (United Nations publication, Sales No. E.95.XIII.7).
5Review and Appraisal of the Progress Made in Achieving the Goals and Objectives of the Programme of Action of the International Conference on Population and Development, 1999 Report (United Nations publication, Sales No. E.99.XIII.16).
6 Report on the fortieth session of the Commission on Population and Development, (10 May 2006 and 9-13 April 2007), Economic and Social Council Official Records, 2007, Supplement No. 5 (E/2007/25).
7 Follow-up to the International Year of Older Persons: Second World Assembly on Ageing, Report of the Secretary-General to the sixty-eight session of the Commission on Social Development, A/68/167.
xii World Population Ageing 2013
In addition to the core demographic aspects of population ageing, the present edition of World Population Ageing introduces new sections and information on trends in the economic support ratio, the demographic dividend, independent living among older persons, international differences in the main causes of deaths among older persons, in health expenditures, intergenerational transfers, the sources of financial support in old age, and the prevalence of poverty among older people in different regions of the world.
This report includes the following major findings:
1. Population ageing is taking place in nearly all the countries of the world. Ageing results from decreasing mortality, and, most importantly, declining fertility. This process leads to a relative reduction in the proportion of children and to an increase in the share of people in the main working ages and of older persons in the population. The global share of older people (aged 60 years or over) increased from 9.2 per cent in 1990 to 11.7 per cent in 2013 and will continue to grow as a proportion of the world population, reaching 21.1 per cent by 2050.
2. Globally, the number of older persons (aged 60 years or over) is expected to more than double, from 841 million people in 2013 to more than 2 billion in 2050. Older persons are projected to exceed the number of children for the first time in 2047. Presently, about two thirds of the world’s older persons live in developing countries. Because the older population in less developed regions is growing faster than in the more developed regions, the projections show that older persons will be increasingly concentrated in the less developed regions of the world. By 2050, nearly 8 in 10 of the world’s older population will live in the less developed regions.
3. Population ageing has major social and economic consequences. The old-age support ratios
(number of working-age adults per older person in the population) are already low in the more developed regions and in some developing countries, and are expected to continue to fall in the coming decades with ensuing fiscal pressures on support systems for older persons. In a number of developing countries, poverty is high among older persons, sometimes higher than that of the population as a whole, especially in countries with limited coverage of social security systems. While people are living longer lives almost everywhere, the prevalence of non-communicable diseases and disability increase as populations age.
4. On the positive side, population ageing and the increased prevalence of non-communicable diseases
originate in the mostly positive trends of drastically reduced child and adult mortality, and declining fertility. Also, older persons can increasingly live independently (alone or with their spouse only), and in most countries, they support themselves financially with their own labour earnings, income from their assets, and through public transfers. In most countries with pertinent data, older persons make net financial contributions to younger family members until rather advanced ages.
5. Most developed countries already have aged populations. By contrast, a large number of developing
countries are projected to experience high and increasing economic support ratios for years or decades to come, and can therefore benefit significantly from the “demographic dividend,” provided that appropriate labour market and other policies allow for a productive absorption of the growing working-age population and for increased investments in the human capital of children and youth.
United Nations Department of Economic and Social Affairs ǀ Population Division xiii
Other specific findings are: The older population is itself ageing. Globally, the share of older persons aged 80 years or over (the
“oldest old”) within the older population was 14 per cent in 2013 and is projected to reach 19 per cent in 2050. If this projection is realized, there will be 392 million persons aged 80 years or over by 2050, more than three times the present.
The older population is predominantly female. Because women tend to live longer than men, older
women outnumber older men almost everywhere. In 2013, globally, there were 85 men per 100 women in the age group 60 years or over and 61 men per 100 women in the age group 80 years or over. These sex ratios are expected to increase moderately during the next several decades, reflecting a slightly faster projected improvement in old-age mortality among males than among females.
Globally, 40 per cent of older persons aged 60 years or over live independently, that is to say, alone
or with their spouse only. Independent living is far more common in the developed countries, where about three quarters of older persons live independently, compared with only a quarter in developing countries and one eighth in the least developed countries. As countries develop and their populations continue to age, living alone or with a spouse only will likely become much more common among older people in the future.
Many older persons still need to work, especially in developing countries. In 2010, the labour force
participation of persons aged 65 years or over was around 31 per cent in the less developed regions and 8 per cent in the more developed regions. Labour force participation among older men is decreasing in the less developed regions, but it is increasing in the more developed regions. In both development groups, despite their numerical disadvantage, men made up a large majority of the total labour force among older persons.
The labour earnings of older persons are an important source of economic support in old age,
especially in developing countries. Public transfers are a major source of old-age support in developed countries and in some developing countries with substantial social security coverage, while income from their own assets finances another substantial part of the consumption of older persons, especially in countries with less expansive public transfer systems. In most countries with available data, older persons are net givers of familial transfers.
In much of Africa, the prevalence of poverty among older persons is either lower or only slightly
higher than the total population average, while in Latin America the prevalence of poverty among the older population varies widely, from levels much lower than average in countries of the Southern Cone, to significantly higher than average in some Central American countries. Although older persons in most countries of the Organisation of Economic Co-operation and Development (OECD) are well covered by social protection systems, the poverty rate of older persons tends to be higher than the population average.

United Nations Department of Economic and Social Affairs ǀ Population Division 1
Introduction
The world population has been experiencing significant ageing―the process that results in rising proportions of older persons in the total population―since the mid-twentieth century. Ageing had started earlier in the more developed regions and was beginning to take place in some developing countries and was becoming more evident at the global scale around the time of the International Conference on Population and Development took place in 1994 in Cairo, Egypt. Population ageing was further advanced by the Second World Assembly on Ageing, which took place in Madrid, Spain, in 2002, and the demographic projections at that time evidenced an unmistakeable trend of continued ageing, which would no doubt consolidate during the twenty-first century. As this report makes clear, however, the intensity and depth of ageing will vary considerably among countries and regions.
Ageing has profound consequences on a broad range of economic, political and social
processes. First and foremost is the increasing priority to promoting the well-being of the growing number and proportion of older persons in most countries of the world. Indeed, the Madrid International Plan of Action (MIPAA), adopted at the Second World Assembly on Ageing, emphasized that older persons should be able to participate in and benefit equitably from the fruits of development to advance their health and well-being, and that societies should provide enabling environments for them to do so.
While much attention has been given to the fiscal and macro-economic challenges
represented by population ageing, which governments must certainly confront and prepare for, MIPAA also recognized the crucial importance of intergenerational interdependence, which needs to be redefined as the population distribution shifts to more older persons and relatively fewer children. Ageing also entails a change in the sex composition of the population, since women tend to outlive men and therefore constitute a substantial majority of the older population. As fertility has fallen, women’s labour force participation has been globally on the rise, although women still engage less than men in paid work. At the same time, women play a key role as providers of family support and care for all generational groups, especially children and older persons.
Ageing is also partly the result of the trend toward longer and generally healthier lives of
individuals, but because chronic and degenerative diseases are more common at older ages, they result in an increased prevalence of non-communicable diseases at the population level. Last but not least, as societies age, they also bring about changes in the living arrangements of older people vis-à-vis younger family members, and in the private and public systems of economic support for children, adults, and most critically, older persons.
This report begins with an overview of population ageing from a global perspective, starting
with a discussion on the demographic determinants of ageing (chapter 1), namely, declining fertility and rising life expectancy, and presenting the basic trends in the extent and speed of ageing in different regions of the world. Chapter 2 reviews the changing balance of major age groups, and shows global and regional trends in child and old-age dependency ratios, as well as in aggregate economic support ratios. Chapter 3 gives a demographic profile of the older
2 World Population Ageing 2013
population, including the age distribution within the older population, and the sex ratio and the living arrangements of older persons.
Selected characteristics of the older population are examined in chapter 4, starting with
trends in the distribution of deaths by age and the major causes of death. The chapter also includes a discussion of international differences in health expenditures, labour force participation of older persons and ages at retirement. Chapter 5 uses data from National Transfer Accounts to discuss intergenerational transfers and well-being in old-age, distinguishing the major sources of economic support of older persons labour income, public transfers (which include pensions, public health and spending in other programmes), private transfers and asset reallocations. This chapter also includes a review of the available evidence on the prevalence of poverty among older persons, as compared with poverty rates of the total population. A final section of the report gives brief concluding remarks.
Annex I gives the definitions of the indicators of ageing used in this report and Annex II
provides a list of countries or territories by major areas and regions. Annex III presents summary tables on the older population and selected ageing indicators for individual countries, development regions and major areas, drawn from the latest United Nations demographic estimates and projection, namely, the data of World Population Prospects: The 2012 Revision (United Nations, Department of Economic and Social Affairs, Population Division, 2013).

United Nations Department of Economic and Social Affairs ǀ Population Division 3
I. Demographic determinants and speed of population ageing
Population ageing, which entails an increasing share of older persons in the population, is a major global demographic trend which will intensify during the twenty-first century. For statistical purposes, and unless otherwise specified, in this report older persons are considered to be those aged 60 years or older. Ageing results from the demographic transition, a process whereby reductions in mortality are followed by reductions in fertility. Together, these reductions eventually lead to smaller proportions of children and larger proportionate shares of older people in the population. Ageing is taking place almost everywhere, but its extent and speed vary. In most developed countries, the population has been ageing for many decades, while in developing countries, population ageing has taken place relatively recently, as their mortality and fertility levels have fallen. Currently, the most aged populations are in the developed countries, but the majority of older persons reside in developing countries. Given that the rate of growth of the older population in developing countries is significantly higher than in developed countries, the older population of the world will increasingly be concentrated in the less developed regions. Ageing is a dynamic process, determined by the relative size of the younger and older cohorts in the population at different moments in time. The initial size of each cohort depends on the population in childbearing ages at a given point in time, and the prevalent fertility rates. Mortality rates determine the number of people of each cohort that survives to old-age. Migration may also affect ageing in different ways, although its actual impact at the national level is usually small.8
A. REDUCTION IN FERTILITY AND THE SIZE OF BIRTH COHORTS According to data from World Population Prospects: the 2012 Revision (United Nations, Department of Economic and Social Affairs, 2013), fertility has been falling in most regions of the world over the last several decades, and this decline has been the main factor driving population ageing. The world’s total fertility rate (TFR) has dropped by about a half, from 5.0 children per woman in 1950-1955 to 2.5 children per woman in 2010-2015 (figure 1.1). These declining fertility rates were also previously reported by the United Nations Population Fund (UNFPA) and HelpAge International (2012). The decline in global fertility will continue during the coming decades. The global TFR will fall to 2.2 in 2045-2050 under the “medium” projection variant, or to 1.8 children per woman under the “low” variant. The faster the speed of fertility decline, the more rapidly ageing will take place. Fertility is projected to continue to decline in the less developed regions Most countries of the world experienced declining fertility during the last decades, and because the reductions were generally faster in the less developed regions, the gap in fertility
8 Massive out-migration may significantly reduce the size of youth cohorts, which can intensify population ageing, or large immigrations may swell the youth cohorts in countries of destination, thereby attenuating the pace of ageing to some extent.
4 World Population Ageing 2013
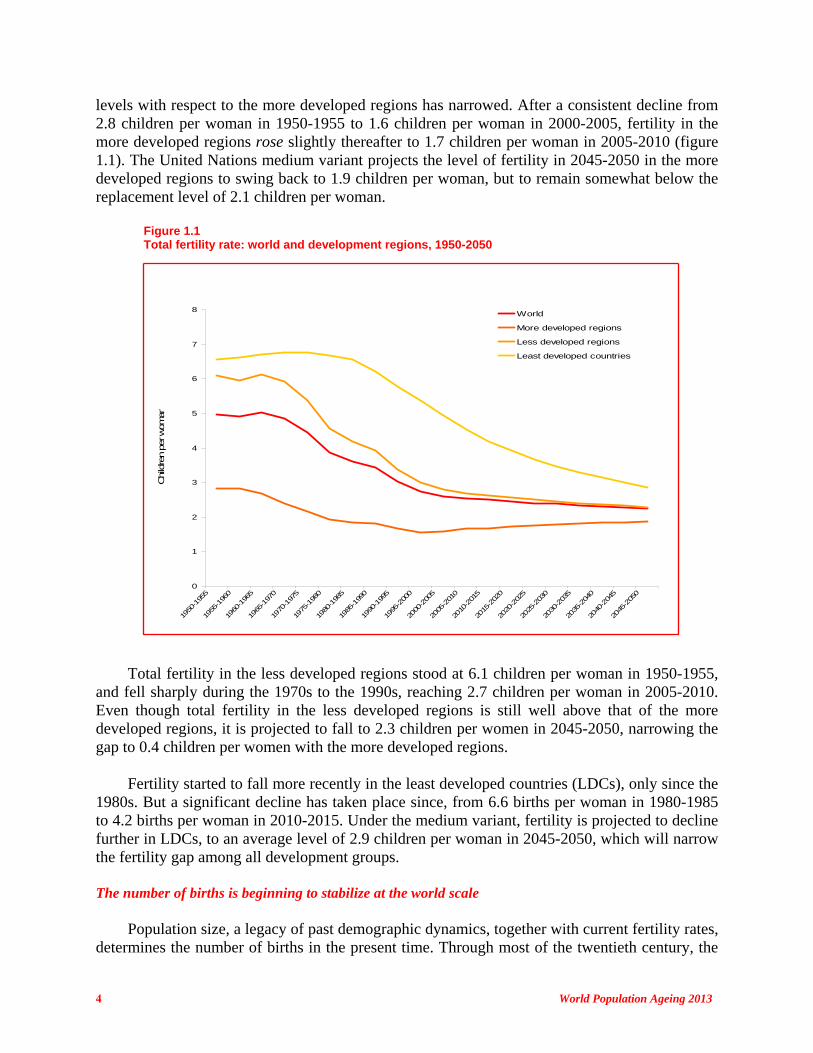
levels with respect to the more developed regions has narrowed. After a consistent decline from 2.8 children per woman in 1950-1955 to 1.6 children per woman in 2000-2005, fertility in the more developed regions rose slightly thereafter to 1.7 children per woman in 2005-2010 (figure 1.1). The United Nations medium variant projects the level of fertility in 2045-2050 in the more developed regions to swing back to 1.9 children per woman, but to remain somewhat below the replacement level of 2.1 children per woman.
Figure 1.1 Total fertility rate: world and development regions, 1950-2050
0
1
2
3
4
5
6
7
8
1950
-195
5
1955
-196
0
1960
-196
5
1965
-197
0
1970
-197
5
1975
-198
0
1980
-198
5
1985
-199
0
1990
-199
5
1995
-200
0
2000
-200
5
2005
-201
0
2010
-201
5
2015
-202
0
2020
-202
5
2025
-203
0
2030
-203
5
2035
-204
0
2040
-204
5
2045
-205
0
Child
ren p
er wom
an
World
More developed regions
Less developed regions
Least developed countries
Total fertility in the less developed regions stood at 6.1 children per woman in 1950-1955, and fell sharply during the 1970s to the 1990s, reaching 2.7 children per woman in 2005-2010. Even though total fertility in the less developed regions is still well above that of the more developed regions, it is projected to fall to 2.3 children per women in 2045-2050, narrowing the gap to 0.4 children per women with the more developed regions. Fertility started to fall more recently in the least developed countries (LDCs), only since the 1980s. But a significant decline has taken place since, from 6.6 births per woman in 1980-1985 to 4.2 births per woman in 2010-2015. Under the medium variant, fertility is projected to decline further in LDCs, to an average level of 2.9 children per woman in 2045-2050, which will narrow the fertility gap among all development groups. The number of births is beginning to stabilize at the world scale Population size, a legacy of past demographic dynamics, together with current fertility rates, determines the number of births in the present time. Through most of the twentieth century, the
United Nations Department of Economic and Social Affairs ǀ Population Division 5
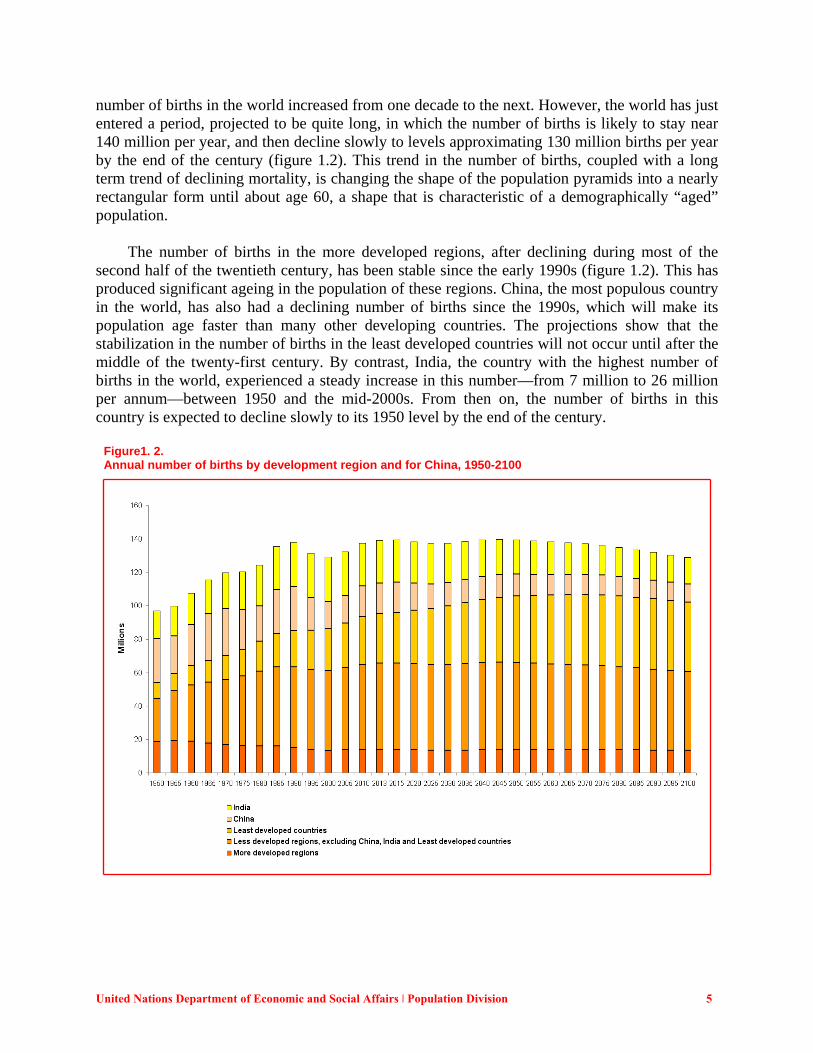
number of births in the world increased from one decade to the next. However, the world has just entered a period, projected to be quite long, in which the number of births is likely to stay near 140 million per year, and then decline slowly to levels approximating 130 million births per year by the end of the century (figure 1.2). This trend in the number of births, coupled with a long term trend of declining mortality, is changing the shape of the population pyramids into a nearly rectangular form until about age 60, a shape that is characteristic of a demographically “aged” population. The number of births in the more developed regions, after declining during most of the second half of the twentieth century, has been stable since the early 1990s (figure 1.2). This has produced significant ageing in the population of these regions. China, the most populous country in the world, has also had a declining number of births since the 1990s, which will make its population age faster than many other developing countries. The projections show that the stabilization in the number of births in the least developed countries will not occur until after the middle of the twenty-first century. By contrast, India, the country with the highest number of births in the world, experienced a steady increase in this number—from 7 million to 26 million per annum—between 1950 and the mid-2000s. From then on, the number of births in this country is expected to decline slowly to its 1950 level by the end of the century.
Figure1. 2. Annual number of births by development region and for China, 1950-2100
6 World Population Ageing 2013
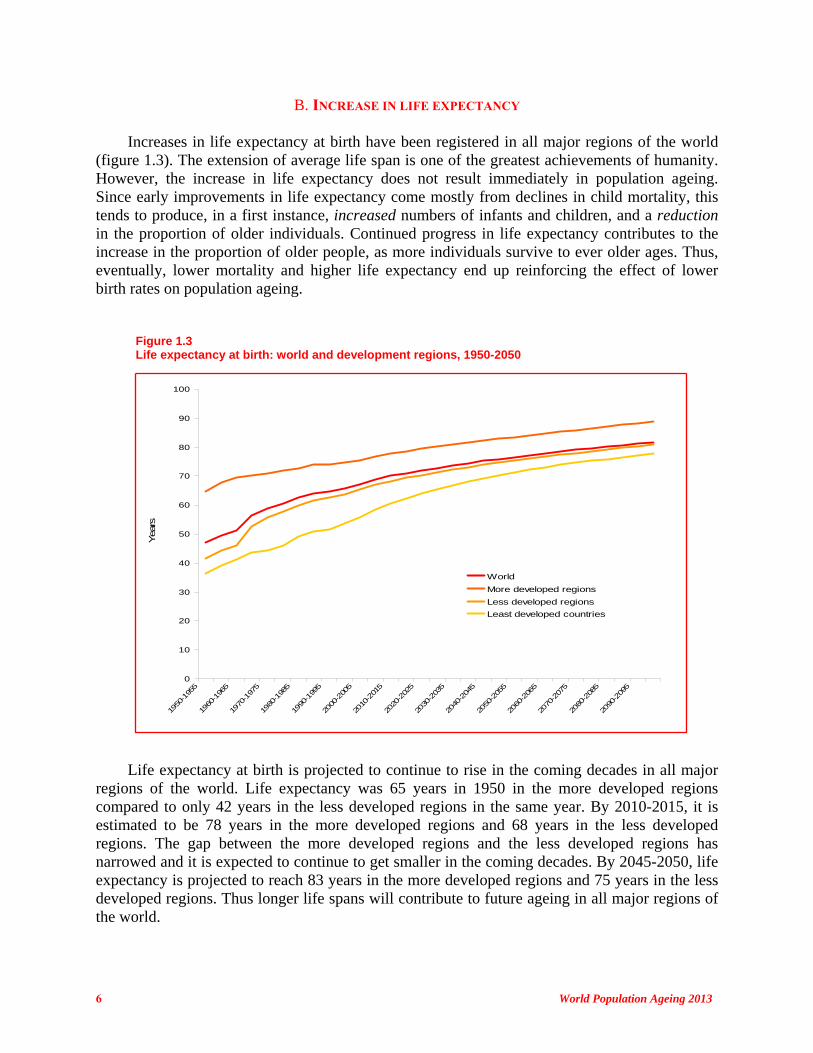
B. INCREASE IN LIFE EXPECTANCY Increases in life expectancy at birth have been registered in all major regions of the world (figure 1.3). The extension of average life span is one of the greatest achievements of humanity. However, the increase in life expectancy does not result immediately in population ageing. Since early improvements in life expectancy come mostly from declines in child mortality, this tends to produce, in a first instance, increased numbers of infants and children, and a reduction in the proportion of older individuals. Continued progress in life expectancy contributes to the increase in the proportion of older people, as more individuals survive to ever older ages. Thus, eventually, lower mortality and higher life expectancy end up reinforcing the effect of lower birth rates on population ageing.
Figure 1.3 Life expectancy at birth: world and development regions, 1950-2050
0
10
20
30
40
50
60
70
80
90
100
1950
-195
5
1960
-196
5
1970
-197
5
1980
-198
5
1990
-199
5
2000
-200
5
2010
-201
5
2020
-202
5
2030
-203
5
2040
-204
5
2050
-205
5
2060
-206
5
2070
-207
5
2080
-208
5
2090
-209
5
Years
World
More developed regions
Less developed regions
Least developed countries
Life expectancy at birth is projected to continue to rise in the coming decades in all major regions of the world. Life expectancy was 65 years in 1950 in the more developed regions compared to only 42 years in the less developed regions in the same year. By 2010-2015, it is estimated to be 78 years in the more developed regions and 68 years in the less developed regions. The gap between the more developed regions and the less developed regions has narrowed and it is expected to continue to get smaller in the coming decades. By 2045-2050, life expectancy is projected to reach 83 years in the more developed regions and 75 years in the less developed regions. Thus longer life spans will contribute to future ageing in all major regions of the world.
United Nations Department of Economic and Social Affairs ǀ Population Division 7
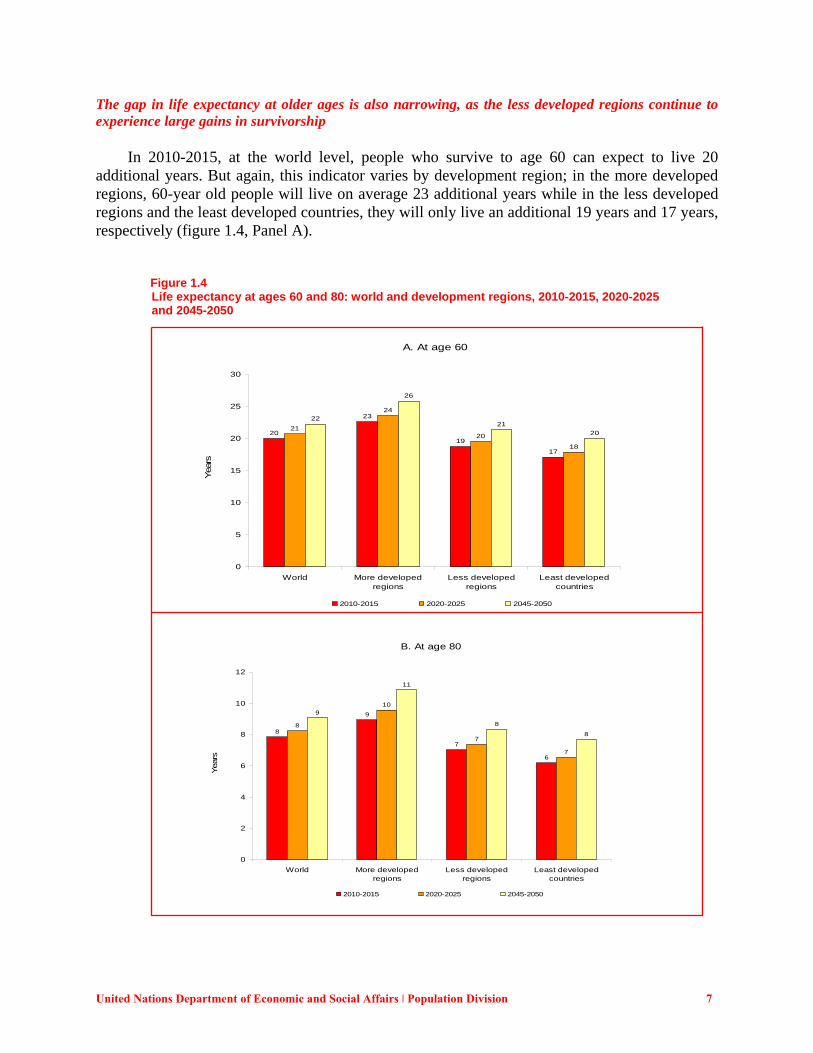
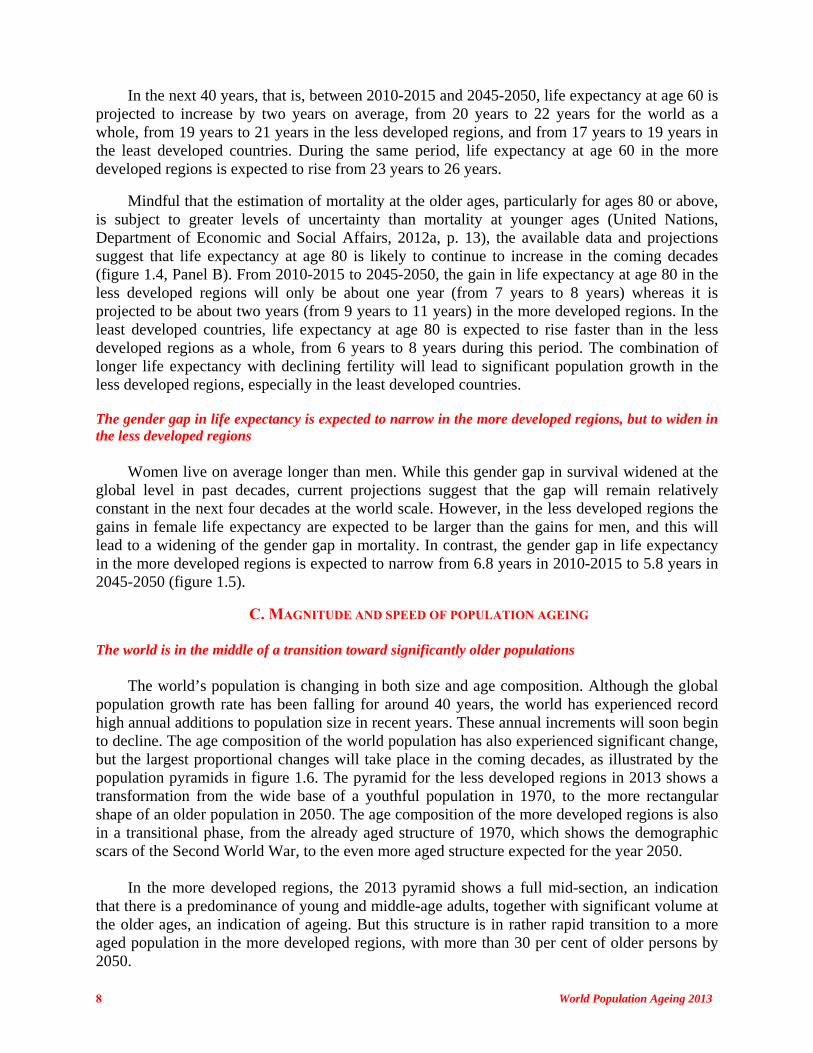
The gap in life expectancy at older ages is also narrowing, as the less developed regions continue to experience large gains in survivorship In 2010-2015, at the world level, people who survive to age 60 can expect to live 20 additional years. But again, this indicator varies by development region; in the more developed regions, 60-year old people will live on average 23 additional years while in the less developed regions and the least developed countries, they will only live an additional 19 years and 17 years, respectively (figure 1.4, Panel A). Figure 1.4
Life expectancy at ages 60 and 80: world and development regions, 2010-2015, 2020-2025 and 2045-2050
A. At age 60
20
23
19
17
21
24
20
18
22
26
21
20
0
5
10
15
20
25
30
World More developedregions
Less developedregions
Least developedcountries
Yea
rs
2010-2015 2020-2025 2045-2050
B. At age 80
8
9
7
6
8
10
7
7
9
11
8
8
0
2
4
6
8
10
12
World More developedregions
Less developedregions
Least developedcountries
Years
2010-2015 2020-2025 2045-2050
8 World Population Ageing 2013
In the next 40 years, that is, between 2010-2015 and 2045-2050, life expectancy at age 60 is projected to increase by two years on average, from 20 years to 22 years for the world as a whole, from 19 years to 21 years in the less developed regions, and from 17 years to 19 years in the least developed countries. During the same period, life expectancy at age 60 in the more developed regions is expected to rise from 23 years to 26 years.
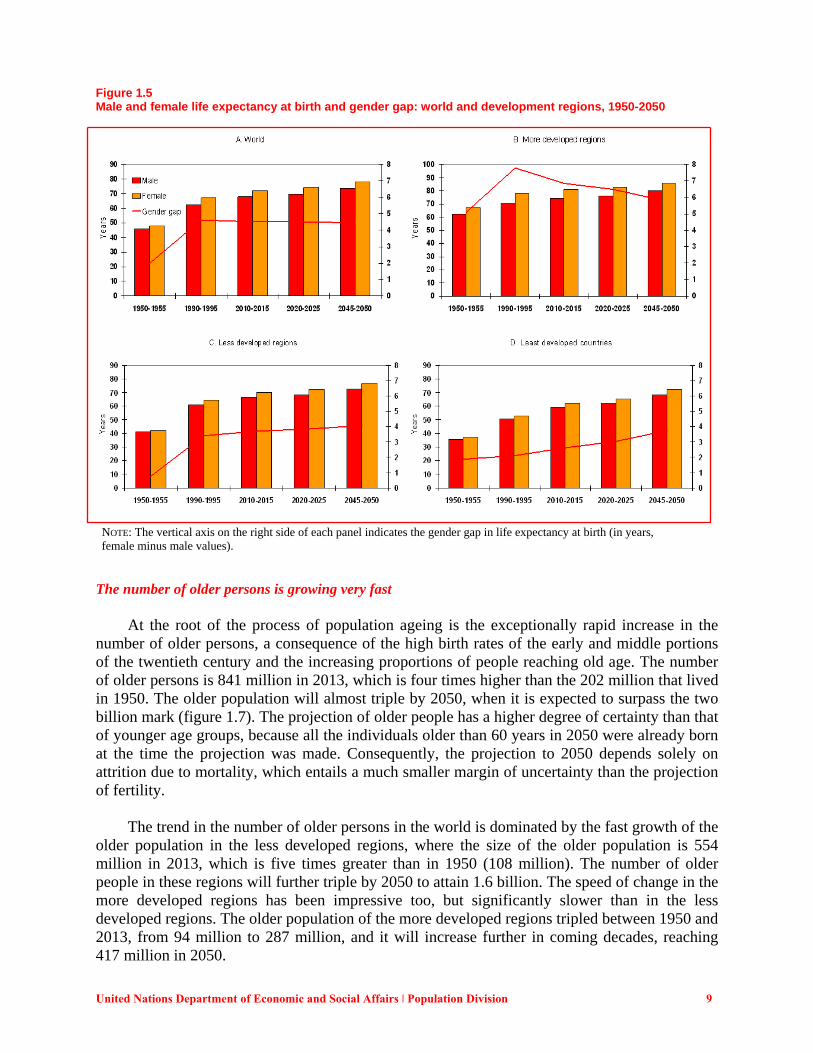
Mindful that the estimation of mortality at the older ages, particularly for ages 80 or above, is subject to greater levels of uncertainty than mortality at younger ages (United Nations, Department of Economic and Social Affairs, 2012a, p. 13), the available data and projections suggest that life expectancy at age 80 is likely to continue to increase in the coming decades (figure 1.4, Panel B). From 2010-2015 to 2045-2050, the gain in life expectancy at age 80 in the less developed regions will only be about one year (from 7 years to 8 years) whereas it is projected to be about two years (from 9 years to 11 years) in the more developed regions. In the least developed countries, life expectancy at age 80 is expected to rise faster than in the less developed regions as a whole, from 6 years to 8 years during this period. The combination of longer life expectancy with declining fertility will lead to significant population growth in the less developed regions, especially in the least developed countries. The gender gap in life expectancy is expected to narrow in the more developed regions, but to widen in the less developed regions Women live on average longer than men. While this gender gap in survival widened at the global level in past decades, current projections suggest that the gap will remain relatively constant in the next four decades at the world scale. However, in the less developed regions the gains in female life expectancy are expected to be larger than the gains for men, and this will lead to a widening of the gender gap in mortality. In contrast, the gender gap in life expectancy in the more developed regions is expected to narrow from 6.8 years in 2010-2015 to 5.8 years in 2045-2050 (figure 1.5).
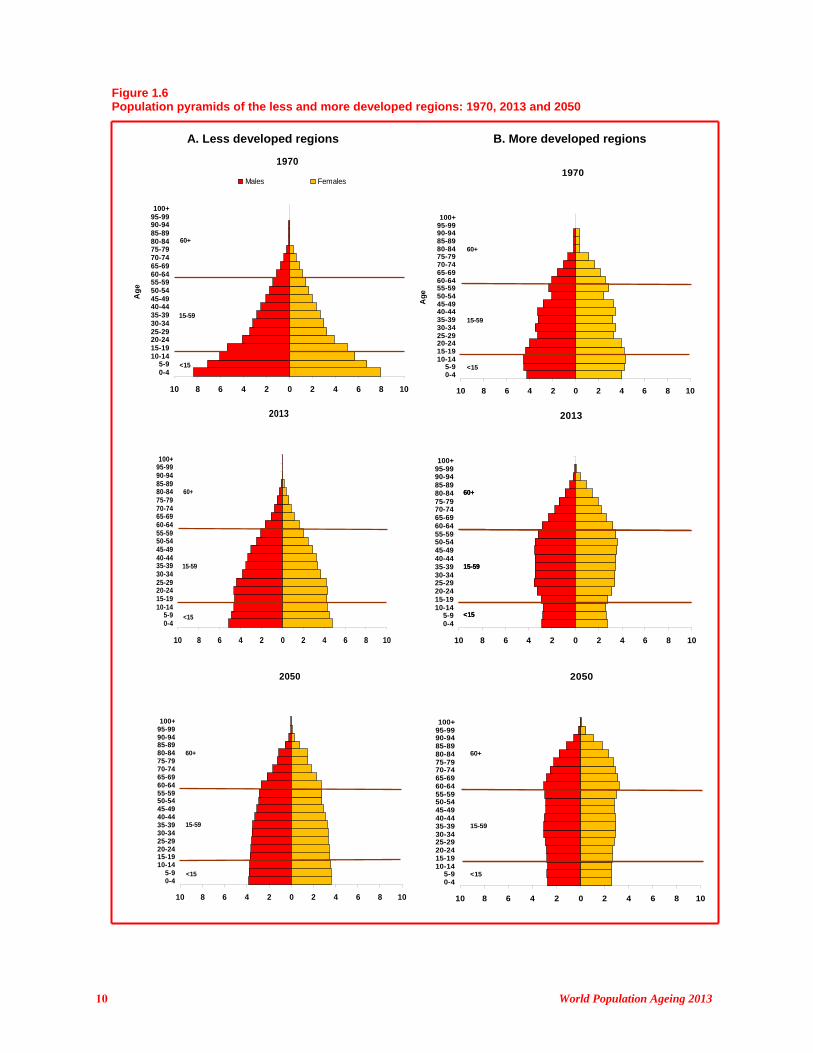
C. MAGNITUDE AND SPEED OF POPULATION AGEING The world is in the middle of a transition toward significantly older populations The world’s population is changing in both size and age composition. Although the global population growth rate has been falling for around 40 years, the world has experienced record high annual additions to population size in recent years. These annual increments will soon begin to decline. The age composition of the world population has also experienced significant change, but the largest proportional changes will take place in the coming decades, as illustrated by the population pyramids in figure 1.6. The pyramid for the less developed regions in 2013 shows a transformation from the wide base of a youthful population in 1970, to the more rectangular shape of an older population in 2050. The age composition of the more developed regions is also in a transitional phase, from the already aged structure of 1970, which shows the demographic scars of the Second World War, to the even more aged structure expected for the year 2050. In the more developed regions, the 2013 pyramid shows a full mid-section, an indication that there is a predominance of young and middle-age adults, together with significant volume at the older ages, an indication of ageing. But this structure is in rather rapid transition to a more aged population in the more developed regions, with more than 30 per cent of older persons by 2050.
United Nations Department of Economic and Social Affairs ǀ Population Division 9
Figure 1.5 Male and female life expectancy at birth and gender gap: world and development regions, 1950-2050
NOTE: The vertical axis on the right side of each panel indicates the gender gap in life expectancy at birth (in years, female minus male values).
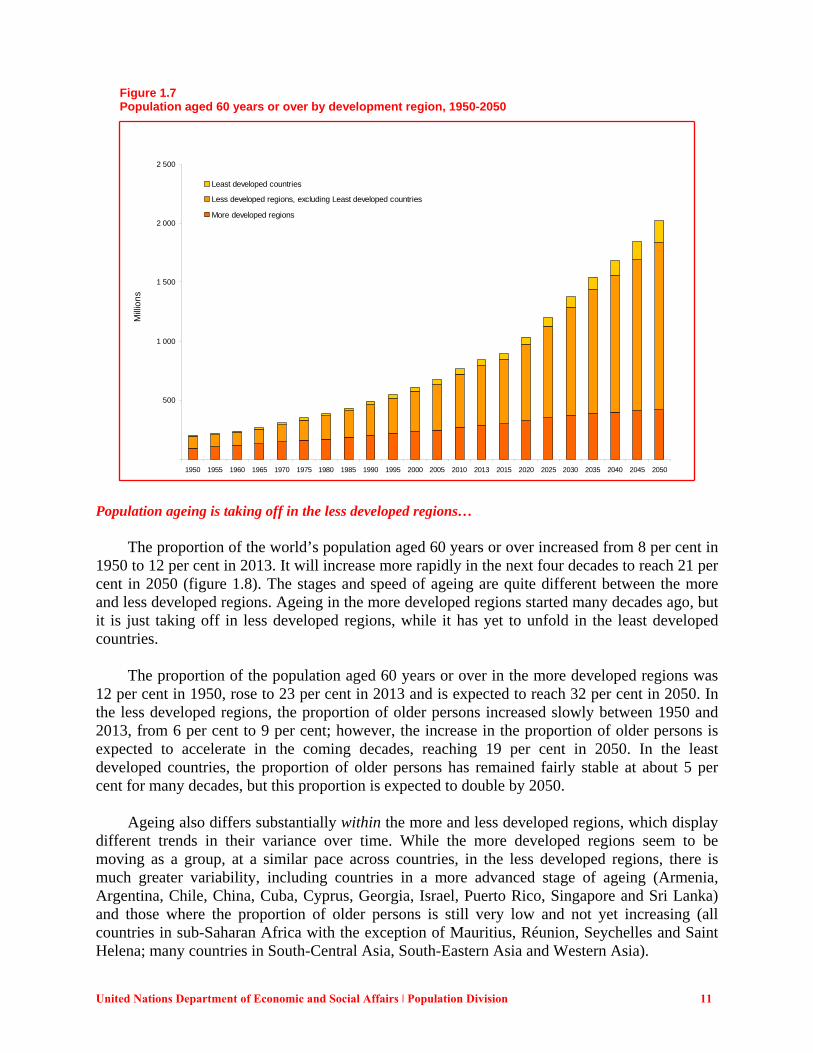
The number of older persons is growing very fast At the root of the process of population ageing is the exceptionally rapid increase in the number of older persons, a consequence of the high birth rates of the early and middle portions of the twentieth century and the increasing proportions of people reaching old age. The number of older persons is 841 million in 2013, which is four times higher than the 202 million that lived in 1950. The older population will almost triple by 2050, when it is expected to surpass the two billion mark (figure 1.7). The projection of older people has a higher degree of certainty than that of younger age groups, because all the individuals older than 60 years in 2050 were already born at the time the projection was made. Consequently, the projection to 2050 depends solely on attrition due to mortality, which entails a much smaller margin of uncertainty than the projection of fertility. The trend in the number of older persons in the world is dominated by the fast growth of the older population in the less developed regions, where the size of the older population is 554 million in 2013, which is five times greater than in 1950 (108 million). The number of older people in these regions will further triple by 2050 to attain 1.6 billion. The speed of change in the more developed regions has been impressive too, but significantly slower than in the less developed regions. The older population of the more developed regions tripled between 1950 and 2013, from 94 million to 287 million, and it will increase further in coming decades, reaching 417 million in 2050.
10 World Population Ageing 2013
Figure 1.6 Population pyramids of the less and more developed regions: 1970, 2013 and 2050
A. Less developed regions
B. More developed regions
1970
10 8 6 4 2 0 2 4 6 8 10
0-45-9
10-1415-1920-2425-2930-3435-3940-4445-4950-5455-5960-6465-6970-7475-7980-8485-8990-9495-99100+
Ag
e
Males Females
<15
15-59
60+
1970
10 8 6 4 2 0 2 4 6 8 10
0-45-9
10-1415-1920-2425-2930-3435-3940-4445-4950-5455-5960-6465-6970-7475-7980-8485-8990-9495-99100+
Ag
e
<15
15-59
60+
2013
10 8 6 4 2 0 2 4 6 8 10
0-45-9
10-1415-1920-2425-2930-3435-3940-4445-4950-5455-5960-6465-6970-7475-7980-8485-8990-9495-99100+
<15
15-59
60+
2013
10 8 6 4 2 0 2 4 6 8 10
0-45-9
10-1415-1920-2425-2930-3435-3940-4445-4950-5455-5960-6465-6970-7475-7980-8485-8990-9495-99100+
<15
15-59
60+
<15
15-59
60+
2050
10 8 6 4 2 0 2 4 6 8 10
0-45-9
10-1415-1920-2425-2930-3435-3940-4445-4950-5455-5960-6465-6970-7475-7980-8485-8990-9495-99100+
<15
15-59
60+
2050
10 8 6 4 2 0 2 4 6 8 10
0-45-9
10-1415-1920-2425-2930-3435-3940-4445-4950-5455-5960-6465-6970-7475-7980-8485-8990-9495-99100+
60+
15-59
<15
United Nations Department of Economic and Social Affairs ǀ Population Division 11
Figure 1.7 Population aged 60 years or over by development region, 1950-2050
500
1 000
1 500
2 000
2 500
1950 1955 1960 1965 1970 1975 1980 1985 1990 1995 2000 2005 2010 2013 2015 2020 2025 2030 2035 2040 2045 2050
Mill
ion
s
Least developed countries
Less developed regions, excluding Least developed countries
More developed regions
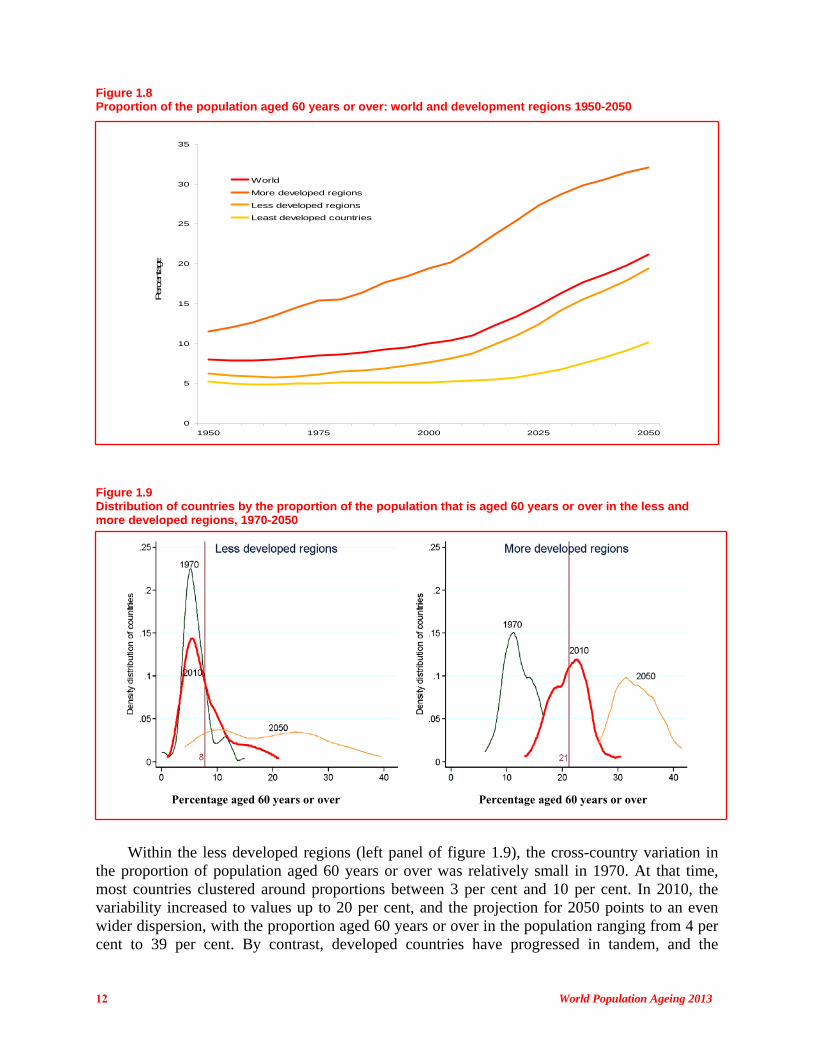
Population ageing is taking off in the less developed regions… The proportion of the world’s population aged 60 years or over increased from 8 per cent in 1950 to 12 per cent in 2013. It will increase more rapidly in the next four decades to reach 21 per cent in 2050 (figure 1.8). The stages and speed of ageing are quite different between the more and less developed regions. Ageing in the more developed regions started many decades ago, but it is just taking off in less developed regions, while it has yet to unfold in the least developed countries. The proportion of the population aged 60 years or over in the more developed regions was 12 per cent in 1950, rose to 23 per cent in 2013 and is expected to reach 32 per cent in 2050. In the less developed regions, the proportion of older persons increased slowly between 1950 and 2013, from 6 per cent to 9 per cent; however, the increase in the proportion of older persons is expected to accelerate in the coming decades, reaching 19 per cent in 2050. In the least developed countries, the proportion of older persons has remained fairly stable at about 5 per cent for many decades, but this proportion is expected to double by 2050. Ageing also differs substantially within the more and less developed regions, which display different trends in their variance over time. While the more developed regions seem to be moving as a group, at a similar pace across countries, in the less developed regions, there is much greater variability, including countries in a more advanced stage of ageing (Armenia, Argentina, Chile, China, Cuba, Cyprus, Georgia, Israel, Puerto Rico, Singapore and Sri Lanka) and those where the proportion of older persons is still very low and not yet increasing (all countries in sub-Saharan Africa with the exception of Mauritius, Réunion, Seychelles and Saint Helena; many countries in South-Central Asia, South-Eastern Asia and Western Asia).
12 World Population Ageing 2013
Figure 1.8 Proportion of the population aged 60 years or over: world and development regions 1950-2050
0
5
10
15
20
25
30
35
1950 1975 2000 2025 2050
Percenta
ge
World
More developed regions
Less developed regions
Least developed countries
Figure 1.9 Distribution of countries by the proportion of the population that is aged 60 years or over in the less and more developed regions, 1970-2050
Percentage aged 60 years or over Percentage aged 60 years or over
Within the less developed regions (left panel of figure 1.9), the cross-country variation in the proportion of population aged 60 years or over was relatively small in 1970. At that time, most countries clustered around proportions between 3 per cent and 10 per cent. In 2010, the variability increased to values up to 20 per cent, and the projection for 2050 points to an even wider dispersion, with the proportion aged 60 years or over in the population ranging from 4 per cent to 39 per cent. By contrast, developed countries have progressed in tandem, and the
United Nations Department of Economic and Social Affairs ǀ Population Division 13
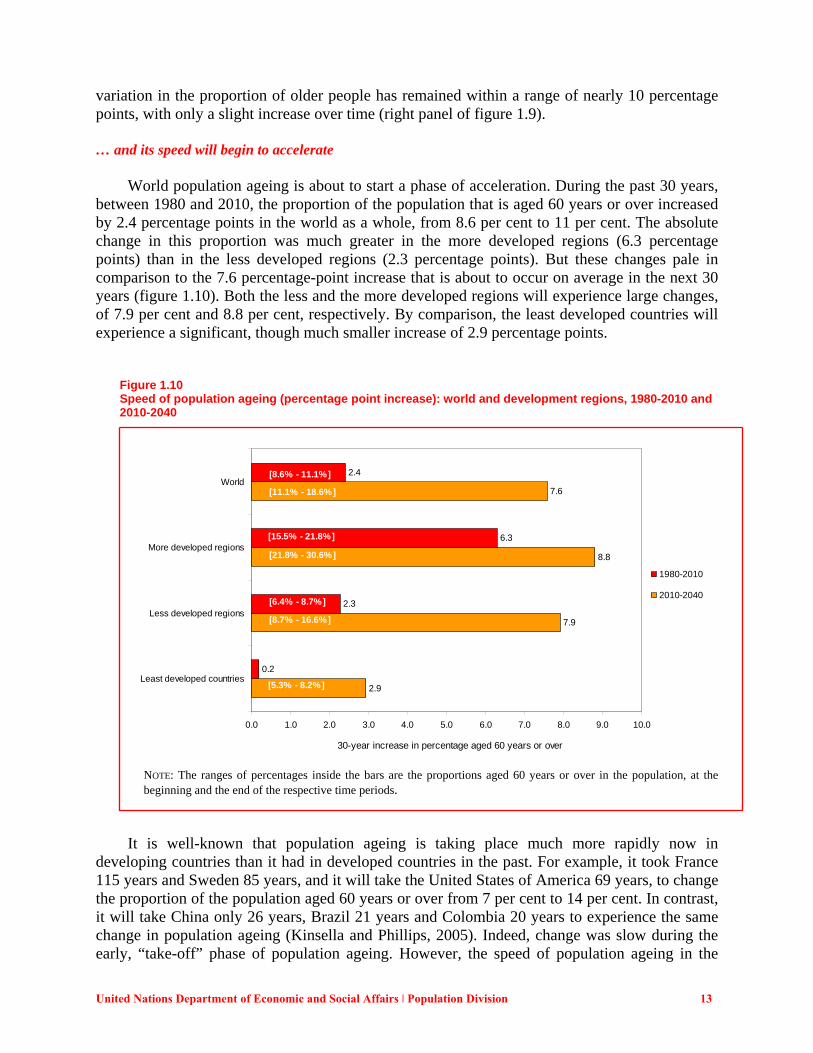
variation in the proportion of older people has remained within a range of nearly 10 percentage points, with only a slight increase over time (right panel of figure 1.9). … and its speed will begin to accelerate World population ageing is about to start a phase of acceleration. During the past 30 years, between 1980 and 2010, the proportion of the population that is aged 60 years or over increased by 2.4 percentage points in the world as a whole, from 8.6 per cent to 11 per cent. The absolute change in this proportion was much greater in the more developed regions (6.3 percentage points) than in the less developed regions (2.3 percentage points). But these changes pale in comparison to the 7.6 percentage-point increase that is about to occur on average in the next 30 years (figure 1.10). Both the less and the more developed regions will experience large changes, of 7.9 per cent and 8.8 per cent, respectively. By comparison, the least developed countries will experience a significant, though much smaller increase of 2.9 percentage points.
Figure 1.10 Speed of population ageing (percentage point increase): world and development regions, 1980-2010 and 2010-2040
NOTE: The ranges of percentages inside the bars are the proportions aged 60 years or over in the population, at the beginning and the end of the respective time periods.
It is well-known that population ageing is taking place much more rapidly now in developing countries than it had in developed countries in the past. For example, it took France 115 years and Sweden 85 years, and it will take the United States of America 69 years, to change the proportion of the population aged 60 years or over from 7 per cent to 14 per cent. In contrast, it will take China only 26 years, Brazil 21 years and Colombia 20 years to experience the same change in population ageing (Kinsella and Phillips, 2005). Indeed, change was slow during the early, “take-off” phase of population ageing. However, the speed of population ageing in the
2.9
7.9
8.8
7.6
0.2
2.3
6.3
2.4
0.0 1.0 2.0 3.0 4.0 5.0 6.0 7.0 8.0 9.0 10.0
Least developed countries
Less developed regions
More developed regions
World
30-year increase in percentage aged 60 years or over
1980-2010
2010-2040
[15.5% - 21.8%]
[21.8% - 30.6%]
[6.4% - 8.7%]
[8.7% - 16.6%]
[5.3% - 8.2%]
[8.6% - 11.1%]
[11.1% - 18.6%]
14 World Population Ageing 2013
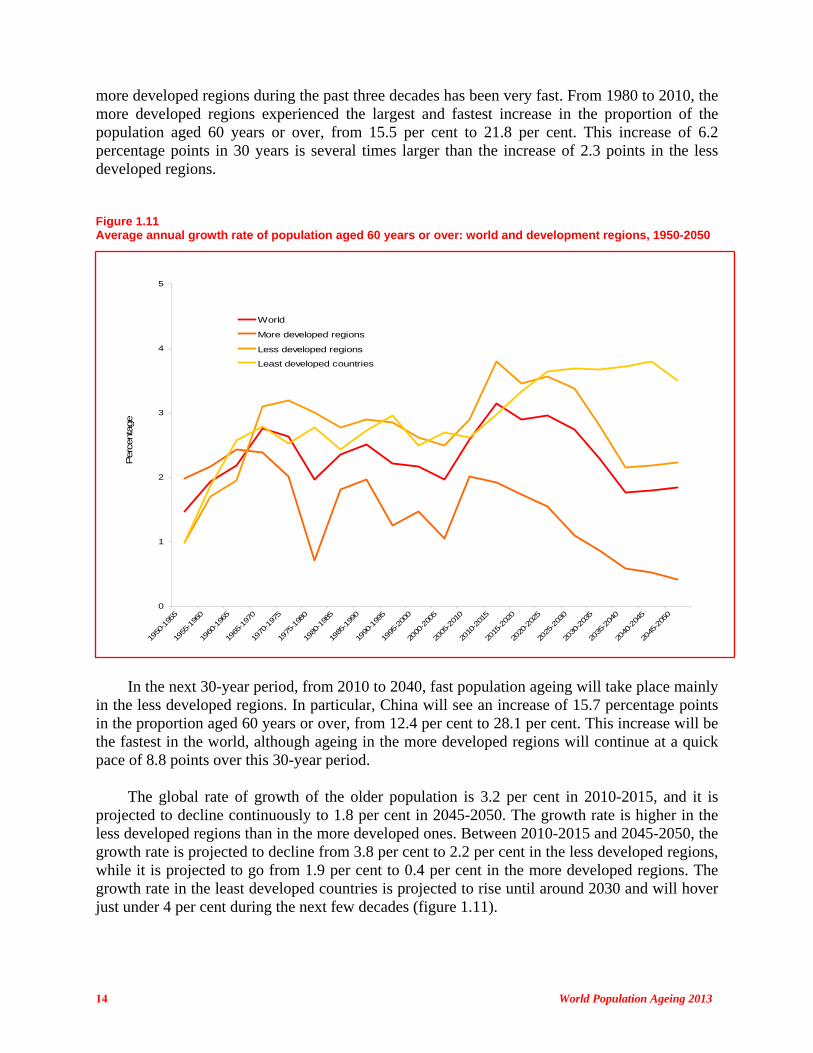
more developed regions during the past three decades has been very fast. From 1980 to 2010, the more developed regions experienced the largest and fastest increase in the proportion of the population aged 60 years or over, from 15.5 per cent to 21.8 per cent. This increase of 6.2 percentage points in 30 years is several times larger than the increase of 2.3 points in the less developed regions. Figure 1.11 Average annual growth rate of population aged 60 years or over: world and development regions, 1950-2050
0
1
2
3
4
5
1950
-195
5
1955
-196
0
1960
-196
5
1965
-197
0
1970
-197
5
1975
-198
0
1980
-198
5
1985
-199
0
1990
-199
5
1995
-200
0
2000
-200
5
2005
-201
0
2010
-201
5
2015
-202
0
2020
-202
5
2025
-203
0
2030
-203
5
2035
-204
0
2040
-204
5
2045
-205
0
Perc
enta
ge
World
More developed regions
Less developed regions
Least developed countries
In the next 30-year period, from 2010 to 2040, fast population ageing will take place mainly in the less developed regions. In particular, China will see an increase of 15.7 percentage points in the proportion aged 60 years or over, from 12.4 per cent to 28.1 per cent. This increase will be the fastest in the world, although ageing in the more developed regions will continue at a quick pace of 8.8 points over this 30-year period. The global rate of growth of the older population is 3.2 per cent in 2010-2015, and it is projected to decline continuously to 1.8 per cent in 2045-2050. The growth rate is higher in the less developed regions than in the more developed ones. Between 2010-2015 and 2045-2050, the growth rate is projected to decline from 3.8 per cent to 2.2 per cent in the less developed regions, while it is projected to go from 1.9 per cent to 0.4 per cent in the more developed regions. The growth rate in the least developed countries is projected to rise until around 2030 and will hover just under 4 per cent during the next few decades (figure 1.11).
United Nations Department of Economic and Social Affairs ǀ Population Division 15
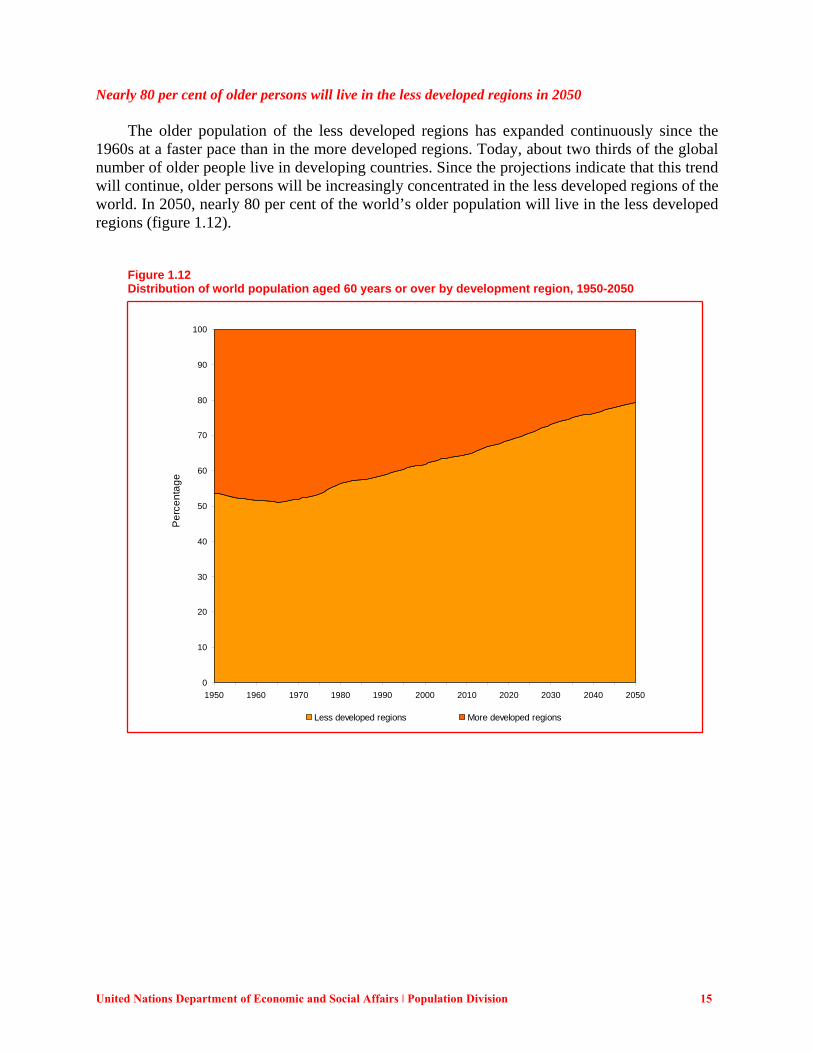
Nearly 80 per cent of older persons will live in the less developed regions in 2050 The older population of the less developed regions has expanded continuously since the 1960s at a faster pace than in the more developed regions. Today, about two thirds of the global number of older people live in developing countries. Since the projections indicate that this trend will continue, older persons will be increasingly concentrated in the less developed regions of the world. In 2050, nearly 80 per cent of the world’s older population will live in the less developed regions (figure 1.12).
Figure 1.12 Distribution of world population aged 60 years or over by development region, 1950-2050
0
10
20
30
40
50
60
70
80
90
100
1950 1960 1970 1980 1990 2000 2010 2020 2030 2040 2050
Pe
rce
nta
ge
Less developed regions More developed regions

United Nations Department of Economic and Social Affairs ǀ Population Division 17
II. The changing balance among age groups As noted in chapter 1, the present and future age composition of a population evolves as a function of the past population size and distribution, and the present and future fertility and mortality rates. In countries where net migration flows are significant, the age structure is also affected by the migration history.9 As a result of the documented changes in fertility and mortality, the balance among age groups in the global population is changing significantly. One major expression of these changes is population ageing and the trend toward a more uniform global population distribution by broad age groups than ever registered before.
A. DISTRIBUTION OF THE POPULATION BY BROAD AGE GROUPS
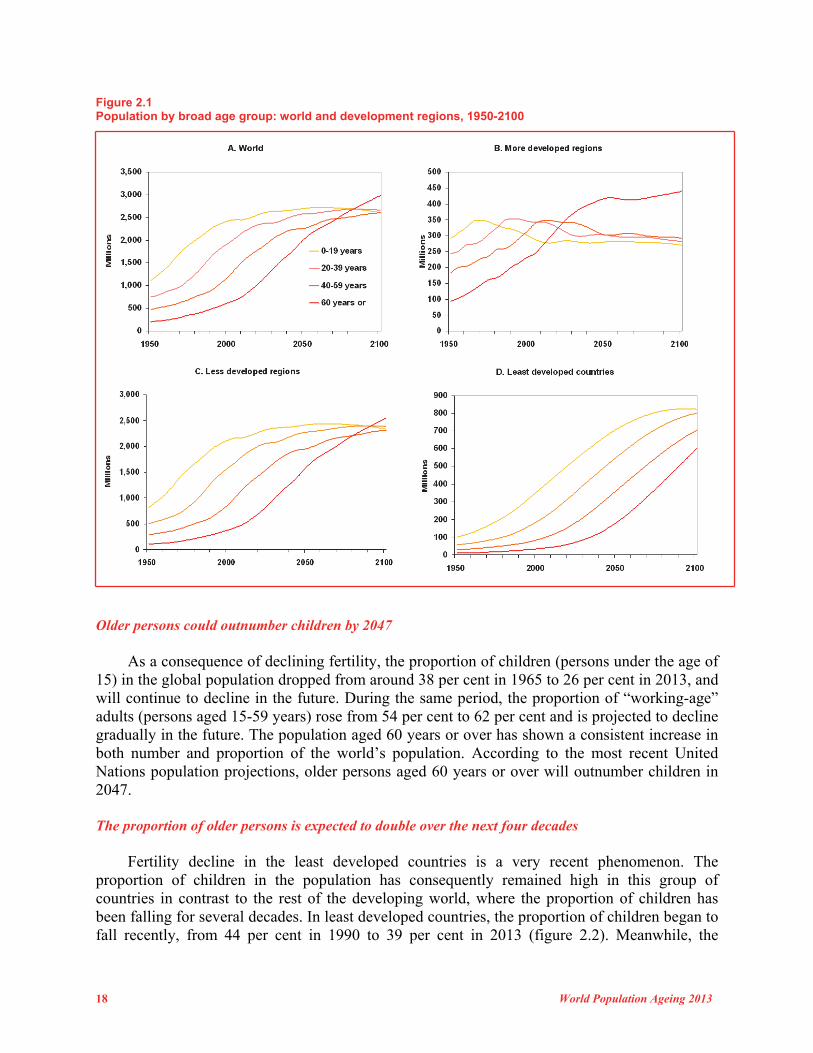
Cohort sizes will become more even over the twenty-first century It was indicated in chapter 1 that the number of annual births is expected to nearly stabilize, at a level of about 138 to 140 million births per year from the present to mid-century. As the more uniformly-sized cohorts grow older, a trend toward a more uniform population age distribution will set in. Figure 2.1 depicts this process by development groups, displaying the evolution of the sizes of four 20-year age groups: (1) children and adolescents under the age of 20 years; (2) “young” adults 20 to 39 years of age; (3) “middle-aged” adults aged 40 to 59 years; and (4) older persons aged 60 years or over. Historically, the group of older persons was much smaller than any of the other three groups. But this situation is no longer true in the more developed regions and the global situation will change significantly as the older population continues to grow rapidly while the younger age groups begin to stabilize. Toward the 2080s, these four age groups are projected to be of approximately equal size, a historically unprecedented fact. But the world population’s age distribution is not expected to stabilize at that point; the projections indicate that ageing will continue to intensify further into the future. In the more developed regions, the size of the first three 20-year age groups are beginning to converge, with projections showing that during 2050-2100 they will stabilize at very similar levels, of about 300 million each. Older persons in the more developed countries have already outnumbered the population aged 0 to 19 years, and will surpass each of the two younger 20-year age groups of adults as early as 2024. Thereafter, the older population is projected to substantially outgrow the younger age groups; by the end of the century, the older population of the more developed regions will represent more than one third of their total population. In the less developed regions, the projections suggest that the four broad age groups will be about the same size by 2090. At that point in time, the older population will represent 25 per cent of the total population, and this proportion will continue to grow, reaching 27 per cent by the end of the century. The group of least developed countries is following a similar trajectory of ageing as the other regions experienced in the past, but with a considerable time lag. Only the size of the youngest group (under age 20) will have stabilized toward the end of the twenty-first century. All the other age groups will continue to grow for many decades to come.
9 At the global scale, net migration is zero; therefore the present age structure is only affected by the population of childbearing ages, and past fertility and mortality rates.
18 World Population Ageing 2013
Figure 2.1 Population by broad age group: world and development regions, 1950-2100
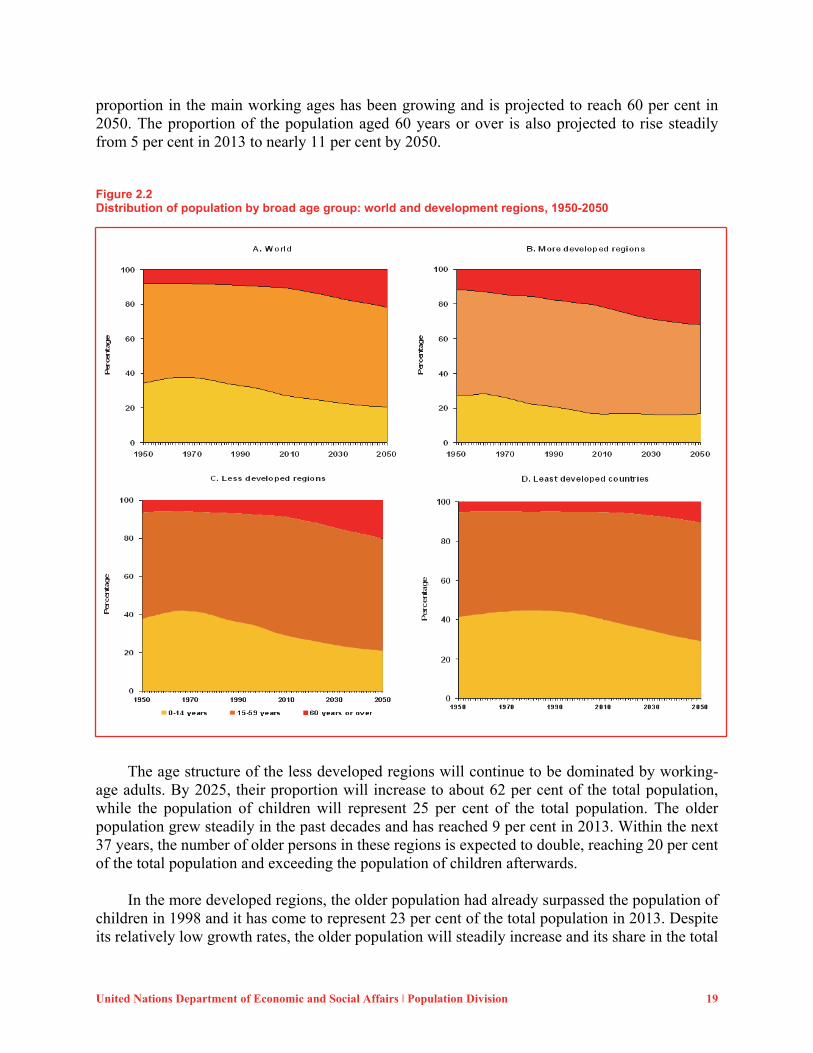
Older persons could outnumber children by 2047 As a consequence of declining fertility, the proportion of children (persons under the age of 15) in the global population dropped from around 38 per cent in 1965 to 26 per cent in 2013, and will continue to decline in the future. During the same period, the proportion of “working-age” adults (persons aged 15-59 years) rose from 54 per cent to 62 per cent and is projected to decline gradually in the future. The population aged 60 years or over has shown a consistent increase in both number and proportion of the world’s population. According to the most recent United Nations population projections, older persons aged 60 years or over will outnumber children in 2047. The proportion of older persons is expected to double over the next four decades Fertility decline in the least developed countries is a very recent phenomenon. The proportion of children in the population has consequently remained high in this group of countries in contrast to the rest of the developing world, where the proportion of children has been falling for several decades. In least developed countries, the proportion of children began to fall recently, from 44 per cent in 1990 to 39 per cent in 2013 (figure 2.2). Meanwhile, the
United Nations Department of Economic and Social Affairs ǀ Population Division 19
proportion in the main working ages has been growing and is projected to reach 60 per cent in 2050. The proportion of the population aged 60 years or over is also projected to rise steadily from 5 per cent in 2013 to nearly 11 per cent by 2050. Figure 2.2 Distribution of population by broad age group: world and development regions, 1950-2050
The age structure of the less developed regions will continue to be dominated by working-age adults. By 2025, their proportion will increase to about 62 per cent of the total population, while the population of children will represent 25 per cent of the total population. The older population grew steadily in the past decades and has reached 9 per cent in 2013. Within the next 37 years, the number of older persons in these regions is expected to double, reaching 20 per cent of the total population and exceeding the population of children afterwards. In the more developed regions, the older population had already surpassed the population of children in 1998 and it has come to represent 23 per cent of the total population in 2013. Despite its relatively low growth rates, the older population will steadily increase and its share in the total
20 World Population Ageing 2013
population is projected to be around 32 per cent in 2050. The working-age group, by contrast, has declined since 2006, following the past reductions in the number of births and the population of children. The share of the working-age population will continue to fall during the next four decades, to about 51 per cent in 2050.
B. MEDIAN AGE
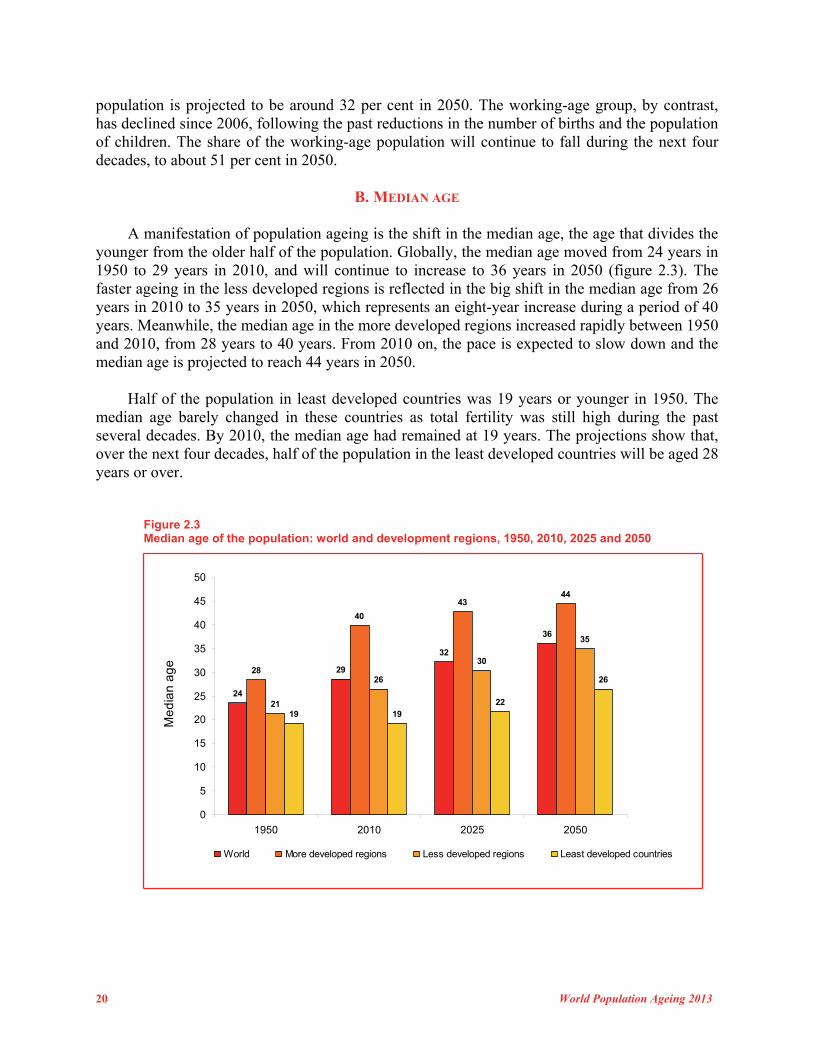
A manifestation of population ageing is the shift in the median age, the age that divides the younger from the older half of the population. Globally, the median age moved from 24 years in 1950 to 29 years in 2010, and will continue to increase to 36 years in 2050 (figure 2.3). The faster ageing in the less developed regions is reflected in the big shift in the median age from 26 years in 2010 to 35 years in 2050, which represents an eight-year increase during a period of 40 years. Meanwhile, the median age in the more developed regions increased rapidly between 1950 and 2010, from 28 years to 40 years. From 2010 on, the pace is expected to slow down and the median age is projected to reach 44 years in 2050.
Half of the population in least developed countries was 19 years or younger in 1950. The median age barely changed in these countries as total fertility was still high during the past several decades. By 2010, the median age had remained at 19 years. The projections show that, over the next four decades, half of the population in the least developed countries will be aged 28 years or over.
Figure 2.3 Median age of the population: world and development regions, 1950, 2010, 2025 and 2050
24
29
32
36
28
40
4344
21
26
30
35
19 1922
26
0
5
10
15
20
25
30
35
40
45
50
1950 2010 2025 2050
Me
dia
n a
ge
World More developed regions Less developed regions Least developed countries
United Nations Department of Economic and Social Affairs ǀ Population Division 21
Japan, Germany and Italy are the countries with the highest median ages in the world. In Japan, more than half of the population was older than 45 years in 2010, and its median age is projected to rise to 53 years in 2050. Japan is thus experiencing rapid ageing, at a faster speed than any other developed country. But Europe is ageing fast as well; by 2050, Bosnia and Herzegovina, Germany, Malta, Portugal, Serbia and Spain are projected to attain median ages of 50 years or more. Among developing countries or areas, Hong Kong Special Administrative Region (SAR) of China and Martinique had relatively old age structures, with a median age of 40 years or more in 2010. In the next four decades, virtually all developing countries are projected to age further. By 2050, Cuba, Hong Kong SAR of China, Martinique, Oman, Qatar, Republic of Korea, Singapore and Thailand are expected to attain median ages of 50 years or higher.
C. DEPENDENCY RATIO
The demographic dependency ratio is a simple indicator of the relationship between the population in mostly dependent ages and the population in the main working ages. It is defined as the ratio of the number of children under age 15 plus older persons aged 65 years or over, to the number of persons aged 15 to 64 years. The ratio is generally used as an indicator of the burden of demographic dependency in a population; that is, how many “dependents” need to be supported by each person of working age. Support for dependents can be provided in various ways (see chapter 4), including familial and public transfers. This simple dependency ratio implicitly assumes that all persons younger than 15 years and older than 65 years are unproductive and that all persons aged 15 to 64 years are productive, which is not always the case. For example, in the less developed regions, there are significant numbers of workers among children under the age of 15 and persons aged 65. In middle and high-income countries, many young adults are not fully productive until in their late twenties. The dependency ratio is therefore a good initial approximation to assess the degree of economic-demographic dependency in a society, but it should be interpreted with caution.10 The dependency ratio is at its minimum in the world The dependency ratio peaked at 76 dependents per 100 working-age persons at the world level and at 84 per 100 in the less developed regions. These high levels were reached in 1965, as a result of high fertility rates in the 1950s and 1960s. As total fertility declined, the world dependency ratio also started to fall gradually, to about 52 per 100 in 2013. In the more developed regions, the highest value for the dependency ratio (58 per 100) was reached in 1960, a few years earlier than in the less developed regions. After falling for about four decades, the world dependency ratio is approaching a minimum in the present decade, and will begin to rise soon (figure 2.4). Globally, the minimum of 52 dependents was reached in 2010 and it is projected to stay nearly at that level for about 15 years. The dependency ratio is expected to rise to 58 per 100 in 2050 and to increase further by the end of the century. The turning point is particularly sharp in the more developed regions, where the
10 In section E of this chapter, a brief analysis of economic dependency and support ratios is presented, based on newly available information from National Transfer Accounts (see http://ntaccounts.org/web/nta/show/).
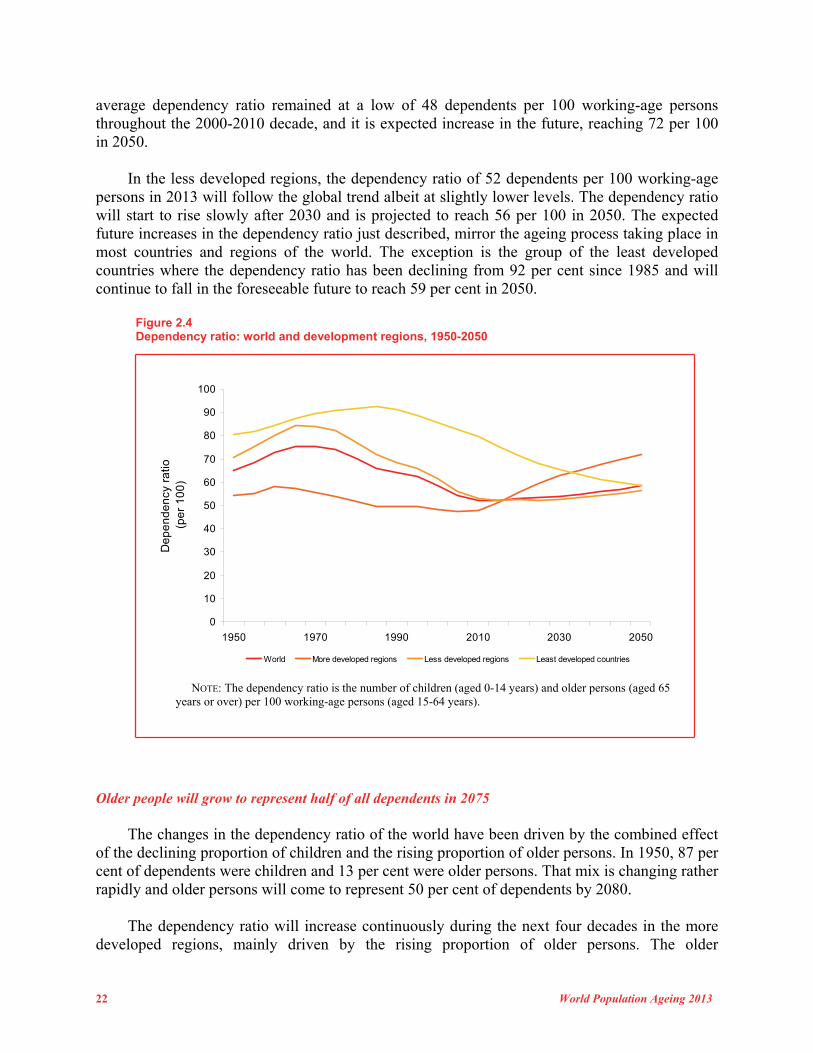
22 World Population Ageing 2013
average dependency ratio remained at a low of 48 dependents per 100 working-age persons throughout the 2000-2010 decade, and it is expected increase in the future, reaching 72 per 100 in 2050. In the less developed regions, the dependency ratio of 52 dependents per 100 working-age persons in 2013 will follow the global trend albeit at slightly lower levels. The dependency ratio will start to rise slowly after 2030 and is projected to reach 56 per 100 in 2050. The expected future increases in the dependency ratio just described, mirror the ageing process taking place in most countries and regions of the world. The exception is the group of the least developed countries where the dependency ratio has been declining from 92 per cent since 1985 and will continue to fall in the foreseeable future to reach 59 per cent in 2050.
Figure 2.4 Dependency ratio: world and development regions, 1950-2050
0
10
20
30
40
50
60
70
80
90
100
1950 1970 1990 2010 2030 2050
De
pe
nd
en
cy r
atio
(p
er
10
0)
World More developed regions Less developed regions Least developed countries
NOTE: The dependency ratio is the number of children (aged 0-14 years) and older persons (aged 65 years or over) per 100 working-age persons (aged 15-64 years).
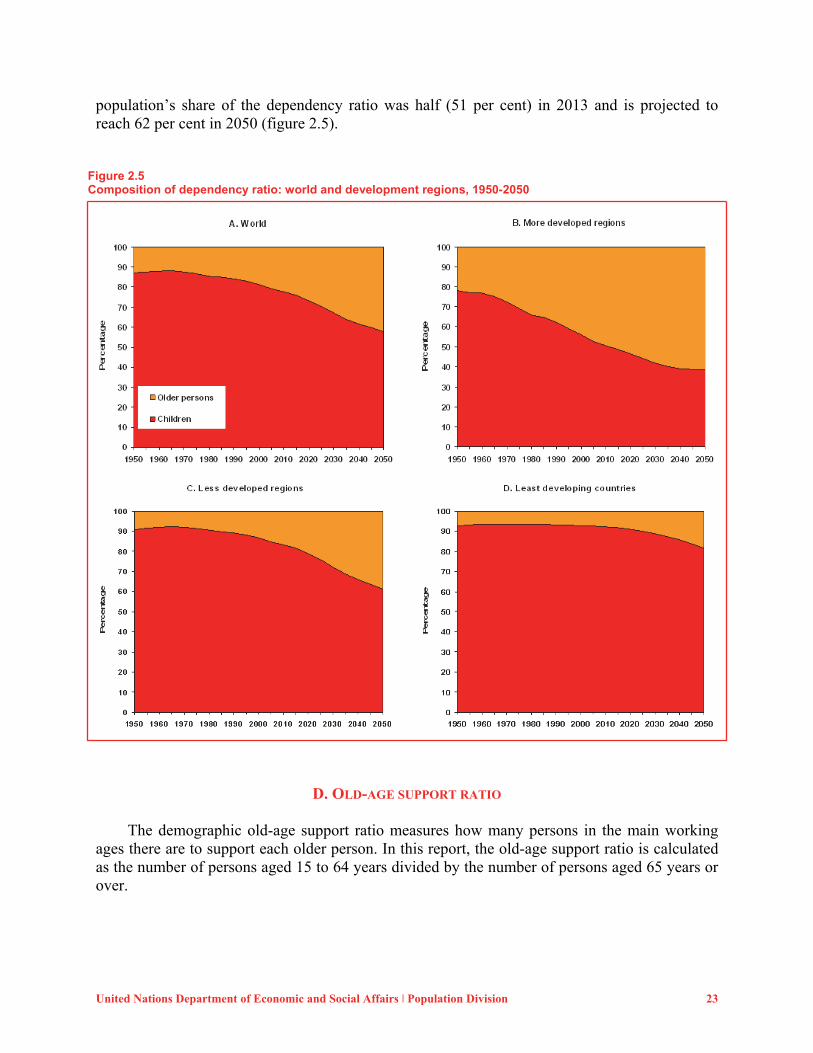
Older people will grow to represent half of all dependents in 2075 The changes in the dependency ratio of the world have been driven by the combined effect of the declining proportion of children and the rising proportion of older persons. In 1950, 87 per cent of dependents were children and 13 per cent were older persons. That mix is changing rather rapidly and older persons will come to represent 50 per cent of dependents by 2080. The dependency ratio will increase continuously during the next four decades in the more developed regions, mainly driven by the rising proportion of older persons. The older
United Nations Department of Economic and Social Affairs ǀ Population Division 23
population’s share of the dependency ratio was half (51 per cent) in 2013 and is projected to reach 62 per cent in 2050 (figure 2.5).
Figure 2.5 Composition of dependency ratio: world and development regions, 1950-2050
D. OLD-AGE SUPPORT RATIO
The demographic old-age support ratio measures how many persons in the main working ages there are to support each older person. In this report, the old-age support ratio is calculated as the number of persons aged 15 to 64 years divided by the number of persons aged 65 years or over.
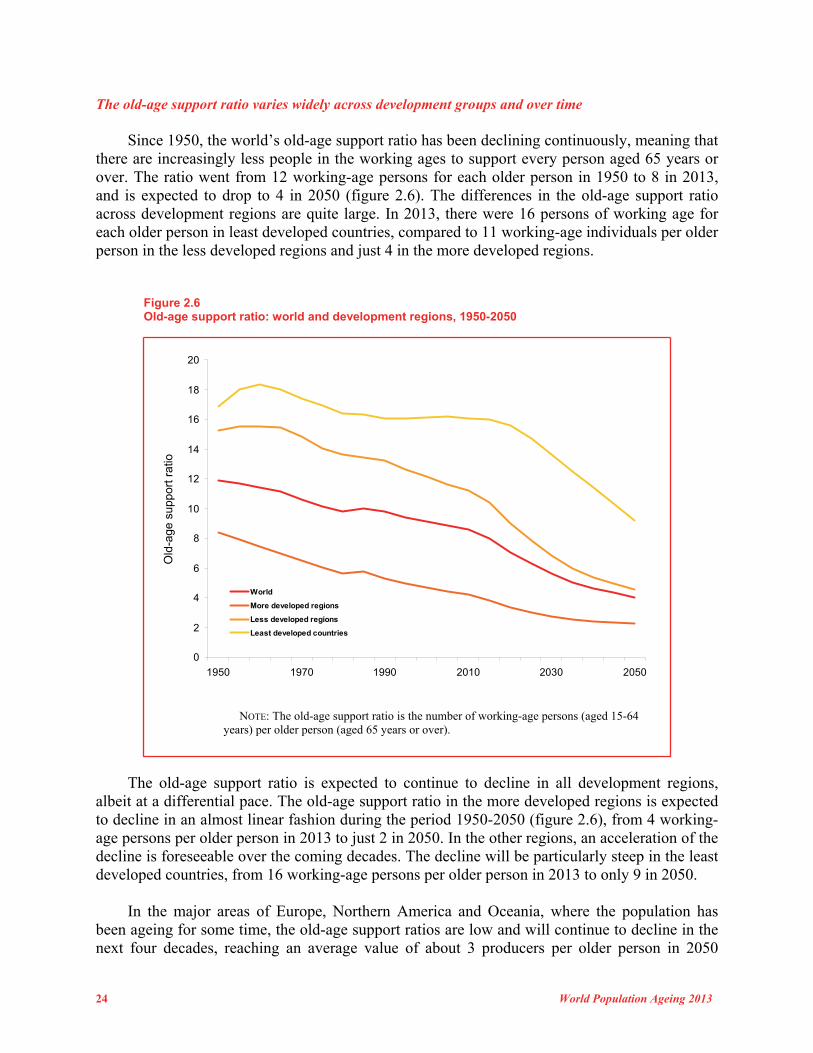
24 World Population Ageing 2013
The old-age support ratio varies widely across development groups and over time
Since 1950, the world’s old-age support ratio has been declining continuously, meaning that there are increasingly less people in the working ages to support every person aged 65 years or over. The ratio went from 12 working-age persons for each older person in 1950 to 8 in 2013, and is expected to drop to 4 in 2050 (figure 2.6). The differences in the old-age support ratio across development regions are quite large. In 2013, there were 16 persons of working age for each older person in least developed countries, compared to 11 working-age individuals per older person in the less developed regions and just 4 in the more developed regions.
Figure 2.6 Old-age support ratio: world and development regions, 1950-2050
0
2
4
6
8
10
12
14
16
18
20
1950 1970 1990 2010 2030 2050
Old
-age
sup
port
rat
io
World
More developed regions
Less developed regions
Least developed countries
NOTE: The old-age support ratio is the number of working-age persons (aged 15-64 years) per older person (aged 65 years or over).
The old-age support ratio is expected to continue to decline in all development regions, albeit at a differential pace. The old-age support ratio in the more developed regions is expected to decline in an almost linear fashion during the period 1950-2050 (figure 2.6), from 4 working-age persons per older person in 2013 to just 2 in 2050. In the other regions, an acceleration of the decline is foreseeable over the coming decades. The decline will be particularly steep in the least developed countries, from 16 working-age persons per older person in 2013 to only 9 in 2050. In the major areas of Europe, Northern America and Oceania, where the population has been ageing for some time, the old-age support ratios are low and will continue to decline in the next four decades, reaching an average value of about 3 producers per older person in 2050
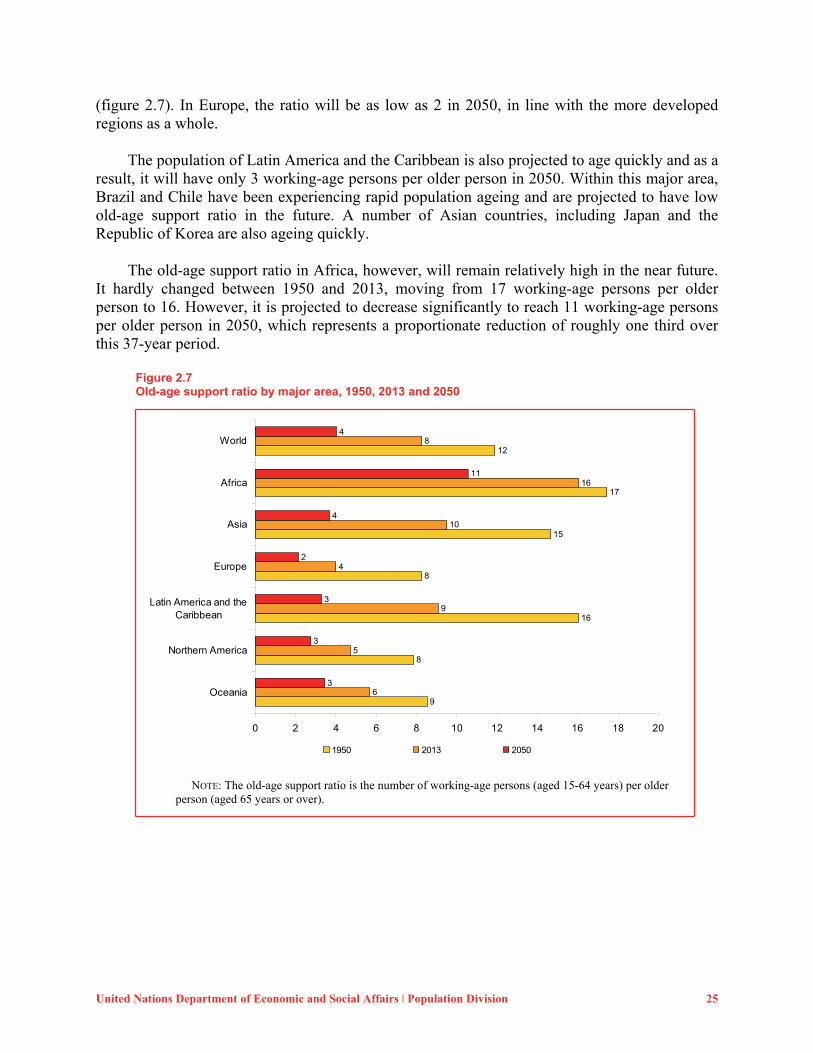
United Nations Department of Economic and Social Affairs ǀ Population Division 25
(figure 2.7). In Europe, the ratio will be as low as 2 in 2050, in line with the more developed regions as a whole. The population of Latin America and the Caribbean is also projected to age quickly and as a result, it will have only 3 working-age persons per older person in 2050. Within this major area, Brazil and Chile have been experiencing rapid population ageing and are projected to have low old-age support ratio in the future. A number of Asian countries, including Japan and the Republic of Korea are also ageing quickly. The old-age support ratio in Africa, however, will remain relatively high in the near future. It hardly changed between 1950 and 2013, moving from 17 working-age persons per older person to 16. However, it is projected to decrease significantly to reach 11 working-age persons per older person in 2050, which represents a proportionate reduction of roughly one third over this 37-year period.
Figure 2.7 Old-age support ratio by major area, 1950, 2013 and 2050
9
8
16
8
15
17
12
6
5
9
4
10
16
8
3
3
3
2
4
11
4
0 2 4 6 8 10 12 14 16 18 20
Oceania
Northern America
Latin America and theCaribbean
Europe
Asia
Africa
World
1950 2013 2050
NOTE: The old-age support ratio is the number of working-age persons (aged 15-64 years) per older person (aged 65 years or over).
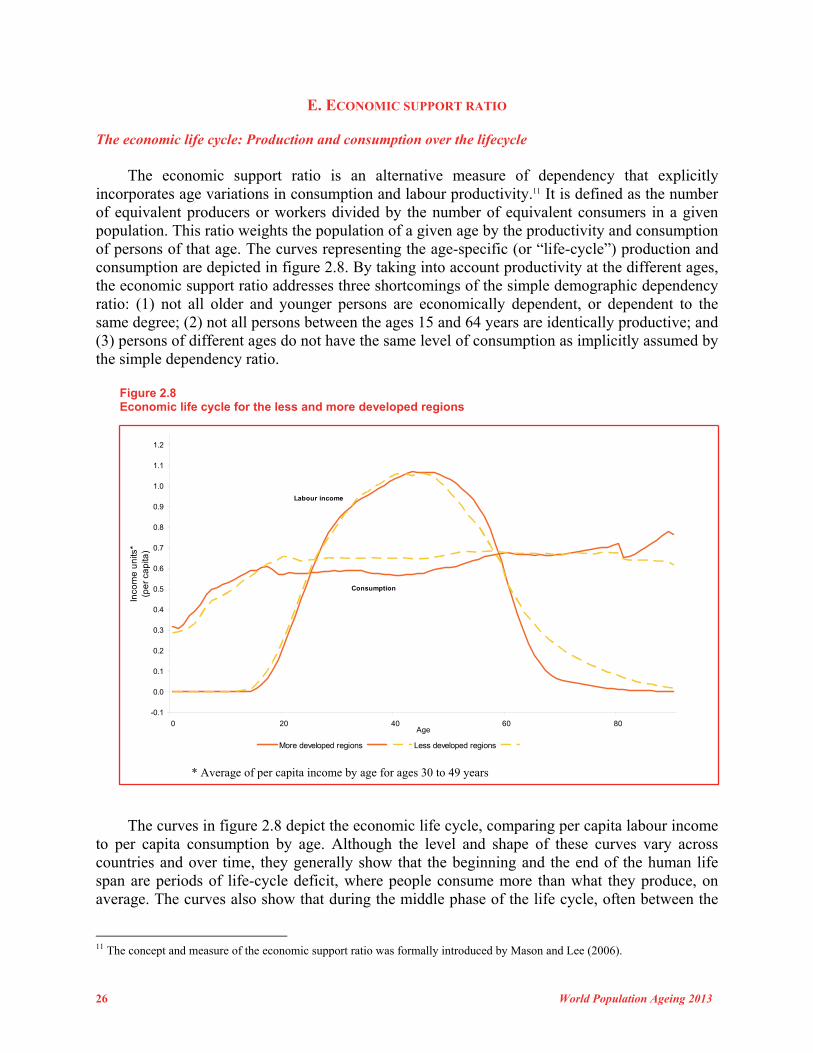
26 World Population Ageing 2013
E. ECONOMIC SUPPORT RATIO The economic life cycle: Production and consumption over the lifecycle The economic support ratio is an alternative measure of dependency that explicitly incorporates age variations in consumption and labour productivity.11 It is defined as the number of equivalent producers or workers divided by the number of equivalent consumers in a given population. This ratio weights the population of a given age by the productivity and consumption of persons of that age. The curves representing the age-specific (or “life-cycle”) production and consumption are depicted in figure 2.8. By taking into account productivity at the different ages, the economic support ratio addresses three shortcomings of the simple demographic dependency ratio: (1) not all older and younger persons are economically dependent, or dependent to the same degree; (2) not all persons between the ages 15 and 64 years are identically productive; and (3) persons of different ages do not have the same level of consumption as implicitly assumed by the simple dependency ratio.
Figure 2.8 Economic life cycle for the less and more developed regions
-0.1
0.0
0.1
0.2
0.3
0.4
0.5
0.6
0.7
0.8
0.9
1.0
1.1
1.2
0 20 40 60 80Age
Inco
me
un
its*
(pe
r ca
pita
)
More developed regions Less developed regions
Consumption
Labour income
* Average of per capita income by age for ages 30 to 49 years
The curves in figure 2.8 depict the economic life cycle, comparing per capita labour income to per capita consumption by age. Although the level and shape of these curves vary across countries and over time, they generally show that the beginning and the end of the human life span are periods of life-cycle deficit, where people consume more than what they produce, on average. The curves also show that during the middle phase of the life cycle, often between the
11 The concept and measure of the economic support ratio was formally introduced by Mason and Lee (2006).
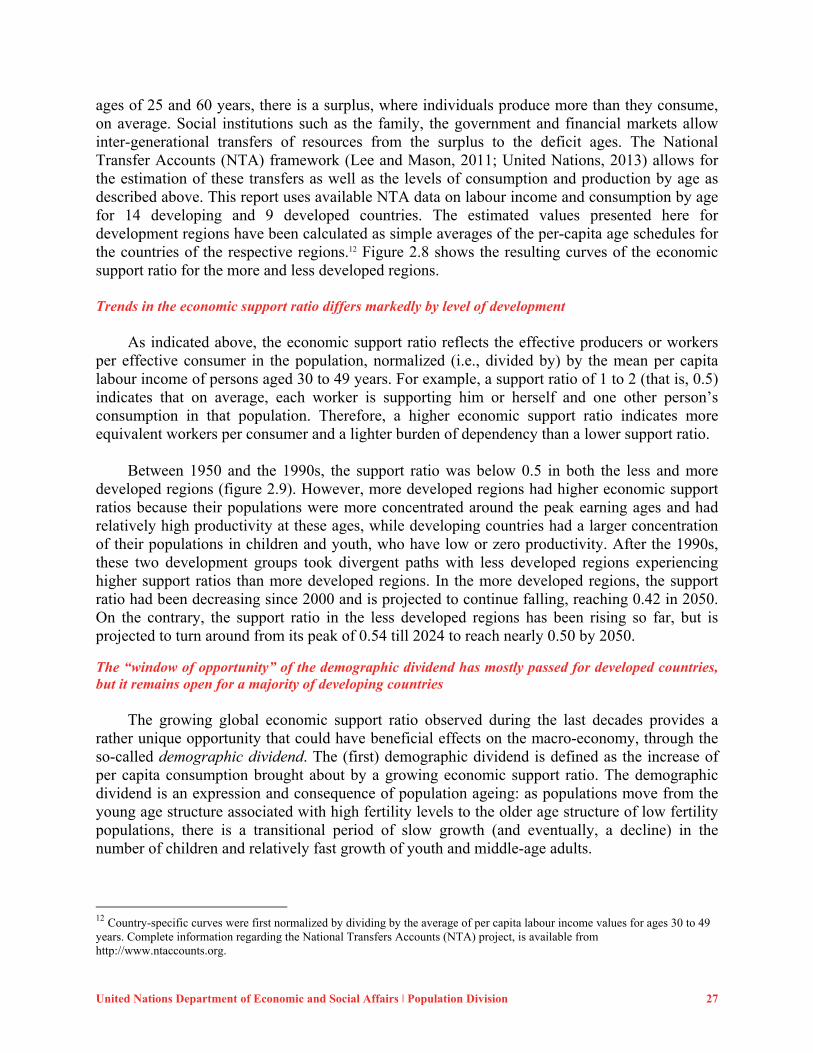
United Nations Department of Economic and Social Affairs ǀ Population Division 27
ages of 25 and 60 years, there is a surplus, where individuals produce more than they consume, on average. Social institutions such as the family, the government and financial markets allow inter-generational transfers of resources from the surplus to the deficit ages. The National Transfer Accounts (NTA) framework (Lee and Mason, 2011; United Nations, 2013) allows for the estimation of these transfers as well as the levels of consumption and production by age as described above. This report uses available NTA data on labour income and consumption by age for 14 developing and 9 developed countries. The estimated values presented here for development regions have been calculated as simple averages of the per-capita age schedules for the countries of the respective regions.12 Figure 2.8 shows the resulting curves of the economic support ratio for the more and less developed regions. Trends in the economic support ratio differs markedly by level of development As indicated above, the economic support ratio reflects the effective producers or workers per effective consumer in the population, normalized (i.e., divided by) by the mean per capita labour income of persons aged 30 to 49 years. For example, a support ratio of 1 to 2 (that is, 0.5) indicates that on average, each worker is supporting him or herself and one other person’s consumption in that population. Therefore, a higher economic support ratio indicates more equivalent workers per consumer and a lighter burden of dependency than a lower support ratio. Between 1950 and the 1990s, the support ratio was below 0.5 in both the less and more developed regions (figure 2.9). However, more developed regions had higher economic support ratios because their populations were more concentrated around the peak earning ages and had relatively high productivity at these ages, while developing countries had a larger concentration of their populations in children and youth, who have low or zero productivity. After the 1990s, these two development groups took divergent paths with less developed regions experiencing higher support ratios than more developed regions. In the more developed regions, the support ratio had been decreasing since 2000 and is projected to continue falling, reaching 0.42 in 2050. On the contrary, the support ratio in the less developed regions has been rising so far, but is projected to turn around from its peak of 0.54 till 2024 to reach nearly 0.50 by 2050.
The “window of opportunity” of the demographic dividend has mostly passed for developed countries, but it remains open for a majority of developing countries The growing global economic support ratio observed during the last decades provides a rather unique opportunity that could have beneficial effects on the macro-economy, through the so-called demographic dividend. The (first) demographic dividend is defined as the increase of per capita consumption brought about by a growing economic support ratio. The demographic dividend is an expression and consequence of population ageing: as populations move from the young age structure associated with high fertility levels to the older age structure of low fertility populations, there is a transitional period of slow growth (and eventually, a decline) in the number of children and relatively fast growth of youth and middle-age adults.
12 Country-specific curves were first normalized by dividing by the average of per capita labour income values for ages 30 to 49 years. Complete information regarding the National Transfers Accounts (NTA) project, is available from http://www.ntaccounts.org.
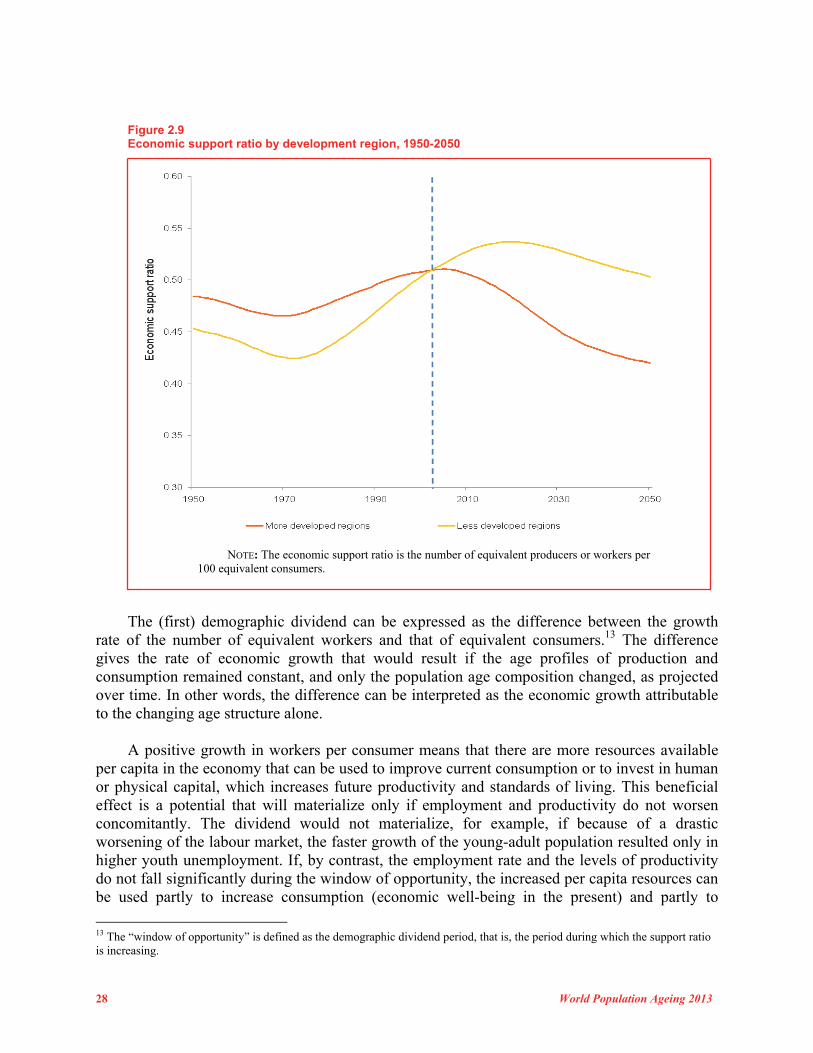
28 World Population Ageing 2013
Figure 2.9 Economic support ratio by development region, 1950-2050
NOTE: The economic support ratio is the number of equivalent producers or workers per 100 equivalent consumers.
The (first) demographic dividend can be expressed as the difference between the growth rate of the number of equivalent workers and that of equivalent consumers.13 The difference gives the rate of economic growth that would result if the age profiles of production and consumption remained constant, and only the population age composition changed, as projected over time. In other words, the difference can be interpreted as the economic growth attributable to the changing age structure alone. A positive growth in workers per consumer means that there are more resources available per capita in the economy that can be used to improve current consumption or to invest in human or physical capital, which increases future productivity and standards of living. This beneficial effect is a potential that will materialize only if employment and productivity do not worsen concomitantly. The dividend would not materialize, for example, if because of a drastic worsening of the labour market, the faster growth of the young-adult population resulted only in higher youth unemployment. If, by contrast, the employment rate and the levels of productivity do not fall significantly during the window of opportunity, the increased per capita resources can be used partly to increase consumption (economic well-being in the present) and partly to
13 The “window of opportunity” is defined as the demographic dividend period, that is, the period during which the support ratio is increasing.
United Nations Department of Economic and Social Affairs ǀ Population Division 29
increase human capital investments or to build a better physical infrastructure with multiplicative effects on present and future economic growth and well-being. Figure 2.10 shows the projected demographic dividend, that is, the difference between the growth rates of equivalent producers and consumers induced by demographic change alone. Values above zero reflect positive economic growth, while values below zero indicate a “negative dividend”, that is, a period during which demographic change is contributing to a reduction in economic growth, all things being equal.
Figure 2.10 Demographic dividend (demographically induced economic growth rates) by development region, 1950-2050
-1.0
-0.5
0.0
0.5
1.0
1950
1970
1990
2010
2030
2050
Gro
wth
rate
(perc
enta
ge)
More developed regions Less developed regions
In the less developed regions, a positive demographic dividend has been experienced since the early 1970s as the effective number of workers has been growing faster than the effective number of consumers. The projections indicate that this favourable trend will continue until about 2020. The more developed regions also benefitted from the demographic dividend, albeit to a smaller extent and during a shorter period of time, from about 1970 to 2005.

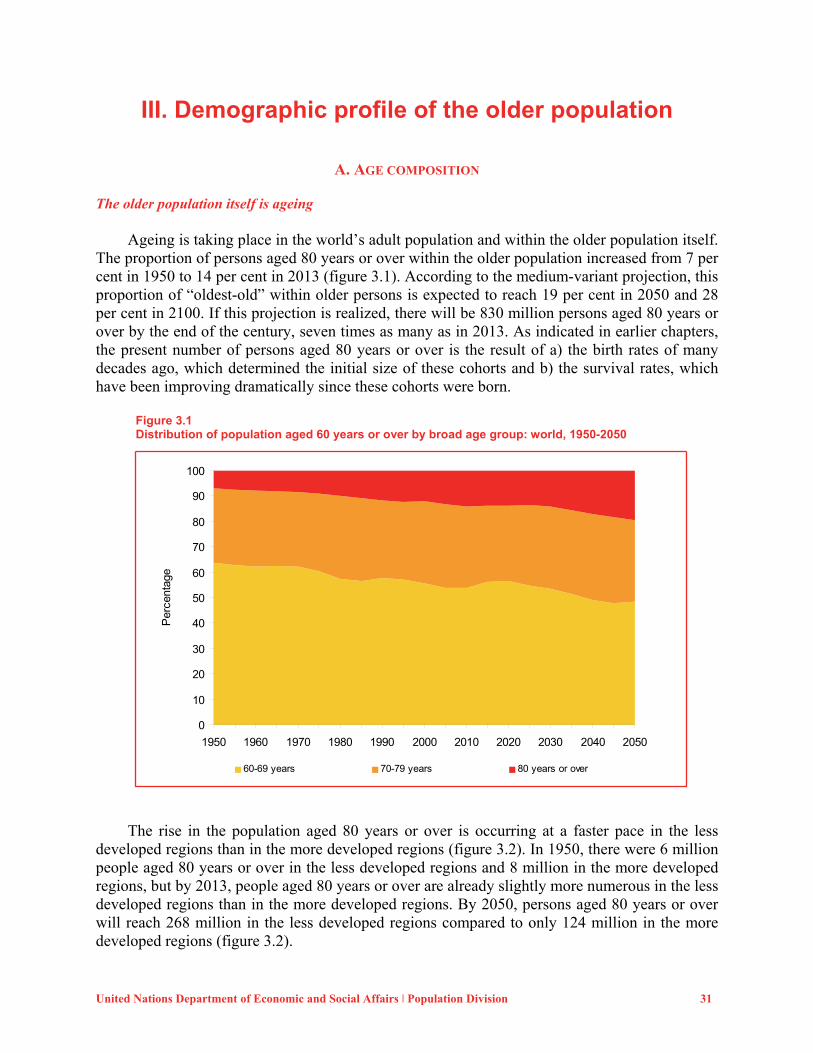
United Nations Department of Economic and Social Affairs ǀ Population Division 31
III. Demographic profile of the older population
A. AGE COMPOSITION The older population itself is ageing Ageing is taking place in the world’s adult population and within the older population itself. The proportion of persons aged 80 years or over within the older population increased from 7 per cent in 1950 to 14 per cent in 2013 (figure 3.1). According to the medium-variant projection, this proportion of “oldest-old” within older persons is expected to reach 19 per cent in 2050 and 28 per cent in 2100. If this projection is realized, there will be 830 million persons aged 80 years or over by the end of the century, seven times as many as in 2013. As indicated in earlier chapters, the present number of persons aged 80 years or over is the result of a) the birth rates of many decades ago, which determined the initial size of these cohorts and b) the survival rates, which have been improving dramatically since these cohorts were born.
Figure 3.1 Distribution of population aged 60 years or over by broad age group: world, 1950-2050
0
10
20
30
40
50
60
70
80
90
100
1950 1960 1970 1980 1990 2000 2010 2020 2030 2040 2050
Per
cent
age
60-69 years 70-79 years 80 years or over
The rise in the population aged 80 years or over is occurring at a faster pace in the less developed regions than in the more developed regions (figure 3.2). In 1950, there were 6 million people aged 80 years or over in the less developed regions and 8 million in the more developed regions, but by 2013, people aged 80 years or over are already slightly more numerous in the less developed regions than in the more developed regions. By 2050, persons aged 80 years or over will reach 268 million in the less developed regions compared to only 124 million in the more developed regions (figure 3.2).
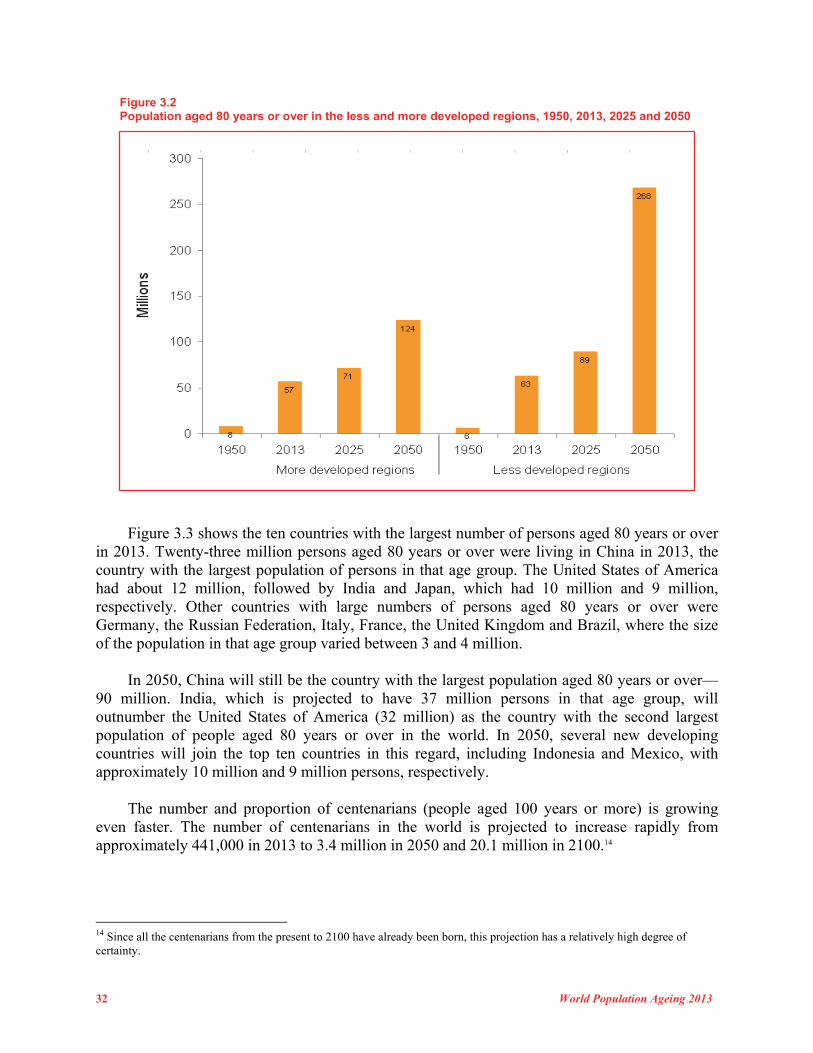
32 World Population Ageing 2013
Figure 3.2 Population aged 80 years or over in the less and more developed regions, 1950, 2013, 2025 and 2050
Figure 3.3 shows the ten countries with the largest number of persons aged 80 years or over in 2013. Twenty-three million persons aged 80 years or over were living in China in 2013, the country with the largest population of persons in that age group. The United States of America had about 12 million, followed by India and Japan, which had 10 million and 9 million, respectively. Other countries with large numbers of persons aged 80 years or over were Germany, the Russian Federation, Italy, France, the United Kingdom and Brazil, where the size of the population in that age group varied between 3 and 4 million. In 2050, China will still be the country with the largest population aged 80 years or over—90 million. India, which is projected to have 37 million persons in that age group, will outnumber the United States of America (32 million) as the country with the second largest population of people aged 80 years or over in the world. In 2050, several new developing countries will join the top ten countries in this regard, including Indonesia and Mexico, with approximately 10 million and 9 million persons, respectively. The number and proportion of centenarians (people aged 100 years or more) is growing even faster. The number of centenarians in the world is projected to increase rapidly from approximately 441,000 in 2013 to 3.4 million in 2050 and 20.1 million in 2100.14
14 Since all the centenarians from the present to 2100 have already been born, this projection has a relatively high degree of certainty.
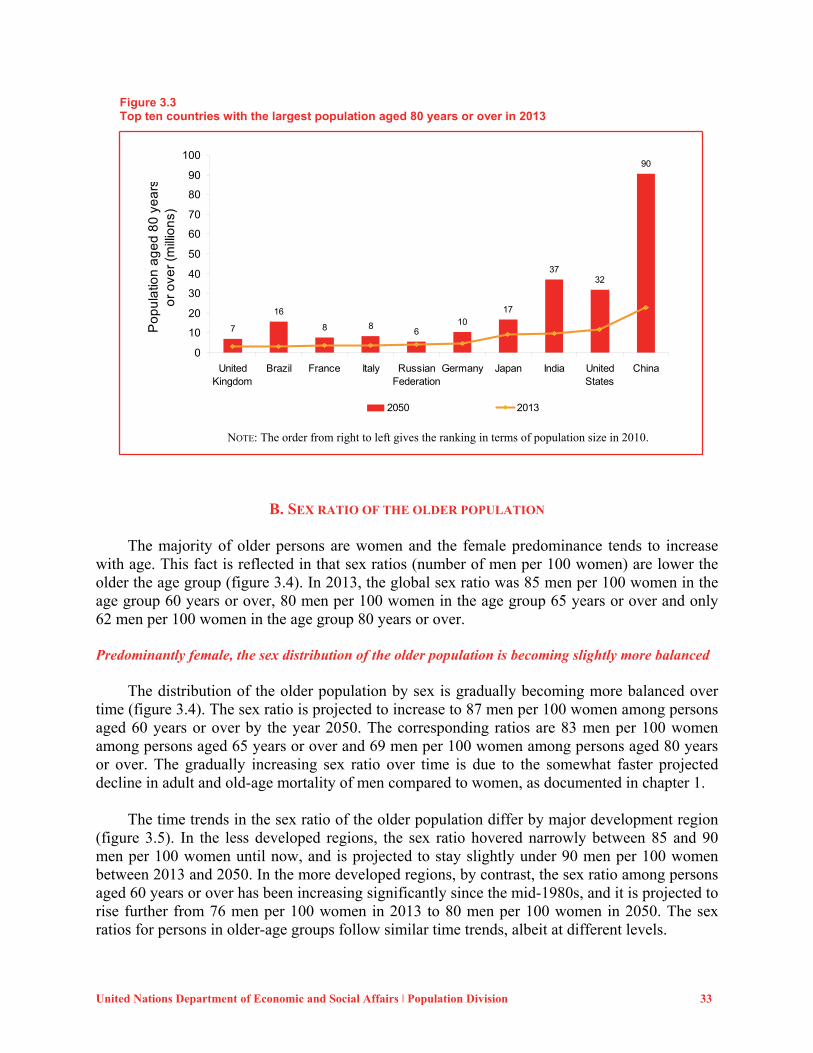
United Nations Department of Economic and Social Affairs ǀ Population Division 33
Figure 3.3 Top ten countries with the largest population aged 80 years or over in 2013
7
16
8 86
1017
3732
90
0
10
20
30
40
50
60
70
80
90
100
UnitedKingdom
Brazil France Italy RussianFederation
Germany Japan India UnitedStates
China
Po
pu
latio
n a
ge
d 8
0 y
ea
rso
r o
ver
(mill
ion
s)
2050 2013
NOTE: The order from right to left gives the ranking in terms of population size in 2010.
B. SEX RATIO OF THE OLDER POPULATION The majority of older persons are women and the female predominance tends to increase with age. This fact is reflected in that sex ratios (number of men per 100 women) are lower the older the age group (figure 3.4). In 2013, the global sex ratio was 85 men per 100 women in the age group 60 years or over, 80 men per 100 women in the age group 65 years or over and only 62 men per 100 women in the age group 80 years or over. Predominantly female, the sex distribution of the older population is becoming slightly more balanced The distribution of the older population by sex is gradually becoming more balanced over time (figure 3.4). The sex ratio is projected to increase to 87 men per 100 women among persons aged 60 years or over by the year 2050. The corresponding ratios are 83 men per 100 women among persons aged 65 years or over and 69 men per 100 women among persons aged 80 years or over. The gradually increasing sex ratio over time is due to the somewhat faster projected decline in adult and old-age mortality of men compared to women, as documented in chapter 1. The time trends in the sex ratio of the older population differ by major development region (figure 3.5). In the less developed regions, the sex ratio hovered narrowly between 85 and 90 men per 100 women until now, and is projected to stay slightly under 90 men per 100 women between 2013 and 2050. In the more developed regions, by contrast, the sex ratio among persons aged 60 years or over has been increasing significantly since the mid-1980s, and it is projected to rise further from 76 men per 100 women in 2013 to 80 men per 100 women in 2050. The sex ratios for persons in older-age groups follow similar time trends, albeit at different levels.
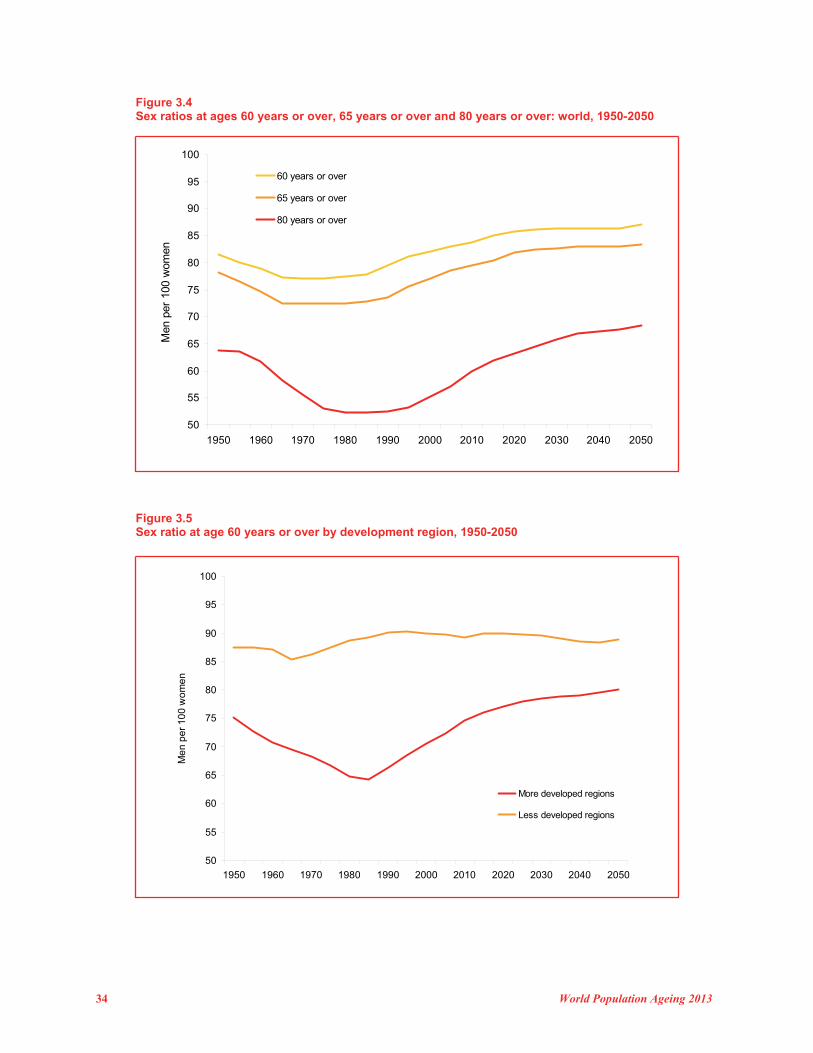
34 World Population Ageing 2013
Figure 3.4 Sex ratios at ages 60 years or over, 65 years or over and 80 years or over: world, 1950-2050
50
55
60
65
70
75
80
85
90
95
100
1950 1960 1970 1980 1990 2000 2010 2020 2030 2040 2050
Men
per
100
wom
en60 years or over
65 years or over
80 years or over
Figure 3.5 Sex ratio at age 60 years or over by development region, 1950-2050
50
55
60
65
70
75
80
85
90
95
100
1950 1960 1970 1980 1990 2000 2010 2020 2030 2040 2050
Me
n p
er 1
00
wo
me
n
More developed regions
Less developed regions
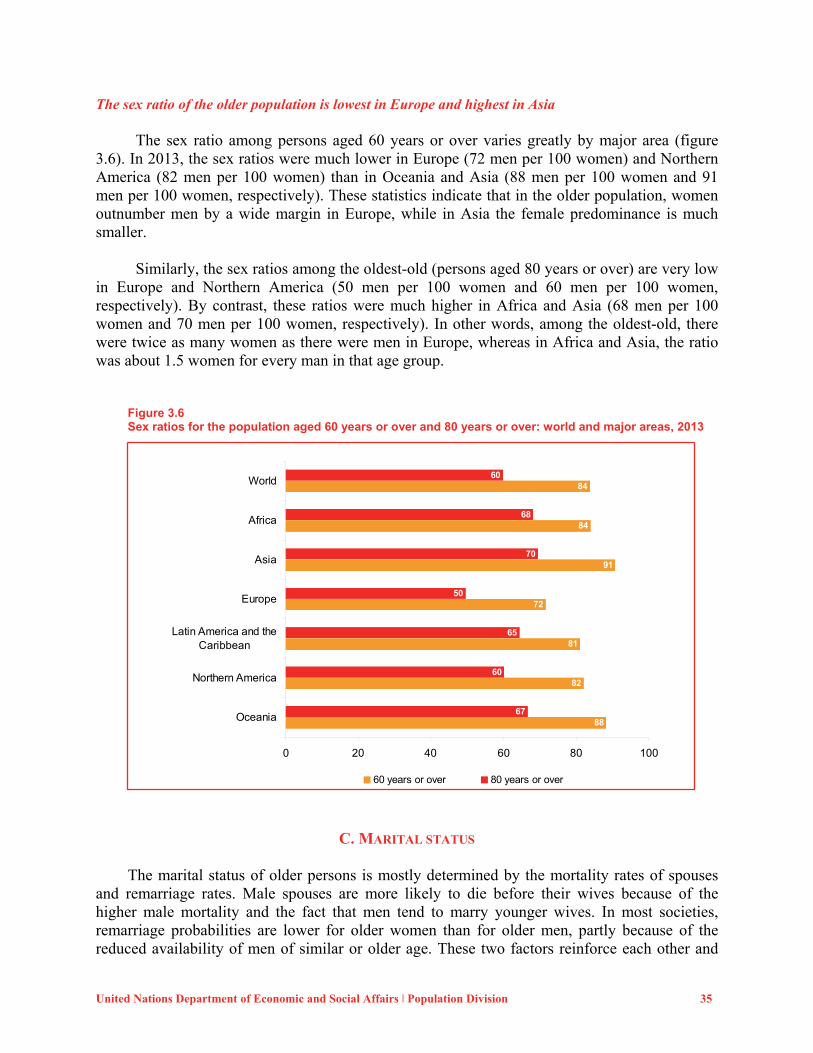
United Nations Department of Economic and Social Affairs ǀ Population Division 35
The sex ratio of the older population is lowest in Europe and highest in Asia The sex ratio among persons aged 60 years or over varies greatly by major area (figure 3.6). In 2013, the sex ratios were much lower in Europe (72 men per 100 women) and Northern America (82 men per 100 women) than in Oceania and Asia (88 men per 100 women and 91 men per 100 women, respectively). These statistics indicate that in the older population, women outnumber men by a wide margin in Europe, while in Asia the female predominance is much smaller. Similarly, the sex ratios among the oldest-old (persons aged 80 years or over) are very low in Europe and Northern America (50 men per 100 women and 60 men per 100 women, respectively). By contrast, these ratios were much higher in Africa and Asia (68 men per 100 women and 70 men per 100 women, respectively). In other words, among the oldest-old, there were twice as many women as there were men in Europe, whereas in Africa and Asia, the ratio was about 1.5 women for every man in that age group.
Figure 3.6 Sex ratios for the population aged 60 years or over and 80 years or over: world and major areas, 2013
88
82
81
72
91
84
84
67
60
65
50
70
68
60
0 20 40 60 80 100
Oceania
Northern America
Latin America and theCaribbean
Europe
Asia
Africa
World
60 years or over 80 years or over
C. MARITAL STATUS
The marital status of older persons is mostly determined by the mortality rates of spouses and remarriage rates. Male spouses are more likely to die before their wives because of the higher male mortality and the fact that men tend to marry younger wives. In most societies, remarriage probabilities are lower for older women than for older men, partly because of the reduced availability of men of similar or older age. These two factors reinforce each other and
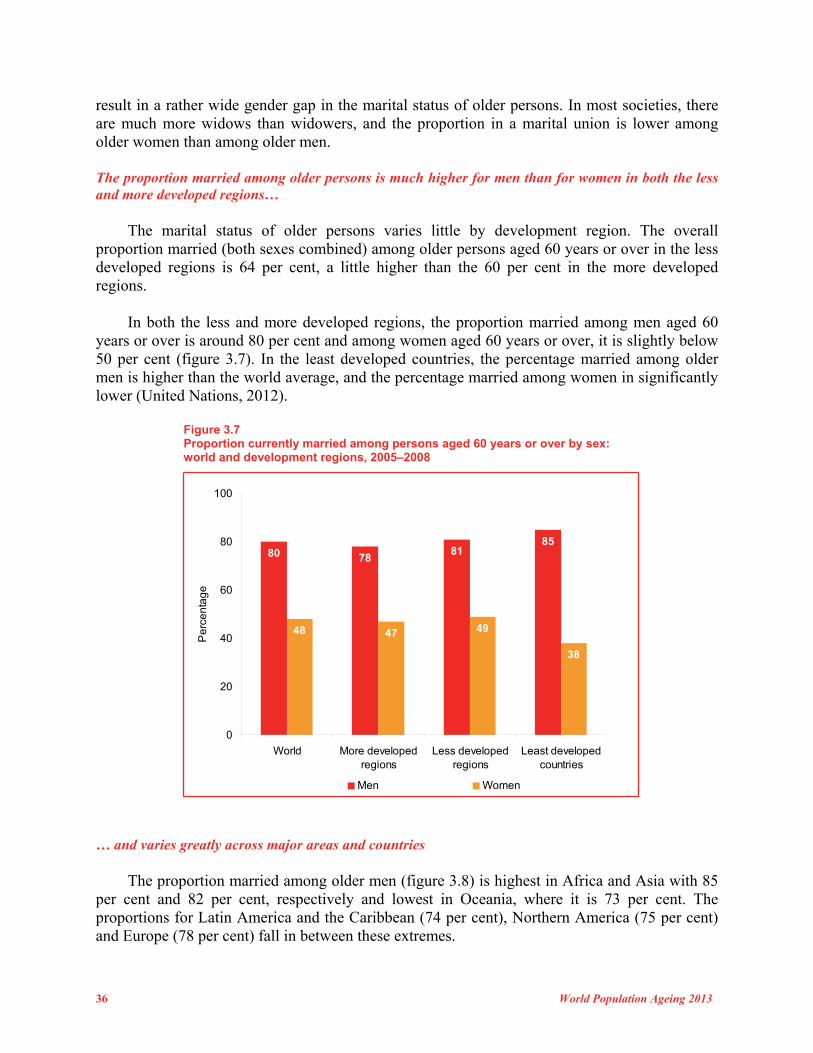
36 World Population Ageing 2013
result in a rather wide gender gap in the marital status of older persons. In most societies, there are much more widows than widowers, and the proportion in a marital union is lower among older women than among older men. The proportion married among older persons is much higher for men than for women in both the less and more developed regions… The marital status of older persons varies little by development region. The overall proportion married (both sexes combined) among older persons aged 60 years or over in the less developed regions is 64 per cent, a little higher than the 60 per cent in the more developed regions. In both the less and more developed regions, the proportion married among men aged 60 years or over is around 80 per cent and among women aged 60 years or over, it is slightly below 50 per cent (figure 3.7). In the least developed countries, the percentage married among older men is higher than the world average, and the percentage married among women in significantly lower (United Nations, 2012).
Figure 3.7 Proportion currently married among persons aged 60 years or over by sex: world and development regions, 2005–2008
80 7881
85
48 47 49
38
0
20
40
60
80
100
World More developedregions
Less developedregions
Least developedcountries
Pe
rce
nta
ge
Men Women
… and varies greatly across major areas and countries The proportion married among older men (figure 3.8) is highest in Africa and Asia with 85 per cent and 82 per cent, respectively and lowest in Oceania, where it is 73 per cent. The proportions for Latin America and the Caribbean (74 per cent), Northern America (75 per cent) and Europe (78 per cent) fall in between these extremes.
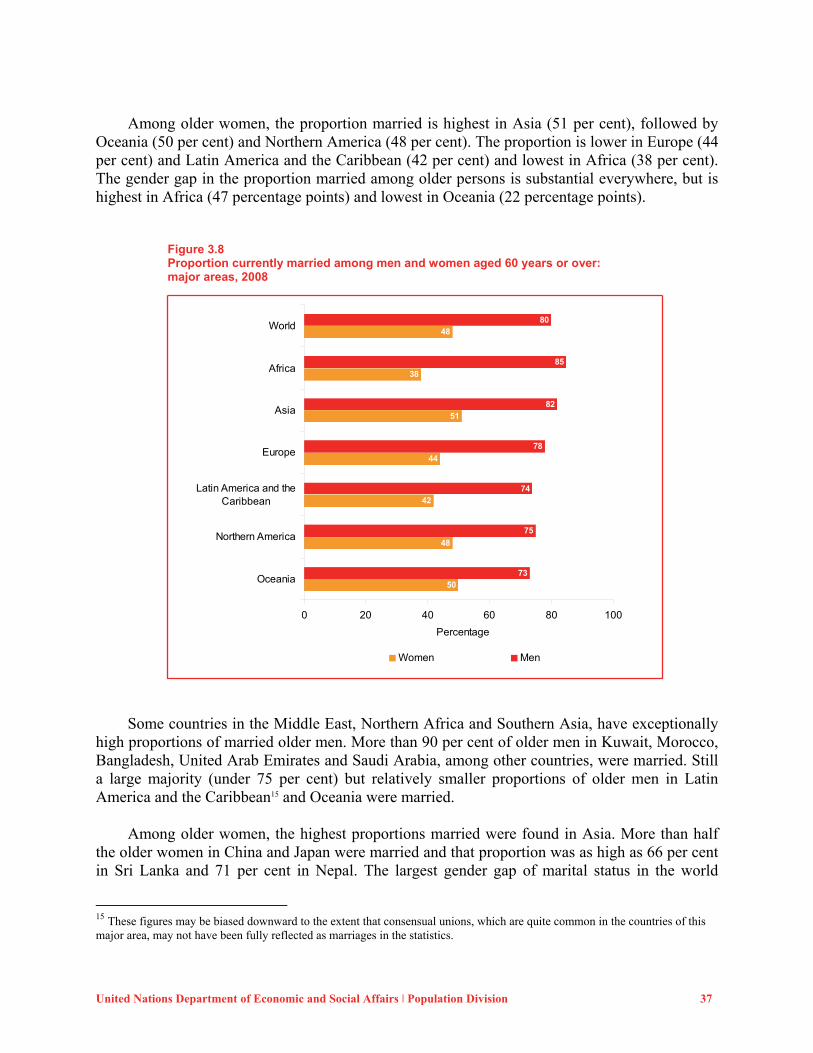
United Nations Department of Economic and Social Affairs ǀ Population Division 37
Among older women, the proportion married is highest in Asia (51 per cent), followed by Oceania (50 per cent) and Northern America (48 per cent). The proportion is lower in Europe (44 per cent) and Latin America and the Caribbean (42 per cent) and lowest in Africa (38 per cent). The gender gap in the proportion married among older persons is substantial everywhere, but is highest in Africa (47 percentage points) and lowest in Oceania (22 percentage points).
Figure 3.8 Proportion currently married among men and women aged 60 years or over: major areas, 2008
50
48
42
44
51
38
48
73
75
74
78
82
85
80
0 20 40 60 80 100
Oceania
Northern America
Latin America and theCaribbean
Europe
Asia
Africa
World
Percentage
Women Men
Some countries in the Middle East, Northern Africa and Southern Asia, have exceptionally high proportions of married older men. More than 90 per cent of older men in Kuwait, Morocco, Bangladesh, United Arab Emirates and Saudi Arabia, among other countries, were married. Still a large majority (under 75 per cent) but relatively smaller proportions of older men in Latin America and the Caribbean15 and Oceania were married. Among older women, the highest proportions married were found in Asia. More than half the older women in China and Japan were married and that proportion was as high as 66 per cent in Sri Lanka and 71 per cent in Nepal. The largest gender gap of marital status in the world
15 These figures may be biased downward to the extent that consensual unions, which are quite common in the countries of this major area, may not have been fully reflected as marriages in the statistics.
38 World Population Ageing 2013
occured in Chad, where only 16 per cent of older women were married, compared to 85 per cent of older men. Other countries with a large gender gap in marital status were the United Arab Emirates, Bangladesh and Kuwait, where the proportion married was greater than 90 per cent among older men compared to only between 30 to 38 per cent among older women.
D. LIVING ARRANGEMENTS16 The living arrangements of older persons are determined by cultural norms regarding co-residence and inter-generational ties and familial support. Living arrangements are also fundamentally affected by demographic change, and, in particular, by population ageing. In an aged population, older persons have relatively fewer children and grandchildren than in a youthful population. Partly because of this situation, older persons in more aged populations are less likely to live in multi-generational households and are more likely to live independently, that is, either alone or with a spouse only. The longer life spans associated with ageing populations open opportunities for more complex intergenerational living arrangements, such as three- or even four-generation households (United Nations, 2005). Living independently is rare among older people in developing countries, but is the dominant living arrangement in developed countries Living independently might be the preferred arrangement for some older individuals, but it might be an undesired situation for others, depending on the cultural norms and the inter-generational support system of the particular society. In developing countries where older persons have limited resources to sustain themselves and rely heavily on support from children, living independently, especially alone, could be a disadvantage or even an indication of neglect. In societies where older persons have sufficient economic resources, including public pensions and asset income, living independently tends to be a sign of economic self-sufficiency and higher standards of living. At the world level, 40 per cent of the world’s older population lives independently, with no significant difference by sex (figure 3.9). Almost half of women living independently live alone (United Nations, Department of Economic and Social Affairs, Population Division, 2012b; United Nations, 2012; UNFPA and HelpAge International, 2012). By contrast, only a minority of older men live alone. The gap in the proportion living independently between the more developed regions and the rest of the world is remarkable. Older persons who live independently represent almost three quarters of all older persons in the more developed regions compared to just over 10 per cent in least developed countries and one quarter in the less developed regions.
16 This section is based on information from the databases of the Integrated Public Use Microdata Series (IPUMS), International project (Minnesota Population Center, 2011), the Demographic and Health Surveys (DHS) programme (MEASURE DHS, 2011) and the Survey of Health, Ageing and Retirement in Europe (SHARE) study (Munich Center for the Economics of Aging, 2011). When several databases were available for a country, the most recent information was used with one exception: censuses from the 2000 wave were preferred over more recent surveys. Overall, estimates could be computed for 101 countries; the sources of data were the IPUMS for 52 countries, the DHS for 43 countries and the SHARE for 6 countries. The modal year of the databases was 2005. The median sample size for the estimates were 110,000 persons aged 60 or over in the IPUMS census micro-data, 3,100 older persons in the DHS data and 1,800 older persons in the SHARE data. Finally, the information for China came from a 20-per cent sample of 314,000 individuals of China’s 2005 mini-census.
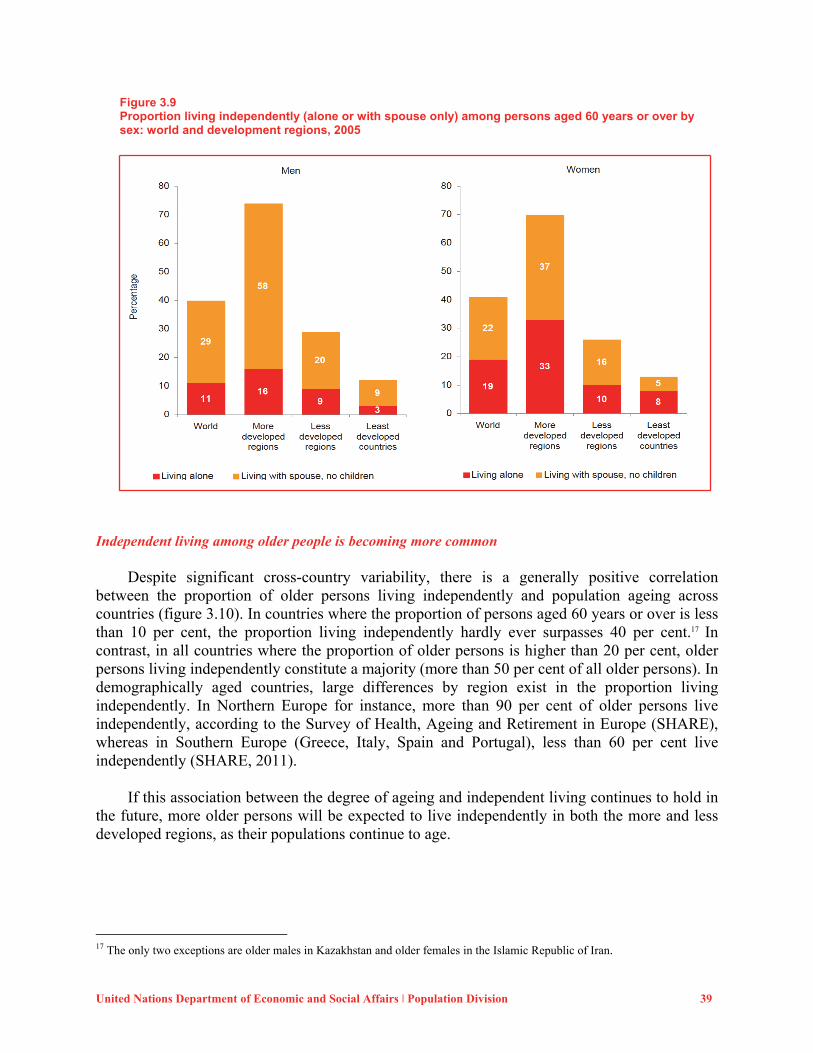
United Nations Department of Economic and Social Affairs ǀ Population Division 39
Figure 3.9 Proportion living independently (alone or with spouse only) among persons aged 60 years or over by sex: world and development regions, 2005
Independent living among older people is becoming more common Despite significant cross-country variability, there is a generally positive correlation between the proportion of older persons living independently and population ageing across countries (figure 3.10). In countries where the proportion of persons aged 60 years or over is less than 10 per cent, the proportion living independently hardly ever surpasses 40 per cent.17 In contrast, in all countries where the proportion of older persons is higher than 20 per cent, older persons living independently constitute a majority (more than 50 per cent of all older persons). In demographically aged countries, large differences by region exist in the proportion living independently. In Northern Europe for instance, more than 90 per cent of older persons live independently, according to the Survey of Health, Ageing and Retirement in Europe (SHARE), whereas in Southern Europe (Greece, Italy, Spain and Portugal), less than 60 per cent live independently (SHARE, 2011). If this association between the degree of ageing and independent living continues to hold in the future, more older persons will be expected to live independently in both the more and less developed regions, as their populations continue to age.
17 The only two exceptions are older males in Kazakhstan and older females in the Islamic Republic of Iran.
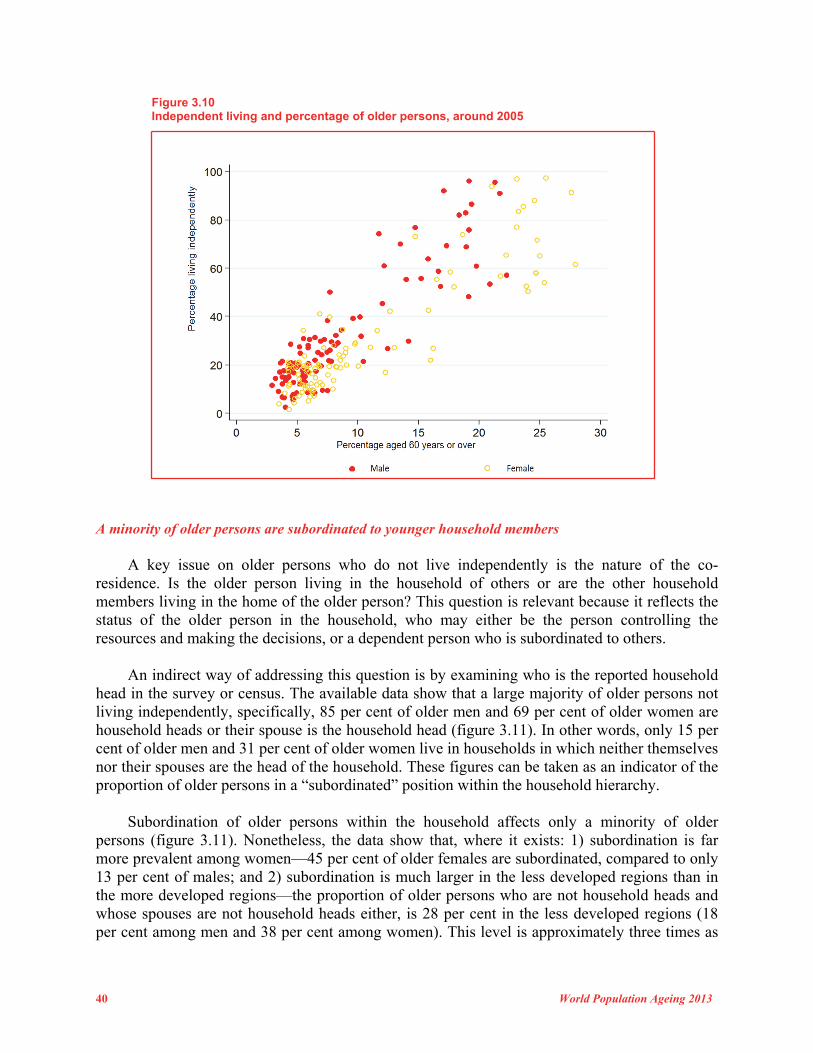
40 World Population Ageing 2013
Figure 3.10 Independent living and percentage of older persons, around 2005
A minority of older persons are subordinated to younger household members A key issue on older persons who do not live independently is the nature of the co-residence. Is the older person living in the household of others or are the other household members living in the home of the older person? This question is relevant because it reflects the status of the older person in the household, who may either be the person controlling the resources and making the decisions, or a dependent person who is subordinated to others. An indirect way of addressing this question is by examining who is the reported household head in the survey or census. The available data show that a large majority of older persons not living independently, specifically, 85 per cent of older men and 69 per cent of older women are household heads or their spouse is the household head (figure 3.11). In other words, only 15 per cent of older men and 31 per cent of older women live in households in which neither themselves nor their spouses are the head of the household. These figures can be taken as an indicator of the proportion of older persons in a “subordinated” position within the household hierarchy. Subordination of older persons within the household affects only a minority of older persons (figure 3.11). Nonetheless, the data show that, where it exists: 1) subordination is far more prevalent among women—45 per cent of older females are subordinated, compared to only 13 per cent of males; and 2) subordination is much larger in the less developed regions than in the more developed regions—the proportion of older persons who are not household heads and whose spouses are not household heads either, is 28 per cent in the less developed regions (18 per cent among men and 38 per cent among women). This level is approximately three times as
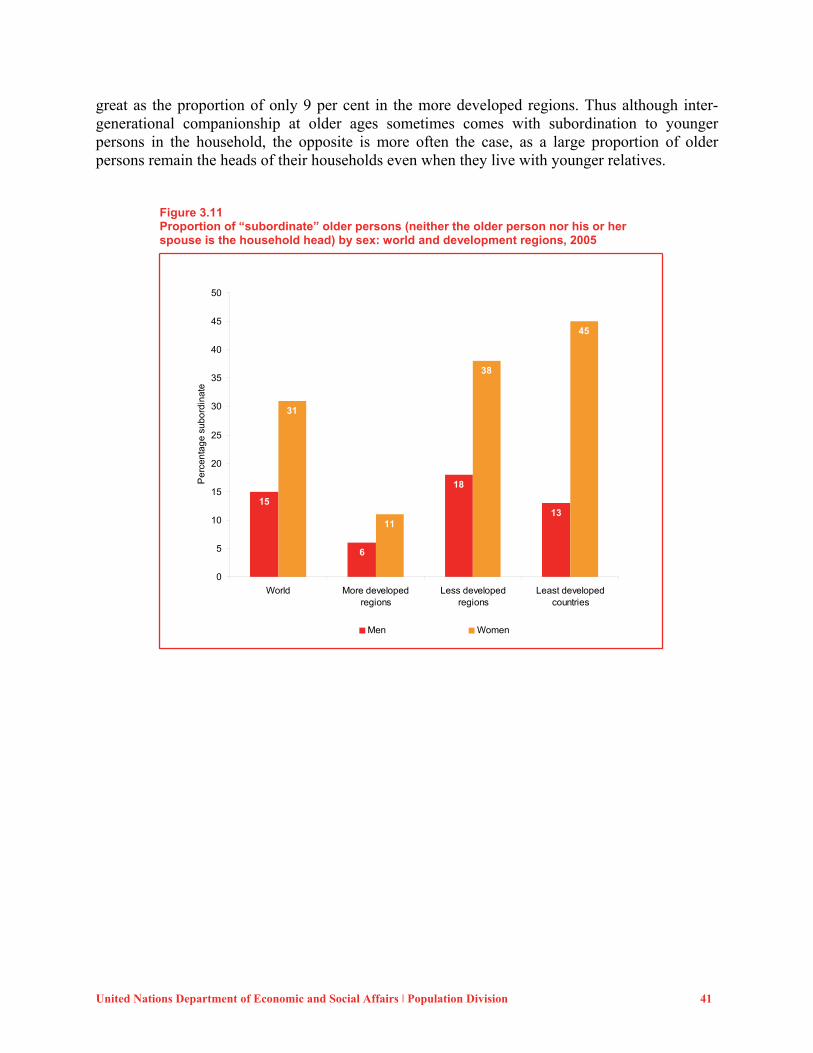
United Nations Department of Economic and Social Affairs ǀ Population Division 41
great as the proportion of only 9 per cent in the more developed regions. Thus although inter-generational companionship at older ages sometimes comes with subordination to younger persons in the household, the opposite is more often the case, as a large proportion of older persons remain the heads of their households even when they live with younger relatives.
Figure 3.11 Proportion of “subordinate” older persons (neither the older person nor his or her spouse is the household head) by sex: world and development regions, 2005
15
6
18
13
31
11
38
45
0
5
10
15
20
25
30
35
40
45
50
World More developedregions
Less developedregions
Least developedcountries
Pe
rcen
tag
e su
bord
inat
e
Men Women

United Nations Department of Economic and Social Affairs ǀ Population Division 43
IV. Characteristics of the older population
A. HEALTH OF THE OLDER POPULATION
Increasing life expectancy raises the question of whether longer life spans result in more years of life in good health, or whether it is associated with increased morbidity and more years spent in prolonged disability and dependency. The major causes of disability and health problems in old age are non-communicable diseases including the “four giants of geriatrics,” namely: memory loss, urinary incontinence, depression and falls or immobility, as well as some communicable diseases and injuries. As population age, health expenditures tend to grow rapidly since older persons usually require more health care in general and more specialized services to deal with their more complex pathologies. The number of deaths also increases sharply due to the exponential increase in mortality with age. Furthermore, older women generally experience higher rates of morbidity and disability than older men, in large part because of their longer life expectancy (WHO, 2007).
This section starts with an overview of trends in old-age mortality, and is followed by a brief examination of the major causes of death. The world’s crude death rate is beginning to rise because of population ageing
The world’s crude death rate, the ratio of annual total deaths to the total population, is increasing because population ageing shifts the age distribution towards the older ages, which are subject to higher risk of mortality (figure 4.1).18 Because of this, population ageing causes two seemingly paradoxical situations: (1) an increase in the crude death rates despite the increasingly longer life expectancy and (2) highest crude death rates observed in regions with the lowest overall levels of mortality. The global crude death rate is expected to reach its lowest point in 2015 with about 8.0 deaths per 1,000 population per year, and to gradually increase thereafter, reaching 9.8 deaths per 1,000 population by 2050.
In the more developed regions, the crude death rate has been increasing since the 1970s and will continue to rise in the foreseeable future, from 10.1 per 1,000 population in 2010 to 12.4 deaths per 1,000 population in 2050. In the less developed regions, the crude death rate is expected to decrease until 2015, to 7.5 deaths per 1,000 population, and then rise to 9.4 deaths per 1,000 by 2050. The group of least developed countries is the only development group where the crude death rate is expected to continuously decline to reach the low level of 6.8 deaths per 1,000 population by 2045. Deaths will increasingly be concentrated at older ages Population ageing, along with population growth, results in a rapidly growing number of deaths in the world, especially in the less developed regions and least developed countries (figure 4.2). The annual number of deaths in the world was rather stable, even slightly declining from 1960 to 1970, a decade in which the lowest level—51 million—of deaths per annum was recorded. From then on, the annual number of deaths has been rising; in 2010, it reached 64 million, with more than three fourths of the deaths taking place in the less developed regions.
18 A major exception is the least developed countries, where the ageing process has not yet started or is very incipient.
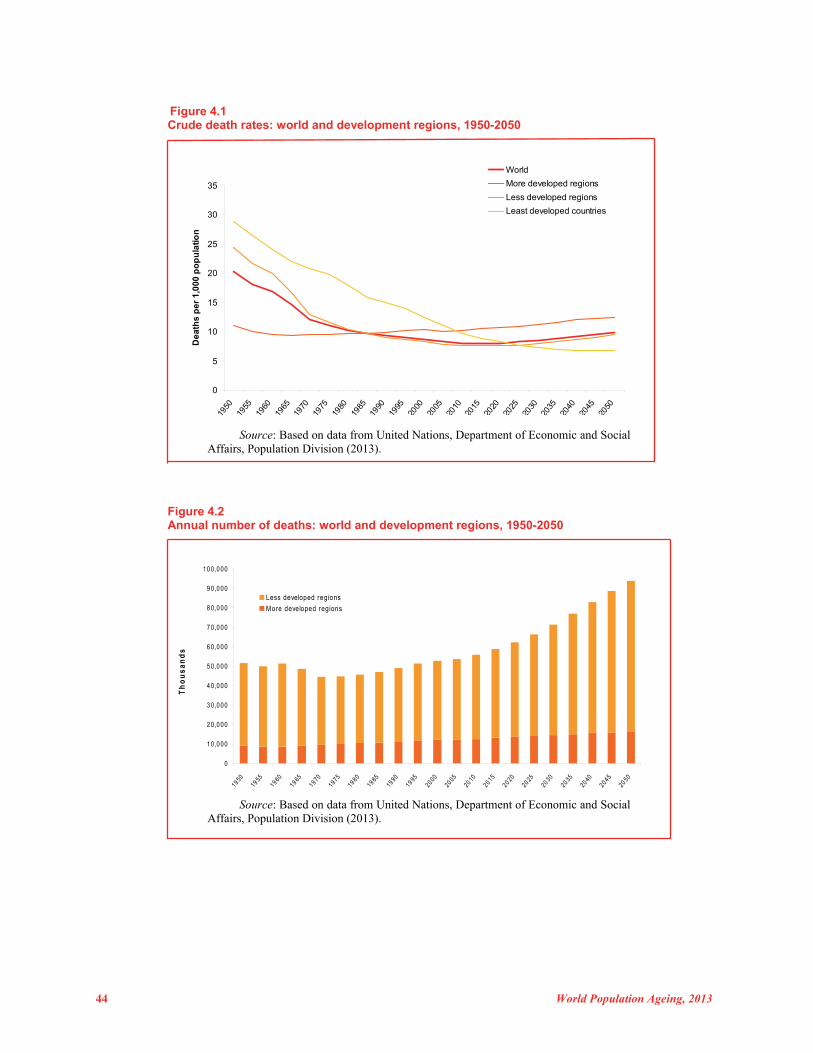
44 World Population Ageing, 2013
Figure 4.1 Crude death rates: world and development regions, 1950-2050
0
5
10
15
20
25
30
35
1950
1955
1960
1965
1970
1975
1980
1985
1990
1995
2000
2005
2010
2015
2020
2025
2030
2035
2040
2045
2050
De
ath
s p
er 1
,000
po
pu
latio
n
World
More developed regions
Less developed regions
Least developed countries
Source: Based on data from United Nations, Department of Economic and Social Affairs, Population Division (2013).
Figure 4.2 Annual number of deaths: world and development regions, 1950-2050
0
10,000
20,000
30,000
40,000
50,000
60,000
70,000
80,000
90,000
100,000
1950
19 55
19 60
1965
19 70
19 75
1980
1985
1990
1995
2000
2005
2010
2015
20 20
20 25
2030
20 35
20 40
2045
2050
Th
ou
sa
nd
s
Less developed regions
More developed regions
Source: Based on data from United Nations, Department of Economic and Social Affairs, Population Division (2013).
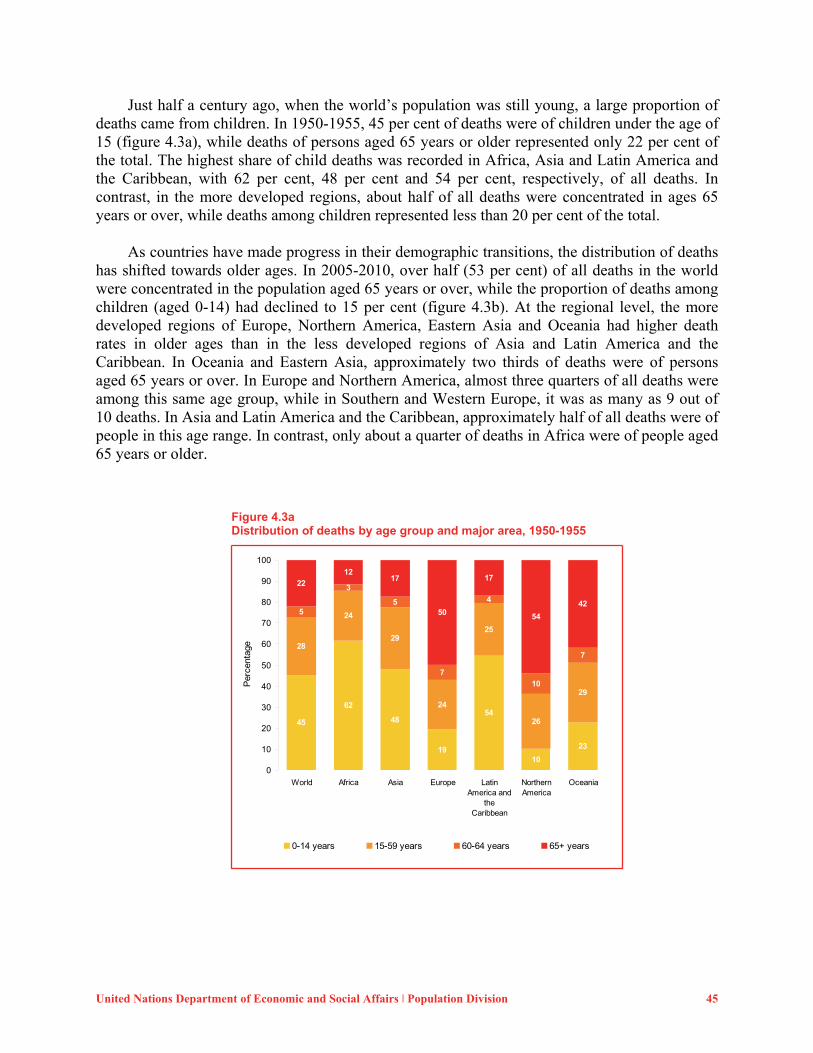
United Nations Department of Economic and Social Affairs ǀ Population Division 45
Just half a century ago, when the world’s population was still young, a large proportion of deaths came from children. In 1950-1955, 45 per cent of deaths were of children under the age of 15 (figure 4.3a), while deaths of persons aged 65 years or older represented only 22 per cent of the total. The highest share of child deaths was recorded in Africa, Asia and Latin America and the Caribbean, with 62 per cent, 48 per cent and 54 per cent, respectively, of all deaths. In contrast, in the more developed regions, about half of all deaths were concentrated in ages 65 years or over, while deaths among children represented less than 20 per cent of the total.
As countries have made progress in their demographic transitions, the distribution of deaths
has shifted towards older ages. In 2005-2010, over half (53 per cent) of all deaths in the world were concentrated in the population aged 65 years or over, while the proportion of deaths among children (aged 0-14) had declined to 15 per cent (figure 4.3b). At the regional level, the more developed regions of Europe, Northern America, Eastern Asia and Oceania had higher death rates in older ages than in the less developed regions of Asia and Latin America and the Caribbean. In Oceania and Eastern Asia, approximately two thirds of deaths were of persons aged 65 years or over. In Europe and Northern America, almost three quarters of all deaths were among this same age group, while in Southern and Western Europe, it was as many as 9 out of 10 deaths. In Asia and Latin America and the Caribbean, approximately half of all deaths were of people in this age range. In contrast, only about a quarter of deaths in Africa were of people aged 65 years or older.
Figure 4.3a Distribution of deaths by age group and major area, 1950-1955
45
62
48
19
54
10
23
28
24
29
24
25
26
29
5
3
5
7
4
10
7
22
1217
50
17
54
42
0
10
20
30
40
50
60
70
80
90
100
World Africa Asia Europe LatinAmerica and
theCaribbean
NorthernAmerica
Oceania
Per
cent
age
0-14 years 15-59 years 60-64 years 65+ years
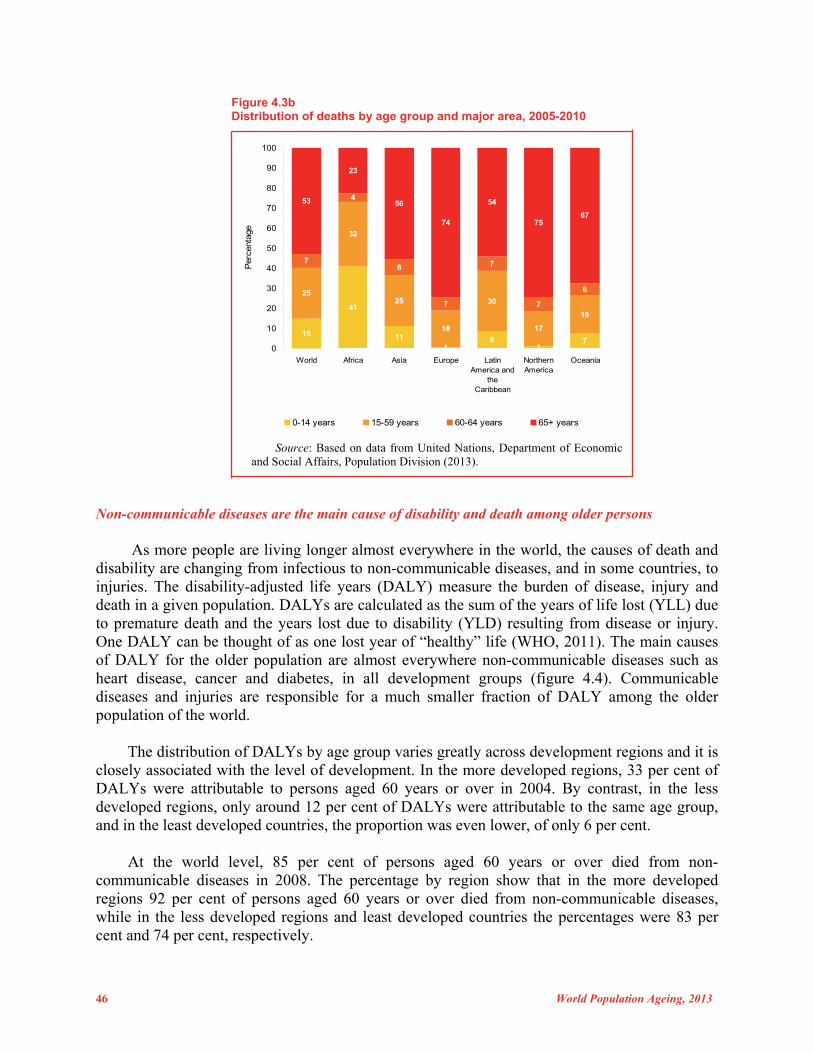
46 World Population Ageing, 2013
Figure 4.3b Distribution of deaths by age group and major area, 2005-2010
15
41
111
81
7
25
32
25
18
30
17
19
7
4
8
7
7
7
6
53
23
56
74
54
7567
0
10
20
30
40
50
60
70
80
90
100
World Africa Asia Europe LatinAmerica and
theCaribbean
NorthernAmerica
Oceania
Per
cent
age
0-14 years 15-59 years 60-64 years 65+ years
Source: Based on data from United Nations, Department of Economic and Social Affairs, Population Division (2013).
Non-communicable diseases are the main cause of disability and death among older persons As more people are living longer almost everywhere in the world, the causes of death and disability are changing from infectious to non-communicable diseases, and in some countries, to injuries. The disability-adjusted life years (DALY) measure the burden of disease, injury and death in a given population. DALYs are calculated as the sum of the years of life lost (YLL) due to premature death and the years lost due to disability (YLD) resulting from disease or injury. One DALY can be thought of as one lost year of “healthy” life (WHO, 2011). The main causes of DALY for the older population are almost everywhere non-communicable diseases such as heart disease, cancer and diabetes, in all development groups (figure 4.4). Communicable diseases and injuries are responsible for a much smaller fraction of DALY among the older population of the world.
The distribution of DALYs by age group varies greatly across development regions and it is closely associated with the level of development. In the more developed regions, 33 per cent of DALYs were attributable to persons aged 60 years or over in 2004. By contrast, in the less developed regions, only around 12 per cent of DALYs were attributable to the same age group, and in the least developed countries, the proportion was even lower, of only 6 per cent.
At the world level, 85 per cent of persons aged 60 years or over died from non-
communicable diseases in 2008. The percentage by region show that in the more developed regions 92 per cent of persons aged 60 years or over died from non-communicable diseases, while in the less developed regions and least developed countries the percentages were 83 per cent and 74 per cent, respectively.
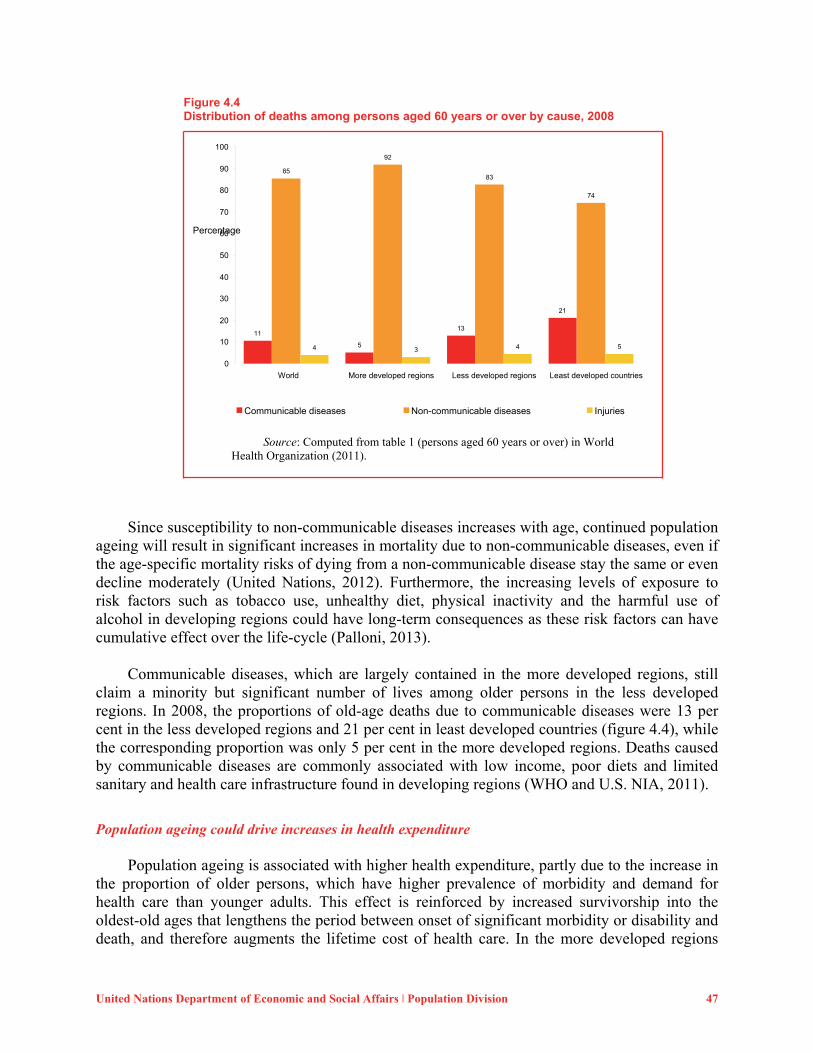
United Nations Department of Economic and Social Affairs ǀ Population Division 47
Figure 4.4 Distribution of deaths among persons aged 60 years or over by cause, 2008
Source: Computed from table 1 (persons aged 60 years or over) in World Health Organization (2011).
Since susceptibility to non-communicable diseases increases with age, continued population
ageing will result in significant increases in mortality due to non-communicable diseases, even if the age-specific mortality risks of dying from a non-communicable disease stay the same or even decline moderately (United Nations, 2012). Furthermore, the increasing levels of exposure to risk factors such as tobacco use, unhealthy diet, physical inactivity and the harmful use of alcohol in developing regions could have long-term consequences as these risk factors can have cumulative effect over the life-cycle (Palloni, 2013).
Communicable diseases, which are largely contained in the more developed regions, still claim a minority but significant number of lives among older persons in the less developed regions. In 2008, the proportions of old-age deaths due to communicable diseases were 13 per cent in the less developed regions and 21 per cent in least developed countries (figure 4.4), while the corresponding proportion was only 5 per cent in the more developed regions. Deaths caused by communicable diseases are commonly associated with low income, poor diets and limited sanitary and health care infrastructure found in developing regions (WHO and U.S. NIA, 2011).
Population ageing could drive increases in health expenditure
Population ageing is associated with higher health expenditure, partly due to the increase in the proportion of older persons, which have higher prevalence of morbidity and demand for health care than younger adults. This effect is reinforced by increased survivorship into the oldest-old ages that lengthens the period between onset of significant morbidity or disability and death, and therefore augments the lifetime cost of health care. In the more developed regions
11 5
13
21
85
92
83
74
4 3 4 5 0
10 20 30 40 50 60 70 80 90
100
World More developed regions Less developed regions Least developed countries
Percentage
Communicable diseases Non-communicable diseases Injuries
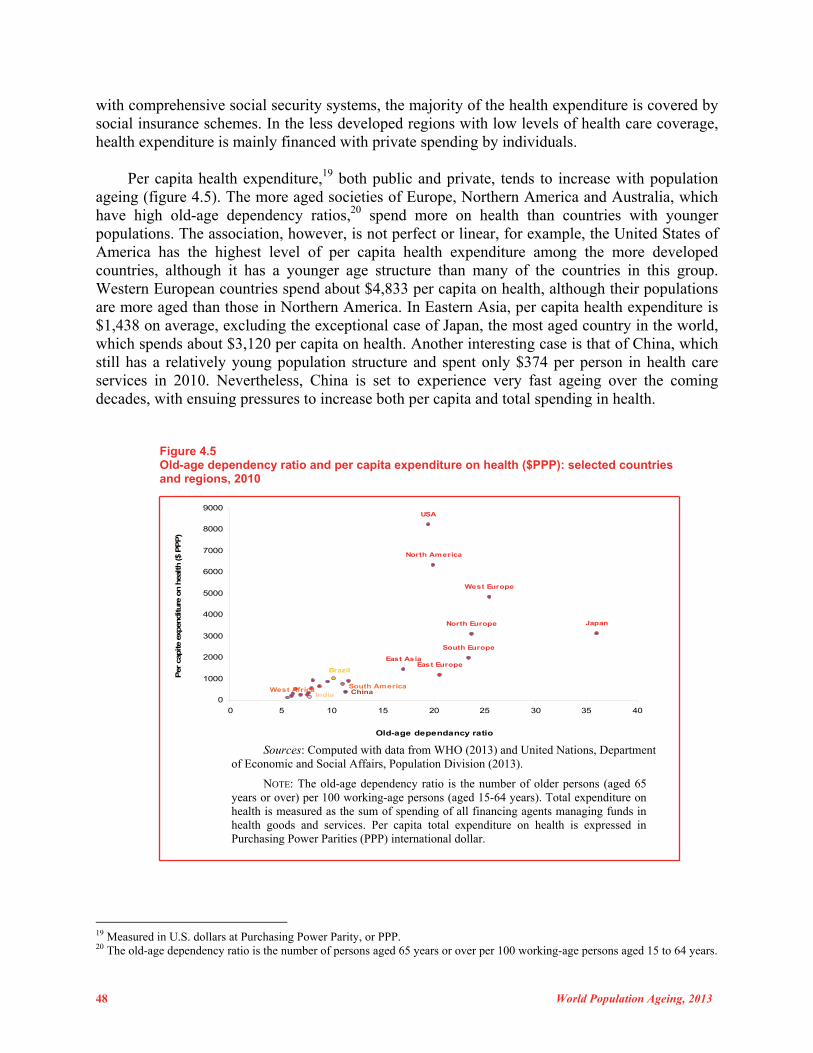
48 World Population Ageing, 2013
with comprehensive social security systems, the majority of the health expenditure is covered by social insurance schemes. In the less developed regions with low levels of health care coverage, health expenditure is mainly financed with private spending by individuals.
Per capita health expenditure,19 both public and private, tends to increase with population ageing (figure 4.5). The more aged societies of Europe, Northern America and Australia, which have high old-age dependency ratios,20 spend more on health than countries with younger populations. The association, however, is not perfect or linear, for example, the United States of America has the highest level of per capita health expenditure among the more developed countries, although it has a younger age structure than many of the countries in this group. Western European countries spend about $4,833 per capita on health, although their populations are more aged than those in Northern America. In Eastern Asia, per capita health expenditure is $1,438 on average, excluding the exceptional case of Japan, the most aged country in the world, which spends about $3,120 per capita on health. Another interesting case is that of China, which still has a relatively young population structure and spent only $374 per person in health care services in 2010. Nevertheless, China is set to experience very fast ageing over the coming decades, with ensuing pressures to increase both per capita and total spending in health.
Figure 4.5 Old-age dependency ratio and per capita expenditure on health ($PPP): selected countries and regions, 2010
Brazil
India
Japan
USA
China
North America
West Europe
North Europe
South Europe
East AsiaEast Europe
South AmericaWest Africa
0
1000
2000
3000
4000
5000
6000
7000
8000
9000
0 5 10 15 20 25 30 35 40
Old-age dependancy ratio
Per
cap
ite
expen
diture
on h
ealth ($
PP
P)
Sources: Computed with data from WHO (2013) and United Nations, Department of Economic and Social Affairs, Population Division (2013).
NOTE: The old-age dependency ratio is the number of older persons (aged 65 years or over) per 100 working-age persons (aged 15-64 years). Total expenditure on health is measured as the sum of spending of all financing agents managing funds in health goods and services. Per capita total expenditure on health is expressed in Purchasing Power Parities (PPP) international dollar.
19 Measured in U.S. dollars at Purchasing Power Parity, or PPP. 20 The old-age dependency ratio is the number of persons aged 65 years or over per 100 working-age persons aged 15 to 64 years.
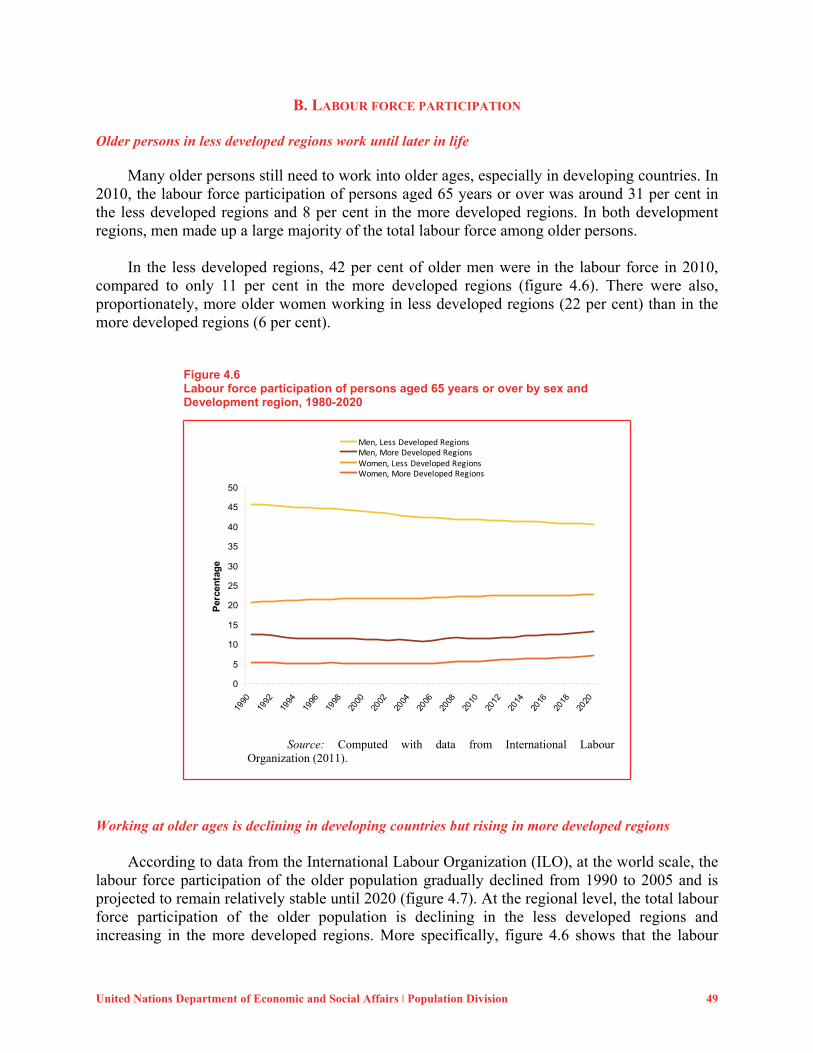
United Nations Department of Economic and Social Affairs ǀ Population Division 49
B. LABOUR FORCE PARTICIPATION Older persons in less developed regions work until later in life Many older persons still need to work into older ages, especially in developing countries. In 2010, the labour force participation of persons aged 65 years or over was around 31 per cent in the less developed regions and 8 per cent in the more developed regions. In both development regions, men made up a large majority of the total labour force among older persons. In the less developed regions, 42 per cent of older men were in the labour force in 2010, compared to only 11 per cent in the more developed regions (figure 4.6). There were also, proportionately, more older women working in less developed regions (22 per cent) than in the more developed regions (6 per cent).
Figure 4.6 Labour force participation of persons aged 65 years or over by sex and Development region, 1980-2020
0
5
10
15
20
25
30
35
40
45
50
1990
1992
1994
1996
1998
2000
2002
2004
2006
2008
2010
2012
2014
2016
2018
2020
Per
cen
tag
e
Men, Less Developed RegionsMen, More Developed RegionsWomen, Less Developed RegionsWomen, More Developed Regions
Source: Computed with data from International Labour Organization (2011).
Working at older ages is declining in developing countries but rising in more developed regions According to data from the International Labour Organization (ILO), at the world scale, the labour force participation of the older population gradually declined from 1990 to 2005 and is projected to remain relatively stable until 2020 (figure 4.7). At the regional level, the total labour force participation of the older population is declining in the less developed regions and increasing in the more developed regions. More specifically, figure 4.6 shows that the labour
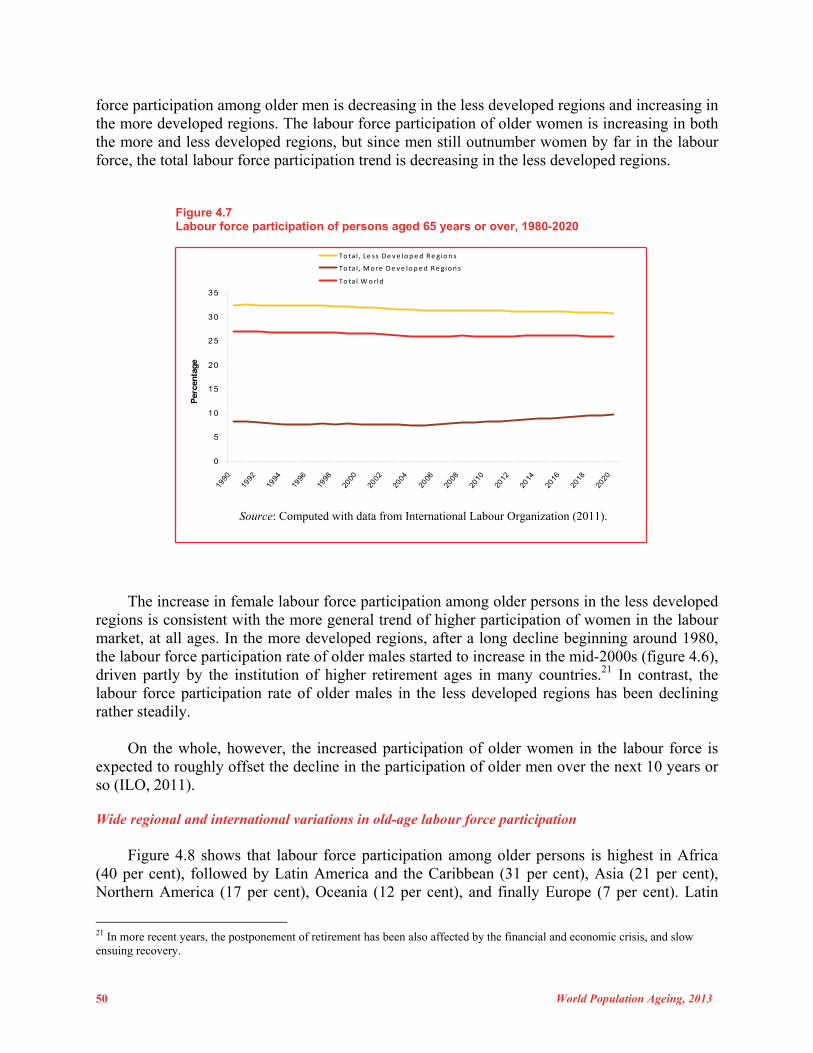
50 World Population Ageing, 2013
force participation among older men is decreasing in the less developed regions and increasing in the more developed regions. The labour force participation of older women is increasing in both the more and less developed regions, but since men still outnumber women by far in the labour force, the total labour force participation trend is decreasing in the less developed regions.
Figure 4.7 Labour force participation of persons aged 65 years or over, 1980-2020
0
5
10
15
20
25
30
35
1990
1992
1994
1996
1998
2000
2002
2004
2006
2008
2010
2012
2014
2016
2018
2020
Per
cen
tag
e
To tal, Le ss Deve loped Regions
To tal , More De ve loped Regions
To tal World
Source: Computed with data from International Labour Organization (2011).
The increase in female labour force participation among older persons in the less developed regions is consistent with the more general trend of higher participation of women in the labour market, at all ages. In the more developed regions, after a long decline beginning around 1980, the labour force participation rate of older males started to increase in the mid-2000s (figure 4.6), driven partly by the institution of higher retirement ages in many countries.21 In contrast, the labour force participation rate of older males in the less developed regions has been declining rather steadily. On the whole, however, the increased participation of older women in the labour force is expected to roughly offset the decline in the participation of older men over the next 10 years or so (ILO, 2011). Wide regional and international variations in old-age labour force participation Figure 4.8 shows that labour force participation among older persons is highest in Africa (40 per cent), followed by Latin America and the Caribbean (31 per cent), Asia (21 per cent), Northern America (17 per cent), Oceania (12 per cent), and finally Europe (7 per cent). Latin
21 In more recent years, the postponement of retirement has been also affected by the financial and economic crisis, and slow ensuing recovery.
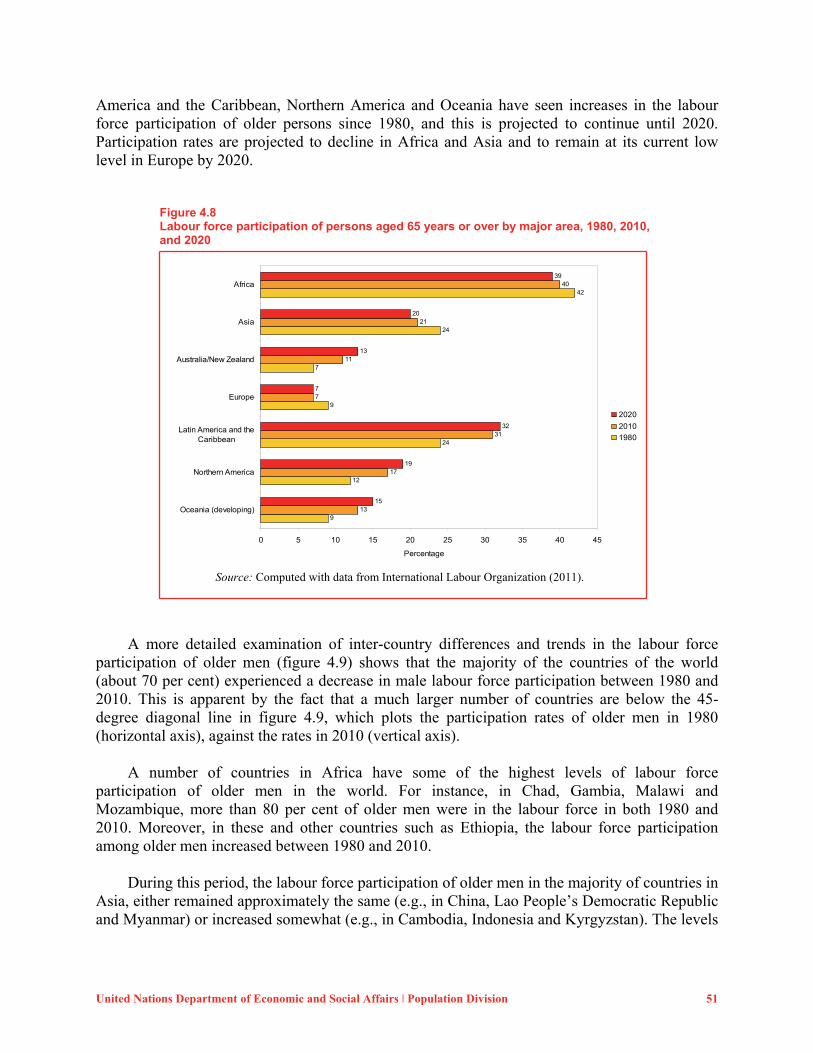
United Nations Department of Economic and Social Affairs ǀ Population Division 51
America and the Caribbean, Northern America and Oceania have seen increases in the labour force participation of older persons since 1980, and this is projected to continue until 2020. Participation rates are projected to decline in Africa and Asia and to remain at its current low level in Europe by 2020.
Figure 4.8 Labour force participation of persons aged 65 years or over by major area, 1980, 2010, and 2020
9
12
24
9
7
24
42
13
17
31
7
11
21
40
15
19
32
7
13
20
39
0 5 10 15 20 25 30 35 40 45
Oceania (developing)
Northern America
Latin America and theCaribbean
Europe
Australia/New Zealand
Asia
Africa
Percentage
2020
2010
1980
Source: Computed with data from International Labour Organization (2011). A more detailed examination of inter-country differences and trends in the labour force participation of older men (figure 4.9) shows that the majority of the countries of the world (about 70 per cent) experienced a decrease in male labour force participation between 1980 and 2010. This is apparent by the fact that a much larger number of countries are below the 45-degree diagonal line in figure 4.9, which plots the participation rates of older men in 1980 (horizontal axis), against the rates in 2010 (vertical axis). A number of countries in Africa have some of the highest levels of labour force participation of older men in the world. For instance, in Chad, Gambia, Malawi and Mozambique, more than 80 per cent of older men were in the labour force in both 1980 and 2010. Moreover, in these and other countries such as Ethiopia, the labour force participation among older men increased between 1980 and 2010. During this period, the labour force participation of older men in the majority of countries in Asia, either remained approximately the same (e.g., in China, Lao People’s Democratic Republic and Myanmar) or increased somewhat (e.g., in Cambodia, Indonesia and Kyrgyzstan). The levels
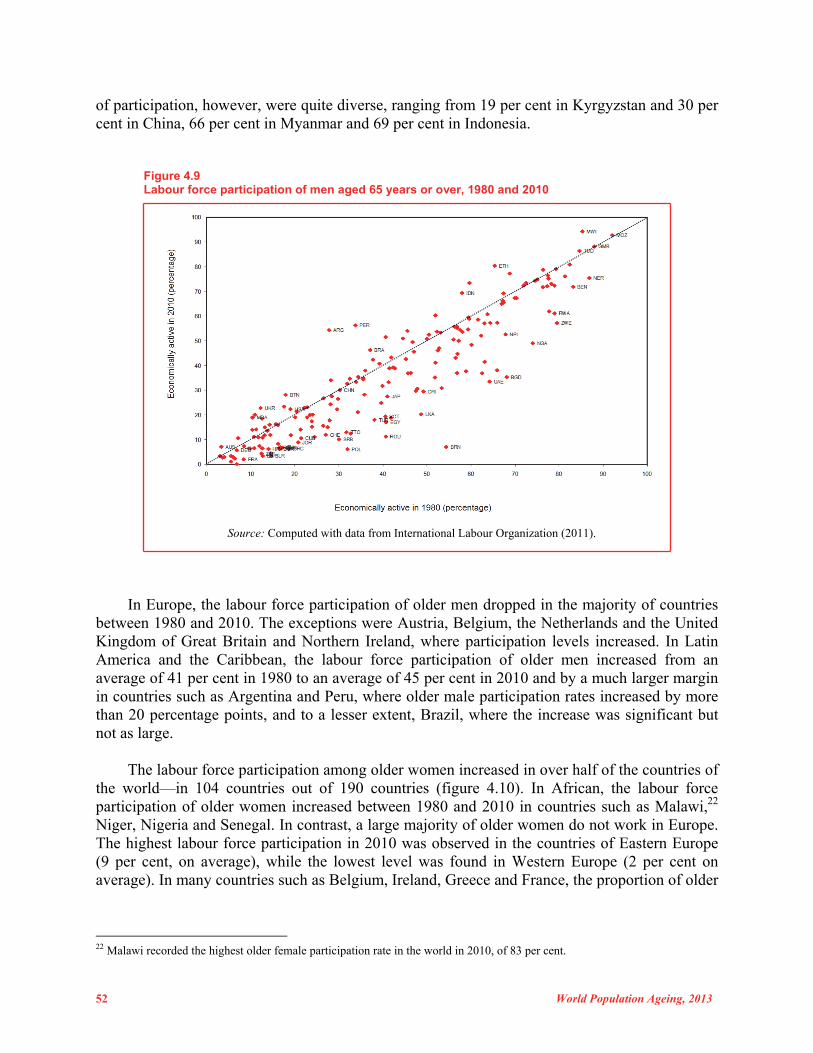
52 World Population Ageing, 2013
of participation, however, were quite diverse, ranging from 19 per cent in Kyrgyzstan and 30 per cent in China, 66 per cent in Myanmar and 69 per cent in Indonesia.
Figure 4.9 Labour force participation of men aged 65 years or over, 1980 and 2010
Source: Computed with data from International Labour Organization (2011).
In Europe, the labour force participation of older men dropped in the majority of countries between 1980 and 2010. The exceptions were Austria, Belgium, the Netherlands and the United Kingdom of Great Britain and Northern Ireland, where participation levels increased. In Latin America and the Caribbean, the labour force participation of older men increased from an average of 41 per cent in 1980 to an average of 45 per cent in 2010 and by a much larger margin in countries such as Argentina and Peru, where older male participation rates increased by more than 20 percentage points, and to a lesser extent, Brazil, where the increase was significant but not as large. The labour force participation among older women increased in over half of the countries of the world—in 104 countries out of 190 countries (figure 4.10). In African, the labour force participation of older women increased between 1980 and 2010 in countries such as Malawi,22 Niger, Nigeria and Senegal. In contrast, a large majority of older women do not work in Europe. The highest labour force participation in 2010 was observed in the countries of Eastern Europe (9 per cent, on average), while the lowest level was found in Western Europe (2 per cent on average). In many countries such as Belgium, Ireland, Greece and France, the proportion of older
22 Malawi recorded the highest older female participation rate in the world in 2010, of 83 per cent.
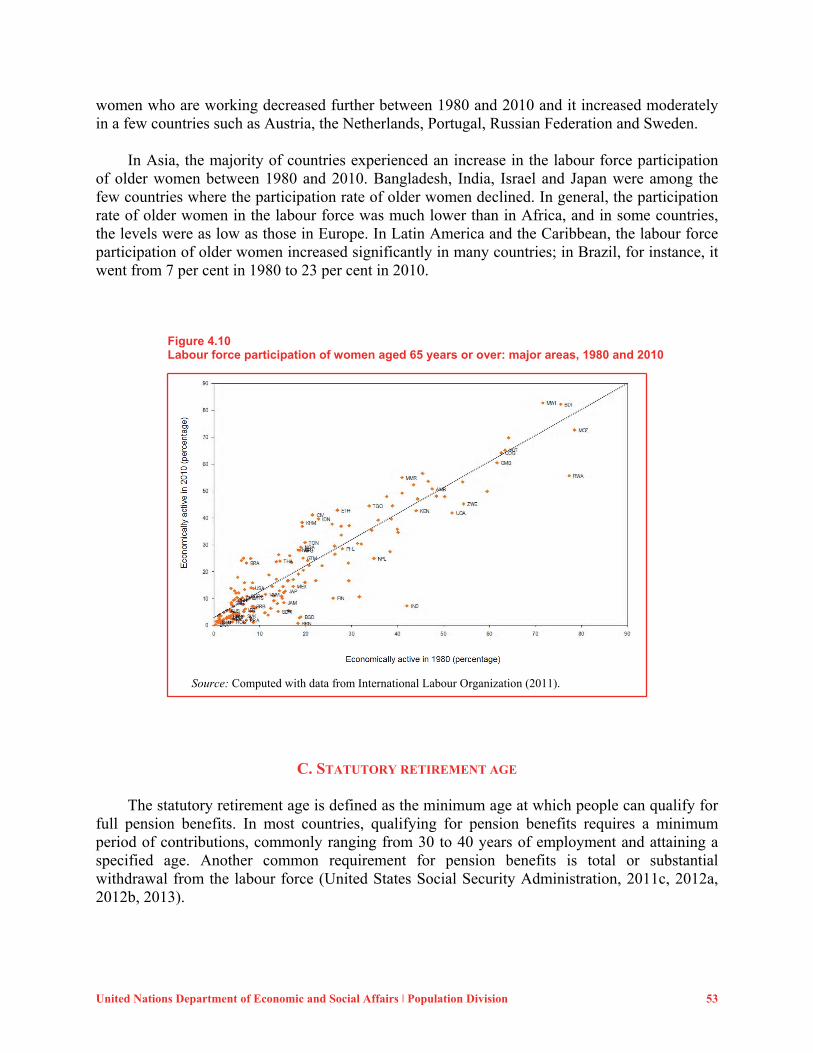
United Nations Department of Economic and Social Affairs ǀ Population Division 53
women who are working decreased further between 1980 and 2010 and it increased moderately in a few countries such as Austria, the Netherlands, Portugal, Russian Federation and Sweden. In Asia, the majority of countries experienced an increase in the labour force participation of older women between 1980 and 2010. Bangladesh, India, Israel and Japan were among the few countries where the participation rate of older women declined. In general, the participation rate of older women in the labour force was much lower than in Africa, and in some countries, the levels were as low as those in Europe. In Latin America and the Caribbean, the labour force participation of older women increased significantly in many countries; in Brazil, for instance, it went from 7 per cent in 1980 to 23 per cent in 2010.
Figure 4.10 Labour force participation of women aged 65 years or over: major areas, 1980 and 2010
Source: Computed with data from International Labour Organization (2011).
C. STATUTORY RETIREMENT AGE The statutory retirement age is defined as the minimum age at which people can qualify for full pension benefits. In most countries, qualifying for pension benefits requires a minimum period of contributions, commonly ranging from 30 to 40 years of employment and attaining a specified age. Another common requirement for pension benefits is total or substantial withdrawal from the labour force (United States Social Security Administration, 2011c, 2012a, 2012b, 2013).
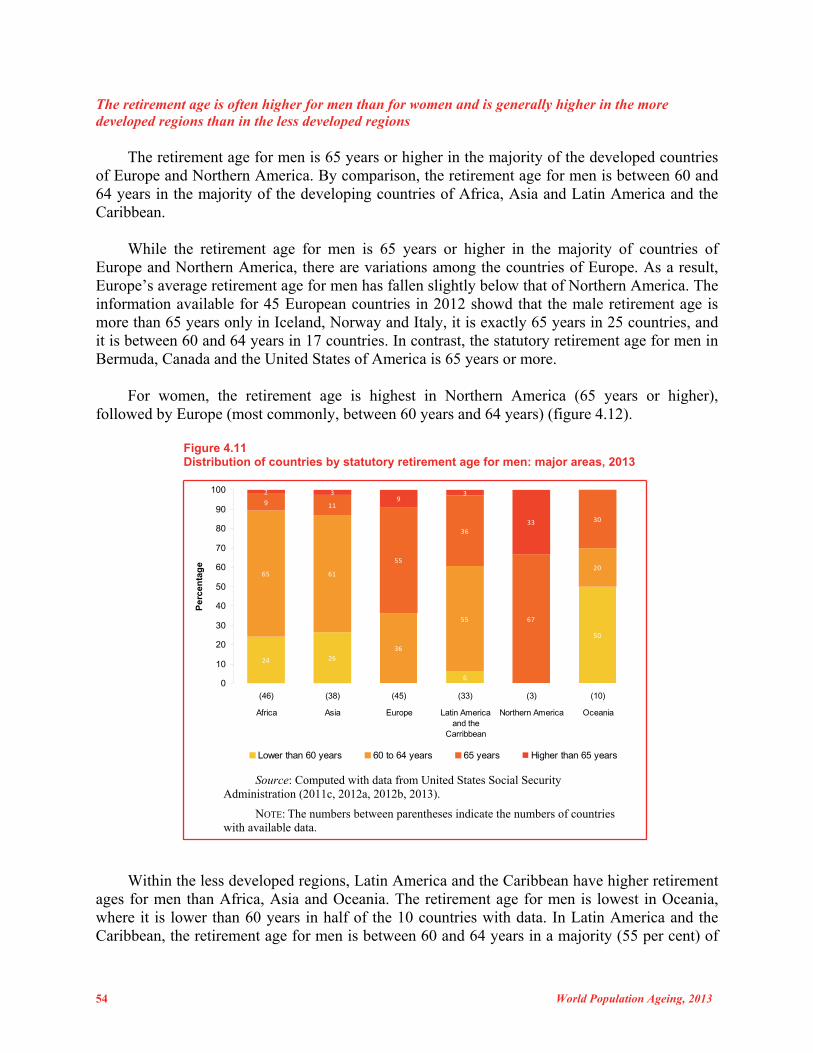
54 World Population Ageing, 2013
The retirement age is often higher for men than for women and is generally higher in the more developed regions than in the less developed regions The retirement age for men is 65 years or higher in the majority of the developed countries of Europe and Northern America. By comparison, the retirement age for men is between 60 and 64 years in the majority of the developing countries of Africa, Asia and Latin America and the Caribbean. While the retirement age for men is 65 years or higher in the majority of countries of Europe and Northern America, there are variations among the countries of Europe. As a result, Europe’s average retirement age for men has fallen slightly below that of Northern America. The information available for 45 European countries in 2012 showd that the male retirement age is more than 65 years only in Iceland, Norway and Italy, it is exactly 65 years in 25 countries, and it is between 60 and 64 years in 17 countries. In contrast, the statutory retirement age for men in Bermuda, Canada and the United States of America is 65 years or more. For women, the retirement age is highest in Northern America (65 years or higher), followed by Europe (most commonly, between 60 years and 64 years) (figure 4.12).
Figure 4.11 Distribution of countries by statutory retirement age for men: major areas, 2013
24 26
6
50
65 61
36
55
20
9 11
55
36
67
30
2 39
3
33
0
10
20
30
40
50
60
70
80
90
100
(46) (38) (45) (33) (3) (10)
Africa Asia Europe Latin Americaand the
Carribbean
Northern America Oceania
Pe
rce
nta
ge
Lower than 60 years 60 to 64 years 65 years Higher than 65 years
Source: Computed with data from United States Social Security Administration (2011c, 2012a, 2012b, 2013).
NOTE: The numbers between parentheses indicate the numbers of countries with available data.
Within the less developed regions, Latin America and the Caribbean have higher retirement ages for men than Africa, Asia and Oceania. The retirement age for men is lowest in Oceania, where it is lower than 60 years in half of the 10 countries with data. In Latin America and the Caribbean, the retirement age for men is between 60 and 64 years in a majority (55 per cent) of
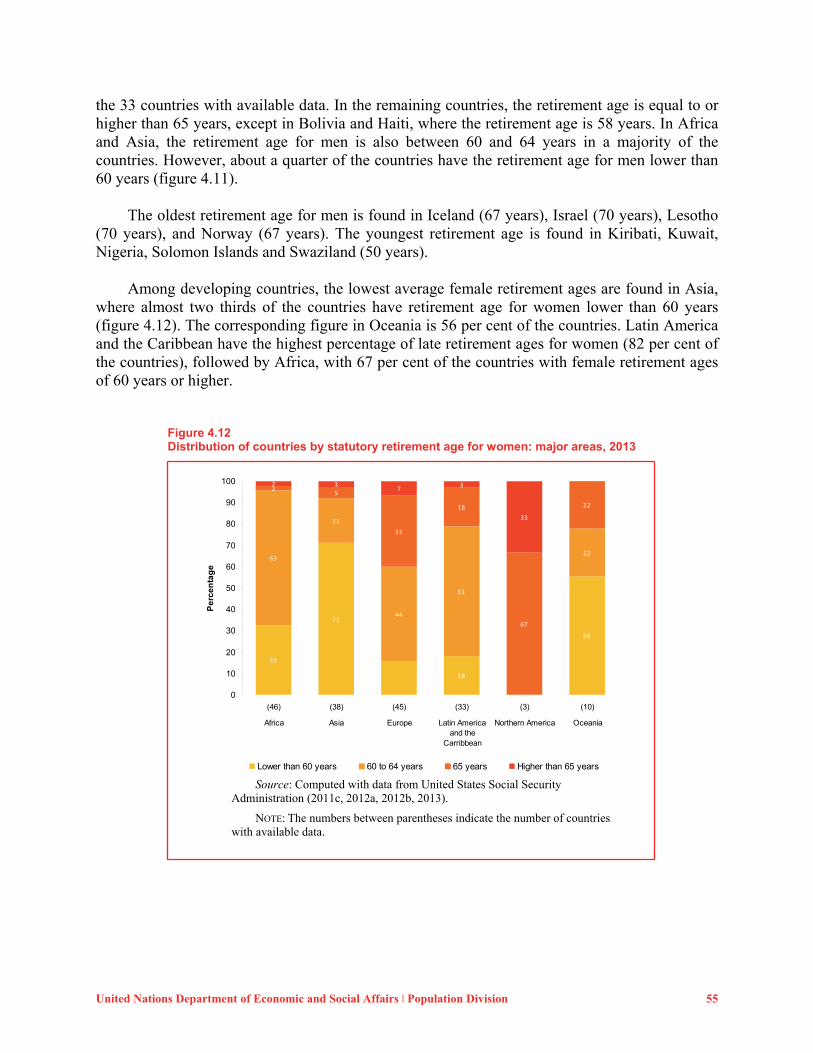
United Nations Department of Economic and Social Affairs ǀ Population Division 55
the 33 countries with available data. In the remaining countries, the retirement age is equal to or higher than 65 years, except in Bolivia and Haiti, where the retirement age is 58 years. In Africa and Asia, the retirement age for men is also between 60 and 64 years in a majority of the countries. However, about a quarter of the countries have the retirement age for men lower than 60 years (figure 4.11). The oldest retirement age for men is found in Iceland (67 years), Israel (70 years), Lesotho (70 years), and Norway (67 years). The youngest retirement age is found in Kiribati, Kuwait, Nigeria, Solomon Islands and Swaziland (50 years). Among developing countries, the lowest average female retirement ages are found in Asia, where almost two thirds of the countries have retirement age for women lower than 60 years (figure 4.12). The corresponding figure in Oceania is 56 per cent of the countries. Latin America and the Caribbean have the highest percentage of late retirement ages for women (82 per cent of the countries), followed by Africa, with 67 per cent of the countries with female retirement ages of 60 years or higher.
Figure 4.12 Distribution of countries by statutory retirement age for women: major areas, 2013
33
71
18
56
63
21
44
61
22
25
33
18
67
22
2 37
3
33
0
10
20
30
40
50
60
70
80
90
100
(46) (38) (45) (33) (3) (10)
Africa Asia Europe Latin Americaand the
Carribbean
Northern America Oceania
Pe
rce
nta
ge
Lower than 60 years 60 to 64 years 65 years Higher than 65 years Source: Computed with data from United States Social Security
Administration (2011c, 2012a, 2012b, 2013).
NOTE: The numbers between parentheses indicate the number of countries with available data.
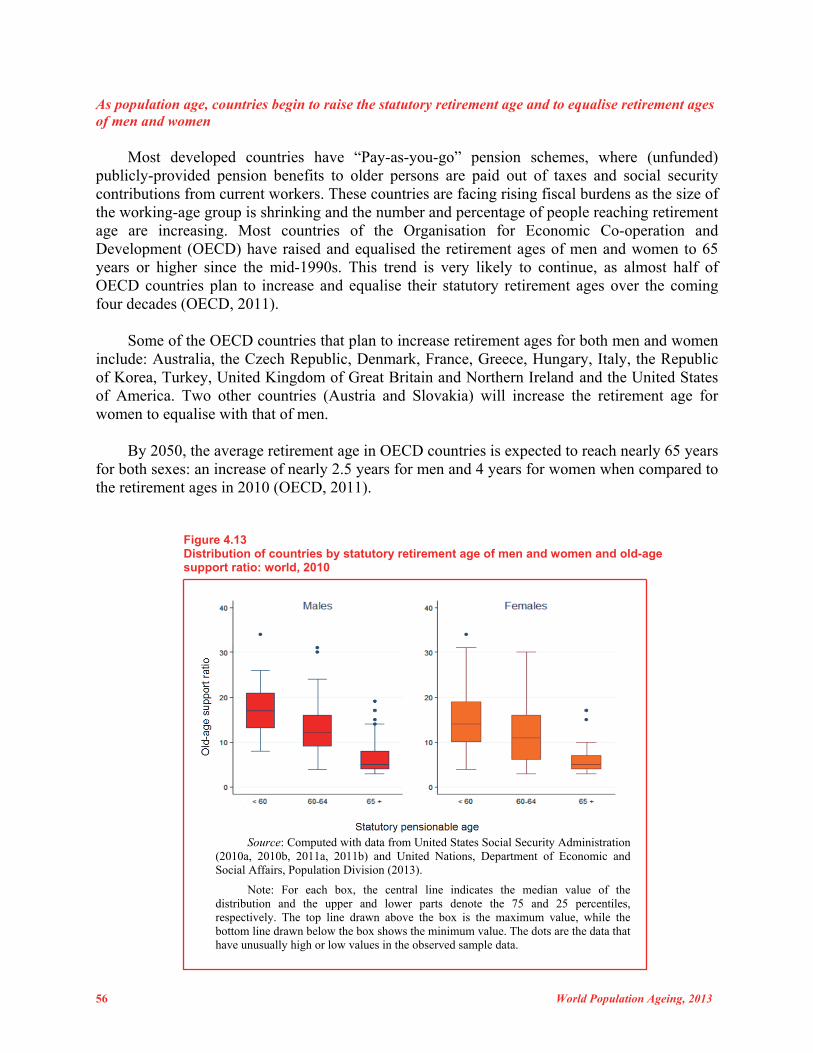
56 World Population Ageing, 2013
As population age, countries begin to raise the statutory retirement age and to equalise retirement ages of men and women Most developed countries have “Pay-as-you-go” pension schemes, where (unfunded) publicly-provided pension benefits to older persons are paid out of taxes and social security contributions from current workers. These countries are facing rising fiscal burdens as the size of the working-age group is shrinking and the number and percentage of people reaching retirement age are increasing. Most countries of the Organisation for Economic Co-operation and Development (OECD) have raised and equalised the retirement ages of men and women to 65 years or higher since the mid-1990s. This trend is very likely to continue, as almost half of OECD countries plan to increase and equalise their statutory retirement ages over the coming four decades (OECD, 2011). Some of the OECD countries that plan to increase retirement ages for both men and women include: Australia, the Czech Republic, Denmark, France, Greece, Hungary, Italy, the Republic of Korea, Turkey, United Kingdom of Great Britain and Northern Ireland and the United States of America. Two other countries (Austria and Slovakia) will increase the retirement age for women to equalise with that of men. By 2050, the average retirement age in OECD countries is expected to reach nearly 65 years for both sexes: an increase of nearly 2.5 years for men and 4 years for women when compared to the retirement ages in 2010 (OECD, 2011).
Figure 4.13 Distribution of countries by statutory retirement age of men and women and old-age support ratio: world, 2010
Source: Computed with data from United States Social Security Administration (2010a, 2010b, 2011a, 2011b) and United Nations, Department of Economic and Social Affairs, Population Division (2013).
Note: For each box, the central line indicates the median value of the distribution and the upper and lower parts denote the 75 and 25 percentiles, respectively. The top line drawn above the box is the maximum value, while the bottom line drawn below the box shows the minimum value. The dots are the data that have unusually high or low values in the observed sample data.
United Nations Department of Economic and Social Affairs ǀ Population Division 57
Unlike most of the OECD countries, the majority of developing countries continue to allow men to receive pension benefits at ages younger than 65 years and women at even younger ages. A high old-age support ratio, that is, a high number of persons in the main working ages (aged 15 to 64 years) to support each older person (aged 65 years or over) in the population, affords more easily the possibility to retire at a relatively young age. Figure 4.13 shows that practically all countries with male statutory retirement ages lower than 60 years have old-age support ratios of 10 or more working age people for each older person. By contrast, most countries with old-age support ratios lower than 10 have statutory retirement ages of 65 years or over. This association between old-age support ratio and retirement age is also observed for women, although it is less pronounced than for men (figure 4.13). As populations continue to age throughout the world, Governments will face increasing pressure to raise statutory retirement ages in the decades to come.

United Nations Department of Economic and Social Affairs ǀ Population Division 59
V. Intergenerational transfers and well-being in old age
A. Economic Support systems
In most modern societies, older persons consume more than they produce and therefore resort to other sources of support, such as income from their assets, savings and transfers from their family and the Government (Mason and others, 2009; United Nations, 2013). How older people finance their consumption differs widely across countries and depends on cultural, institutional and economic factors.23 To analyse the different types of economic support systems, this section employs estimates from National Transfer Accounts (NTA),24 which encompass four sources of finance of consumption: labour income, net public transfers, net private transfers, and asset-based reallocations. Labour income includes employment earnings and self-employment income.25 Public transfers are cash and in-kind transfers received from government such as health care, public safety and national defence and cash transfers such as pensions and other cash allowances for older people, net of taxes and social contributions paid to the government. Private transfers include both inter-household transfers and intra-household transfers. Again, these are net values of transfers received minus transfers given. Asset-based reallocations are basically net asset income and dis-savings.26 Many older persons in developing countries still need to work to finance their consumption One way to finance consumption in old age is to work and hence receive labour earnings. The extent to which labour income contributes to the financing older persons’ consumption depends on the demographic characteristics, labour market conditions and level of economic development of each country. Key direct factors include labour force participation rate, labour productivity, statutory retirement age and the coverage and adequacy of pension systems.
Figure 5.1 shows the proportion of consumption of the older population that is financed by labour income. This and all subsequent figures in this section show box plots of the distribution of the proportion of consumption financed by various sources for two groups of countries (developed and developing countries) and for three age groups (55 to 64 years, 65 to 69 years and 70 years or over). Developed countries in this data sample include Austria, Germany, Hungary, Japan, Slovenia, Sweden and the United States of America, while developing countries are Brazil, China, Costa Rica, India, Indonesia, Mexico, South Korea, the Philippines, and Thailand. For each box, the central line indicates the median value of the distribution and the
23 A comprehensive international review is available in Lee and Mason, eds. (2011). 24 NTAs measure economic flows across age groups at the aggregate level in a manner consistent with National Income Accounts (see United Nations (2013), and the NTA project website http://www.ntaccounts.org). At the time this report was written, the project had 41 participating countries and among them, 20 countries had complete sets of estimates available online. 25 Employment earnings include wages and salaries payable in cash or in kind and the value of the social contributions payable by employers. 26 Asset-based reallocations entail inter-age flows through inter-temporal exchange of private and public property and capital. Examples are income derived and debt incurred from housing, land, consumer debt, student loan programmes, and sovereign wealth funds.
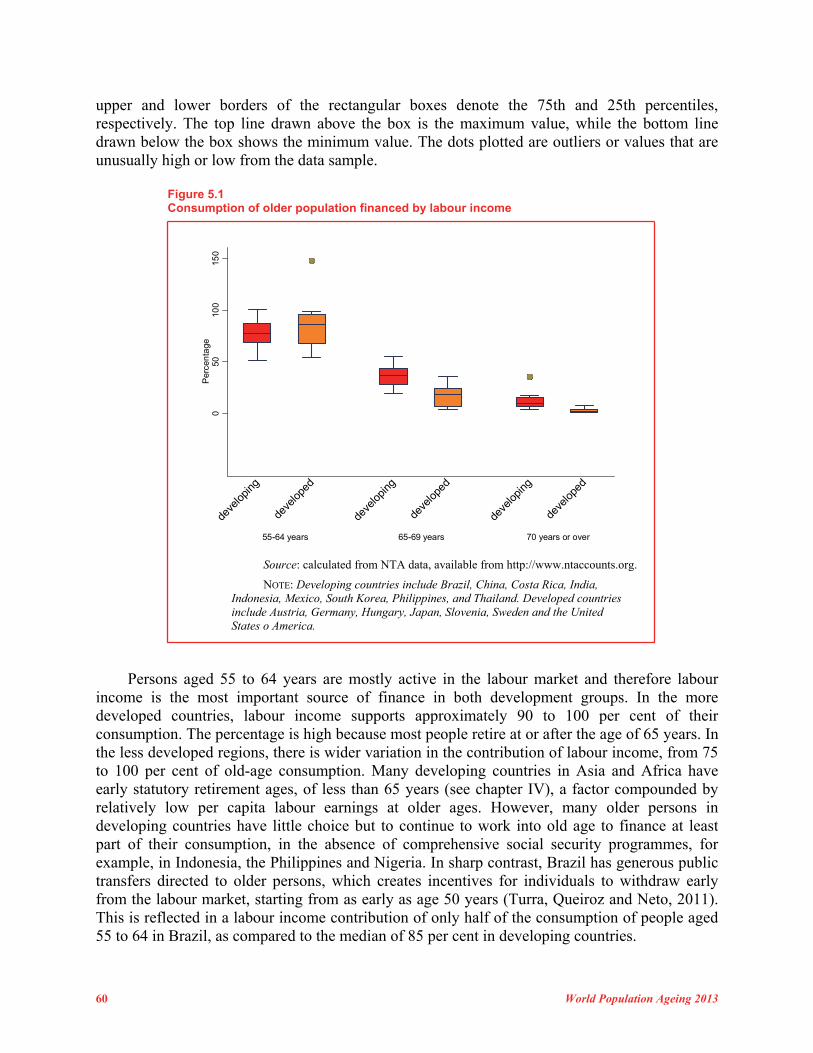
60 World Population Ageing 2013
upper and lower borders of the rectangular boxes denote the 75th and 25th percentiles, respectively. The top line drawn above the box is the maximum value, while the bottom line drawn below the box shows the minimum value. The dots plotted are outliers or values that are unusually high or low from the data sample.
Figure 5.1 Consumption of older population financed by labour income
Source: calculated from NTA data, available from http://www.ntaccounts.org.
NOTE: Developing countries include Brazil, China, Costa Rica, India, Indonesia, Mexico, South Korea, Philippines, and Thailand. Developed countries include Austria, Germany, Hungary, Japan, Slovenia, Sweden and the United States o America.
Persons aged 55 to 64 years are mostly active in the labour market and therefore labour income is the most important source of finance in both development groups. In the more developed countries, labour income supports approximately 90 to 100 per cent of their consumption. The percentage is high because most people retire at or after the age of 65 years. In the less developed regions, there is wider variation in the contribution of labour income, from 75 to 100 per cent of old-age consumption. Many developing countries in Asia and Africa have early statutory retirement ages, of less than 65 years (see chapter IV), a factor compounded by relatively low per capita labour earnings at older ages. However, many older persons in developing countries have little choice but to continue to work into old age to finance at least part of their consumption, in the absence of comprehensive social security programmes, for example, in Indonesia, the Philippines and Nigeria. In sharp contrast, Brazil has generous public transfers directed to older persons, which creates incentives for individuals to withdraw early from the labour market, starting from as early as age 50 years (Turra, Queiroz and Neto, 2011). This is reflected in a labour income contribution of only half of the consumption of people aged 55 to 64 in Brazil, as compared to the median of 85 per cent in developing countries.
050
100
150
Per
cen
tage
55-64 years 65-69 years 70 years or over
deve
loping
deve
loped
deve
loping
deve
loped
deve
lopin
g
deve
loped
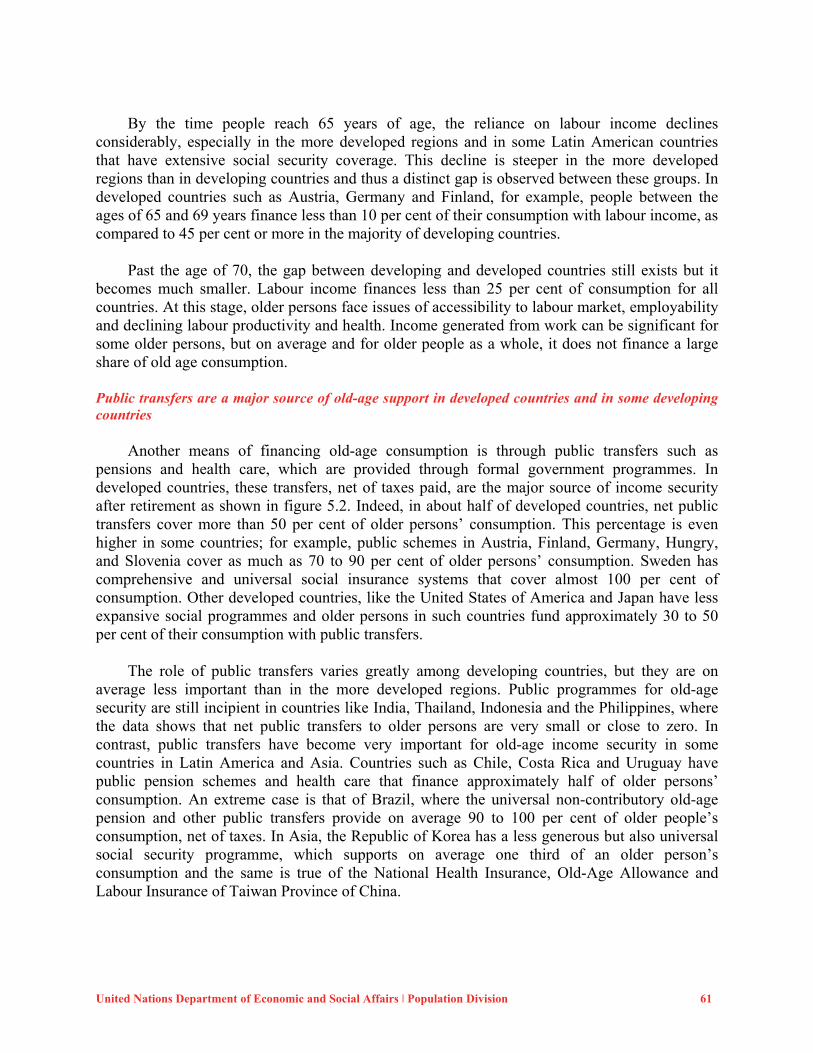
United Nations Department of Economic and Social Affairs ǀ Population Division 61
By the time people reach 65 years of age, the reliance on labour income declines considerably, especially in the more developed regions and in some Latin American countries that have extensive social security coverage. This decline is steeper in the more developed regions than in developing countries and thus a distinct gap is observed between these groups. In developed countries such as Austria, Germany and Finland, for example, people between the ages of 65 and 69 years finance less than 10 per cent of their consumption with labour income, as compared to 45 per cent or more in the majority of developing countries. Past the age of 70, the gap between developing and developed countries still exists but it becomes much smaller. Labour income finances less than 25 per cent of consumption for all countries. At this stage, older persons face issues of accessibility to labour market, employability and declining labour productivity and health. Income generated from work can be significant for some older persons, but on average and for older people as a whole, it does not finance a large share of old age consumption. Public transfers are a major source of old-age support in developed countries and in some developing countries Another means of financing old-age consumption is through public transfers such as pensions and health care, which are provided through formal government programmes. In developed countries, these transfers, net of taxes paid, are the major source of income security after retirement as shown in figure 5.2. Indeed, in about half of developed countries, net public transfers cover more than 50 per cent of older persons’ consumption. This percentage is even higher in some countries; for example, public schemes in Austria, Finland, Germany, Hungry, and Slovenia cover as much as 70 to 90 per cent of older persons’ consumption. Sweden has comprehensive and universal social insurance systems that cover almost 100 per cent of consumption. Other developed countries, like the United States of America and Japan have less expansive social programmes and older persons in such countries fund approximately 30 to 50 per cent of their consumption with public transfers. The role of public transfers varies greatly among developing countries, but they are on average less important than in the more developed regions. Public programmes for old-age security are still incipient in countries like India, Thailand, Indonesia and the Philippines, where the data shows that net public transfers to older persons are very small or close to zero. In contrast, public transfers have become very important for old-age income security in some countries in Latin America and Asia. Countries such as Chile, Costa Rica and Uruguay have public pension schemes and health care that finance approximately half of older persons’ consumption. An extreme case is that of Brazil, where the universal non-contributory old-age pension and other public transfers provide on average 90 to 100 per cent of older people’s consumption, net of taxes. In Asia, the Republic of Korea has a less generous but also universal social security programme, which supports on average one third of an older person’s consumption and the same is true of the National Health Insurance, Old-Age Allowance and Labour Insurance of Taiwan Province of China.
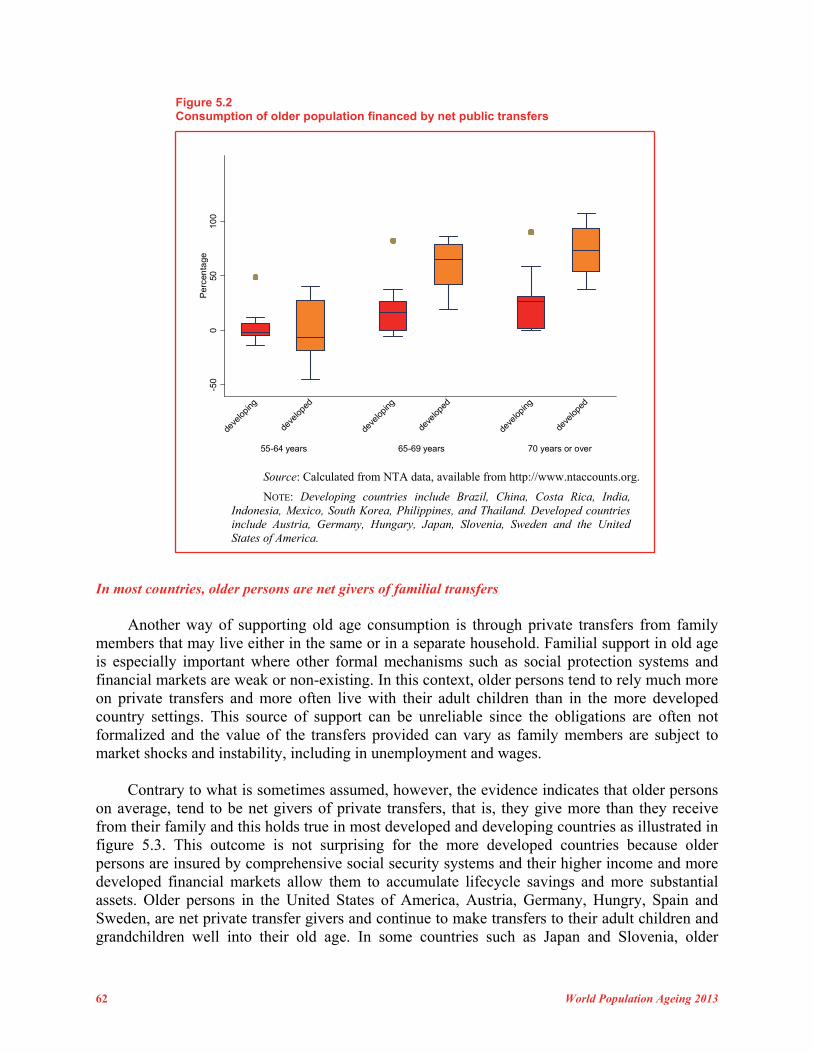
62 World Population Ageing 2013
Figure 5.2 Consumption of older population financed by net public transfers
Source: Calculated from NTA data, available from http://www.ntaccounts.org.
NOTE: Developing countries include Brazil, China, Costa Rica, India, Indonesia, Mexico, South Korea, Philippines, and Thailand. Developed countries include Austria, Germany, Hungary, Japan, Slovenia, Sweden and the United States of America.
In most countries, older persons are net givers of familial transfers Another way of supporting old age consumption is through private transfers from family members that may live either in the same or in a separate household. Familial support in old age is especially important where other formal mechanisms such as social protection systems and financial markets are weak or non-existing. In this context, older persons tend to rely much more on private transfers and more often live with their adult children than in the more developed country settings. This source of support can be unreliable since the obligations are often not formalized and the value of the transfers provided can vary as family members are subject to market shocks and instability, including in unemployment and wages. Contrary to what is sometimes assumed, however, the evidence indicates that older persons on average, tend to be net givers of private transfers, that is, they give more than they receive from their family and this holds true in most developed and developing countries as illustrated in figure 5.3. This outcome is not surprising for the more developed countries because older persons are insured by comprehensive social security systems and their higher income and more developed financial markets allow them to accumulate lifecycle savings and more substantial assets. Older persons in the United States of America, Austria, Germany, Hungry, Spain and Sweden, are net private transfer givers and continue to make transfers to their adult children and grandchildren well into their old age. In some countries such as Japan and Slovenia, older
-50
050
100
Per
cen
tage
55-64 years 65-69 years 70 years or over
deve
loping
deve
loped
deve
loping
deve
loped
deve
loping
deve
loped
United Nations Department of Economic and Social Affairs ǀ Population Division 63
persons switch from net givers to net receivers of private transfers after they turn 70 years. But this situation may not last much longer, for example, in Japan—a society with a tradition of caring for old parents—where private transfers seem to be on the decline, as these transfers are crowded out by increasing public pension benefits and by asset income and labour income generated by older generations during the considerable economic growth between the 1980s and 2000s (Ogawa, Matsukura and Chawla, 2011).
Figure 5.3 Consumption of older population financed by net familial transfers
Source: Calculated from NTA data, available from http://www.ntaccounts.org.
Developing countries include Brazil, China, Costa Rica, India, Indonesia, Mexico, South Korea, Philippines, and Thailand. Developed countries include Austria, Germany, Hungary, Japan, Slovenia, Sweden and the United States of America.
Older persons are also net private transfer givers in most developing countries. In economies dominated by the informal sector such as Indonesia, the Philippines and Mexico, many older persons own farms and other forms of property and they often continue to work until very old ages and this enables them to make transfers to younger family members. Also, as noted in chapter 3, many older persons continue to be the head of households in extended living arrangements and thus, remittances received by them are redistributed to other younger family members (Lee and Others, 2011). In Latin American countries with generous public transfers favouring older persons such as Brazil and Uruguay, older people are relatively well off and tend to make substantial transfers to younger family members. A Brazilian aged 65 or over, on average, receives public transfers covering 90 per cent of their consumption and makes net private transfers as large as one third of their consumption to their family (Turra, Queiroz and Neto, 2011). Older persons in Uruguay have a similar pattern: they receive public transfers
-50
050
100
150
Per
cen
tage
55-64 years 65-69 years 70 years or over
deve
loping
deve
loped
deve
loping
deve
loped
deve
loping
deve
loped
64 World Population Ageing 2013
supporting half of their consumption and give private transfers that amount to 10 per cent of their consumption (Bucheli and Gonzalez, 2011). Private transfers nevertheless, are still an important source of old-age income in a few developing countries in Asia. Cultural values of filial obligation and inter-generational co-residence are commonly observed, although the culture and practices are changing. Net private transfers are significant and positive in countries such as China, Thailand, Republic of Korea and Singapore. Older persons aged 65 years and over in Thailand and Taiwan Province of China receive on average a third of their consumption from private transfers (Chawla, 2008; Tung and Lai, 2013) and the figure for the Republic of Korea is about 13 per cent. As these transfers seem to be declining in some parts of Asia, countries such as China and Singapore have enacted legislation mandating adult children to support their elderly parents. Assets are a major source of old-age support in countries with limited public transfer systems
Asset-based reallocations encompass net asset income and dis-savings. Over their life-cycle, people accumulate assets such as property, pension funds and savings and rely partly on income from these physical and financial assets for their retirement. Examples of net asset income are interest, profits, dividends and imputed rent. As with other sources of sustenance in old age, the extent to which older persons rely on asset-based reallocations varies widely across countries as shown in figure 5.4. At one extreme, older persons in Mexico and Indonesia fund two thirds of their consumption through assets, whereas this proportion is just about 1 per cent in Sweden and Hungry. A closer examination shows that reliance on asset-based reallocations to support old-age consumption has a regional pattern. The range is from a third to two thirds of consumption in Asia and Latin America, but it is narrower, about 10 to 20 per cent in Europe with the exception of Germany and Spain.27 This regional pattern is highly correlated with the aforementioned transfer systems. Mason and others (2011) found that the reliance on asset income during old age is inversely related to the level of public transfers. Older persons receiving substantial public transfers such as in Europe tend to rely less on asset income, while those in regions with less generous or extended public transfer systems such as the United States of America, Japan, Mexico and Asian countries tend to depend more heavily on asset income.
Economic security for older persons is an issue in every country. In most developing
countries, older persons need to work beyond the statutory retirement age due to the lack of comprehensive social security programmes. To fill the gap between what they need and what they earn, older persons rely heavily on assets accumulated earlier in life and in some countries, also on their families. In the majority of these countries, public social programmes play a minor role. Conversely, older persons in developed countries are less likely to work into old age. They rely heavily on public programmes, on asset income and dis-saving—net familial support here is minimal as older people are significant net givers of private transfers.
27 For Germany it is one third while for Spain it is 50 per cent.
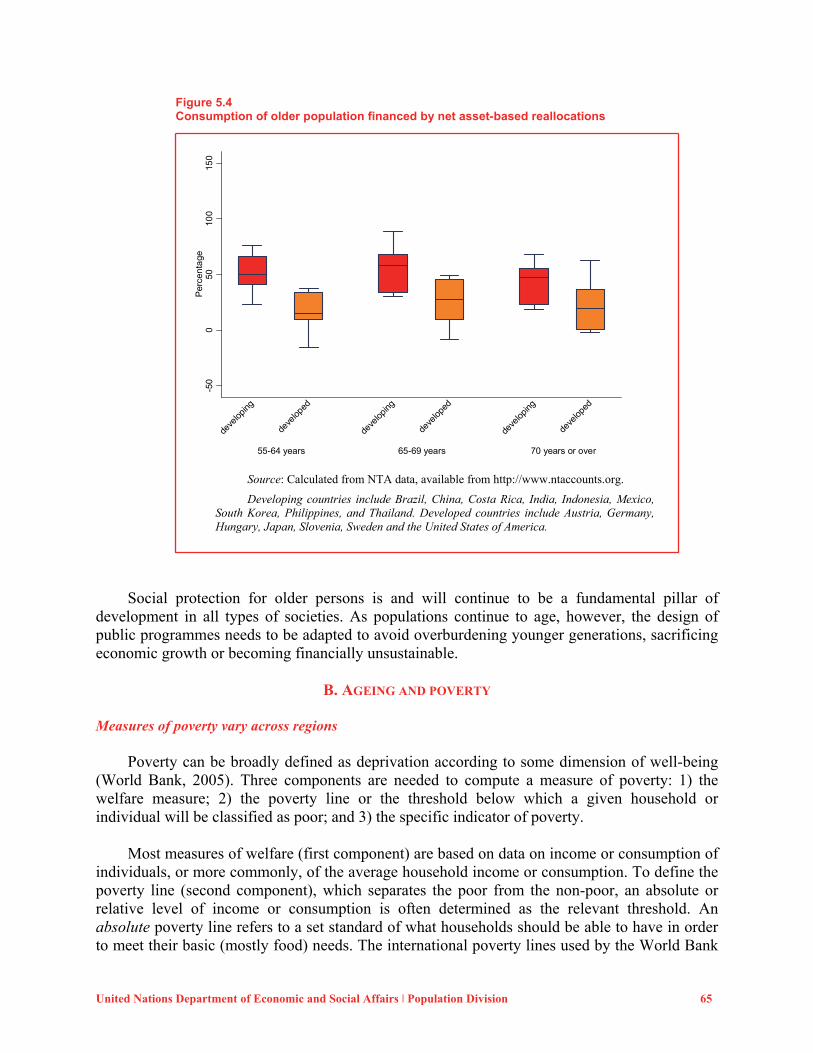
United Nations Department of Economic and Social Affairs ǀ Population Division 65
Figure 5.4 Consumption of older population financed by net asset-based reallocations
Source: Calculated from NTA data, available from http://www.ntaccounts.org.
Developing countries include Brazil, China, Costa Rica, India, Indonesia, Mexico, South Korea, Philippines, and Thailand. Developed countries include Austria, Germany, Hungary, Japan, Slovenia, Sweden and the United States of America.
Social protection for older persons is and will continue to be a fundamental pillar of
development in all types of societies. As populations continue to age, however, the design of public programmes needs to be adapted to avoid overburdening younger generations, sacrificing economic growth or becoming financially unsustainable.
B. AGEING AND POVERTY
Measures of poverty vary across regions Poverty can be broadly defined as deprivation according to some dimension of well-being (World Bank, 2005). Three components are needed to compute a measure of poverty: 1) the welfare measure; 2) the poverty line or the threshold below which a given household or individual will be classified as poor; and 3) the specific indicator of poverty. Most measures of welfare (first component) are based on data on income or consumption of individuals, or more commonly, of the average household income or consumption. To define the poverty line (second component), which separates the poor from the non-poor, an absolute or relative level of income or consumption is often determined as the relevant threshold. An absolute poverty line refers to a set standard of what households should be able to have in order to meet their basic (mostly food) needs. The international poverty lines used by the World Bank
-50
050
100
150
Per
cen
tage
55-64 years 65-69 years 70 years or over
deve
loping
deve
loped
deve
loping
deve
loped
deve
loping
deve
loped
66 World Population Ageing 2013
(at $1.25 a day and $2.50 a day in terms of purchasing power parity or PPP) are examples. A relative poverty line is defined in relation to the overall distribution of income or consumption in a country. For example, the main poverty line used in the Organization for Economic Co-operation and Development (OECD) and the European Union is a relative poverty measure based on “economic distance,” a level of income usually set at 50 or 60 per cent of the median household income. Finally, regarding the third component of the poverty concept, the most commonly used poverty indicator is the poverty rate,28 which refers to the proportion of the population whose per capita income or consumption is below the poverty line. Poverty is slightly higher for older persons than the total population in Sub-Saharan Africa In much of Africa, older persons traditionally rely on their extended family, especially their own children, for their welfare. However, as a result of the HIV/AIDS pandemic, conflicts, shocks such as recurrent droughts and rapid urbanization, many older persons in sub-Saharan Africa have become primary sources of support for their families and/or caregivers for grandchildren because prime-age adults have fallen ill, died or migrated. Poverty is still prevalent in sub-Saharan Africa and is slightly higher for older persons than the total population (Kakwani and Subbarao, 2005). Kakwani and Subbarao (2005) examined household survey data from 15 countries in sub-Saharan Africa against the respective national poverty lines.29 The study confirmed that poverty rates are high in sub-Saharan Africa for the whole population in general and for the older population in particular. National poverty rates varied from 36.7 per cent to 68.9 per cent in the general population and between 43.7 per cent and 79.4 per cent among older persons (table 5.1). In 11 of the 15 countries studied, the incidence of poverty was higher for the older population than for the population as a whole. The exceptions were Burundi, Madagascar, Mozambique and Nigeria. For most countries, the differences between the older population and the whole population were statistically significant, especially in Malawi and Zambia where the prevalence of HIV/AIDS was very high. Overall, however, the difference in the incidence of poverty of the older population and the total population is not too wide in absolute terms in sub-Saharan Africa. The ratio of older persons’ poverty incidence to that of the total population was just above 1 in the majority of the 15 countries (figure 5.5) and between 1.1 and 1.3 in only four countries: Côte d’Ivoire, Guinea, Malawi and Zambia. The study also found that in 9 of the 15 countries, the incidence of poverty was higher among older persons than among children aged 0-14 years (table 5.1) and in 10 of the 15 countries, the incidence of poverty in households where older persons lived with only children (usually grandchildren) was higher than the average poverty incidence for the whole population. Accordingly, the findings of the study confirmed older persons’ disadvantage especially when they have become either principal breadwinners for the family or caregivers for children.
28 Also referred to as “incidence of poverty”, or the poverty headcount ratio. 29 The sample countries are broadly representative of sub-Saharan Africa as they are from Eastern and Western Africa, Anglophone, Francophone and Lusophone Africa, and with both high and low incidence of HIV/AIDS.
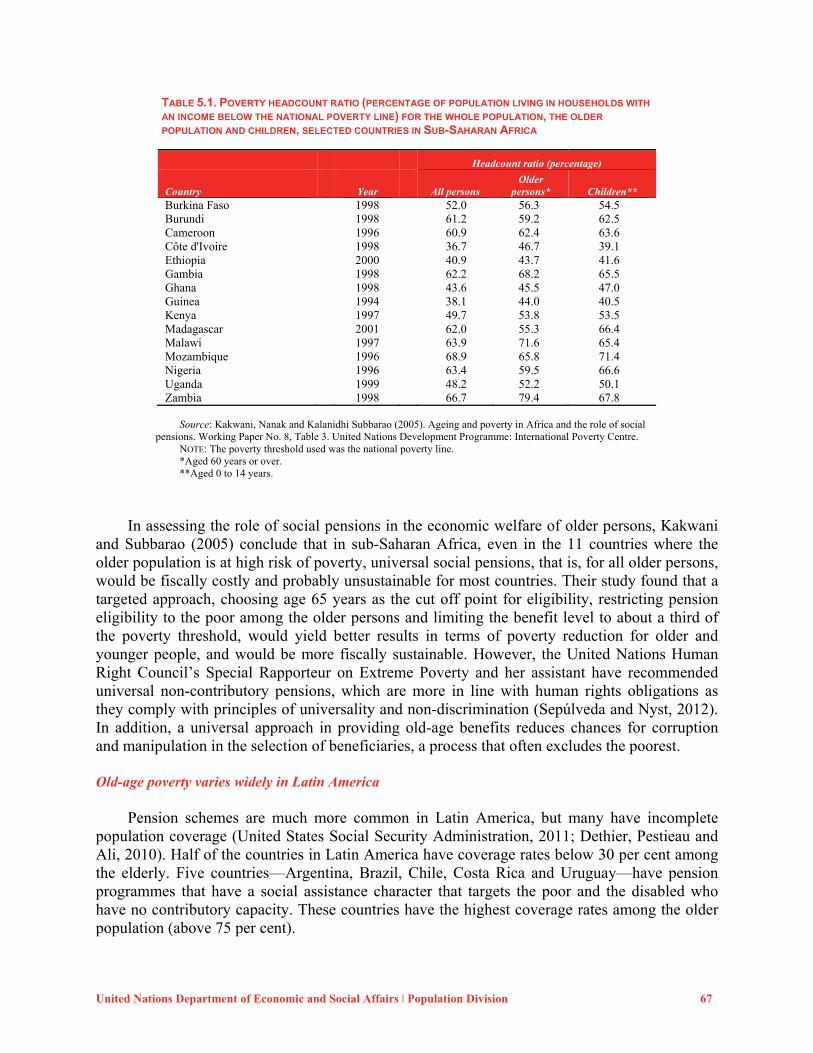
United Nations Department of Economic and Social Affairs ǀ Population Division 67
TABLE 5.1. POVERTY HEADCOUNT RATIO (PERCENTAGE OF POPULATION LIVING IN HOUSEHOLDS WITH AN INCOME BELOW THE NATIONAL POVERTY LINE) FOR THE WHOLE POPULATION, THE OLDER POPULATION AND CHILDREN, SELECTED COUNTRIES IN SUB-SAHARAN AFRICA
Headcount ratio (percentage)
Country Year All persons Older
persons* Children** Burkina Faso 1998 52.0 56.3 54.5 Burundi 1998 61.2 59.2 62.5 Cameroon 1996 60.9 62.4 63.6 Côte d'Ivoire 1998 36.7 46.7 39.1 Ethiopia 2000 40.9 43.7 41.6 Gambia 1998 62.2 68.2 65.5 Ghana 1998 43.6 45.5 47.0 Guinea 1994 38.1 44.0 40.5 Kenya 1997 49.7 53.8 53.5 Madagascar 2001 62.0 55.3 66.4 Malawi 1997 63.9 71.6 65.4 Mozambique 1996 68.9 65.8 71.4 Nigeria 1996 63.4 59.5 66.6 Uganda 1999 48.2 52.2 50.1 Zambia 1998 66.7 79.4 67.8
Source: Kakwani, Nanak and Kalanidhi Subbarao (2005). Ageing and poverty in Africa and the role of social
pensions. Working Paper No. 8, Table 3. United Nations Development Programme: International Poverty Centre. NOTE: The poverty threshold used was the national poverty line. *Aged 60 years or over. **Aged 0 to 14 years.
In assessing the role of social pensions in the economic welfare of older persons, Kakwani and Subbarao (2005) conclude that in sub-Saharan Africa, even in the 11 countries where the older population is at high risk of poverty, universal social pensions, that is, for all older persons, would be fiscally costly and probably unsustainable for most countries. Their study found that a targeted approach, choosing age 65 years as the cut off point for eligibility, restricting pension eligibility to the poor among the older persons and limiting the benefit level to about a third of the poverty threshold, would yield better results in terms of poverty reduction for older and younger people, and would be more fiscally sustainable. However, the United Nations Human Right Council’s Special Rapporteur on Extreme Poverty and her assistant have recommended universal non-contributory pensions, which are more in line with human rights obligations as they comply with principles of universality and non-discrimination (Sepúlveda and Nyst, 2012). In addition, a universal approach in providing old-age benefits reduces chances for corruption and manipulation in the selection of beneficiaries, a process that often excludes the poorest. Old-age poverty varies widely in Latin America Pension schemes are much more common in Latin America, but many have incomplete population coverage (United States Social Security Administration, 2011; Dethier, Pestieau and Ali, 2010). Half of the countries in Latin America have coverage rates below 30 per cent among the elderly. Five countries—Argentina, Brazil, Chile, Costa Rica and Uruguay—have pension programmes that have a social assistance character that targets the poor and the disabled who have no contributory capacity. These countries have the highest coverage rates among the older population (above 75 per cent).
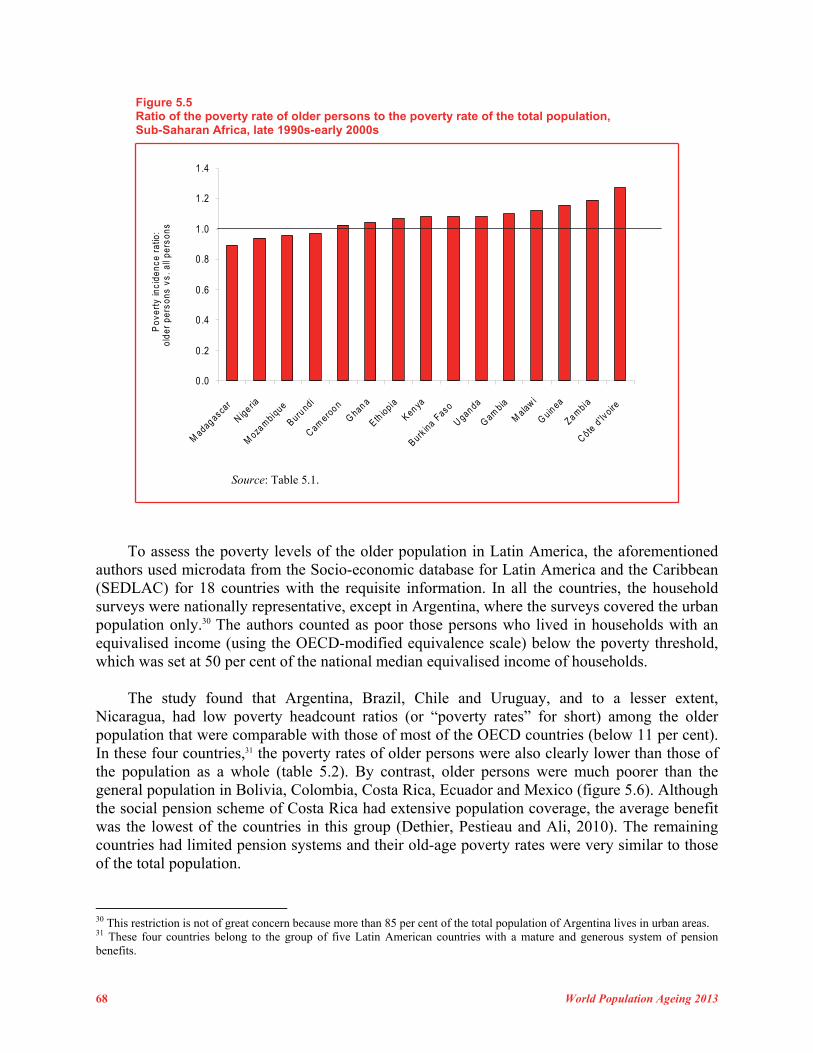
68 World Population Ageing 2013
Figure 5.5 Ratio of the poverty rate of older persons to the poverty rate of the total population, Sub-Saharan Africa, late 1990s-early 2000s
0 .0
0 .2
0 .4
0 .6
0 .8
1 .0
1 .2
1 .4
Madag as ca
r
N ige ria
Moza
mbiq
ue
Burundi
C amero
o n
Ghan a
E thiopia
Ken ya
Burkina F
aso
Ugan da
Gam
bia
Malaw i
Guin
ea
Zambia
C ôte d
'Ivoire
Pov
erty
inci
denc
e ra
tio:
olde
r pe
rson
s vs
. all
pers
ons
Source: Table 5.1.
To assess the poverty levels of the older population in Latin America, the aforementioned authors used microdata from the Socio-economic database for Latin America and the Caribbean (SEDLAC) for 18 countries with the requisite information. In all the countries, the household surveys were nationally representative, except in Argentina, where the surveys covered the urban population only.30 The authors counted as poor those persons who lived in households with an equivalised income (using the OECD-modified equivalence scale) below the poverty threshold, which was set at 50 per cent of the national median equivalised income of households. The study found that Argentina, Brazil, Chile and Uruguay, and to a lesser extent, Nicaragua, had low poverty headcount ratios (or “poverty rates” for short) among the older population that were comparable with those of most of the OECD countries (below 11 per cent). In these four countries,31 the poverty rates of older persons were also clearly lower than those of the population as a whole (table 5.2). By contrast, older persons were much poorer than the general population in Bolivia, Colombia, Costa Rica, Ecuador and Mexico (figure 5.6). Although the social pension scheme of Costa Rica had extensive population coverage, the average benefit was the lowest of the countries in this group (Dethier, Pestieau and Ali, 2010). The remaining countries had limited pension systems and their old-age poverty rates were very similar to those of the total population.
30 This restriction is not of great concern because more than 85 per cent of the total population of Argentina lives in urban areas. 31 These four countries belong to the group of five Latin American countries with a mature and generous system of pension benefits.
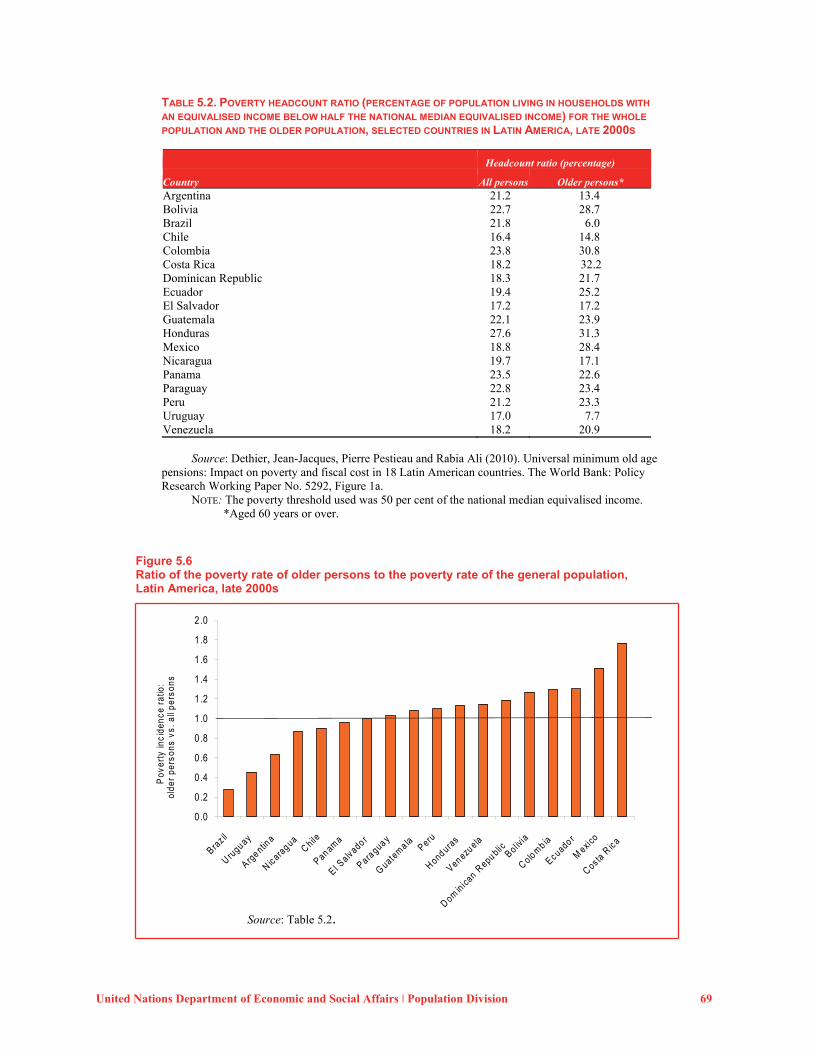
United Nations Department of Economic and Social Affairs ǀ Population Division 69
TABLE 5.2. POVERTY HEADCOUNT RATIO (PERCENTAGE OF POPULATION LIVING IN HOUSEHOLDS WITH AN EQUIVALISED INCOME BELOW HALF THE NATIONAL MEDIAN EQUIVALISED INCOME) FOR THE WHOLE POPULATION AND THE OLDER POPULATION, SELECTED COUNTRIES IN LATIN AMERICA, LATE 2000S
Headcount ratio (percentage)
Country All persons Older persons* Argentina 21.2 13.4 Bolivia 22.7 28.7 Brazil 21.8 6.0 Chile 16.4 14.8 Colombia 23.8 30.8 Costa Rica 18.2 32.2 Dominican Republic 18.3 21.7 Ecuador 19.4 25.2 El Salvador 17.2 17.2 Guatemala 22.1 23.9 Honduras 27.6 31.3 Mexico 18.8 28.4 Nicaragua 19.7 17.1 Panama 23.5 22.6 Paraguay 22.8 23.4 Peru 21.2 23.3 Uruguay 17.0 7.7 Venezuela 18.2 20.9 Source: Dethier, Jean-Jacques, Pierre Pestieau and Rabia Ali (2010). Universal minimum old age pensions: Impact on poverty and fiscal cost in 18 Latin American countries. The World Bank: Policy Research Working Paper No. 5292, Figure 1a.
NOTE: The poverty threshold used was 50 per cent of the national median equivalised income. *Aged 60 years or over.
Figure 5.6 Ratio of the poverty rate of older persons to the poverty rate of the general population, Latin America, late 2000s
0.0
0 .2
0 .4
0 .6
0 .8
1 .0
1 .2
1 .4
1 .6
1 .8
2 .0
Braz il
U rugu ay
A rge ntin
a
N icarag ua
Chile
Pan ama
E l Salv ado r
Paragua y
Guate
ma la
Peru
Hond uras
Ven ezuela
D ominica
n Repu blic Bol iv
ia
C olom
b ia
Ecuado r
Mexic
o
Cos ta R
ica
Pov
erty
inci
denc
e ra
tio:
olde
r pe
rson
s vs
. all
pers
ons
Source: Table 5.2.
70 World Population Ageing 2013
In summary, old-age poverty is still prevalent in a large number of Latin American countries despite the fact that all the countries have some type of pension programme. The aforementioned study suggests that universal minimum social pensions would be effective in reducing poverty among the older population. Although the cost of a universal pension can be very significant, the authors argue that the benefits justify the extra investment. Specifically, the cost for a benefit of $2.50 a day for all older people aged 60 years or over ranges between 0.5 per cent and 2.7 per cent of GDP, the cost being higher for poorer countries, where $2.50 represents a larger proportion of average income. Older persons in most OECD countries face high relative poverty One of the most substantial changes in income inequality and poverty over the past two decades in OECD countries has been the shift in poverty rates between age groups (OECD, 2008). The risk of poverty among older persons has fallen, while poverty rates among young adults and families with children have risen. However, because the initial old-age poverty rates were very high, persons aged 75 years or over remain the group most likely to be poor. People aged 66 to 75 years in contrast, are now no more likely to be poor than the population as a whole. The international comparisons across OECD countries define poverty as those persons who live in households where equivalised disposable income is below 50 per cent of the national median equivalised income. Table 5.3 shows the variations in the poverty headcount ratios for the whole population and the older population (persons aged 65 years or over) using the aforementioned definition across 34 OECD countries. On average, older persons show higher poverty incidence (15.1 per cent) than the total population (11.1 per cent). Also, the incidence of poverty among older persons is higher in the developing countries of OECD (26.2 per cent) than in the developed countries of OECD (13.2 per cent). Three categories of countries can be distinguished. The first category consists of 13 developed countries with old-age poverty rates lower than the OECD overall average (below 10 per cent) among older persons. These countries include The Netherlands (1.7 per cent). The Czech Republic (3.6 per cent), Canada (4.9 per cent), France (5.3 per cent), Poland (7.7 per cent), Norway (8.0 per cent) and Italy (8.9 per cent). In the majority of these countries, the poverty rate for older people is lower than or the same as the poverty rate for the whole population (figure 5.7). For some countries—mainly the Nordic and Western European countries—the situation is a reflection of a mature, generous and redistributive system of pension benefits.32 Full-career workers are covered by earnings-related public pensions and supplementary pensions from mandatory occupational schemes, while low-income workers and older people are eligible for basic or minimum pensions (OECD, 2011).
32 This includes, for example, the Netherlands provides a strong social safety net in the form of a generous flat-rate public basic pension (29 per cent of average earnings on the OECD measure), which is paid to all persons aged 65 years or over, subject only to a residency test. Similarly, France provides a rather generous targeted (subject to a means test) minimum income to older persons aged 65 years or over via an old-age assistance programme, the “minimum vieillesse”.
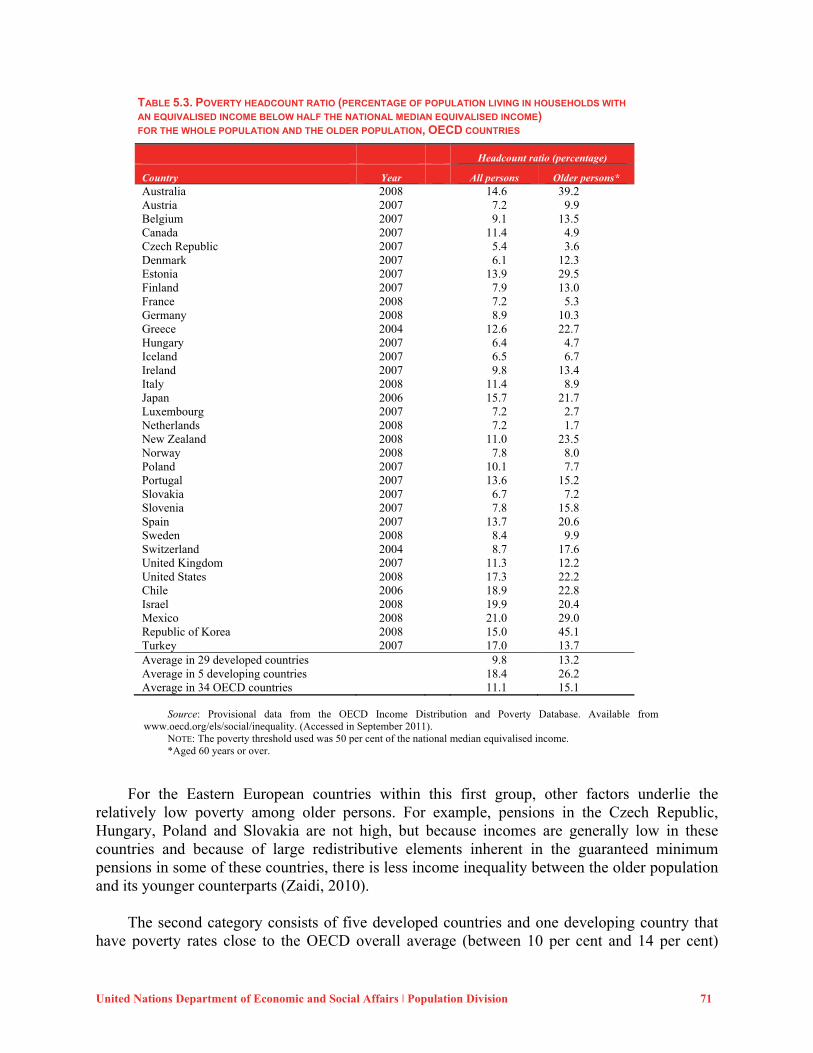
United Nations Department of Economic and Social Affairs ǀ Population Division 71
TABLE 5.3. POVERTY HEADCOUNT RATIO (PERCENTAGE OF POPULATION LIVING IN HOUSEHOLDS WITH AN EQUIVALISED INCOME BELOW HALF THE NATIONAL MEDIAN EQUIVALISED INCOME) FOR THE WHOLE POPULATION AND THE OLDER POPULATION, OECD COUNTRIES
Headcount ratio (percentage)
Country Year All persons Older persons* Australia 2008 14.6 39.2 Austria 2007 7.2 9.9 Belgium 2007 9.1 13.5 Canada 2007 11.4 4.9 Czech Republic 2007 5.4 3.6 Denmark 2007 6.1 12.3 Estonia 2007 13.9 29.5 Finland 2007 7.9 13.0 France 2008 7.2 5.3 Germany 2008 8.9 10.3 Greece 2004 12.6 22.7 Hungary 2007 6.4 4.7 Iceland 2007 6.5 6.7 Ireland 2007 9.8 13.4 Italy 2008 11.4 8.9 Japan 2006 15.7 21.7 Luxembourg 2007 7.2 2.7 Netherlands 2008 7.2 1.7 New Zealand 2008 11.0 23.5 Norway 2008 7.8 8.0 Poland 2007 10.1 7.7 Portugal 2007 13.6 15.2 Slovakia 2007 6.7 7.2 Slovenia 2007 7.8 15.8 Spain 2007 13.7 20.6 Sweden 2008 8.4 9.9 Switzerland 2004 8.7 17.6 United Kingdom 2007 11.3 12.2 United States 2008 17.3 22.2 Chile 2006 18.9 22.8 Israel 2008 19.9 20.4 Mexico 2008 21.0 29.0 Republic of Korea 2008 15.0 45.1 Turkey 2007 17.0 13.7 Average in 29 developed countries 9.8 13.2 Average in 5 developing countries 18.4 26.2 Average in 34 OECD countries 11.1 15.1
Source: Provisional data from the OECD Income Distribution and Poverty Database. Available from
www.oecd.org/els/social/inequality. (Accessed in September 2011). NOTE: The poverty threshold used was 50 per cent of the national median equivalised income. *Aged 60 years or over.
For the Eastern European countries within this first group, other factors underlie the relatively low poverty among older persons. For example, pensions in the Czech Republic, Hungary, Poland and Slovakia are not high, but because incomes are generally low in these countries and because of large redistributive elements inherent in the guaranteed minimum pensions in some of these countries, there is less income inequality between the older population and its younger counterparts (Zaidi, 2010). The second category consists of five developed countries and one developing country that have poverty rates close to the OECD overall average (between 10 per cent and 14 per cent)
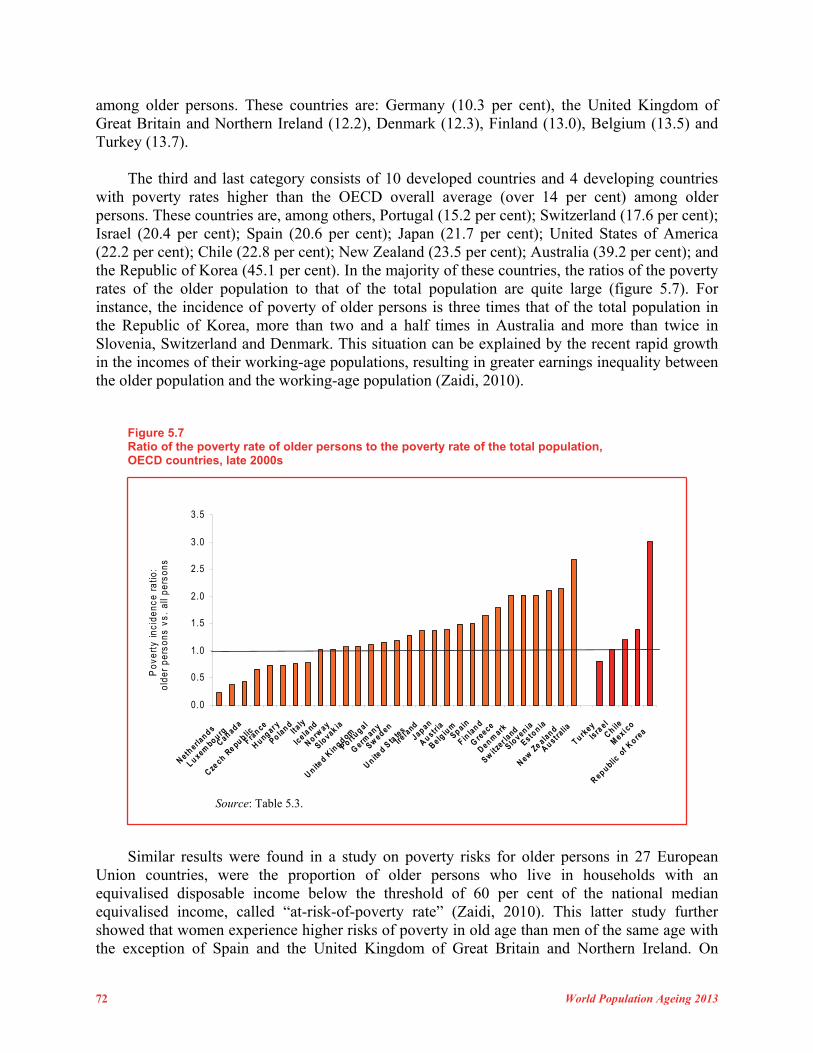
72 World Population Ageing 2013
among older persons. These countries are: Germany (10.3 per cent), the United Kingdom of Great Britain and Northern Ireland (12.2), Denmark (12.3), Finland (13.0), Belgium (13.5) and Turkey (13.7). The third and last category consists of 10 developed countries and 4 developing countries with poverty rates higher than the OECD overall average (over 14 per cent) among older persons. These countries are, among others, Portugal (15.2 per cent); Switzerland (17.6 per cent); Israel (20.4 per cent); Spain (20.6 per cent); Japan (21.7 per cent); United States of America (22.2 per cent); Chile (22.8 per cent); New Zealand (23.5 per cent); Australia (39.2 per cent); and the Republic of Korea (45.1 per cent). In the majority of these countries, the ratios of the poverty rates of the older population to that of the total population are quite large (figure 5.7). For instance, the incidence of poverty of older persons is three times that of the total population in the Republic of Korea, more than two and a half times in Australia and more than twice in Slovenia, Switzerland and Denmark. This situation can be explained by the recent rapid growth in the incomes of their working-age populations, resulting in greater earnings inequality between the older population and the working-age population (Zaidi, 2010).
Figure 5.7 Ratio of the poverty rate of older persons to the poverty rate of the total population, OECD countries, late 2000s
0.0
0.5
1.0
1.5
2.0
2.5
3.0
3.5
Netherla
nds
Luxembou rg
Canada
Czech R
e pub licF ra
n ce
Hungar y
Po land
Italy
Icela
nd
Norway
Slovak ia
Un ited K
ingdom
Po rtug al
Germ
any
Sweden
Un ited S
tate
sIre
l and
Japan
Austria
Belgiu
mSpain
F inla
nd
Gre
ece
Denmark
Switz
er land
Sloven ia
Eston ia
New Z
e aland
Australia
Tu rkey
Isra
el
Ch ile
Mexi c
o
Republic o
f Ko re
a
Pov
erty
inci
denc
e ra
tio:
olde
r pe
rson
s vs
. al
l per
sons
Source: Table 5.3.
Similar results were found in a study on poverty risks for older persons in 27 European Union countries, were the proportion of older persons who live in households with an equivalised disposable income below the threshold of 60 per cent of the national median equivalised income, called “at-risk-of-poverty rate” (Zaidi, 2010). This latter study further showed that women experience higher risks of poverty in old age than men of the same age with the exception of Spain and the United Kingdom of Great Britain and Northern Ireland. On
United Nations Department of Economic and Social Affairs ǀ Population Division 73
average, the poverty risk rate faced by older women was about 22 per cent as compared to 16 per cent for older men. This result is partly a reflection of the fact that women live longer than men, and therefore are disproportionately represented in the oldest cohorts (aged 75 years or over) that are subject to higher poverty risks. Also, the low pension income of older women is due to the fact that either they never worked and therefore receive a (lower) survivorship pension, or they worked but experienced unfavourable employment conditions. In addition, many women had childcare-related gaps in their employment records. As the education and labour market performance of younger women have been improving, future cohorts of older women are likely to have longer working careers as well as higher pension incomes (Zaidi, 2010). In conclusion, older persons in OECD countries, face, for the most part, higher incidence of poverty than the total population. Countries with a low old-age poverty rate generally have a good social safety net system in the form of basic pensions or offer large redistribution in their earnings-related contributory pension schemes.

United Nations Department of Economic and Social Affairs ׀ Population Division 75
Conclusion
By the end of the twentieth century, ageing was well under way in the more developed countries where the demographic transition started earlier. Ageing was beginning to take place in many developing countries that had experienced significant and sometimes quite fast fertility declines, mostly in Asia and Latin America. If the current projections are realized, ageing will become a virtually universal phenomenon during the twenty-first century, although it will progress with different intensity and speed across countries and regions. This global demographic shift entails fundamental social, economic and development challenges and opportunities, not the least of which is the increasing priority to satisfy the needs of older persons while enabling them to have longer, healthier and more productive lives.
The evidence reviewed in this report showed that population ageing is already taking place in
most major areas of the world. The global share of older persons (aged 60 years or over) increased from 9.2 per cent in 1990 to 11.7 per cent in 2013 and will continue to grow as a proportion of the world population, reaching 21.1 per cent by 2050. Globally, the number of older persons is expected to more than double from 841 million people in 2013 to more than 2 billion in 2050. Presently, about two thirds of the world’s older people live in developing countries. Because the older population in less developed regions is growing faster than in the more developed countries, the projections show that older persons will be increasingly concentrated in the less developed regions of the world. By 2050, nearly 8 in 10 of the world’s older population will live in the less developed regions.
According to the most recent estimates and projections, the share of older persons aged 80
years or over (the “oldest old”) within the older population was 14 per cent in 2013 and is projected to reach 19 per cent in 2050. If this projection is realized, there will be 392 million persons aged 80 years or over by 2050, more than three times the present. The data also confirm that because females tend to live longer than their male counterparts, elderly women outnumber elderly men almost everywhere. In 2013, there were 85 men per 100 women in the age group 60 years or over and 61 men per 100 women in the age group 80 years or over, globally. However, these sex ratios are expected to increase moderately during the next several decades, reflecting a projected slight narrowing of the female advantage in survivorship.
The report also noted some of the major social and economic consequences of ageing. The
old-age support ratios (number of working-age adults per older person in the population) are already low in the more developed regions and in some developing countries and are expected to continue to fall in the coming decades with ensuing fiscal pressures on support systems for older persons. In a number of developing countries, poverty is high among older persons, sometimes even higher than the population as a whole, especially in those countries with limited coverage of social security systems. While people are living longer lives almost everywhere, the prevalence of non-communicable diseases and disability increase as populations age, which will put upward pressure on health expenditures in the coming decades.
On the positive side, although most developed countries already have aged populations, a
large number of developing countries are projected to experience high and increasing economic support ratios for years or decades to come and can therefore benefit significantly from the
76 World Population Ageing 2013
“demographic dividend,” provided that appropriate labour market and other policies allow for a productive absorption of the growing working-age population and for increased investments in the human capital of children and youth.
Globally, 40 per cent of older persons live independently, that is, alone or with their spouse
only. Independent living is far more common in the more developed countries where about three quarters of older persons live independently, compared with only a quarter in developing countries and only one eighth in the least developed countries. As countries develop and their populations continue to age, living alone or with a spouse only among older persons will likely become much more common in the future.
Many older persons, especially in developing countries, still work into older ages out of need
or a wish to remain active and productive. In 2010, the labour force participation of persons aged 65 years or over was around 31 per cent in the less developed regions and 8 per cent in the more developed regions. Labour force participation among older men is decreasing in the less developed regions but increasing in the more developed regions. In both development regions, men made up a large majority of the total labour force among older persons, although that may change somewhat over the medium-term future if younger women, who are participating more in paid work, extend their labour force behaviour into older ages.
The labour earnings of older persons are an important source of economic support in old age,
especially in developing countries. Public transfers constitute a major source of old-age support in developed countries and in some developing countries with extensive social security coverage, while income from their own assets finances another substantial part of the consumption of older persons in some high- and middle-income countries. In most countries, rich and poor older persons are net givers of familial transfers.
The evidence reviewed in this report suggests that there is wide international variation in the
prevalence of old-age poverty. In much of Africa, the prevalence of poverty among older persons is either lower or only slightly higher than the total population average, while in Latin America the prevalence of poverty among older people varies widely, from levels much lower than average in countries of the Southern Cone to significantly higher than average in some Central American countries. Although older persons in most OECD countries are well covered by social protection systems, the relative poverty rate of older people tends to be higher than the population average.
United Nations Department of Economic and Social Affairs ǀ Population Division 77
References Bucheli, Marisa and Cecilia Gonzalez (2011). Public transfer flows between generations in
Uruguay. In Population Aging and the Generational Economy: A Global Perspective, Ronald Lee and Andrew Mason, eds. UK: Cheltenham; and MA: Northampton; Edward Elgar, pp. 434-445.
Chawla, Amonthep (2008). Population aging, intergenerational transfers and saving in Thailand.
Paper presented at the Population Association of America Meeting, 17-19 April 2008, New Orleans.
Dethier, Jean-Jacques, Pierre Pestieau and Rabia Ali (2010). Universal minimum old age pensions: Impact on poverty and fiscal cost in 18 Latin American countries. Policy Research Working Paper, No. 5292. Washington, DC: World Bank. Available from http://www-wds.worldbank.org/servlet/WDSContentServer/WDSP/IB/2010/05/06/00015 834920100506135339/Rendered/PDF/WPS5292.pdf.
International Labour Organization (ILO) (2011). LABORSTA Internet. Economically Active Population, Estimates and Projections, 6th Edition. Available from http://laborsta. ilo.org/applv8/data/EAPEP/eapep_E.html. (Accessed 15 October 2013).
Kakwani, Nanak and Kalanidhi Subbarao (2005). Ageing and poverty in Africa and the role of social pensions. Working Paper No. 8. Brasilia:United Nations Development Programme International Poverty Centre. Available from http://www.ipc-undp.org/pub/IPCWorking Paper8.pdf.
Kinsella, Kevin and Divid R. Phillips (2005). Global ageing: The challenge of success.
Population Bulletin, vol. 60, No. 1. Washington, D.C.: Population Reference Bureau. Lee, Ronald and Andrew Mason eds. (2011). Population Aging and the Generational Economy:
A Global Perspective. Cheltenham, UK: Edward Elgar Publishing Limited. Available from http://web.idrc.ca/openebooks/514-4/.
Lee, Ronald and others (2011). The changing shape of the economic lifecycle in the United States, 1960 to 2003. In Population Aging and the Generational Economy: A Global
Perspective, Ronald Lee and Andrew Mason, eds. UK: Cheltenham, and MA: Northampton; Edward Elgar, pp. 313-326.
Mason, Andrew and Ronald Lee (2006). Reform and support systems for the elderly in
developing countries: Capturing the second demographic dividend. Genus, vol. LXII, No. 2, pp. 11-35.
Mason, Andrew and others (2009). Population aging and intergenerational transfers: Introducing
age into national income accounts. In Developments in the Economics of Aging, David Wise, ed. Chicago: University of Chicago Press; National Bureau of Economic Research, pp. 89-122.
78 World Population Ageing 2013
Mason, Andrew and others (2011). Asset-based flows from a generational perspective. In
Population Aging and the Generational Economy: A Global Perspective, Ronald Lee and Andrew Mason, eds. UK: Cheltenham; and MA: Northampton; Edward Elgar, pp. 209-236.
MEASURE DHS (2011). Electronic databases of the MEASURE DHS project. Available from
http://www.measuredhs.com/accesssurveys/. (Accessed 7 August 2011). Minnesota Population Center (2011). Integrated Public Use Microdata Series, International:
Version 6.1 (Machine-readable database). Available from https://international.ipums.org/ international. (Accessed 12 August 2011).
Munich Center for the Economics of Aging (2011). Survey of Health, Ageing and Retirement in Europe. Munich: Max Planck Institute for Social Law and Social Policy. Available from http://share-dev.mpisoc.mpg.de/. (Accessed in July 2011).
National Transfer Accounts (2013). National Transfer Accounts data available from
http://www.ntaccounts.org/web/nta/show/NTA%20Data. (Accessed 1 November 2013). Organization for Economic Co-operation and Development (OECD) (2008). Growing Unequal?
Income Distribution and Poverty in OECD Countries. Paris. Available from www.oecd.org/els/social/inequality. (Accessed in September 2011).
_____ (2011). Pensions at a Glance 2011: Retirement-Income Systems in OECD and G20
Countries. Paris. Ogawa, Naohiro, Rikiya Matsukura and Amonthep Chawla (2011). The elderly as latent assets in
aging Japan. In Population Aging and the Generational Economy: A Global Perspective, Ronald Lee and Andrew Mason, eds. United Kingdom: Cheltenham; and MA: Northampton: Edward Elgar, pp. 475-487.
Palloni, Alberto (2013). Longevity in the 21st century: How strong is the tug of the past?
UN/POP/EGM-MORT/2013/6. Available from http://www.un.org/en/development/desa /population/events/pdf/expert/20/2013-EGM_Alberto%20Palloni%20.pdf.
Sepúlveda, Magdalena and Carly Nyst (2012). The Human Rights Approach to Social
Protection. Oulu: Ministry for Foreign Affairs of Finland: Erweko Oy. SHARE (2011). The Survey of Health, Ageing and Retirement in Europe (SHARE) Micro-data
files. Available from http://cdata8.uvt.nl/sharedatadissemination/users/login. (Accessed 28 July 2011).
Tung, An-Chi and Nicole Mun Sim Lai (2013). Living arrangements and support for the elderly
in Taiwan. In Population Aging and the Generational Economy: A Global Perspective, Ronald Lee and Andrew Mason, eds. UK: Cheltenham; and MA: Northampton; Edward Elgar, pp. 488-499.
United Nations Department of Economic and Social Affairs ǀ Population Division 79
Turra, Cassio, Bernardo L Queiroz and Eduardo L. G. Rios-Neto (2011). Idiosyncrasies of
intergenerational transfers in Brazil. In Population Aging and the Generational Economy: A Global Perspective, Ronald Lee and Andrew Mason, eds. Cheltenham, UK and Northampton, MA: Edward Elgar, pp. 394-407.
United Nations (2005). Living Arrangements of Older Persons Around the World. Sales No.
E.05.XIII.9. _____ (2012). Population Ageing and Development 2012 Wall chart. Sales No. E.12.XIII.6. _____ (2013). National Transfer Accounts Manual: Measuring and Analysing the Generational
Economy. Sales No. E.13.XIII.6. Available from http://www.un.org/ en/development/desa/ publications/measuring-and-analysing-the-generational-economy.html.
United Nations, Department of Economic and Social Affairs, Population Division (2012a).
World Mortality Report 2011. ST/ESA/SER.A/324. _____ (2012b). Population ageing and development: Ten years after Madrid. Population Facts
No. 2012/4. Available from http://www.un.org/en/development/desa/population /publications/pdf/popfacts/popfacts_2012-4.pdf
_____ (2013). World Population Prospects: The 2012 Revision, DVD Edition. United Nations Population Fund (UNFPA) and HelpAge International (2012). Ageing in the
Twenty-first Century: A Celebration and a Challenge. New York and London. United States Social Security Administration (2010a). Social Security Programs Throughout the
World: The Americas, 2009. Available from http://www.ssa.gov/policy/docs/progdesc/ ssptw/2008-2009/americas/ssptw09americas.pdf.
_____ (2010b). Social Security Programs Throughout the World: Europe, 2010. Available from
http://www.ssa.gov/policy/docs/progdesc/ssptw/2010-2011/europe/ssptw10europe. pdf. _____ (2011a). Social Security Programs Throughout the World: Africa, 2011. Available from
http://www.ssa.gov/policy/docs/progdesc/ssptw/2010-2011/africa/ssptw11africa.pdf. _____ (2011b). Social Security Programs Throughout the World: Asia and the Pacific, 2010.
Available from http://www.ssa.gov/policy/docs/progdesc/ssptw/2010-2011/asia/ssptw1 0asia.pdf.
_____ (2011c). Social Security Programs Throughout the World: the Americas, 2011. Available
from http://www.ssa.gov/policy/docs/progdesc/ssptw/2010-2011/americas/index.html. _____ (2012a). Social Security Programs Throughout the World: Europe, 2012. Available from
http://www.ssa.gov/policy/docs/progdesc/ssptw/2012-2013/europe/index.html.
80 World Population Ageing 2013
United States Social Security Administration (2012b). Social Security Programs Throughout the
World: Asia and the Pacific, 2012. Available from http://www.ssa.gov/policy/docs/ progdesc/ssptw/2012-2013/ asia/ index.html.
_____ (2013). Social Security Programs Throughout the World: Africa, 2013. Available from
http://www.ssa.gov/policy/docs/progdesc/ssptw/2012-2013/africa/index.html. World Bank Institute (2005). Introduction to Poverty Analysis—Poverty Manual. Washington,
D.C.: World Bank. Available from http://siteresources.worldbank.org/PGLP/Resources /PovertyManual.pdf.
World Health Organization (WHO) (2007). Women, Ageing and Health: A Framework for Action: Focus on Gender. Available from http//www.whqlibdoc.who.int/publications /2007/9789241563529_eng.pdf.
_____ (2011). Metrics: Disability-Adjusted Life Year (DALY). Quantifying the Burden of Disease from mortality and morbidity. Available from http://www.who.int/ healthinfo /global_burden_disease/metrics_daly/en/.
_____ (2013). Global Health Observatory of the World Health Organization. Available from
http://apps.who.int/gho/data/node.main. (Accessed 15 October 2013). World Health Organization (WHO) and United States National Institute on Aging (U.S. NIA)
eds. (2011). Global Health and Aging. Available from http://www.who.int/ ageing/ publications/global_health/en/
Zaidi, Asghar (2010). Poverty risks for older people in EU countries—An update. Policy Brief January (II) 2010. Vienna: European Centre for Social Welfare Policy and Research. Available from http://www.euro.centre.org/data/1264603415_56681.pdf.

Annexes

United Nations Department of Economic and Social Affairs ǀ Population Division 83
Annex I
Definition of the indicators of population ageing
A. DISABILITY-ADJUSTED LIFE YEAR (DALY)
The Disability-Adjusted Life Years (DALYs) is a measurement of the gap between current health status and an ideal health situation where the entire population lives to an advanced age, free of disease and disability. One DALY can be thought of as one lost year of “healthy” life. It is calculated as the sum of the Years of Life Lost (YLL) due to premature mortality in the population and the Years Lost due to Disability (YLD) for people living with the health condition or its consequences.
B. DEPENDENCY RATIO
The total dependency ratio is the number of persons under age 15 years plus persons aged 65
years or over per one hundred persons 15 to 64 years. It is the sum of the child dependency ratio and the old-age dependency ratio.
The child dependency ratio is the number of persons 0 to 14 years per one hundred persons aged
15 to 64 years The old-age dependency ratio is the number of persons aged 65 years or over per one hundred
persons aged 15 to 64 years.
C. GROWTH RATE
A population’s growth rate is the increase (or decrease) in the number of persons in the population during a certain period of time, expressed as a percentage of the population at the beginning of the time period. The average annual growth rates for all ages as well as for particular age groups are calculated on the assumption that growth is continuous.
D. LABOUR FORCE PARTICIPATION
The labour force participation rate consists of the economically active population in a particular
age group as a percentage of the total population of that same age group. The active population (or labour force) includes persons in paid or unpaid employment, members of the armed forces (including temporary members) and the unemployed (including first-time job-seekers.). This definition is the one adopted by the Thirteenth International Conference of Labour Statisticians (Geneva, 1982). National definitions may differ in some cases. For information on the differences in scope, definitions and methods of calculation used for the various national series, see International Labour Organization, Sources and Methods: Labour Statistics (formerly Statistical Sources and Methods), Volume 5: Total and Economically Active Population, Employment and Unemployment (Population Censuses), available from http://laborsta.ilo.org/applv8/data/SSM5/E/ssm5.html#E.
84 World Population Ageing 2013
E. ECONOMIC SUPPORT RATIO
The economic support ratio is the number of equivalent producers or workers divided by the number of equivalent consumers in a given population.
E. LIFE EXPECTANCY
Life expectancy at a specific age is the average number of additional years a person of that age
could expect to live if current mortality levels observed for ages above that age were to continue for the rest of that person’s life. In particular, life expectancy at birth is the average number of years a newborn would live if current age-specific mortality rates were to continue.
G. LIVING INDEPENDENTLY
Living independently is either living alone or only with one’s spouse.
H. MEDIAN AGE
The median age of a population is the age that divides a population into two groups of the same
size, such that half the total population is younger than this age, and the other half older.
I. OLD-AGE SUPPORT RATIO
The old-age support ratio is the number of persons aged 15 to 64 years per every person aged 65 years or over.
J. SEX RATIO
The sex ratio is calculated as the number of males per one hundred females in a population. The
sex ratio may be calculated for a total population or for a specific age group.
K. STATUTORY PENSIONABLE AGE
The statutory pensionable age is the age at which eligible individuals qualify to receive old-age benefits in accordance to national laws and regulations. In addition to attainment of a specified age, receiving old-age benefits can also be conditional on the completion of a specified period of contributions or covered employment.
L. TOTAL FERTILITY RATE
The total fertility rate is the average number of children a woman would bear over the course of
her lifetime if current age-specific fertility rates remained constant throughout her childbearing years (normally between the ages of 15 and 49 years). The current total fertility rate is an indicator of the level of fertility at a given time.
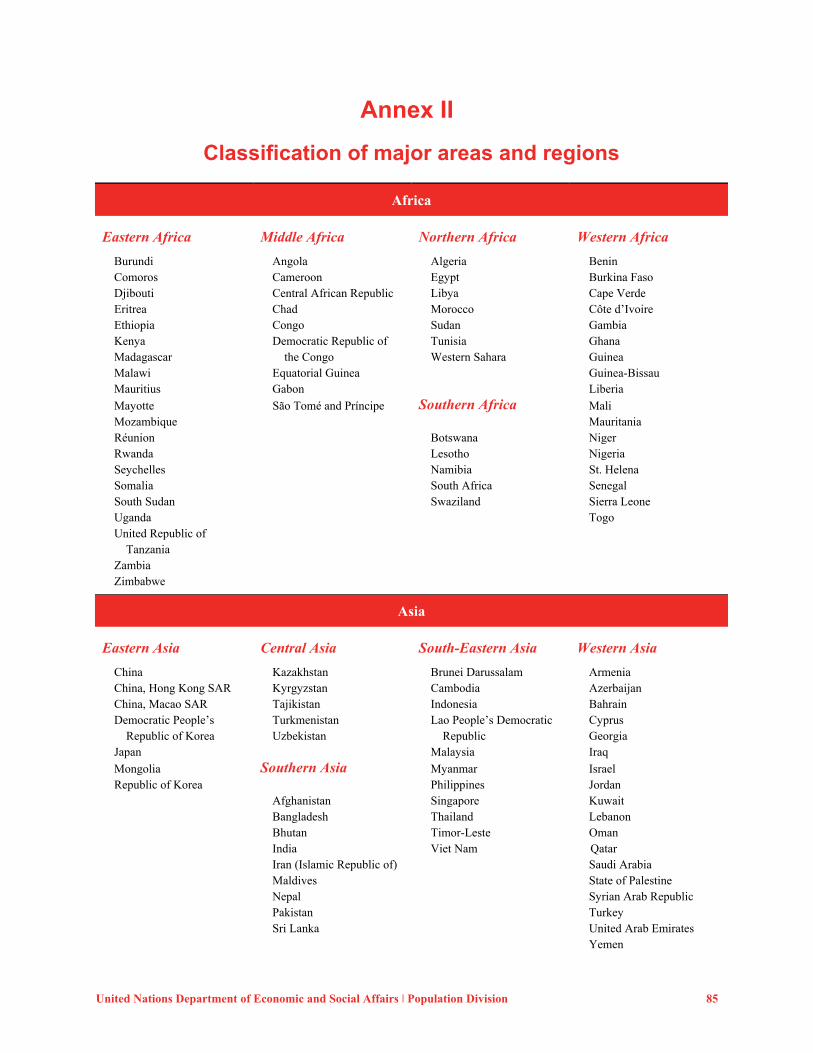
United Nations Department of Economic and Social Affairs ǀ Population Division 85
Annex II
Classification of major areas and regions
Africa
Eastern Africa Middle Africa Northern Africa Western Africa
Burundi Angola Algeria Benin Comoros Cameroon Egypt Burkina Faso Djibouti Central African Republic Libya Cape Verde Eritrea Chad Morocco Côte d’Ivoire Ethiopia Congo Sudan Gambia Kenya Democratic Republic of Tunisia Ghana Madagascar the Congo Western Sahara Guinea Malawi Equatorial Guinea Guinea-Bissau Mauritius Gabon Liberia
Mayotte São Tomé and Príncipe Southern Africa Mali Mozambique Mauritania Réunion Botswana Niger Rwanda Lesotho Nigeria Seychelles Namibia St. Helena Somalia South Africa Senegal South Sudan Swaziland Sierra Leone Uganda Togo United Republic of
Tanzania Zambia Zimbabwe
Asia
Eastern Asia Central Asia South-Eastern Asia Western Asia
China Kazakhstan Brunei Darussalam Armenia China, Hong Kong SAR Kyrgyzstan Cambodia Azerbaijan China, Macao SAR Tajikistan Indonesia Bahrain Democratic People’s Turkmenistan Lao People’s Democratic Cyprus
Republic of Korea Uzbekistan Republic Georgia Japan Malaysia Iraq
Mongolia Southern Asia Myanmar Israel Republic of Korea Philippines Jordan
Afghanistan Singapore Kuwait Bangladesh Thailand Lebanon Bhutan Timor-Leste Oman India Viet Nam Qatar Iran (Islamic Republic of) Saudi Arabia Maldives State of Palestine Nepal Syrian Arab Republic Pakistan Turkey Sri Lanka United Arab Emirates Yemen
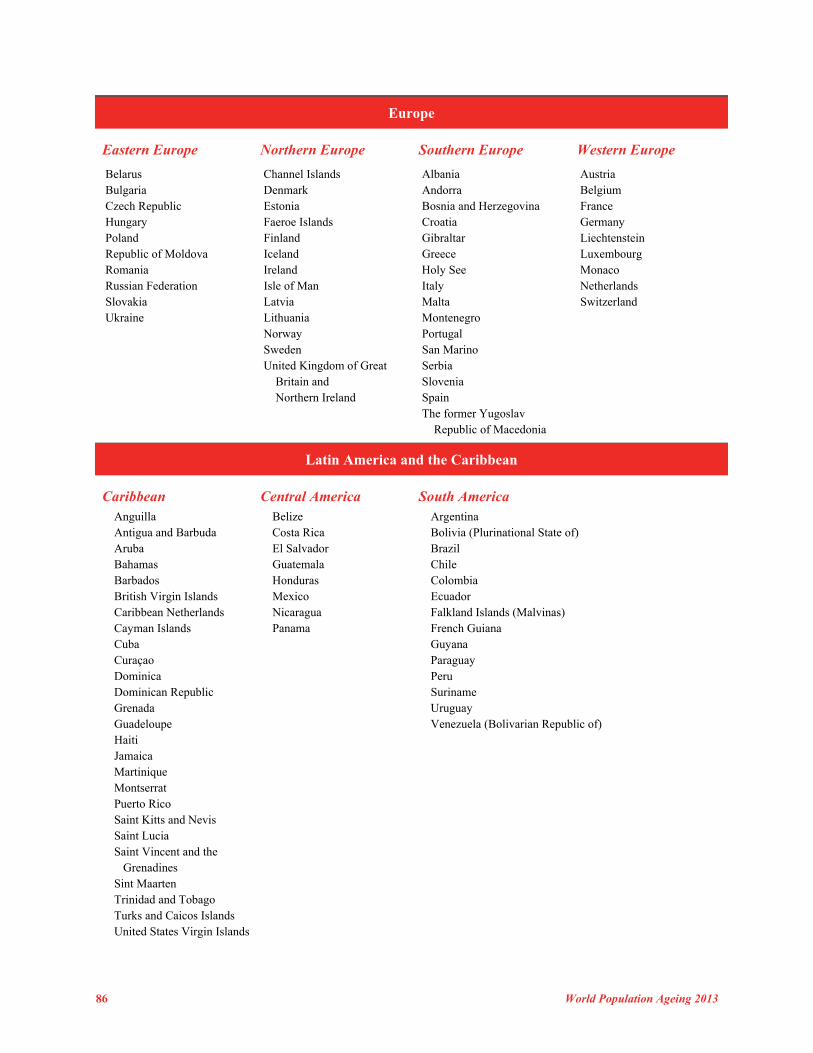
86 World Population Ageing 2013
Europe
Eastern Europe Northern Europe Southern Europe Western Europe
Belarus Channel Islands Albania Austria Bulgaria Denmark Andorra Belgium Czech Republic Estonia Bosnia and Herzegovina France Hungary Faeroe Islands Croatia Germany Poland Finland Gibraltar Liechtenstein Republic of Moldova Iceland Greece Luxembourg Romania Ireland Holy See Monaco Russian Federation Isle of Man Italy Netherlands Slovakia Latvia Malta Switzerland Ukraine Lithuania Montenegro Norway Portugal Sweden San Marino United Kingdom of Great Serbia Britain and Slovenia Northern Ireland Spain The former Yugoslav Republic of Macedonia
Latin America and the Caribbean
Caribbean Central America South America Anguilla Belize Argentina Antigua and Barbuda Costa Rica Bolivia (Plurinational State of) Aruba El Salvador Brazil Bahamas Guatemala Chile Barbados Honduras Colombia British Virgin Islands Mexico Ecuador Caribbean Netherlands Nicaragua Falkland Islands (Malvinas) Cayman Islands Panama French Guiana Cuba Guyana Curaçao Paraguay Dominica Peru Dominican Republic Suriname Grenada Uruguay Guadeloupe Venezuela (Bolivarian Republic of) Haiti Jamaica Martinique Montserrat Puerto Rico Saint Kitts and Nevis Saint Lucia Saint Vincent and the Grenadines Sint Maarten Trinidad and Tobago Turks and Caicos Islands United States Virgin Islands
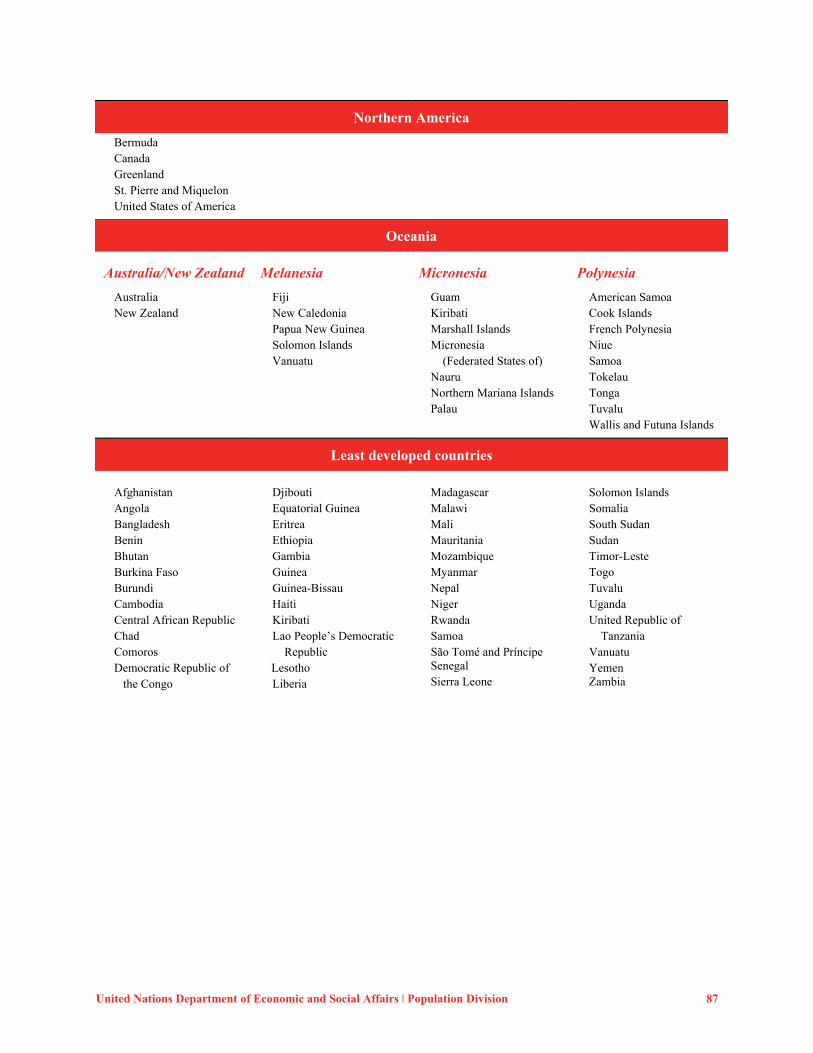
United Nations Department of Economic and Social Affairs ǀ Population Division 87
Northern America
Bermuda
Canada
Greenland
St. Pierre and Miquelon
United States of America
Oceania
Australia/New Zealand Melanesia Micronesia Polynesia
Australia Fiji Guam American Samoa New Zealand New Caledonia Kiribati Cook Islands Papua New Guinea Marshall Islands French Polynesia Solomon Islands Micronesia Niue Vanuatu (Federated States of) Samoa Nauru Tokelau Northern Mariana Islands Tonga Palau Tuvalu Wallis and Futuna Islands
Least developed countries
Afghanistan Djibouti Madagascar Solomon Islands Angola Equatorial Guinea Malawi Somalia Bangladesh Eritrea Mali South Sudan Benin Ethiopia Mauritania Sudan Bhutan Gambia Mozambique Timor-Leste Burkina Faso Guinea Myanmar Togo Burundi Guinea-Bissau Nepal Tuvalu Cambodia Haiti Niger Uganda Central African Republic Kiribati Rwanda United Republic of Chad Lao People’s Democratic Samoa Tanzania Comoros Republic São Tomé and Príncipe Vanuatu Democratic Republic of Lesotho Senegal Yemen the Congo Liberia Sierra Leone Zambia


Annex III
Summary tables
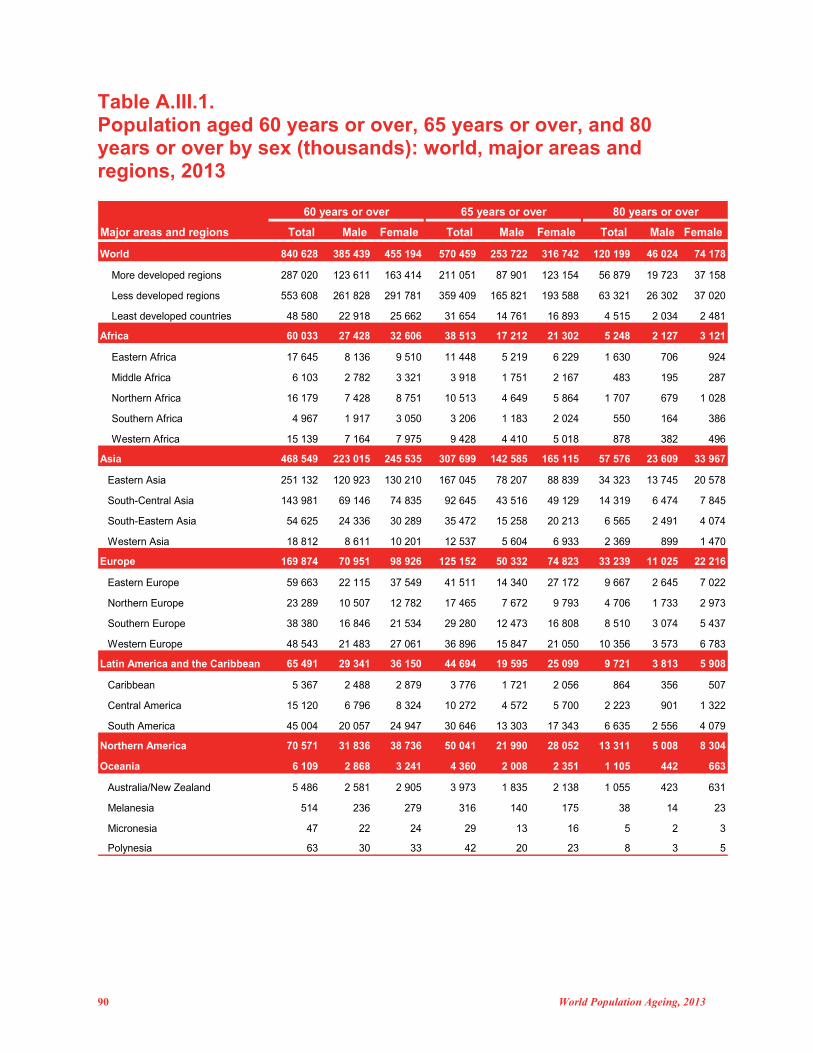
90 World Population Ageing, 2013
Table A.III.1. Population aged 60 years or over, 65 years or over, and 80 years or over by sex (thousands): world, major areas and regions, 2013
Major areas and regions Total Male Female Total Male Female Total Male Female
World 840 628 385 439 455 194 570 459 253 722 316 742 120 199 46 024 74 178
More developed regions 287 020 123 611 163 414 211 051 87 901 123 154 56 879 19 723 37 158
Less developed regions 553 608 261 828 291 781 359 409 165 821 193 588 63 321 26 302 37 020
Least developed countries 48 580 22 918 25 662 31 654 14 761 16 893 4 515 2 034 2 481
Africa 60 033 27 428 32 606 38 513 17 212 21 302 5 248 2 127 3 121
Eastern Africa 17 645 8 136 9 510 11 448 5 219 6 229 1 630 706 924
Middle Africa 6 103 2 782 3 321 3 918 1 751 2 167 483 195 287
Northern Africa 16 179 7 428 8 751 10 513 4 649 5 864 1 707 679 1 028
Southern Africa 4 967 1 917 3 050 3 206 1 183 2 024 550 164 386
Western Africa 15 139 7 164 7 975 9 428 4 410 5 018 878 382 496
Asia 468 549 223 015 245 535 307 699 142 585 165 115 57 576 23 609 33 967
Eastern Asia 251 132 120 923 130 210 167 045 78 207 88 839 34 323 13 745 20 578
South-Central Asia 143 981 69 146 74 835 92 645 43 516 49 129 14 319 6 474 7 845
South-Eastern Asia 54 625 24 336 30 289 35 472 15 258 20 213 6 565 2 491 4 074
Western Asia 18 812 8 611 10 201 12 537 5 604 6 933 2 369 899 1 470
Europe 169 874 70 951 98 926 125 152 50 332 74 823 33 239 11 025 22 216
Eastern Europe 59 663 22 115 37 549 41 511 14 340 27 172 9 667 2 645 7 022
Northern Europe 23 289 10 507 12 782 17 465 7 672 9 793 4 706 1 733 2 973
Southern Europe 38 380 16 846 21 534 29 280 12 473 16 808 8 510 3 074 5 437
Western Europe 48 543 21 483 27 061 36 896 15 847 21 050 10 356 3 573 6 783
Latin America and the Caribbean 65 491 29 341 36 150 44 694 19 595 25 099 9 721 3 813 5 908
Caribbean 5 367 2 488 2 879 3 776 1 721 2 056 864 356 507
Central America 15 120 6 796 8 324 10 272 4 572 5 700 2 223 901 1 322
South America 45 004 20 057 24 947 30 646 13 303 17 343 6 635 2 556 4 079
Northern America 70 571 31 836 38 736 50 041 21 990 28 052 13 311 5 008 8 304
Oceania 6 109 2 868 3 241 4 360 2 008 2 351 1 105 442 663
Australia/New Zealand 5 486 2 581 2 905 3 973 1 835 2 138 1 055 423 631
Melanesia 514 236 279 316 140 175 38 14 23
Micronesia 47 22 24 29 13 16 5 2 3
Polynesia 63 30 33 42 20 23 8 3 5
60 years or over 65 years or over 80 years or over
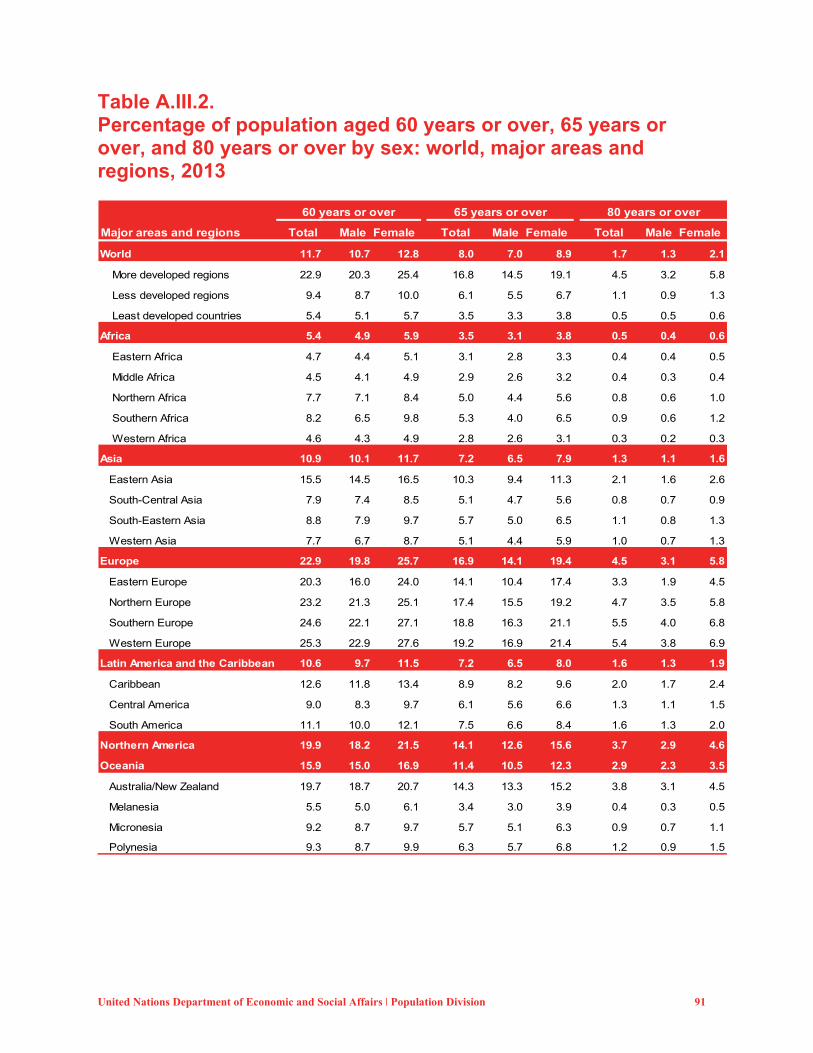
United Nations Department of Economic and Social Affairs ǀ Population Division 91
Table A.III.2. Percentage of population aged 60 years or over, 65 years or over, and 80 years or over by sex: world, major areas and regions, 2013
Major areas and regions Total Male Female Total Male Female Total Male Female
World 11.7 10.7 12.8 8.0 7.0 8.9 1.7 1.3 2.1
More developed regions 22.9 20.3 25.4 16.8 14.5 19.1 4.5 3.2 5.8
Less developed regions 9.4 8.7 10.0 6.1 5.5 6.7 1.1 0.9 1.3
Least developed countries 5.4 5.1 5.7 3.5 3.3 3.8 0.5 0.5 0.6
Africa 5.4 4.9 5.9 3.5 3.1 3.8 0.5 0.4 0.6
Eastern Africa 4.7 4.4 5.1 3.1 2.8 3.3 0.4 0.4 0.5
Middle Africa 4.5 4.1 4.9 2.9 2.6 3.2 0.4 0.3 0.4
Northern Africa 7.7 7.1 8.4 5.0 4.4 5.6 0.8 0.6 1.0
Southern Africa 8.2 6.5 9.8 5.3 4.0 6.5 0.9 0.6 1.2
Western Africa 4.6 4.3 4.9 2.8 2.6 3.1 0.3 0.2 0.3
Asia 10.9 10.1 11.7 7.2 6.5 7.9 1.3 1.1 1.6
Eastern Asia 15.5 14.5 16.5 10.3 9.4 11.3 2.1 1.6 2.6
South-Central Asia 7.9 7.4 8.5 5.1 4.7 5.6 0.8 0.7 0.9
South-Eastern Asia 8.8 7.9 9.7 5.7 5.0 6.5 1.1 0.8 1.3
Western Asia 7.7 6.7 8.7 5.1 4.4 5.9 1.0 0.7 1.3
Europe 22.9 19.8 25.7 16.9 14.1 19.4 4.5 3.1 5.8
Eastern Europe 20.3 16.0 24.0 14.1 10.4 17.4 3.3 1.9 4.5
Northern Europe 23.2 21.3 25.1 17.4 15.5 19.2 4.7 3.5 5.8
Southern Europe 24.6 22.1 27.1 18.8 16.3 21.1 5.5 4.0 6.8
Western Europe 25.3 22.9 27.6 19.2 16.9 21.4 5.4 3.8 6.9
Latin America and the Caribbean 10.6 9.7 11.5 7.2 6.5 8.0 1.6 1.3 1.9
Caribbean 12.6 11.8 13.4 8.9 8.2 9.6 2.0 1.7 2.4
Central America 9.0 8.3 9.7 6.1 5.6 6.6 1.3 1.1 1.5
South America 11.1 10.0 12.1 7.5 6.6 8.4 1.6 1.3 2.0
Northern America 19.9 18.2 21.5 14.1 12.6 15.6 3.7 2.9 4.6
Oceania 15.9 15.0 16.9 11.4 10.5 12.3 2.9 2.3 3.5
Australia/New Zealand 19.7 18.7 20.7 14.3 13.3 15.2 3.8 3.1 4.5
Melanesia 5.5 5.0 6.1 3.4 3.0 3.9 0.4 0.3 0.5
Micronesia 9.2 8.7 9.7 5.7 5.1 6.3 0.9 0.7 1.1
Polynesia 9.3 8.7 9.9 6.3 5.7 6.8 1.2 0.9 1.5
60 years or over 65 years or over 80 years or over
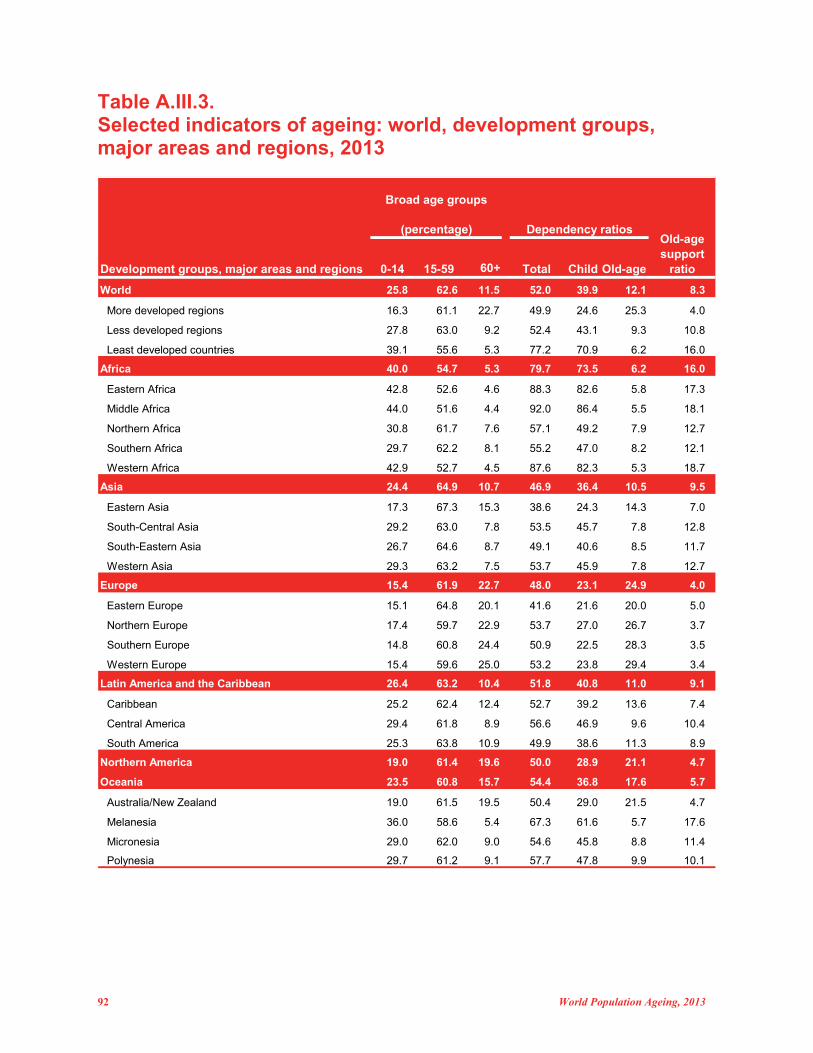
92 World Population Ageing, 2013
Table A.III.3. Selected indicators of ageing: world, development groups, major areas and regions, 2013
Development groups, major areas and regions 0-14 15-59 60+ Total Child Old-age
World 25.8 62.6 11.5 52.0 39.9 12.1 8.3
More developed regions 16.3 61.1 22.7 49.9 24.6 25.3 4.0
Less developed regions 27.8 63.0 9.2 52.4 43.1 9.3 10.8
Least developed countries 39.1 55.6 5.3 77.2 70.9 6.2 16.0
Africa 40.0 54.7 5.3 79.7 73.5 6.2 16.0
Eastern Africa 42.8 52.6 4.6 88.3 82.6 5.8 17.3
Middle Africa 44.0 51.6 4.4 92.0 86.4 5.5 18.1
Northern Africa 30.8 61.7 7.6 57.1 49.2 7.9 12.7
Southern Africa 29.7 62.2 8.1 55.2 47.0 8.2 12.1
Western Africa 42.9 52.7 4.5 87.6 82.3 5.3 18.7
Asia 24.4 64.9 10.7 46.9 36.4 10.5 9.5
Eastern Asia 17.3 67.3 15.3 38.6 24.3 14.3 7.0
South-Central Asia 29.2 63.0 7.8 53.5 45.7 7.8 12.8
South-Eastern Asia 26.7 64.6 8.7 49.1 40.6 8.5 11.7
Western Asia 29.3 63.2 7.5 53.7 45.9 7.8 12.7
Europe 15.4 61.9 22.7 48.0 23.1 24.9 4.0
Eastern Europe 15.1 64.8 20.1 41.6 21.6 20.0 5.0
Northern Europe 17.4 59.7 22.9 53.7 27.0 26.7 3.7
Southern Europe 14.8 60.8 24.4 50.9 22.5 28.3 3.5
Western Europe 15.4 59.6 25.0 53.2 23.8 29.4 3.4
Latin America and the Caribbean 26.4 63.2 10.4 51.8 40.8 11.0 9.1
Caribbean 25.2 62.4 12.4 52.7 39.2 13.6 7.4
Central America 29.4 61.8 8.9 56.6 46.9 9.6 10.4
South America 25.3 63.8 10.9 49.9 38.6 11.3 8.9
Northern America 19.0 61.4 19.6 50.0 28.9 21.1 4.7
Oceania 23.5 60.8 15.7 54.4 36.8 17.6 5.7
Australia/New Zealand 19.0 61.5 19.5 50.4 29.0 21.5 4.7
Melanesia 36.0 58.6 5.4 67.3 61.6 5.7 17.6
Micronesia 29.0 62.0 9.0 54.6 45.8 8.8 11.4
Polynesia 29.7 61.2 9.1 57.7 47.8 9.9 10.1
Broad age groups
(percentage) Dependency ratiosOld-age support
ratio
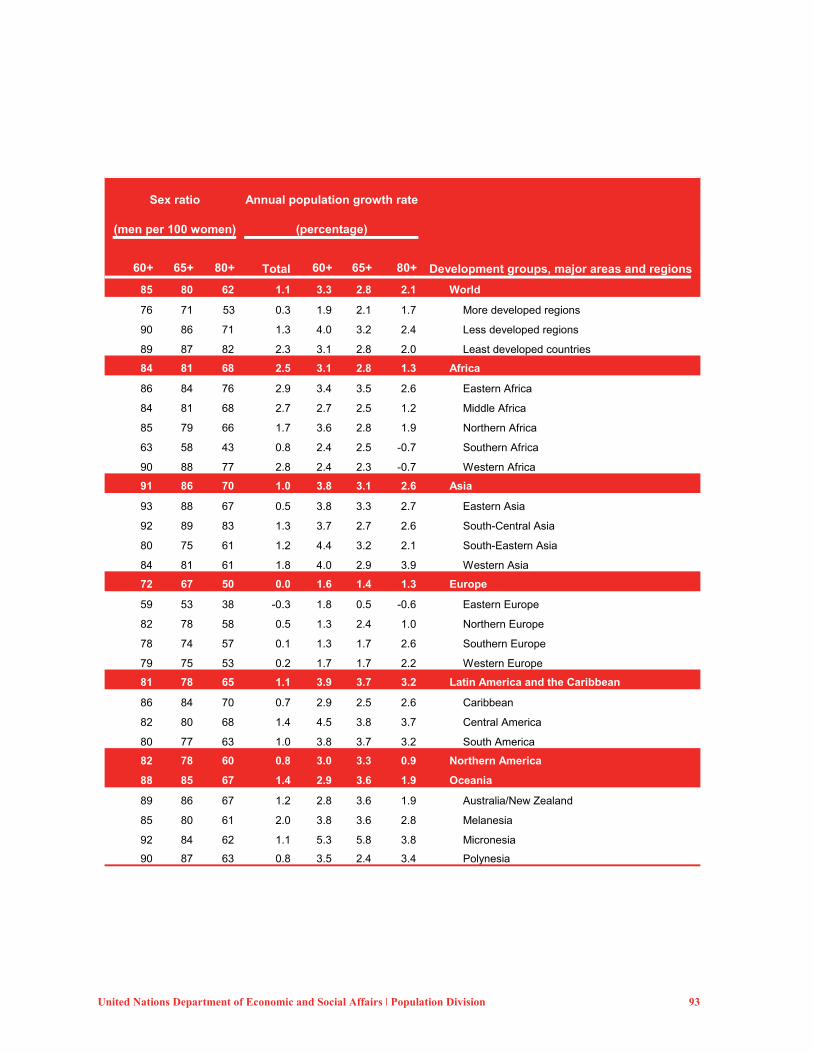
United Nations Department of Economic and Social Affairs ǀ Population Division 93
60+ 65+ 80+ Total 60+ 65+ 80+ Development groups, major areas and regions
85 80 62 1.1 3.3 2.8 2.1 World
76 71 53 0.3 1.9 2.1 1.7 More developed regions
90 86 71 1.3 4.0 3.2 2.4 Less developed regions
89 87 82 2.3 3.1 2.8 2.0 Least developed countries
84 81 68 2.5 3.1 2.8 1.3 Africa
86 84 76 2.9 3.4 3.5 2.6 Eastern Africa
84 81 68 2.7 2.7 2.5 1.2 Middle Africa
85 79 66 1.7 3.6 2.8 1.9 Northern Africa
63 58 43 0.8 2.4 2.5 -0.7 Southern Africa
90 88 77 2.8 2.4 2.3 -0.7 Western Africa
91 86 70 1.0 3.8 3.1 2.6 Asia
93 88 67 0.5 3.8 3.3 2.7 Eastern Asia
92 89 83 1.3 3.7 2.7 2.6 South-Central Asia
80 75 61 1.2 4.4 3.2 2.1 South-Eastern Asia
84 81 61 1.8 4.0 2.9 3.9 Western Asia
72 67 50 0.0 1.6 1.4 1.3 Europe
59 53 38 -0.3 1.8 0.5 -0.6 Eastern Europe
82 78 58 0.5 1.3 2.4 1.0 Northern Europe
78 74 57 0.1 1.3 1.7 2.6 Southern Europe
79 75 53 0.2 1.7 1.7 2.2 Western Europe
81 78 65 1.1 3.9 3.7 3.2 Latin America and the Caribbean
86 84 70 0.7 2.9 2.5 2.6 Caribbean
82 80 68 1.4 4.5 3.8 3.7 Central America
80 77 63 1.0 3.8 3.7 3.2 South America
82 78 60 0.8 3.0 3.3 0.9 Northern America
88 85 67 1.4 2.9 3.6 1.9 Oceania
89 86 67 1.2 2.8 3.6 1.9 Australia/New Zealand
85 80 61 2.0 3.8 3.6 2.8 Melanesia
92 84 62 1.1 5.3 5.8 3.8 Micronesia
90 87 63 0.8 3.5 2.4 3.4 Polynesia
Annual population growth rate
(percentage)
Sex ratio
(men per 100 women)
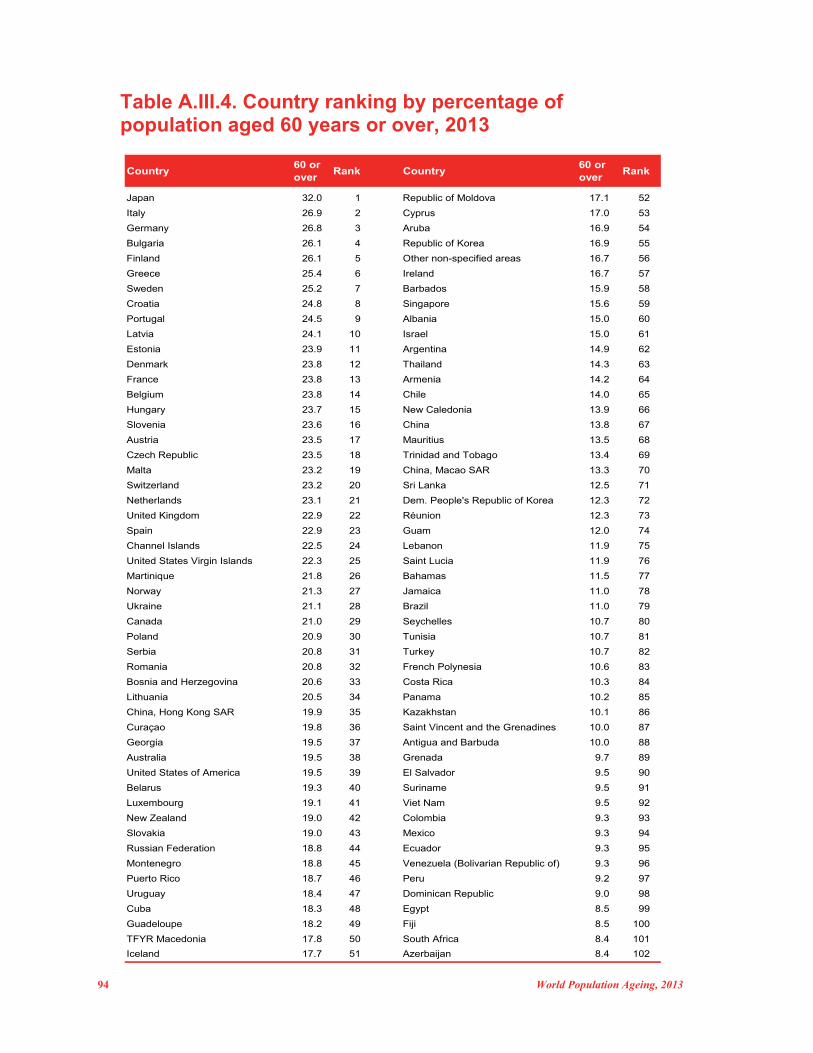
94 World Population Ageing, 2013
Table A.III.4. Country ranking by percentage of population aged 60 years or over, 2013
Country 60 or over
Rank Country 60 or over
Rank
Japan 32.0 1 Republic of Moldova 17.1 52
Italy 26.9 2 Cyprus 17.0 53
Germany 26.8 3 Aruba 16.9 54
Bulgaria 26.1 4 Republic of Korea 16.9 55
Finland 26.1 5 Other non-specified areas 16.7 56
Greece 25.4 6 Ireland 16.7 57
Sweden 25.2 7 Barbados 15.9 58
Croatia 24.8 8 Singapore 15.6 59
Portugal 24.5 9 Albania 15.0 60
Latvia 24.1 10 Israel 15.0 61
Estonia 23.9 11 Argentina 14.9 62
Denmark 23.8 12 Thailand 14.3 63
France 23.8 13 Armenia 14.2 64
Belgium 23.8 14 Chile 14.0 65
Hungary 23.7 15 New Caledonia 13.9 66
Slovenia 23.6 16 China 13.8 67
Austria 23.5 17 Mauritius 13.5 68
Czech Republic 23.5 18 Trinidad and Tobago 13.4 69
Malta 23.2 19 China, Macao SAR 13.3 70
Switzerland 23.2 20 Sri Lanka 12.5 71
Netherlands 23.1 21 Dem. People's Republic of Korea 12.3 72
United Kingdom 22.9 22 Réunion 12.3 73
Spain 22.9 23 Guam 12.0 74
Channel Islands 22.5 24 Lebanon 11.9 75
United States Virgin Islands 22.3 25 Saint Lucia 11.9 76
Martinique 21.8 26 Bahamas 11.5 77
Norway 21.3 27 Jamaica 11.0 78
Ukraine 21.1 28 Brazil 11.0 79
Canada 21.0 29 Seychelles 10.7 80
Poland 20.9 30 Tunisia 10.7 81
Serbia 20.8 31 Turkey 10.7 82
Romania 20.8 32 French Polynesia 10.6 83
Bosnia and Herzegovina 20.6 33 Costa Rica 10.3 84
Lithuania 20.5 34 Panama 10.2 85
China, Hong Kong SAR 19.9 35 Kazakhstan 10.1 86
Curaçao 19.8 36 Saint Vincent and the Grenadines 10.0 87
Georgia 19.5 37 Antigua and Barbuda 10.0 88
Australia 19.5 38 Grenada 9.7 89
United States of America 19.5 39 El Salvador 9.5 90
Belarus 19.3 40 Suriname 9.5 91
Luxembourg 19.1 41 Viet Nam 9.5 92
New Zealand 19.0 42 Colombia 9.3 93
Slovakia 19.0 43 Mexico 9.3 94
Russian Federation 18.8 44 Ecuador 9.3 95
Montenegro 18.8 45 Venezuela (Bolivarian Republic of) 9.3 96
Puerto Rico 18.7 46 Peru 9.2 97
Uruguay 18.4 47 Dominican Republic 9.0 98
Cuba 18.3 48 Egypt 8.5 99
Guadeloupe 18.2 49 Fiji 8.5 100
TFYR Macedonia 17.8 50 South Africa 8.4 101
Iceland 17.7 51 Azerbaijan 8.4 102
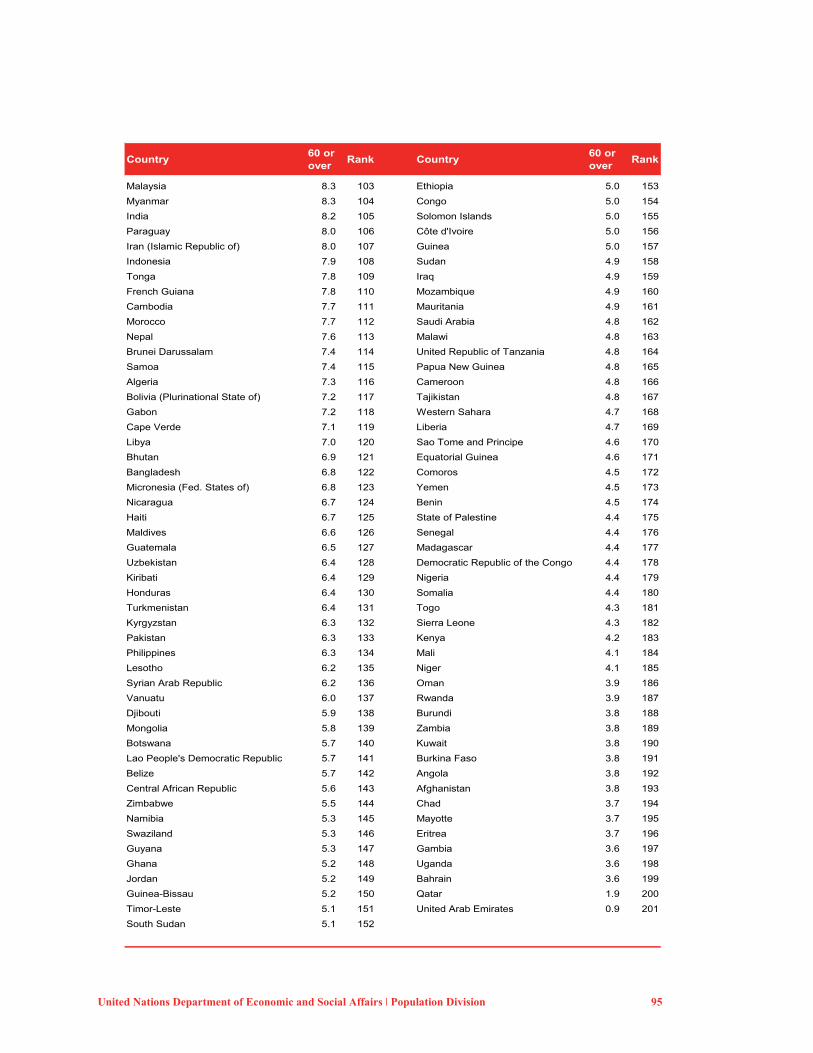
United Nations Department of Economic and Social Affairs ǀ Population Division 95
Country 60 or over
Rank Country 60 or over
Rank
Malaysia 8.3 103 Ethiopia 5.0 153
Myanmar 8.3 104 Congo 5.0 154
India 8.2 105 Solomon Islands 5.0 155
Paraguay 8.0 106 Côte d'Ivoire 5.0 156
Iran (Islamic Republic of) 8.0 107 Guinea 5.0 157
Indonesia 7.9 108 Sudan 4.9 158
Tonga 7.8 109 Iraq 4.9 159
French Guiana 7.8 110 Mozambique 4.9 160
Cambodia 7.7 111 Mauritania 4.9 161
Morocco 7.7 112 Saudi Arabia 4.8 162
Nepal 7.6 113 Malawi 4.8 163
Brunei Darussalam 7.4 114 United Republic of Tanzania 4.8 164
Samoa 7.4 115 Papua New Guinea 4.8 165
Algeria 7.3 116 Cameroon 4.8 166
Bolivia (Plurinational State of) 7.2 117 Tajikistan 4.8 167
Gabon 7.2 118 Western Sahara 4.7 168
Cape Verde 7.1 119 Liberia 4.7 169
Libya 7.0 120 Sao Tome and Principe 4.6 170
Bhutan 6.9 121 Equatorial Guinea 4.6 171
Bangladesh 6.8 122 Comoros 4.5 172
Micronesia (Fed. States of) 6.8 123 Yemen 4.5 173
Nicaragua 6.7 124 Benin 4.5 174
Haiti 6.7 125 State of Palestine 4.4 175
Maldives 6.6 126 Senegal 4.4 176
Guatemala 6.5 127 Madagascar 4.4 177
Uzbekistan 6.4 128 Democratic Republic of the Congo 4.4 178
Kiribati 6.4 129 Nigeria 4.4 179
Honduras 6.4 130 Somalia 4.4 180
Turkmenistan 6.4 131 Togo 4.3 181
Kyrgyzstan 6.3 132 Sierra Leone 4.3 182
Pakistan 6.3 133 Kenya 4.2 183
Philippines 6.3 134 Mali 4.1 184
Lesotho 6.2 135 Niger 4.1 185
Syrian Arab Republic 6.2 136 Oman 3.9 186
Vanuatu 6.0 137 Rwanda 3.9 187
Djibouti 5.9 138 Burundi 3.8 188
Mongolia 5.8 139 Zambia 3.8 189
Botswana 5.7 140 Kuwait 3.8 190
Lao People's Democratic Republic 5.7 141 Burkina Faso 3.8 191
Belize 5.7 142 Angola 3.8 192
Central African Republic 5.6 143 Afghanistan 3.8 193
Zimbabwe 5.5 144 Chad 3.7 194
Namibia 5.3 145 Mayotte 3.7 195
Swaziland 5.3 146 Eritrea 3.7 196
Guyana 5.3 147 Gambia 3.6 197
Ghana 5.2 148 Uganda 3.6 198
Jordan 5.2 149 Bahrain 3.6 199
Guinea-Bissau 5.2 150 Qatar 1.9 200
Timor-Leste 5.1 151 United Arab Emirates 0.9 201
South Sudan 5.1 152


United Nations, New York
December 2013