Embed Size (px)
Citation preview
World Population Prospects
S o
c i a
l A f f a
i r s
E c o n o m i c &
The 2012 Revision Highlights and Advance Tables
United Nations New York, 2013

ESA/P/WP.228 Department of Economic and Social Affairs Population Division
World Population Prospects
The 2012 Revision
Highlights and Advance Tables
United Nations New York, 2013
DESA The Department of Economic and Social Affairs of the United Nations Secretariat is a vital interface between global policies in the economic, social and environmental spheres and national action. The Department works in three main interlinked areas: (i) it compiles, generates and analyses a wide range of economic, social and environmental data and information on which States Members of the United Nations draw to review common problems and take stock of policy options; (ii) it facilitates the negotiations of Member States in many intergovernmental bodies on joint courses of action to address ongoing or emerging global challenges; and (iii) it advises interested Governments on the ways and means of translating policy frameworks developed in United Nations conferences and summits into programmes at the country level and, through technical assistance, helps build national capacities.
Note The designations employed in this report and the material presented in it do not imply the expression of any opinion whatsoever on the part of the Secretariat of the United Nations concerning the legal status of any country, territory, city or area or of its authorities, or concerning the delimitation of its frontiers or boundaries. Symbols of United Nations documents are composed of capital letters combined with figures. This publication has been issued without formal editing. Suggested citation: United Nations, Department of Economic and Social Affairs, Population Division (2013). World Population Prospects: The 2012 Revision, Highlights and Advance Tables. Working Paper No. ESA/P/WP.228.
PREFACE
This report presents the highlights of the results of the 2012 Revision of the official United Nations population estimates and projections prepared by the Population Division of the Department of Economic and Social Affairs of the United Nations Secretariat. The 2012 Revision constitutes the twenty third round of the global population estimates and projections produced by the Population Division since 1951. The Population Division has pursued its endeavour to develop probabilistic projections for all countries and areas of the world, which was initiated in the 2010 Revision with the projections of fertility. Aside from updating the methods used to yield the future trajectories of fertility, the 2012 Revision incorporates for the first time probabilistic projections of mortality. Detailed components of the projections are presented for up to the year 2100. It should be stressed, however, that making projections to such a far horizon at the country level is subject to a high degree of uncertainty. In that regard, users are invited not to focus only on the outcomes of the medium variant, which corresponds to the median of several thousands projected country trajectories for each component, but also to appreciate the meaning of the uncertainty bounds in such an exercise. Detailed information on the uncertainty bounds for different components at the country level can be accessed on the Population Division’s website at www.unpopulation.org. The standard outputs of the 2012 Revision do not include the probabilistic projections and are restricted to deterministic projection variants and scenarios included in other Revisions of World Population Prospects.
The detailed results of the 2012 Revision are made available through a variety of media. The Population Division’s website provide access to an extended set of data organized in Excel files (and ASCII database files) as well as to an interactive database that enables users to obtain specific information on a few countries at a time. Users requiring the complete results of the 2012 Revision will be able to purchase them on CD-ROM/DVD. A description of the data contained in the different CD-ROM/ DVD will be posted on the Population Division’s website. A wall chart providing key demographic indicators for each development group, major area, region and country for the most recent period will also be published. The full results of the 2012 Revision will be presented in two volumes. The first volume will provide comprehensive tables displaying key demographic indicators for each development group, major area, region and country for selected periods or dates within 1950-2100. The second volume will contain demographic profiles presenting time series and plots covering the period from 1950 to 2100 for selected indicators for each country, as well as for development groups, major areas and regions. This volume will provide, for each country and area, a brief description of the data sources and demographic methods used to make the base-year estimates for each country or area. Responsibility for the 2012 Revision rests with the Population Division. In preparing the 2012 Revision, the Population Division relied on the collaboration of the regional commissions, especially the Economic Commission for Latin America and the Caribbean, as well as specialized agencies and other relevant bodies of the United Nations system, including UNAIDS, UNICEF, UNHCR and the World Bank. The Statistics Division of the Department of Economic and Social Affairs of the United Nations Secretariat, through its United Nations Demographic Yearbook and its accompanying databases, provided access to official national population statistics used in the preparation of the 2012 Revision. The Population Division also acknowledges the assistance and cooperation of Measure DHS, MICS (UNICEF), the Human Mortality Database, and IPUMS-International as well as national statistical offices who made available data and reports for recent censuses and surveys that informed the development of the estimates presented in this report. The Population Division is grateful for the contributions made by all these entities. For further information about the 2012 Revision, please contact the Director, Population Division, United Nations, New York, NY 10017, USA (Fax: 1 212 963 2147).
iii

v
CONTENTS Page Preface ............................................................................................................................................................ iii Explanatory Notes ............................................................................................................................................. viii Executive Summary............................................................................................................................................................. xv Chapters I. WORLD POPULATION TRENDS .............................................................................................................. 1 A. Population size and growth .......................................................................................................... 1 B. Population age composition ......................................................................................................... 6 II. FERTILITY ............................................................................................................................................ 11 III. MORTALITY ......................................................................................................................................... 15 A. Trends and prospects in world mortality ........................................................................................ 15 B. The demographic impact of HIV/AIDS.......................................................................................... 18 IV. INTERNATIONAL MIGRATION................................................................................................................ 21 V. ASSUMPTIONS UNDERLYING THE 2012 REVISION ................................................................................ 23 A. Fertility assumptions: convergence toward low fertility ............................................................. 23 B. Mortality assumptions: increasing life expectancy for most countries ........................................ 36 C. International migration assumptions ............................................................................................ 46 D. Eight projection variants .............................................................................................................. 47 E. Methodological changes introduced in the 2012 Revision........................................................... 47 VI. SUMMARY TABLES............................................................................................................................... 49
TABLES No. Page I.1. Population of the world, development groups and major areas, 1950, 1980, 2013. 2050 and 2100, according to different variants............................................................................................................. 2 I.2. Percentage distribution of the world population by development group and major area, estimates and projections according to different variants, 1950-2100 ................................................................ 2 I.3. Average annual rate of population change for the world, development groups and major areas, for selected periods and different variants (percentage)...................................................................... 5 I.4. Distribution of the population of the world, development groups and major areas by broad age groups, 2013, 2050 and 2100 (medium variant).................................................................................. 7 I.5. Median age for the world, development groups and major areas, 1950, 1980, 2013, 2050 and 2100 (medium variant) ................................................................................................................................. 8 I.6. Average annual rates of change of the total population and the population in broad age groups, by development group and major area, 2013-2050 and 2050-2100 (medium variant)........................ 10 II.1. Estimated and projected total fertility for the world, development groups and major areas, for selected periods and different variants........................................................................................... 12 II.2. Distribution of the world population as well as countries and areas according to the level of total fertility in selected periods (medium variant)...................................................................................... 13
No. Page III.1. Life expectancy at birth for the world, development groups and major areas, 2005-2010, 2045-2050 and 2095-2100................................................................................................................... 15 III.2. Life expectancy by sex for the world and development groups, 2005-2010, 2045-2050 and 2095-2100 ........................................................................................................................................... 17 IV.1. Average annual net number of migrants per decade by development group and major area, 1950-2050 (medium variant)............................................................................................................... 22 V.1. Low fertility countries having experienced some increase in at least two consecutive periods .......... 31 V.2. Adult 15-49 HIV prevalence rate in the countries most affected by the HIV/AIDS epidemic between 1980 and 2011....................................................................................................................... 45 V.3. Projection variants in terms of assumptions for fertility, mortality and international migration......... 47
FIGURE No. Page 1. Population of the world, 1950-2100, according to different projections and variants......................... xv I.1. Average annual rate of population change for the world and development groups, 1950-2100 ......... 4 II.1. Total fertility trajectories for the world and development groups, 1950-2100 (medium variant) ....... 12 III.1. Life expectancy at birth for the world and development groups, 1950-2100 ...................................... 16 III.2. Life expectancy at birth for the world and major areas, 1950-2100.................................................... 16 III.3. Under-five mortality for the world and development groups, 1950-2100........................................... 18 V.1. Schematic phases of the fertility transition.......................................................................................... 26 V.2. Total fertility decrements and projection intervals of double-logistic curves for Bangladesh (systematic decline part)...................................................................................................................... 27 V.3. Probabilistic trajectories of projected total fertility (2010-2100) for Bangladesh ............................... 28 V.4. Total fertility decrements and projection intervals of double-logistic curves for Nigeria ................... 29 V.5. Probabilistic trajectories of projected total fertility (2015-2100) for Nigeria...................................... 29 V.6. Nigeria 1970-2015 total fertility rate estimates based on various data sources and estimation methods, and WPP estimates for the 2010 and 2012 Revisions.......................................................... 30 V.7. Comparison of total fertility projections for 2095-2100 with 80% projection intervals between the 2010 and 2012 Revisions for 25 low fertility countries used to estimate the AR1 Bayesian Hierarchical Model (BHM) ................................................................................................................. 32 V.8. Projections of total fertility with 80% and 95% projection intervals for selected low fertility countries .............................................................................................................................................. 32 V.9. Comparison of total fertility projections for 2095-2100 with 80% projection intervals between the 2010 and 2012 Revisions for all low fertility countries in 2005-2010 not having experienced any increase in at least two consecutive periods between 1950-2010........................................................ 33 V.10. Timing when countries reach lowest median total fertility ................................................................. 34 V.11. Median projection of total fertility by 2095-2100 compared to current level in 2005-2010 ............... 34 V.12. Female gains in life expectancy at birth and projection intervals of double-logistic curves for Canada (systematic decline part) .................................................................................................. 39 V.13. Probabilistic trajectories of projected female life expectancy at birth (2010-2100) for Canada ......... 40 V.14. Gap in female-male life expectancy at birth and projection intervals for Canada............................... 41 V.15. Probabilistic trajectories of projected male life expectancy at birth (2010-2100) for Canada ............ 42 V.16. Comparison of probabilistic projections of female and male life expectancies at birth for selected periods for Canada................................................................................................................. 43
vi
vii
EXPLANATORY NOTES
The following symbols have been used in the tables throughout this report:
Two dots (..) indicate that data are not available or are not reported separately. A hyphen (-) indicates that the item is not applicable. A minus sign (-) before a figure indicates a decrease. A full stop (.) is used to indicate decimals. Years given refer to 1 July. Use of a hyphen (-) between years, for example, 1995-2000, signifies the full period involved, from 1 July of the first year to 1 July of the second year. Numbers and percentages in tables do not necessarily add to totals because of rounding.
References to countries, territories and areas: The designations employed and the material in this publication do not imply the expression of any opinion whatsoever on the part of the Secretariat of the United Nations concerning the legal status of any country, territory or area or its authorities, or concerning the delimitation of its frontiers or boundaries. The designation “more developed” and “less developed” regions are intended for statistical purposes and do not express a judgment about the stage reached by a particular country or area in the development process. The term “country” as used in this publication also refers, as appropriate, to territories or areas.
More developed regions comprise all regions of Europe plus Northern America, Australia/New Zealand and Japan. Less developed regions comprise all regions of Africa, Asia (excluding Japan), and Latin America and the Caribbean as well as Melanesia, Micronesia and Polynesia. Countries or areas in the more developed regions are designated as “developed countries”. Countries or areas in the less developed regions are designated as “developing countries”. The least developed countries, as defined by the United Nations General Assembly in its resolutions (59/209, 59/210, 60/33, 62/97, 64/L.55, 67/L.43) included 49 countries in June 2013: 34 in Africa, 9 in Asia, 5 in Oceania and one in Latin America and the Caribbean. Those 49 countries are: Afghanistan, Angola, Bangladesh, Benin, Bhutan, Burkina Faso, Burundi, Cambodia, Central African Republic, Chad, Comoros, Democratic Republic of the Congo, Djibouti, Equatorial Guinea, Eritrea, Ethiopia, Gambia, Guinea, Guinea-Bissau, Haiti, Kiribati, Lao People's Democratic Republic, Lesotho, Liberia, Madagascar, Malawi, Mali, Mauritania, Mozambique, Myanmar, Nepal, Niger, Rwanda, Samoa, Săo Tomé and Príncipe, Senegal, Sierra Leone, Solomon Islands, Somalia, South Sudan, Sudan, Timor-Leste, Togo, Tuvalu, Uganda, United Republic of Tanzania, Vanuatu, Yemen and Zambia. These countries are also included in the less developed regions. The group denominated “other less developed countries” comprises all countries in the less developed regions minus the least developed countries. The term “sub-Saharan Africa” is used to designate the countries in Africa that exclude those in Northern Africa. Countries and areas are grouped geographically into six major areas designated as: Africa; Asia; Europe; Latin America and the Caribbean; Northern America, and Oceania. These major areas are further divided into 21 geographical regions. The names and composition of geographical areas follow those presented in “Standard country or area codes for statistical use” (ST/ESA/STAT/SER.M/49/Rev.3), available at http://unstats.un.org/unsd/methods/m49/m49.htm.
viii
The following abbreviations have been used:
AIDS Acquired immunodeficiency syndrome
DESA Department of Economic and Social Affairs
HIV Human immunodeficiency virus
LDCs Least developed countries
MDGs Millennium Development Goals
SAR Special Administrative Region
TFR Total fertility rate
UNAIDS Joint United Nations Programme on HIV/AIDS
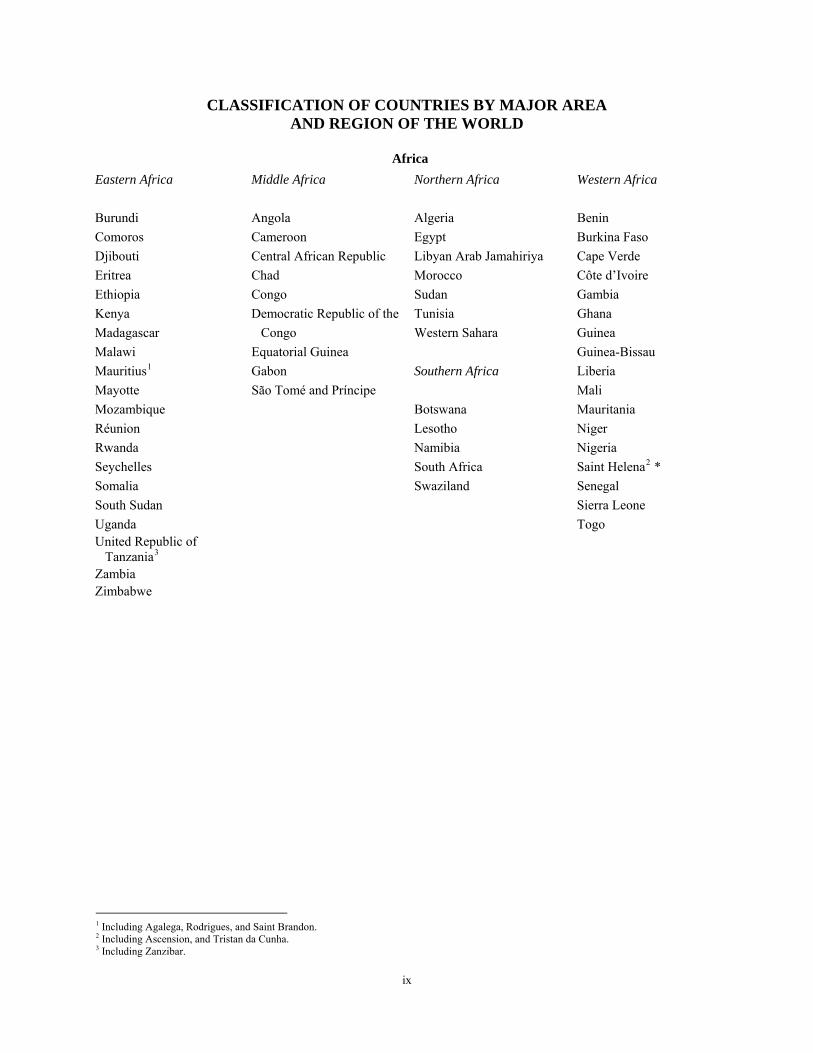
CLASSIFICATION OF COUNTRIES BY MAJOR AREA AND REGION OF THE WORLD
Africa
Eastern Africa Middle Africa Northern Africa Western Africa
Burundi Angola Algeria Benin
Comoros Cameroon Egypt Burkina Faso
Djibouti Central African Republic Libyan Arab Jamahiriya Cape Verde
Eritrea Chad Morocco Côte d’Ivoire
Ethiopia Congo Sudan Gambia
Kenya Democratic Republic of the Tunisia Ghana
Madagascar Congo Western Sahara Guinea
Malawi Equatorial Guinea Guinea-Bissau
Mauritius1 Gabon Southern Africa Liberia
Mayotte São Tomé and Príncipe Mali
Mozambique Botswana Mauritania
Réunion Lesotho Niger
Rwanda Namibia Nigeria
Seychelles South Africa Saint Helena2 *
Somalia Swaziland Senegal
South Sudan Sierra Leone
Uganda Togo United Republic of Tanzania3
Zambia Zimbabwe
1 Including Agalega, Rodrigues, and Saint Brandon. 2 Including Ascension, and Tristan da Cunha. 3 Including Zanzibar.
ix
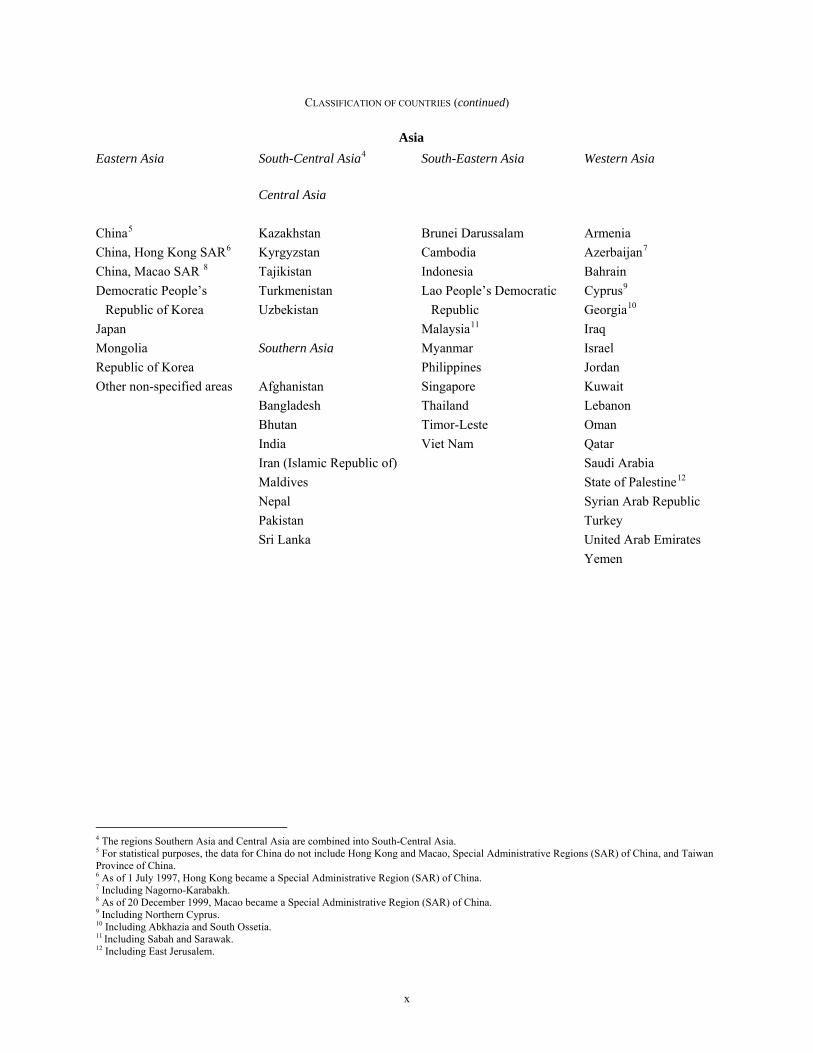
CLASSIFICATION OF COUNTRIES (continued)
Asia
Eastern Asia South-Central Asia4 South-Eastern Asia Western Asia
Central Asia
China5 Kazakhstan Brunei Darussalam Armenia
China, Hong Kong SAR6 Kyrgyzstan Cambodia Azerbaijan7
China, Macao SAR 8 Tajikistan Indonesia Bahrain
Democratic People’s Turkmenistan Lao People’s Democratic Cyprus9
Republic of Korea Uzbekistan Republic Georgia10
Japan Malaysia11 Iraq
Mongolia Southern Asia Myanmar Israel
Republic of Korea Philippines Jordan
Other non-specified areas Afghanistan Singapore Kuwait
Bangladesh Thailand Lebanon
Bhutan Timor-Leste Oman
India Viet Nam Qatar
Iran (Islamic Republic of) Saudi Arabia
Maldives State of Palestine12
Nepal Syrian Arab Republic
Pakistan Turkey
Sri Lanka United Arab Emirates
Yemen
4 The regions Southern Asia and Central Asia are combined into South-Central Asia. 5 For statistical purposes, the data for China do not include Hong Kong and Macao, Special Administrative Regions (SAR) of China, and Taiwan Province of China. 6 As of 1 July 1997, Hong Kong became a Special Administrative Region (SAR) of China. 7 Including Nagorno-Karabakh. 8 As of 20 December 1999, Macao became a Special Administrative Region (SAR) of China. 9 Including Northern Cyprus. 10 Including Abkhazia and South Ossetia. 11 Including Sabah and Sarawak. 12 Including East Jerusalem.
x
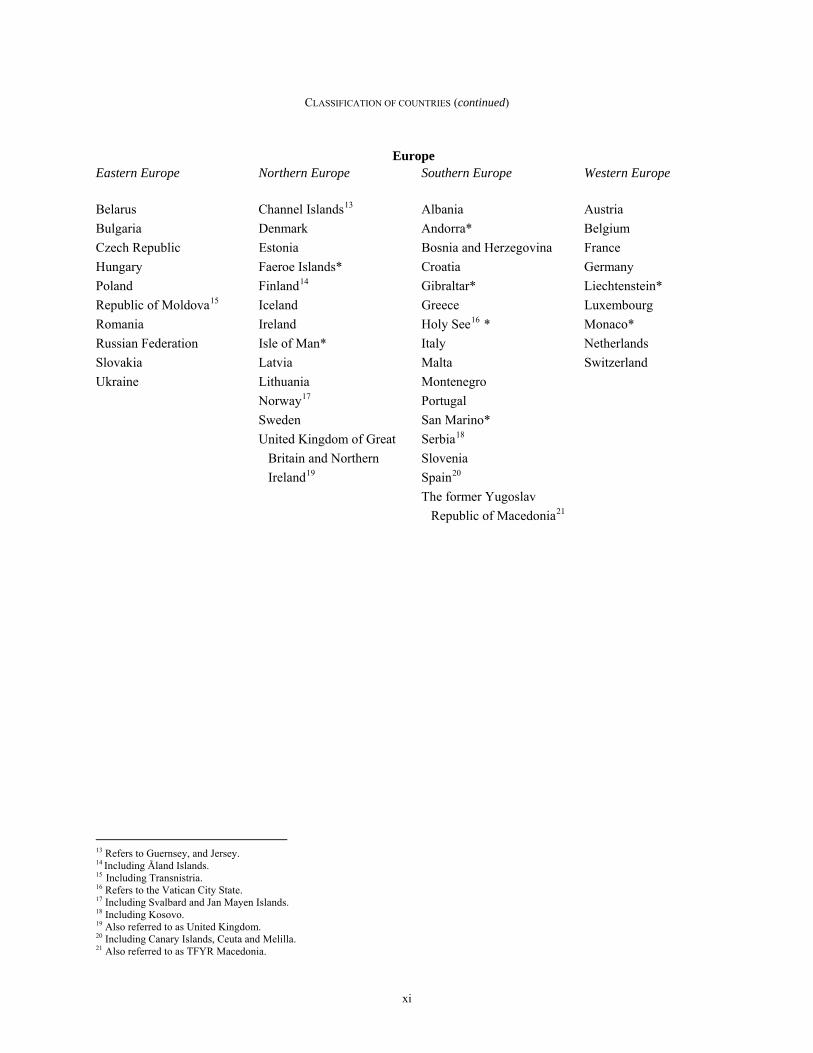
CLASSIFICATION OF COUNTRIES (continued)
Europe Eastern Europe Northern Europe Southern Europe Western Europe
Belarus Channel Islands13 Albania Austria
Bulgaria Denmark Andorra* Belgium
Czech Republic Estonia Bosnia and Herzegovina France
Hungary Faeroe Islands* Croatia Germany
Poland Finland14 Gibraltar* Liechtenstein*
Republic of Moldova15 Iceland Greece Luxembourg
Romania Ireland Holy See16 * Monaco*
Russian Federation Isle of Man* Italy Netherlands
Slovakia Latvia Malta Switzerland
Ukraine Lithuania Montenegro
Norway17 Portugal
Sweden San Marino*
United Kingdom of Great Serbia18
Britain and Northern Slovenia
Ireland19 Spain20
The former Yugoslav
Republic of Macedonia21
13 Refers to Guernsey, and Jersey. 14 Including Åland Islands. 15 Including Transnistria. 16 Refers to the Vatican City State. 17 Including Svalbard and Jan Mayen Islands. 18 Including Kosovo. 19 Also referred to as United Kingdom. 20 Including Canary Islands, Ceuta and Melilla. 21 Also referred to as TFYR Macedonia.
xi
xii
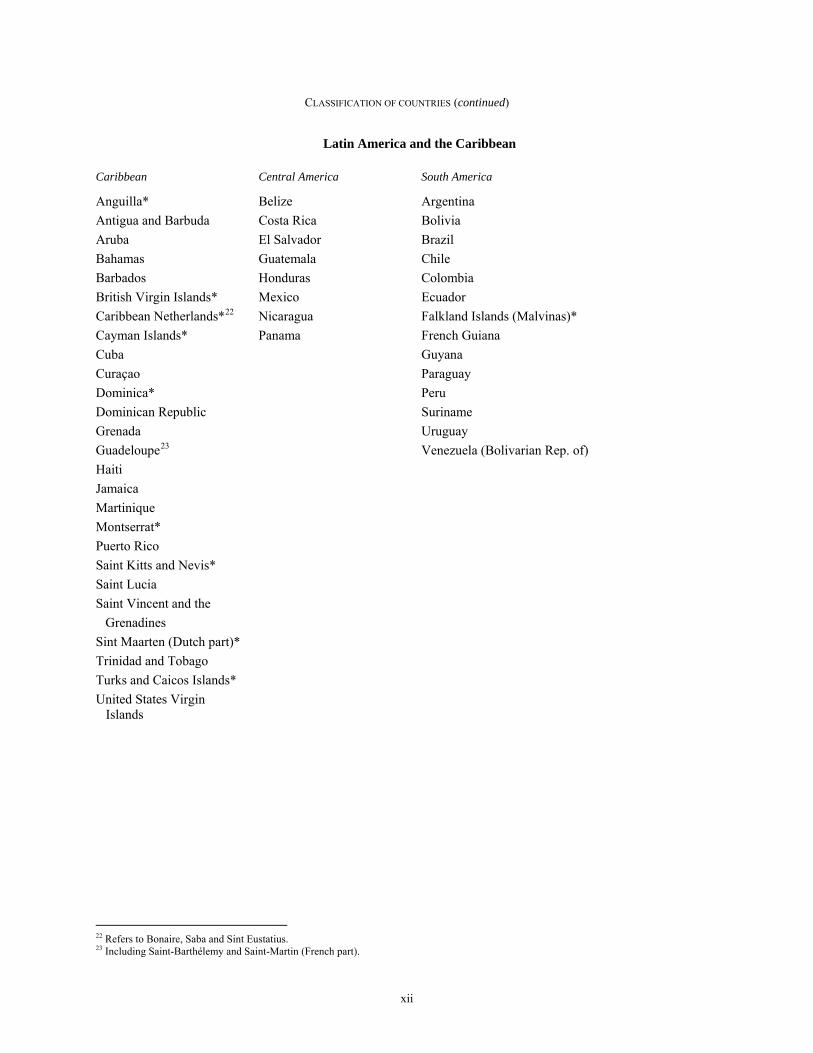
CLASSIFICATION OF COUNTRIES (continued)
Latin America and the Caribbean
Caribbean Central America South America
Anguilla* Belize Argentina
Antigua and Barbuda Costa Rica Bolivia
Aruba El Salvador Brazil
Bahamas Guatemala Chile
Barbados Honduras Colombia
British Virgin Islands* Mexico Ecuador
Caribbean Netherlands*22 Nicaragua Falkland Islands (Malvinas)*
Cayman Islands* Panama French Guiana
Cuba Guyana
Curaçao Paraguay
Dominica* Peru
Dominican Republic Suriname
Grenada Uruguay
Guadeloupe23 Venezuela (Bolivarian Rep. of)
Haiti
Jamaica
Martinique
Montserrat*
Puerto Rico
Saint Kitts and Nevis*
Saint Lucia
Saint Vincent and the
Grenadines
Sint Maarten (Dutch part)*
Trinidad and Tobago
Turks and Caicos Islands*
United States Virgin Islands
22 Refers to Bonaire, Saba and Sint Eustatius. 23 Including Saint-Barthélemy and Saint-Martin (French part).
CLASSIFICATION OF COUNTRIES (continued)
Northern America
Bermuda*
Canada
Greenland*
Saint Pierre and Miquelon*
United States of America
Oceania
Australia/New Zealand Melanesia Micronesia Polynesia24
Australia25 Fiji Guam American Samoa*
New Zealand New Caledonia Kiribati Cook Islands*
Papua New Guinea Marshall Islands* French Polynesia
Solomon Islands Micronesia Niue*
Vanuatu (Federated States of) Samoa
Nauru* Tokelau*
Northern Mariana Islands* Tonga
Palau* Tuvalu*
Wallis and Futuna Islands*
Sub-Saharan Africa
Angola Côte d'Ivoire Guinea-Bissau Namibia South Africa
Benin Democratic Republic Kenya Niger South Sudan Botswana of the Congo Lesotho Nigeria Swaziland
Burkina Faso Djibouti Liberia Réunion Togo
Burundi Equatorial Guinea Madagascar Rwanda Uganda
Cameroon Eritrea Malawi Saint Helena United Republic
Cape Verde Ethiopia Mali São Tomé and Príncipe of Tanzania
Central African Republic Gabon Mauritania Senegal Zambia
Chad Gambia Mauritius Seychelles Zimbabwe
Comoros Ghana Mayotte Sierra Leone
Congo Guinea Mozambique Somalia
NOTE: Countries with a population of less than 90,000 in 2013 are indicated by an asterisk (*).
24 Including Pitcairn. 25 Including Christmas Island, Cocos (Keeling) Islands, and Norfolk Island.
xiii

EXECUTIVE SUMMARY The 2012 Revision is the twenty-third round of official United Nations population estimates and projections, prepared by the Population Division of the Department of Economic and Social Affairs of the United Nations Secretariat. The 2012 Revision builds on the previous revision by incorporating the results of the 2010 round of national population censuses as well as findings from recent specialized demographic surveys that have been carried out around the world. These sources provide both demographic and other information to assess the progress made in achieving the internationally agreed development goals, including the Millennium Development Goals (MDGs). The comprehensive review of past worldwide demographic trends and future prospects presented in the 2012 Revision provides the population basis for the assessment of those goals.
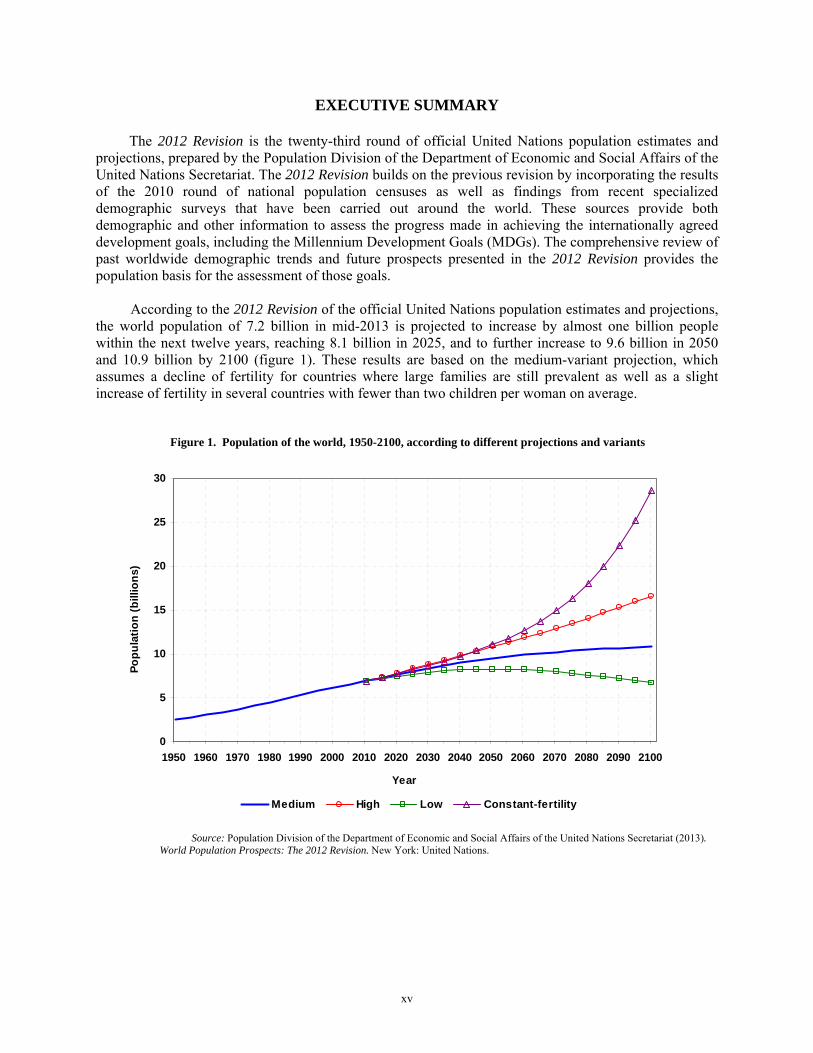
According to the 2012 Revision of the official United Nations population estimates and projections, the world population of 7.2 billion in mid-2013 is projected to increase by almost one billion people within the next twelve years, reaching 8.1 billion in 2025, and to further increase to 9.6 billion in 2050 and 10.9 billion by 2100 (figure 1). These results are based on the medium-variant projection, which assumes a decline of fertility for countries where large families are still prevalent as well as a slight increase of fertility in several countries with fewer than two children per woman on average.
Figure 1. Population of the world, 1950-2100, according to different projections and variants
0
5
10
15
20
25
30
1950 1960 1970 1980 1990 2000 2010 2020 2030 2040 2050 2060 2070 2080 2090 2100
Year
Po
pu
lati
on
(b
illio
ns)
Medium High Low Constant-fertility
Source: Population Division of the Department of Economic and Social Affairs of the United Nations Secretariat (2013). World Population Prospects: The 2012 Revision. New York: United Nations.
xv
Small differences in the trajectory of fertility during the next decades will have major consequences for population size, structure, and distribution in the long run. The “high-variant” projection depicted in the figure above, for example, which assumes an extra half of a child per woman (on average) compared to the medium variant, implies a world population of 10.9 billion in 2050 and 16.6 billion in 2100. The “low-variant” projection, where women have half a child less, on average, than under the medium variant, would produce a population of 8.3 billion in 2050. Thus, a constant difference of only half a child above or below the medium variant would result in a global population in 2050 of around 1.3 billion more or less compared to the medium variant of 9.6 billion. Compared with the results from the previous revision, the projected global population total in this revision is higher, particularly after 2075, for several reasons. First, fertility levels have been adjusted upward in a number of countries on the basis of recently available information. In the new revision, the estimated total fertility rate (TFR) for 2005-2010 has increased in several countries, including by more than 5 per cent in 15 high-fertility countries from sub-Saharan Africa. In some cases, the actual level of fertility appears to have risen in recent years; in other cases, the previous estimate was too low. The cumulative effects of these higher estimates of current fertility levels will play out over several decades and are responsible for significant upward adjustments in the projected population size of certain countries between the two revisions. Second, slight modifications in the projected fertility trajectories of some very populous countries have yielded important differences in long-run forecasts. Third, future levels of life expectancy at birth are slightly higher in several countries within this latest projection; longer survival, like higher fertility, generates larger populations. Lastly, a small portion of the difference between revisions is attributable to changes in the projection methodology used for this revision. Almost all of the additional 3.7 billion people from now to 2100 will enlarge the population of developing countries, which is projected to rise from 5.9 billion in 2013 to 8.2 billion in 2050 and to 9.6 billion in 2100, and will mainly be distributed among the population aged 15-59 (1.6 billion) and 60 or over (1.99 billion), as the number of children under age 15 in developing countries will hardly increase. Growth is expected to be particularly dramatic in the least developed countries of the world, which are projected to double in size from 898 million inhabitants in 2013 to 1.8 billion in 2050 and to 2.9 billion in 2100. In contrast, the population of the more developed regions is expected to change minimally, passing from 1.25 billion in 2013 to 1.28 billion in 2100, and would decline were it not for the net increase due to migration from developing to developed countries, which is projected to average about 2.4 million persons annually from 2013 to 2050 and 1 million from 2050 to 2100. At the country level, much of the overall increase between 2013 and 2050 is projected to take place in high-fertility countries, mainly in Africa, as well as countries with large populations such as India, Indonesia, Pakistan, the Philippines and the United States of America. The results of the 2012 Revision incorporate the findings of the most recent national population censuses, including from the 2010 round of censuses, and of numerous specialized population surveys carried out around the world. The 2012 Revision provides the demographic data and indicators to assess trends at the global, regional and national levels and to calculate many other key indicators commonly used by the United Nations system.
xvi
Population in developing countries still young Currently the population of the less developed regions is still young, with children under age 15 accounting for 28 per cent of the population and young persons aged 15 to 24 accounting for a further 18 per cent. In fact, the numbers of children and young people in the less developed regions are at an all time high (1.7 billion children and 1.1 billion young people), posing a major challenge for their countries, which are faced with the necessity of providing education and employment to large cohorts of children and youth. The situation in the least developed countries is even more pressing, as children under age 15 constitute 40 per cent of their population and young people account for a further 20 per cent. In the more developed regions, children and youth account for 16 per cent and 12 per cent of the population, respectively. Whereas the number of children is expected to change little in the future, fluctuating from 206 million in 2013 to around 210 million in 2050 and then to 202 in 2100, the number of young people is projected to decrease from 152 million currently to 142 million in 2050 and then to 138 million in 2100. In both the more and the less developed regions, the number of people in the main working ages, from 25 to 59 years, is at an all time high: 608 million and 2.6 billion, respectively. Yet, whereas in the more developed regions that number is expected to peak in 2013 and decline thereafter, reaching 533 millions in 2050 and 504 million in 2100, in the less developed regions it will continue rising, reaching 3.7 billion in 2050 and 4.1 billion in 2100. In developing countries, this population is projected to increase by over 400 million within the next decade. These population trends point to the urgency of supporting employment creation in developing countries as part of any strategy to address the slow economic recovery that the world is experiencing. Globally, population aged 60 or over is the fastest growing In the more developed regions, the population aged 60 or over is increasing at 1.0 per cent annually before 2050 and 0.11 per cent annually from 2050 to 2100; it is expected to increase by 45 per cent by the middle of the century, rising from 287 million in 2013 to 417 million in 2050 and to 440 million in 2100. In the less developed regions, the population aged 60 or over is currently increasing at the fastest pace ever, 3.7 per cent annually in the period 2010-2015 and is projected to increase by 2.9 per cent annually before 2050 and 0.9 per cent annually from 2050 to 2100; its numbers are expected to rise from 554 million in 2013 to 1.6 billion in 2050 and to 2.5 billion in 2100. Projected trends are contingent on fertility declines in developing countries Population ageing results mainly from declining fertility. According to the 2012 Revision, fertility in the less developed regions as a whole is expected to drop from 2.69 children per woman in 2005-2010 to 2.29 in 2045-2050 and to 1.99 in 2095-2100. The reduction projected for the group of 49 least developed countries is even steeper: from 4.53 children per woman to 2.87 children per woman in 2045-2050 and to 2.11 in 2095-2100. To achieve such reductions, it is essential that access to family planning should expand, particularly in the least developed countries. In 2013, the use of modern contraceptive methods in the least developed countries is estimated at around 38 per cent among women of reproductive age who are married or in union, and a further 23 per cent of such women have an unmet need for family planning. The urgency of realizing the projected reductions of fertility is brought into focus by considering that, if fertility were to remain constant at the levels estimated for 2005-2010, the population of the less developed regions would increase to 9.8 billion in 2050 and to 27.5 billion in 2100 instead of the 8.2 billion and 9.6 billion projected by assuming that fertility declines. That is, without further reductions of fertility, the world population by 2100 could increase by nearly six times as much as currently expected.
xvii
Key Findings 1. In July 2013, the world population will reach 7.2 billion, 648 million more than in 2005 or an
average gain of 81 million persons annually. Even assuming that fertility levels will continue to decline, the world population is still expected to reach 9.6 billion in 2050 and 10.9 billion in 2100, according to the medium-variant projection.
2. Future population growth is highly dependent on the path that future fertility will take. In the
medium variant, global fertility declines from 2.53 children per woman in 2005-2010 to 2.24 children per woman in 2045-2050 and 1.99 children per woman in 2095-2100. If fertility were to remain, on average, half a child above the levels projected in the medium variant, world population would reach 10.9 billion by 2050 and 16.6 billion by 2100. A fertility path half a child below the medium variant would lead to a population of 8.3 billion by mid-century and 6.8 billion by the end of the century. Consequently, population growth until 2050 is almost inevitable even if the decline of fertility accelerates.
3. In the more developed regions, fertility has increased slightly in recent years, with an estimated
level of 1.66 children per woman in 2005-2010. As a result of slightly higher projected fertility and a sustained net in-migration averaging 2.4 million annually from 2013 to 2050, the population of the more developed regions is still expected to increase slightly from 1.25 billion in 2013 to 1.3 billion in 2050 and then to fall back to about 1.28 billion by 2100.
4. The 49 least developed countries (LDCs) as a whole still have the fastest growing population in the
world, at 2.3 per cent per year. Although this rate of increase is expected to slow significantly over the next decades, the population of the LDCs is projected to double by mid-century, from 898 million in 2013 to 1.8 billion in 2050, further increasing to 2.9 billion in 2100. Growth in the rest of the developing world is also projected to be robust, though less rapid, with its population rising from 5.0 billion in 2013 to 6.4 billion 2050 and then to 6.6 billion in 2100 according to the medium variant.
5. Slow population growth brought about by reductions in fertility leads to population ageing; that is, it
produces populations where the proportion of older persons increases while that of younger persons decreases. In the more developed regions, 23 per cent of the population is already aged 60 years or over and that proportion is projected to reach 32 per cent in 2050 and 34 per cent in 2100. In developed countries as a whole, the number of older persons has already surpassed the number of children (persons under age 15), and by 2050 the number of older persons in developed countries will be nearly twice the number of children; by 2100, that ratio will be closer to 2.2.
6. Population ageing is less advanced in developing countries. Nevertheless, the populations of a
majority of them are poised to enter a period of rapid population ageing. In developing countries as a whole, 9 per cent of the population today is aged 60 years or over, but that proportion will more than double by 2050, reaching 19 per cent that year, and triple by 2100, reaching 27 per cent.
7. Globally, the number of persons aged 60 or over is expected to more than triple by 2100, increasing
from 841 million in 2013 to 2 billion in 2050 and close to 3 billion in 2100. Furthermore, already 66 per cent of the world’s older persons live in the less developed regions and by 2050, 79 per cent will do so. By 2100, this figure will reach 85 per cent.
8. In ageing populations, the number of persons grows faster and faster the higher the age range considered. Thus, whereas the number of persons aged 60 or over is expected to more than triple by 2100, that of persons aged 80 or over is projected to increase almost seven-fold by 2100, increasing
xviii
from 120 million in 2013 to 392 million in 2050, and 830 million in 2100. Today, just over half of all persons aged 80 and over live in developing countries, but that share is expected to reach 68 per cent in 2050.
9. Although the population of all countries is expected to age over the foreseeable future, the
population will remain relatively young in countries where fertility is still high. 10. High population growth rates prevail in many developing countries, most of which are on the UN’s
list of 49 least developed countries (LDCs). Between 2013 and 2100, the populations of 35 countries, most of them LDCs, could triple or more. Among them, the populations of Burundi, Malawi, Mali, Niger, Nigeria, Somalia, Uganda, United Republic of Tanzania and Zambia are projected to increase at least five-fold by 2100.
11. In sharp contrast, the populations of 43 countries or areas are expected to decrease between 2013
and 2050; of these, 40 are expected to continue to decrease between 2050 and 2100. Several countries are expected to see their populations decline by more than 15 per cent by 2050, including Belarus, Bulgaria, Croatia, Cuba, Georgia, Latvia, Lithuania, Republic of Moldova, Romania, the Russian Federation, Serbia, and Ukraine.
12. Half of all population growth is concentrated in a small number of countries. During 2013-2100,
eight countries are expected to account for over half of the world’s projected population increase: Nigeria, India, the United Republic of Tanzania, the Democratic Republic of Congo, Niger, Uganda, Ethiopia and the United States of America, listed according to the size of their contribution to global population growth.
13. Fertility has continued to fall in the vast majority of countries in the less developed regions. Among
countries with at least 90,000 inhabitants in 2013, the number of developing countries with high fertility (5 children or more per woman) declined from 58 in 1990-1995 to 31 in 2005-2010, and their share of the world population dropped from 13 per cent to 9 per cent. Over the same period, the number of developing countries with fertility levels below replacement increased from 14 to 32.
14. Most developed countries have had below-replacement fertility (below 2.1 children per woman) for
two or three decades. Among the 45 developed countries with at least 90,000 inhabitants in 2013, 41 and 43 had below-replacement fertility in 1990-1995 and 2005-2010, respectively. However, between the 2000-2005 and 2005-2010, 36 developed countries experienced slight increases in fertility. For the more developed regions as a whole, total fertility increased from 1.58 to 1.66 children per woman between those two periods. Yet, in 2005-2010, 26 developed countries, including Japan and most of the countries in Southern and Eastern Europe, still had fertility levels below 1.5 children per woman.
15. In 2005-2010, the 75 countries with below-replacement fertility accounted for 48 per cent of the
world’s population. The most populous countries with below replacement fertility are China, the United States of America, Brazil, the Russian Federation, Japan, Viet Nam, Germany, the Islamic Republic of Iran and Thailand, in order of population size.
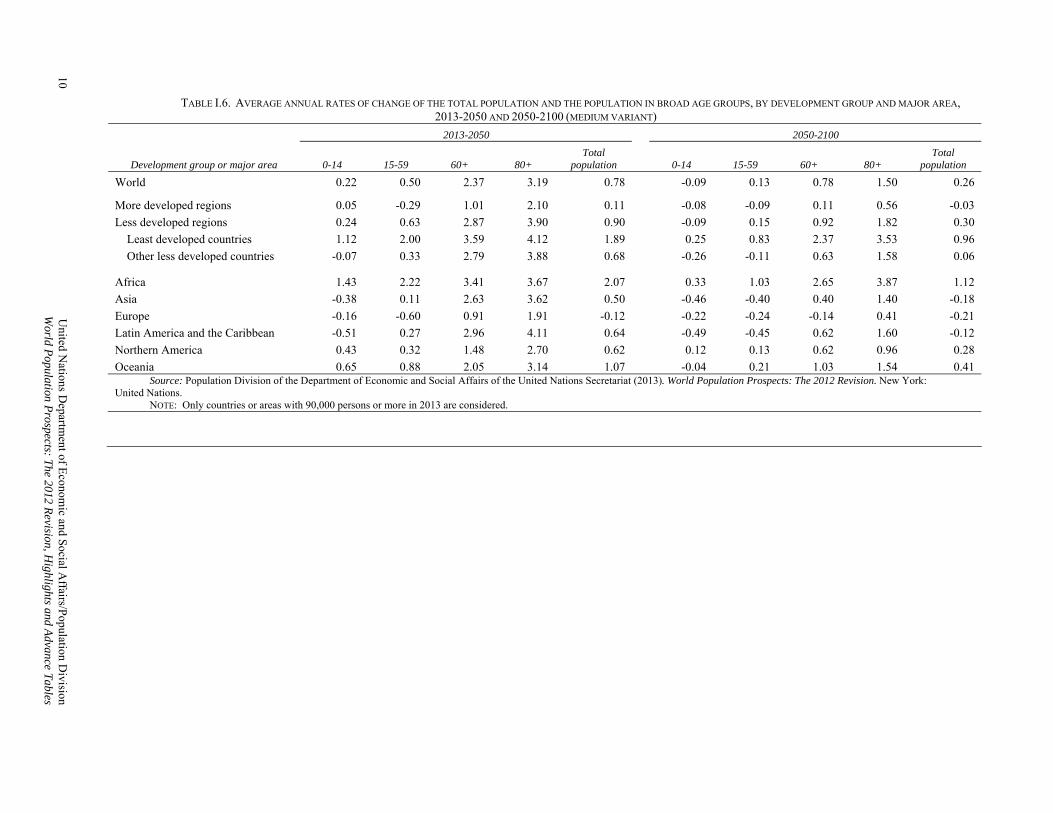
16. Globally, total fertility is expected to fall from 2.53 children per woman in 2005-2010 to 2.24 in
2045-2050 and to 1.99 in 2095-2100 according to the medium variant. However, in the more developed regions, total fertility is projected to increase from 1.66 children per woman currently to 1.85 in 2045-2050 and 1.93 in 2095-2100. A major reduction of fertility is projected for the group of least developed countries (from 4.53 to 2.87 children per woman in 2045-2050 and to 2.11 in 2095-2100) and the fertility of the rest of the developing world is expected to drop from 2.40
xix
children per woman currently to 2.09 in 2045-2050 and 1.93 in 2095-2100, thus converging to the fertility levels expected for the more developed countries by the end of the century.
17. The median age, that is, the age that divides the population in two halves of equal size, is an
indicator of population ageing. Globally, the median age is projected to increase from 29 to 36 years between 2013 and 2050 and to 41 years in 2100. The median age is higher in countries or regions that have been experiencing low fertility for a long time. Europe today has the oldest population, with a median age of 41 years in 2013, which is expected to reach 46 years in 2050 and then 47 years in 2100.
18. Countries where fertility remains high and has declined only moderately will experience the slowest
population ageing. The median age for the least developed countries as a whole is below 20 years in 2013. It is projected to reach 26 years in 2050 and 36 years in 2100.
19. Increasing longevity also contributes to population ageing. Globally, life expectancy at birth is
projected to rise from 69 years in 2005-2010 to 76 years in 2045-2050 and to 82 years in 2095-2100. In the more developed regions, the projected increase is from 77 years in 2005-2010 to 83 years in 2045-2050 and to 89 years in 2095-2100, while in the less developed regions the increase is expected to be from 67 years in 2005-2010 to 75 years by mid-century and 81 years by the end of the century.
20. Life expectancy remains low in the least developed countries, at just 58 years in 2005-2010.
Although it is projected to reach 70 years in 2045-2050 and 78 years in 2095-2100, realizing such an increase is contingent on reducing the spread of HIV and combating successfully other infectious diseases as well as non-communicable diseases. Similar challenges must be confronted if the projected increase of life expectancy in the rest of the developing countries, from under 69 years today to 76 years by mid-century and to 82 year by the end of the century, is to be achieved.
21. The under-five mortality, expressed as the probability of dying between birth and the exact age of
five, is an important indicator of development and the well-being of children. In 1950-1955, 21 per cent of all children born worldwide did not reach their fifth birthday. By 2005-2010, this rate had fallen to 59 deaths per 1,000 births. However, this rate in least developed regions still remains at a relatively high level, around 112 deaths per 1,000 births in 2005-2010, falling from 172 deaths per 1,000 births in 1990-95.
22. Among the more developed regions, Eastern Europe has the lowest life expectancy and has
experienced reductions in life expectancy at birth since the late 1980s. In 2005-2010 life expectancy in the region increased somewhat but at 69.5 years it was almost the same as it had been in 1970-1975 (69.2 years). Despite having recorded some recovery since the late 1990s, Belarus, the Republic of Moldova, the Russian Federation and Ukraine have currently the lowest life expectancies among developed countries (below 70 years).
23. Although the HIV/AIDS epidemic continues to be a major global health concern, adult HIV
prevalence reached a peak over the past decade in most countries that are highly affected by the epidemic; a growing number of them are reaching and maintaining lower prevalence levels. Nevertheless, in countries where prevalence has been high, the impact of the epidemic in terms of morbidity, mortality and slower population growth continues to be evident. Thus, in Southern Africa, the region with the highest prevalence of the disease, life expectancy has fallen from 62 years in 1990-1995 to 52 years in 2005-2010 and is only recently beginning to increase. Nevertheless, life expectancy in the region is not expected to recover to the level where it was in the early 1990s until the year 2030.
xx
xxi
24. Given the low fertility prevailing in developed countries, deaths are expected to exceed births for
the foreseeable future. Consequently, the population of the more developed regions will decrease if the excess of deaths over births is not counterbalanced by a net migration gain. During 2010-2050, the net number of international migrants to more developed regions is projected to be about 96 million, whereas the excess of deaths over births is projected to be 33 million, implying an overall growth of about 63 million.
25. In terms of annual averages, the major net receivers of international migrants during 2010-2050 are
projected to be the United States of America (1,000,000 annually), Canada (205,000), the United Kingdom (172,500), Australia (150,000), Italy (131,250), the Russian Federation (127,500), France (106,250) and Spain (102,500). The major countries of net emigration are projected to be Bangladesh (-331,000 annually), China (-300,000), India (-284,000), Mexico (-210,000), Pakistan (-170,000), Indonesia (-140,000) and the Philippines (-92,500). Economic and demographic asymmetries across countries that may persist are likely to remain powerful generators of international migration within the medium-term future.

I. WORLD POPULATION TRENDS
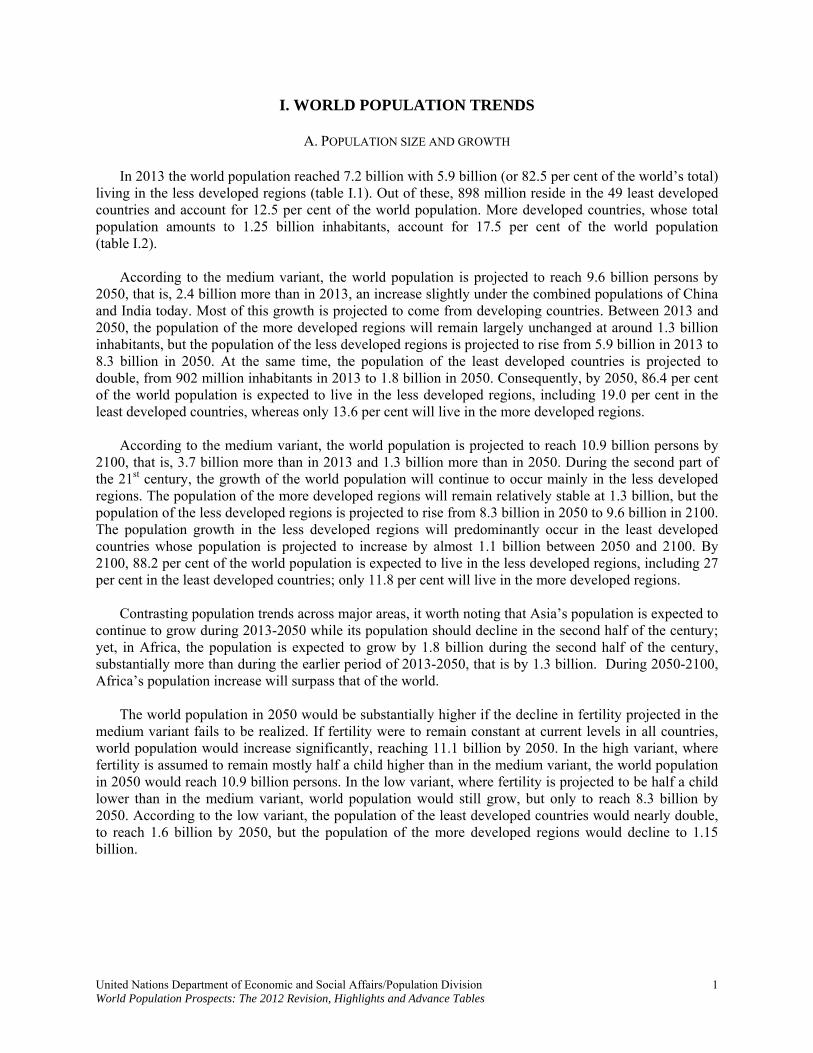
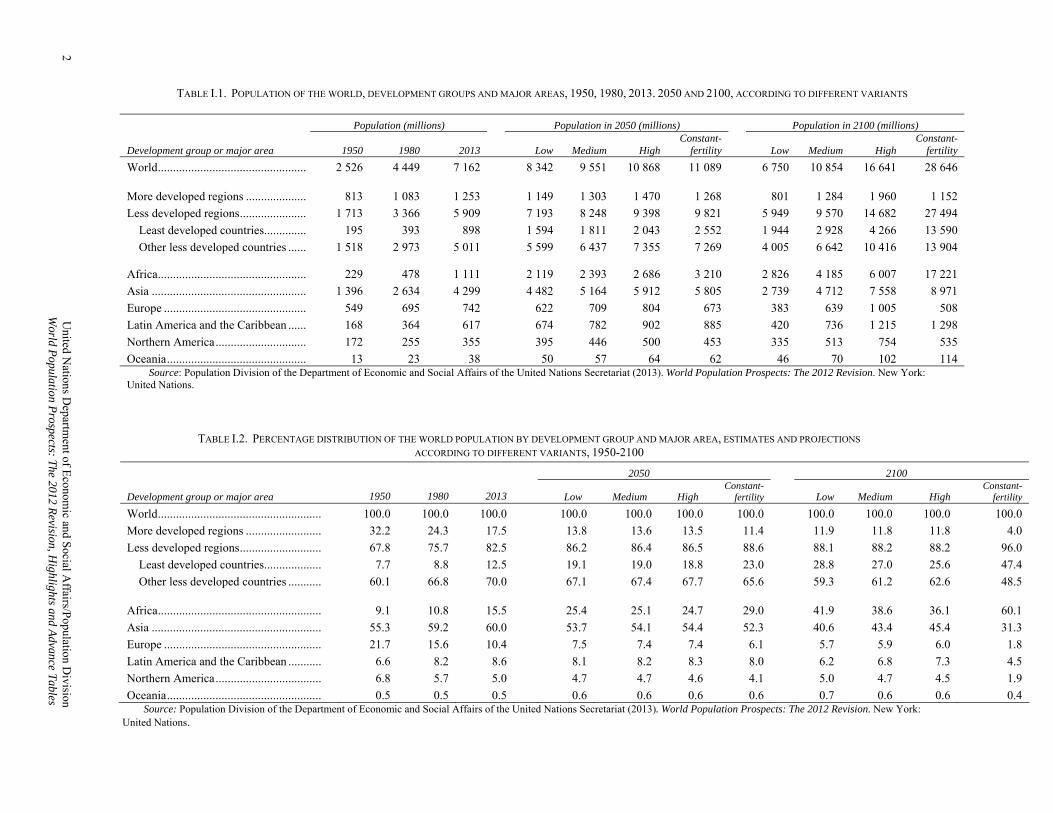
A. POPULATION SIZE AND GROWTH In 2013 the world population reached 7.2 billion with 5.9 billion (or 82.5 per cent of the world’s total) living in the less developed regions (table I.1). Out of these, 898 million reside in the 49 least developed countries and account for 12.5 per cent of the world population. More developed countries, whose total population amounts to 1.25 billion inhabitants, account for 17.5 per cent of the world population (table I.2).
According to the medium variant, the world population is projected to reach 9.6 billion persons by 2050, that is, 2.4 billion more than in 2013, an increase slightly under the combined populations of China and India today. Most of this growth is projected to come from developing countries. Between 2013 and 2050, the population of the more developed regions will remain largely unchanged at around 1.3 billion inhabitants, but the population of the less developed regions is projected to rise from 5.9 billion in 2013 to 8.3 billion in 2050. At the same time, the population of the least developed countries is projected to double, from 902 million inhabitants in 2013 to 1.8 billion in 2050. Consequently, by 2050, 86.4 per cent of the world population is expected to live in the less developed regions, including 19.0 per cent in the least developed countries, whereas only 13.6 per cent will live in the more developed regions. According to the medium variant, the world population is projected to reach 10.9 billion persons by 2100, that is, 3.7 billion more than in 2013 and 1.3 billion more than in 2050. During the second part of the 21st century, the growth of the world population will continue to occur mainly in the less developed regions. The population of the more developed regions will remain relatively stable at 1.3 billion, but the population of the less developed regions is projected to rise from 8.3 billion in 2050 to 9.6 billion in 2100. The population growth in the less developed regions will predominantly occur in the least developed countries whose population is projected to increase by almost 1.1 billion between 2050 and 2100. By 2100, 88.2 per cent of the world population is expected to live in the less developed regions, including 27 per cent in the least developed countries; only 11.8 per cent will live in the more developed regions. Contrasting population trends across major areas, it worth noting that Asia’s population is expected to continue to grow during 2013-2050 while its population should decline in the second half of the century; yet, in Africa, the population is expected to grow by 1.8 billion during the second half of the century, substantially more than during the earlier period of 2013-2050, that is by 1.3 billion. During 2050-2100, Africa’s population increase will surpass that of the world. The world population in 2050 would be substantially higher if the decline in fertility projected in the medium variant fails to be realized. If fertility were to remain constant at current levels in all countries, world population would increase significantly, reaching 11.1 billion by 2050. In the high variant, where fertility is assumed to remain mostly half a child higher than in the medium variant, the world population in 2050 would reach 10.9 billion persons. In the low variant, where fertility is projected to be half a child lower than in the medium variant, world population would still grow, but only to reach 8.3 billion by 2050. According to the low variant, the population of the least developed countries would nearly double, to reach 1.6 billion by 2050, but the population of the more developed regions would decline to 1.15 billion.
United Nations Department of Economic and Social Affairs/Population Division 1 World Population Prospects: The 2012 Revision, Highlights and Advance Tables
2 United N
ations Departm
ent of Econom
ic and Social A
ffairs/Population D
ivision W
orld Population P
rospects: The 2012 R
evision, Highlights and A
dvance Tables
TABLE I.1. POPULATION OF THE WORLD, DEVELOPMENT GROUPS AND MAJOR AREAS, 1950, 1980, 2013. 2050 AND 2100, ACCORDING TO DIFFERENT VARIANTS
Population (millions) Population in 2050 (millions) Population in 2100 (millions)
Development group or major area 1950 1980 2013 Low Medium High Constant-
fertility Low Medium High Constant-
fertility
World................................................. 2 526 4 449 7 162 8 342 9 551 10 868 11 089 6 750 10 854 16 641 28 646
More developed regions .................... 813 1 083 1 253 1 149 1 303 1 470 1 268 801 1 284 1 960 1 152
Less developed regions...................... 1 713 3 366 5 909 7 193 8 248 9 398 9 821 5 949 9 570 14 682 27 494
Least developed countries.............. 195 393 898 1 594 1 811 2 043 2 552 1 944 2 928 4 266 13 590
Other less developed countries ...... 1 518 2 973 5 011 5 599 6 437 7 355 7 269 4 005 6 642 10 416 13 904
Africa................................................. 229 478 1 111 2 119 2 393 2 686 3 210 2 826 4 185 6 007 17 221
Asia ................................................... 1 396 2 634 4 299 4 482 5 164 5 912 5 805 2 739 4 712 7 558 8 971
Europe ............................................... 549 695 742 622 709 804 673 383 639 1 005 508
Latin America and the Caribbean ...... 168 364 617 674 782 902 885 420 736 1 215 1 298
Northern America.............................. 172 255 355 395 446 500 453 335 513 754 535
Oceania.............................................. 13 23 38 50 57 64 62 46 70 102 114 Source: Population Division of the Department of Economic and Social Affairs of the United Nations Secretariat (2013). World Population Prospects: The 2012 Revision. New York: United Nations.
TABLE I.2. PERCENTAGE DISTRIBUTION OF THE WORLD POPULATION BY DEVELOPMENT GROUP AND MAJOR AREA, ESTIMATES AND PROJECTIONS ACCORDING TO DIFFERENT VARIANTS, 1950-2100
2050 2100
Development group or major area 1950 1980 2013 Low Medium High Constant-
fertility Low Medium High Constant-
fertility
World...................................................... 100.0 100.0 100.0 100.0 100.0 100.0 100.0 100.0 100.0 100.0 100.0
More developed regions ......................... 32.2 24.3 17.5 13.8 13.6 13.5 11.4 11.9 11.8 11.8 4.0
Less developed regions........................... 67.8 75.7 82.5 86.2 86.4 86.5 88.6 88.1 88.2 88.2 96.0
Least developed countries................... 7.7 8.8 12.5 19.1 19.0 18.8 23.0 28.8 27.0 25.6 47.4
Other less developed countries ........... 60.1 66.8 70.0 67.1 67.4 67.7 65.6 59.3 61.2 62.6 48.5
Africa...................................................... 9.1 10.8 15.5 25.4 25.1 24.7 29.0 41.9 38.6 36.1 60.1
Asia ........................................................ 55.3 59.2 60.0 53.7 54.1 54.4 52.3 40.6 43.4 45.4 31.3
Europe .................................................... 21.7 15.6 10.4 7.5 7.4 7.4 6.1 5.7 5.9 6.0 1.8
Latin America and the Caribbean ........... 6.6 8.2 8.6 8.1 8.2 8.3 8.0 6.2 6.8 7.3 4.5
Northern America................................... 6.8 5.7 5.0 4.7 4.7 4.6 4.1 5.0 4.7 4.5 1.9
Oceania................................................... 0.5 0.5 0.5 0.6 0.6 0.6 0.6 0.7 0.6 0.6 0.4 Source: Population Division of the Department of Economic and Social Affairs of the United Nations Secretariat (2013). World Population Prospects: The 2012 Revision. New York: United Nations.
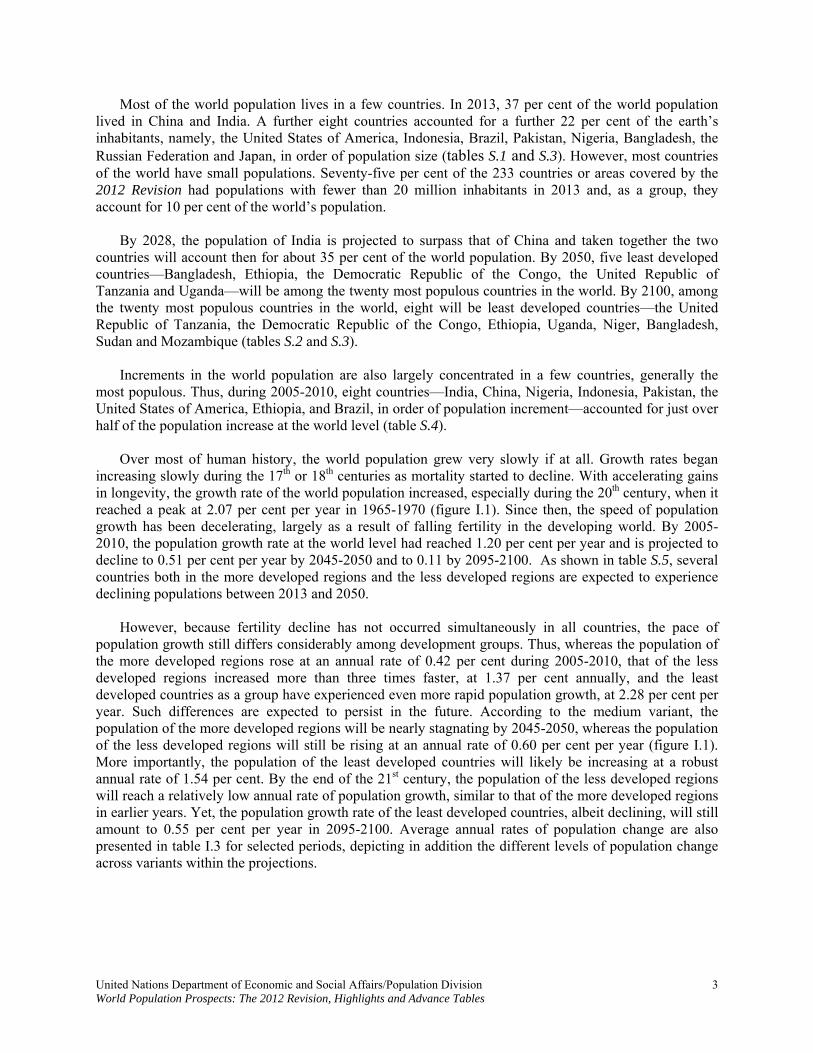
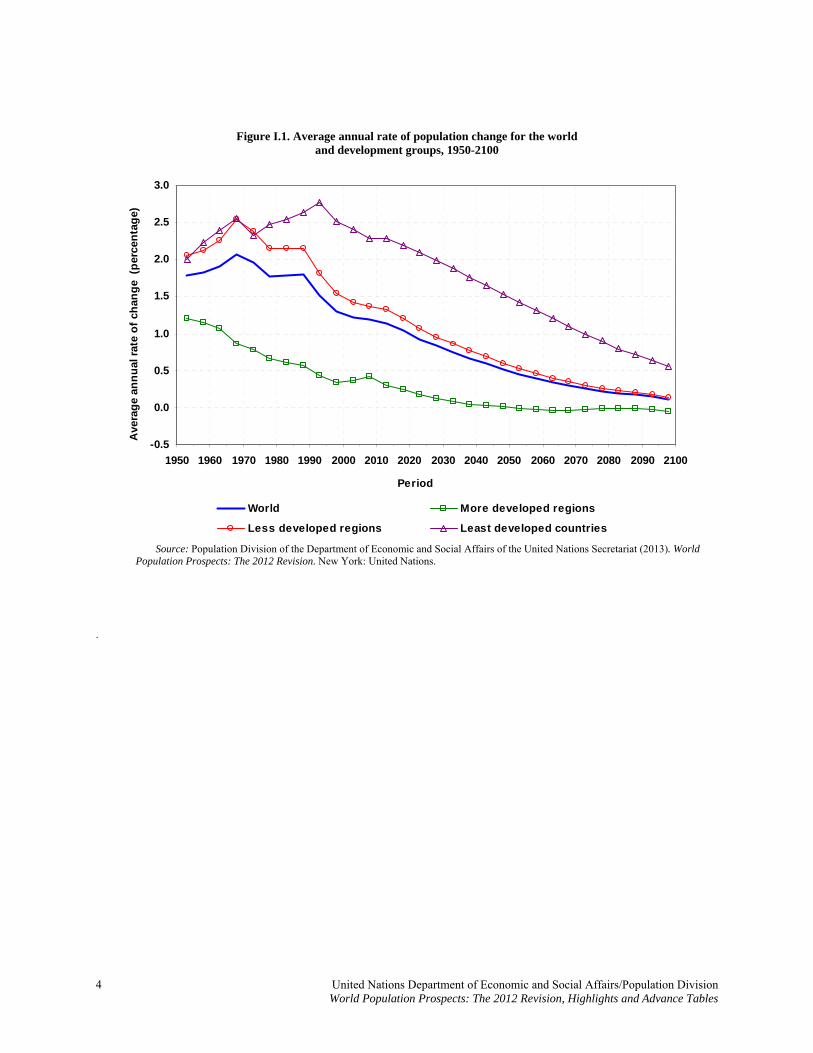
Most of the world population lives in a few countries. In 2013, 37 per cent of the world population lived in China and India. A further eight countries accounted for a further 22 per cent of the earth’s inhabitants, namely, the United States of America, Indonesia, Brazil, Pakistan, Nigeria, Bangladesh, the Russian Federation and Japan, in order of population size (tables S.1 and S.3). However, most countries of the world have small populations. Seventy-five per cent of the 233 countries or areas covered by the 2012 Revision had populations with fewer than 20 million inhabitants in 2013 and, as a group, they account for 10 per cent of the world’s population. By 2028, the population of India is projected to surpass that of China and taken together the two countries will account then for about 35 per cent of the world population. By 2050, five least developed countries—Bangladesh, Ethiopia, the Democratic Republic of the Congo, the United Republic of Tanzania and Uganda—will be among the twenty most populous countries in the world. By 2100, among the twenty most populous countries in the world, eight will be least developed countries—the United Republic of Tanzania, the Democratic Republic of the Congo, Ethiopia, Uganda, Niger, Bangladesh, Sudan and Mozambique (tables S.2 and S.3). Increments in the world population are also largely concentrated in a few countries, generally the most populous. Thus, during 2005-2010, eight countries—India, China, Nigeria, Indonesia, Pakistan, the United States of America, Ethiopia, and Brazil, in order of population increment—accounted for just over half of the population increase at the world level (table S.4). Over most of human history, the world population grew very slowly if at all. Growth rates began increasing slowly during the 17th or 18th centuries as mortality started to decline. With accelerating gains in longevity, the growth rate of the world population increased, especially during the 20th century, when it reached a peak at 2.07 per cent per year in 1965-1970 (figure I.1). Since then, the speed of population growth has been decelerating, largely as a result of falling fertility in the developing world. By 2005-2010, the population growth rate at the world level had reached 1.20 per cent per year and is projected to decline to 0.51 per cent per year by 2045-2050 and to 0.11 by 2095-2100. As shown in table S.5, several countries both in the more developed regions and the less developed regions are expected to experience declining populations between 2013 and 2050.
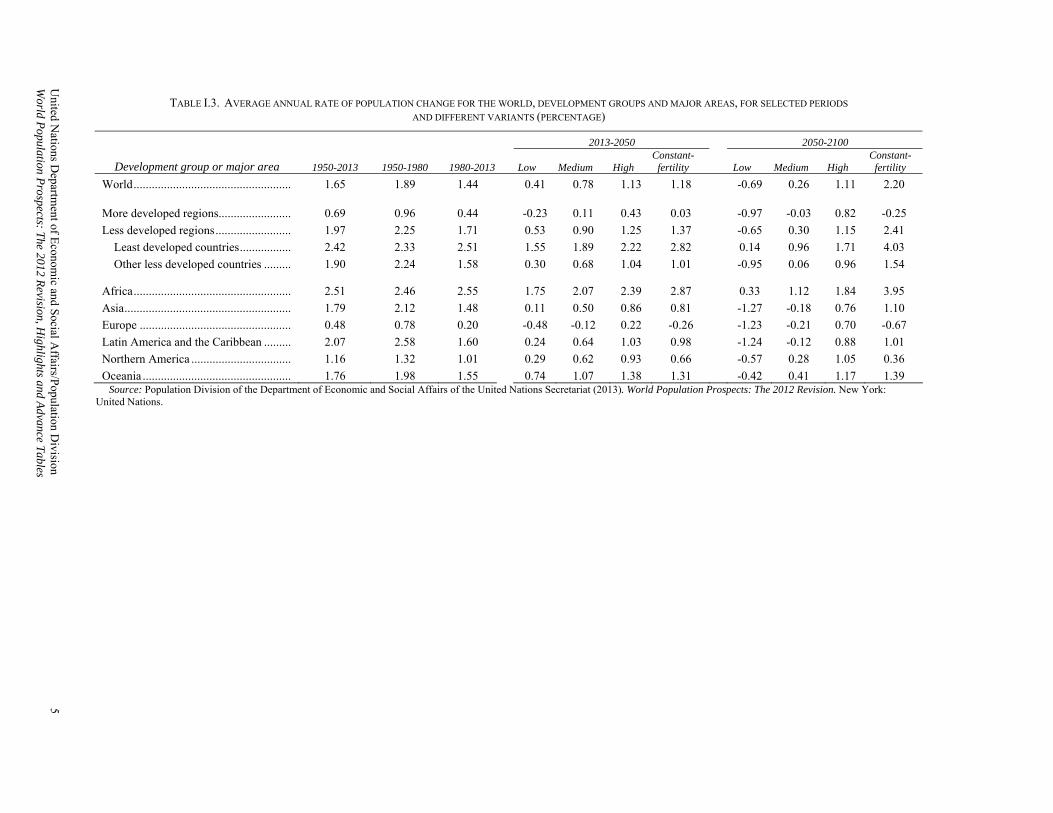
However, because fertility decline has not occurred simultaneously in all countries, the pace of population growth still differs considerably among development groups. Thus, whereas the population of the more developed regions rose at an annual rate of 0.42 per cent during 2005-2010, that of the less developed regions increased more than three times faster, at 1.37 per cent annually, and the least developed countries as a group have experienced even more rapid population growth, at 2.28 per cent per year. Such differences are expected to persist in the future. According to the medium variant, the population of the more developed regions will be nearly stagnating by 2045-2050, whereas the population of the less developed regions will still be rising at an annual rate of 0.60 per cent per year (figure I.1). More importantly, the population of the least developed countries will likely be increasing at a robust annual rate of 1.54 per cent. By the end of the 21st century, the population of the less developed regions will reach a relatively low annual rate of population growth, similar to that of the more developed regions in earlier years. Yet, the population growth rate of the least developed countries, albeit declining, will still amount to 0.55 per cent per year in 2095-2100. Average annual rates of population change are also presented in table I.3 for selected periods, depicting in addition the different levels of population change across variants within the projections.
United Nations Department of Economic and Social Affairs/Population Division 3 World Population Prospects: The 2012 Revision, Highlights and Advance Tables
4 United Nations Department of Economic and Social Affairs/Population Division World Population Prospects: The 2012 Revision, Highlights and Advance Tables
Figure I.1. Average annual rate of population change for the world and development groups, 1950-2100
-0.5
0.0
0.5
1.0
1.5
2.0
2.5
3.0
1950 1960 1970 1980 1990 2000 2010 2020 2030 2040 2050 2060 2070 2080 2090 2100
Period
Ave
rag
e an
nu
al r
ate
of
chan
ge
(p
erce
nta
ge)
World More developed regions
Less developed regions Least developed countries
Source: Population Division of the Department of Economic and Social Affairs of the United Nations Secretariat (2013). World Population Prospects: The 2012 Revision. New York: United Nations.
.
United N
ations Departm
ent of Econom
ic and Social A
ffairs/Population D
ivision 5
World P
opulation Prospects: T
he 2012 Revision, H
ighlights and Advance T
ables
TABLE I.3. AVERAGE ANNUAL RATE OF POPULATION CHANGE FOR THE WORLD, DEVELOPMENT GROUPS AND MAJOR AREAS, FOR SELECTED PERIODS AND DIFFERENT VARIANTS (PERCENTAGE)
2013-2050 2050-2100
Development group or major area 1950-2013 1950-1980 1980-2013 Low Medium High Constant-
fertility Low Medium High Constant-
fertility
World.................................................... 1.65 1.89 1.44 0.41 0.78 1.13 1.18 -0.69 0.26 1.11 2.20
More developed regions........................ 0.69 0.96 0.44 -0.23 0.11 0.43 0.03 -0.97 -0.03 0.82 -0.25
Less developed regions......................... 1.97 2.25 1.71 0.53 0.90 1.25 1.37 -0.65 0.30 1.15 2.41
Least developed countries................. 2.42 2.33 2.51 1.55 1.89 2.22 2.82 0.14 0.96 1.71 4.03
Other less developed countries ......... 1.90 2.24 1.58 0.30 0.68 1.04 1.01 -0.95 0.06 0.96 1.54
Africa.................................................... 2.51 2.46 2.55 1.75 2.07 2.39 2.87 0.33 1.12 1.84 3.95
Asia....................................................... 1.79 2.12 1.48 0.11 0.50 0.86 0.81 -1.27 -0.18 0.76 1.10
Europe .................................................. 0.48 0.78 0.20 -0.48 -0.12 0.22 -0.26 -1.23 -0.21 0.70 -0.67
Latin America and the Caribbean ......... 2.07 2.58 1.60 0.24 0.64 1.03 0.98 -1.24 -0.12 0.88 1.01
Northern America ................................. 1.16 1.32 1.01 0.29 0.62 0.93 0.66 -0.57 0.28 1.05 0.36
Oceania ................................................. 1.76 1.98 1.55 0.74 1.07 1.38 1.31 -0.42 0.41 1.17 1.39 Source: Population Division of the Department of Economic and Social Affairs of the United Nations Secretariat (2013). World Population Prospects: The 2012 Revision. New York: United Nations.
B. POPULATION AGE COMPOSITION The primary demographic consequence of fertility decline, especially if combined with increases in life expectancy, is population ageing, a process whereby the proportion of older persons in the population increases and that of younger persons declines. In 1950, just 8 per cent of the world population was aged 60 years or over. By 2013 that proportion had risen to 12 per cent and it is expected to reach 21 per cent in 2050 (table I.4; see table S.6 for figures at the country level). Globally, the number of older persons (aged 60 years or over) will increase by a factor of 2.4, passing from 841 million in 2013 to more than 2 billion in 2050. In contrast, the number of children (persons under age 15) is projected to hardly increase over the next 37 years, passing from 1.88 billion in 2013 to 2.03 billion in 2050 and their share of the total population will drop from 26 per cent in 2013 to 21 per cent in 2050. During the second half of the 21st century, the number of older persons (aged 60 years or over) will increase by close to a billion, to reach almost 3 billion in 2100, and the number of children will decrease by 90 million, to reach 1.94 billion in 2100.
Increases in the median age, the age at which half the population is older and half is younger than that age, are indicative of population ageing (table I.5). In 2013, 30 countries or areas, almost all of them developed countries, had a median age higher than 40 years. Japan led the group with a median age of 45.9 years, followed closely by Germany, with median age of 45.5 years, and Italy, with median age of 44.3 years (tables S.7 and S.8). In contrast, the median ages of Niger, Uganda and Chad in 2013 were below 16 years, making their populations the youngest on the planet.
By 2050, close to 100 countries are expected to have a median age above 40 years, more than half of which will be countries located in the developing world. That is, population ageing, which is already pervasive in developed countries, is expected to be common in the developing world of the future and is projected to occur more rapidly in developing countries than it did in their developed counterparts. In 2100, it is anticipated that 158 countries will have a median age above 40 years, more than two thirds of which will be located in the developing world.
Despite the general trend toward population ageing, countries that still have relatively high fertility will have a younger population than the rest in 2050 (table I.5). Many least developed countries are in this group. In 2050, 24 countries are projected to have median ages below 25 years; among those, 20 are least developed countries. The youngest populations on Earth are expected to be in Niger, Mali, Zambia, and Somalia, in increasing order according to the value of their respective median ages (tables I.5 and S.7). Because the least developed countries are expected to continue having some of the highest fertility levels on Earth after 2050, several of these countries will remain with the youngest populations in 2100. By that date, the median ages of the populations of Zambia, Niger, Mali, Somalia, and several other countries are expected to be below 35 years.
6 United Nations Department of Economic and Social Affairs/Population Division World Population Prospects: The 2012 Revision, Highlights and Advance Tables
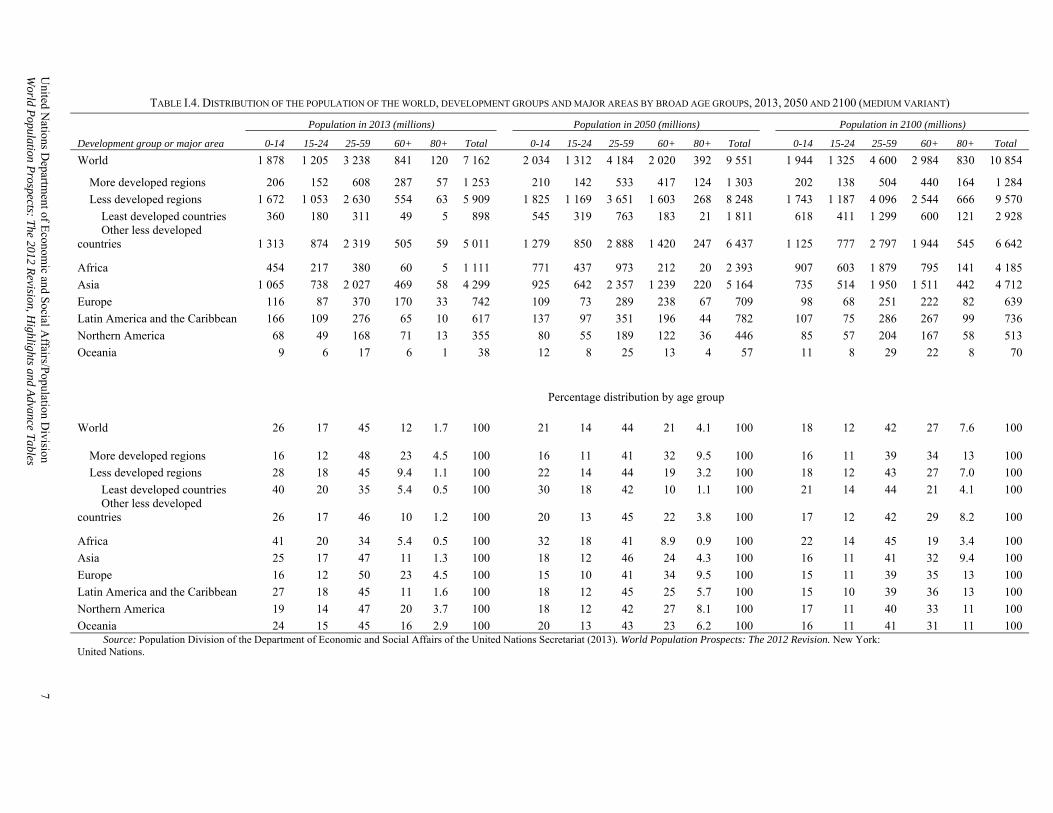
TABLE I.4. DISTRIBUTION OF THE POPULATION OF THE WORLD, DEVELOPMENT GROUPS AND MAJOR AREAS BY BROAD AGE GROUPS, 2013, 2050 AND 2100 (MEDIUM VARIANT)
Population in 2013 (millions) Population in 2050 (millions) Population in 2100 (millions)
Development group or major area 0-14 15-24 25-59 60+ 80+ Total 0-14 15-24 25-59 60+ 80+ Total 0-14 15-24 25-59 60+ 80+ Total
World 1 878 1 205 3 238 841 120 7 162 2 034 1 312 4 184 2 020 392 9 551 1 944 1 325 4 600 2 984 830 10 854
More developed regions 206 152 608 287 57 1 253 210 142 533 417 124 1 303 202 138 504 440 164 1 284
Less developed regions 1 672 1 053 2 630 554 63 5 909 1 825 1 169 3 651 1 603 268 8 248 1 743 1 187 4 096 2 544 666 9 570
Least developed countries 360 180 311 49 5 898 545 319 763 183 21 1 811 618 411 1 299 600 121 2 928 Other less developed
countries 1 313 874 2 319 505 59 5 011 1 279 850 2 888 1 420 247 6 437 1 125 777 2 797 1 944 545 6 642
Africa 454 217 380 60 5 1 111 771 437 973 212 20 2 393 907 603 1 879 795 141 4 185
Asia 1 065 738 2 027 469 58 4 299 925 642 2 357 1 239 220 5 164 735 514 1 950 1 511 442 4 712
Europe 116 87 370 170 33 742 109 73 289 238 67 709 98 68 251 222 82 639
Latin America and the Caribbean 166 109 276 65 10 617 137 97 351 196 44 782 107 75 286 267 99 736
Northern America 68 49 168 71 13 355 80 55 189 122 36 446 85 57 204 167 58 513
Oceania 9 6 17 6 1 38 12 8 25 13 4 57 11 8 29 22 8 70
Percentage distribution by age group
World 26 17 45 12 1.7 100 21 14 44 21 4.1 100 18 12 42 27 7.6 100
More developed regions 16 12 48 23 4.5 100 16 11 41 32 9.5 100 16 11 39 34 13 100
Less developed regions 28 18 45 9.4 1.1 100 22 14 44 19 3.2 100 18 12 43 27 7.0 100
Least developed countries 40 20 35 5.4 0.5 100 30 18 42 10 1.1 100 21 14 44 21 4.1 100 Other less developed
countries 26 17 46 10 1.2 100 20 13 45 22 3.8 100 17 12 42 29 8.2 100
Africa 41 20 34 5.4 0.5 100 32 18 41 8.9 0.9 100 22 14 45 19 3.4 100
Asia 25 17 47 11 1.3 100 18 12 46 24 4.3 100 16 11 41 32 9.4 100
Europe 16 12 50 23 4.5 100 15 10 41 34 9.5 100 15 11 39 35 13 100
Latin America and the Caribbean 27 18 45 11 1.6 100 18 12 45 25 5.7 100 15 10 39 36 13 100
Northern America 19 14 47 20 3.7 100 18 12 42 27 8.1 100 17 11 40 33 11 100
Oceania 24 15 45 16 2.9 100 20 13 43 23 6.2 100 16 11 41 31 11 100 Source: Population Division of the Department of Economic and Social Affairs of the United Nations Secretariat (2013). World Population Prospects: The 2012 Revision. New York: United Nations.
United N
ations Departm
ent of Econom
ic and Social A
ffairs/Population D
ivision
7 W
orld Population P
rospects: The 2012 R
evision, Highlights and A
dvance Tables
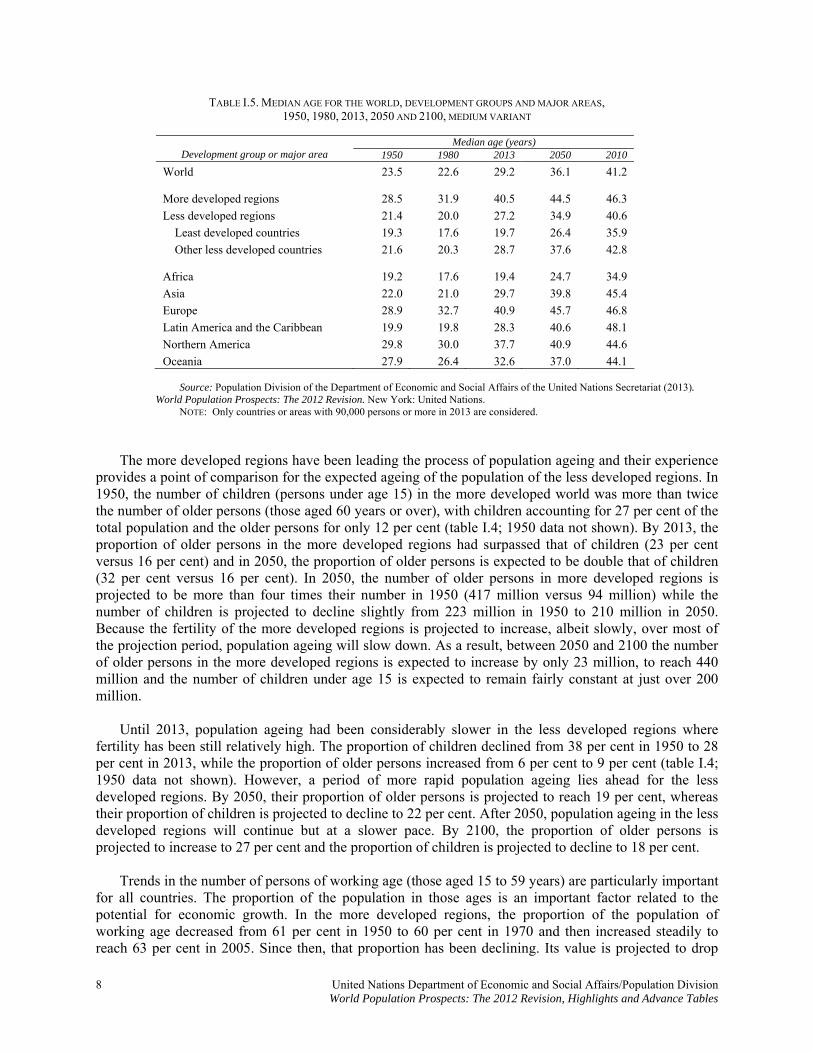
TABLE I.5. MEDIAN AGE FOR THE WORLD, DEVELOPMENT GROUPS AND MAJOR AREAS, 1950, 1980, 2013, 2050 AND 2100, MEDIUM VARIANT
Median age (years)
Development group or major area 1950 1980 2013 2050 2010
World 23.5 22.6 29.2 36.1 41.2
More developed regions 28.5 31.9 40.5 44.5 46.3
Less developed regions 21.4 20.0 27.2 34.9 40.6
Least developed countries 19.3 17.6 19.7 26.4 35.9
Other less developed countries 21.6 20.3 28.7 37.6 42.8
Africa 19.2 17.6 19.4 24.7 34.9
Asia 22.0 21.0 29.7 39.8 45.4
Europe 28.9 32.7 40.9 45.7 46.8
Latin America and the Caribbean 19.9 19.8 28.3 40.6 48.1
Northern America 29.8 30.0 37.7 40.9 44.6
Oceania 27.9 26.4 32.6 37.0 44.1
Source: Population Division of the Department of Economic and Social Affairs of the United Nations Secretariat (2013). World Population Prospects: The 2012 Revision. New York: United Nations.
NOTE: Only countries or areas with 90,000 persons or more in 2013 are considered.
The more developed regions have been leading the process of population ageing and their experience provides a point of comparison for the expected ageing of the population of the less developed regions. In 1950, the number of children (persons under age 15) in the more developed world was more than twice the number of older persons (those aged 60 years or over), with children accounting for 27 per cent of the total population and the older persons for only 12 per cent (table I.4; 1950 data not shown). By 2013, the proportion of older persons in the more developed regions had surpassed that of children (23 per cent versus 16 per cent) and in 2050, the proportion of older persons is expected to be double that of children (32 per cent versus 16 per cent). In 2050, the number of older persons in more developed regions is projected to be more than four times their number in 1950 (417 million versus 94 million) while the number of children is projected to decline slightly from 223 million in 1950 to 210 million in 2050. Because the fertility of the more developed regions is projected to increase, albeit slowly, over most of the projection period, population ageing will slow down. As a result, between 2050 and 2100 the number of older persons in the more developed regions is expected to increase by only 23 million, to reach 440 million and the number of children under age 15 is expected to remain fairly constant at just over 200 million.
Until 2013, population ageing had been considerably slower in the less developed regions where fertility has been still relatively high. The proportion of children declined from 38 per cent in 1950 to 28 per cent in 2013, while the proportion of older persons increased from 6 per cent to 9 per cent (table I.4; 1950 data not shown). However, a period of more rapid population ageing lies ahead for the less developed regions. By 2050, their proportion of older persons is projected to reach 19 per cent, whereas their proportion of children is projected to decline to 22 per cent. After 2050, population ageing in the less developed regions will continue but at a slower pace. By 2100, the proportion of older persons is projected to increase to 27 per cent and the proportion of children is projected to decline to 18 per cent. Trends in the number of persons of working age (those aged 15 to 59 years) are particularly important for all countries. The proportion of the population in those ages is an important factor related to the potential for economic growth. In the more developed regions, the proportion of the population of working age decreased from 61 per cent in 1950 to 60 per cent in 1970 and then increased steadily to reach 63 per cent in 2005. Since then, that proportion has been declining. Its value is projected to drop
8 United Nations Department of Economic and Social Affairs/Population Division World Population Prospects: The 2012 Revision, Highlights and Advance Tables
United Nations Department of Economic and Social Affairs/Population Division 9 World Population Prospects: The 2012 Revision, Highlights and Advance Tables
from 61 per cent in 2013 to 52 in 2050 and then reach 50 per cent in 2100 (table I.4). That is, the major change in the proportion of the population of working ages in the more developed regions will occur over the next 40 years if, as projected in the medium variant, the fertility of the more developed regions rises slowly for the rest of the century. In the less developed regions, the proportion of the population of working age is expected to decline slightly, passing from 62 per cent in 2013 to 58 per cent in 2050 and 55 per cent in 2100. However, among the least developed countries, that proportion will rise from 55 per cent in 2013 to 60 per cent in 2050 and decline thereafter to 58 per cent in 2100, an increase that represents both an opportunity and a challenge: an opportunity to spur economic growth provided that the challenge of creating gainful employment for the growing numbers of persons of working age is met.
Among the older population, the number and proportion of the oldest-old, that is, persons aged 80 years or over, is rising. In 2013, there were 120 million oldest-old persons in the world, corresponding to 1.7 per cent of the world population (table I.4). By 2050, this segment of the population is projected to reach 392 million or 4.1 per cent of the world population and by 2100 it would ascend to 830 million or 7.6 per cent of the population. The group of oldest-old is the fastest growing segment of the world population. Particularly rapid increases in this group are expected in the less developed regions, where the oldest-old are projected to increase from 63 million in 2013 to 268 million in 2050 and to 666 million in 2100, implying an average annual rate of increase of 3.9 per cent during 2013-2050 and of 1.8 per cent per year during 2050-2100 (table I.6). Over half of the oldest-old already live in the less developed regions but they are expected to become increasingly concentrated in developing countries. Thus, in 2050, 68 per cent of all persons aged 80 or over are expected to live in developing countries and by 2100 80 per cent are expected to do so. In 2013, 74 countries had populations where persons aged 80 years or older accounted for more than 1.68 per cent of the population (the proportion of oldest-old in the world). The oldest-old accounted for over 7.3 per cent of the population of Japan and for more than 5.5 per cent of the populations of Italy, France, Greece, Spain and Belgium, ordered according to the proportion of oldest-old (table S.6). By 2050, 103 countries are expected to have populations where persons aged 80 or over account for more than 4.10 per cent of the population (the proportion of the oldest-old at the global level in 2050). The oldest-old are projected to account for over 10 per cent of the population in 23 countries. In 2100, the proportion of the oldest-old is projected to exceed 7.83 per cent (their share of the world population) in 128 countries and in 109 of them, the proportion of persons aged 80 years or over is projected to exceed 10 per cent. Just as the overall population, the oldest-old tend to be concentrated in the most populous countries. In 2013, 22.6 million lived in China, 11.9 million in the United States and 9.9 million in India. In 2050, those countries will still have the largest numbers of persons aged 80 years or over: 90.4 million in China, 37.2 million in India and 31.7 million in the United States. By 2100, China is projected to have 120 million persons of aged 80 or over, India 116 million and the United States 52 million.
10 United N
ations Departm
ent of Econom
ic and Social Affairs/P
opulation Division
World P
opulation Prospects: T
he 2012 Revision, H
ighlights and Advance T
ables
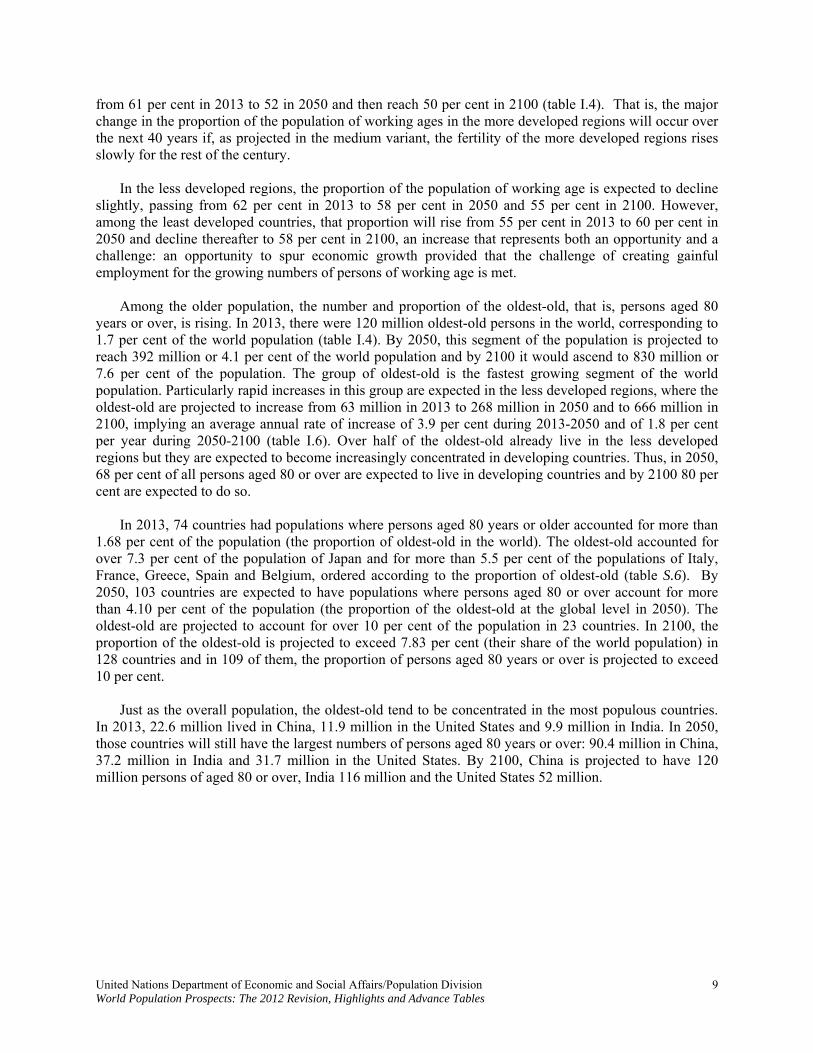
TABLE I.6. AVERAGE ANNUAL RATES OF CHANGE OF THE TOTAL POPULATION AND THE POPULATION IN BROAD AGE GROUPS, BY DEVELOPMENT GROUP AND MAJOR AREA, 2013-2050 AND 2050-2100 (MEDIUM VARIANT)
2013-2050 2050-2100
80+
Total population 0-14 15-59 60+ Development group or major area 0-14 15-59 60+ 80+
Total population
World 0.22 0.50 2.37 3.19 0.78 -0.09 0.13 0.78 1.50 0.26
More developed regions 0.05 -0.29 1.01 2.10 0.11 -0.08 -0.09 0.11 0.56 -0.03
0.24 0.63 2.87 3.90 0.90 Less developed regions -0.09 0.15 0.92 1.82 0.30
Least developed countries 2.00 3.59 4.12 1.89 0.25 1.12 0.83 2.37 3.53 0.96
Other less developed countries -0.07 2.79 3.88 0.68 -0.26 -0.11 0.33 0.63 1.58 0.06
Africa 1.43 2.22 3.67 2.07 0.33 1.03 2.65 3.41 3.87 1.12
Asia -0.38 0.11 2.63 0.50 -0.46 -0.40 0.40 1.40 3.62 -0.18
Europe -0.16 -0.60 0.91 1.91 -0.12 -0.22 -0.24 -0.14 0.41 -0.21
Latin America and the Caribbean -0.51 0.27 2.96 4.11 0.64 -0.49 -0.45 0.62 1.60 -0.12
Northern America 0.43 0.32 1.48 2.70 0.62 0.12 0.13 0.62 0.96 0.28
Oceania 0.65 0.88 2.05 3.14 1.07 -0.04 0.21 1.03 1.54 0.41 Source: Population Division of the Department of Economic and Social Affairs of the United Nations Secretariat (2013). World Population Prospects: The 2012 Revision. New York: United Nations. NOTE: Only countries or areas with 90,000 persons or more in 2013 are considered.
II. FERTILITY According to the 2012 Revision, total fertility—that is, the average number of children a woman would bear if fertility rates remained unchanged during her lifetime—is 2.53 children per woman in 2005-2010 at the world level (table II.1). This average masks the heterogeneity of fertility levels among countries and regions (figure II.1 and table S.9). In 2005-2010, 75 countries or areas (45 of them located in the more developed regions) have fertility levels below 2.1 children per woman, that is, below replacement level26, whereas 126 countries or areas, all of which, except for Iceland and New Zealand, are located in the less developed regions, and have total fertility levels at or above 2.1 children per woman. Among these 126 countries, 31 have total fertility levels at or above 5 children per woman, 28 of which are least developed countries (table II.2).
The 75 countries where total fertility is below replacement level in 2005-2010 account for 48.2 per cent of the world population or approximately 3.3 billion people. Countries with fertility at or above replacement level account for 3.5 billion people or 51.8 per cent of the world population.
Within the next decades, the number of countries with below-replacement fertility is expected to almost double to reach 139 in 2045-2050. This means that by mid-century 7.1 billion people or 75.2 per cent of the world population will be living in these countries. Under this medium fertility variant, it is assumed that 184 countries will reach below-replacement fertility by 2095-2100, and more than 81 per cent of the world population will be living in a country where the average number of children per woman will be below 2.1.
As in the 2010 revision of the World Population Prospects, the assumptions and the projection model used in this revision take into account the unique fertility decline experience of each country while also using the experience of all other countries to inform future potential fertility trajectories. Based on the historical experiences of fertility decline from all the countries and areas of the world since 1950, the projection results of the 2012 revision show that, by mid-century, 22 countries out of 75 currently are expected to still have on average 3 children or more per woman. By 2045-2050, 14.5per cent of the world population is expected to live in such country compared to 18.4 per cent currently. Since, 1974, when the first World Population Conference was held in Bucharest, Romania, fertility has declined by more than 20 per cent in 155 developing countries and by over 50 per cent in 40 of them. The fastest fertility reductions, among countries with fertility levels greater or equal to 4 children per woman in 1975-1980, occurred in countries in Asia, including the Islamic Republic of Iran, Viet Nam, United Arab Emirates, Maldives, Mongolia, Oman, Qatar, Bangladesh, Lebanon, Bhutan, Myanmar and Saudi Arabia. Fertility also declined rapidly in countries of Northern Africa, namely in Libya, Tunisia, Algeria, Morocco and Western Sahara as well as in Cape Verde and in Saint Lucia (table S.11). Among the countries that have experienced a decline of fertility by over 50 per cent within the past thirty years, current fertility levels are now on average 2.3 children per women instead of 5.6 in 1975-1980. Although most developing countries are already far advanced in the transition from high to low fertility, twelve countries still have fertility levels of 6 children per woman or higher in 2005-2010 and in Niger and Somalia total fertility is greater than 7 children per woman (table II.2 and table S.10), and the fertility in these country has decreased at most by about 1.3 child within the last 30 years. Based on the experience of other countries with similar levels of fertility in the past, the fertility of those twelve countries is projected to decline after 2010, at a pace of less than one child per decade after 2020, and none, but one (Afghanistan), is expected to reach 2.1 children per woman by 2045-2050 in the medium variant. As a result, their average fertility is expected to be just below 3.5 children per woman and their
26 Replacement-level fertility is the level that needs to be sustained over the long run to ensure that a population replaces itself. For most
countries having low or moderate mortality levels, replacement level is close to 2.1 children per woman.
United Nations Department of Economic and Social Affairs/Population Division 11 World Population Prospects: The 2012 Revision, Highlights and Advance Tables
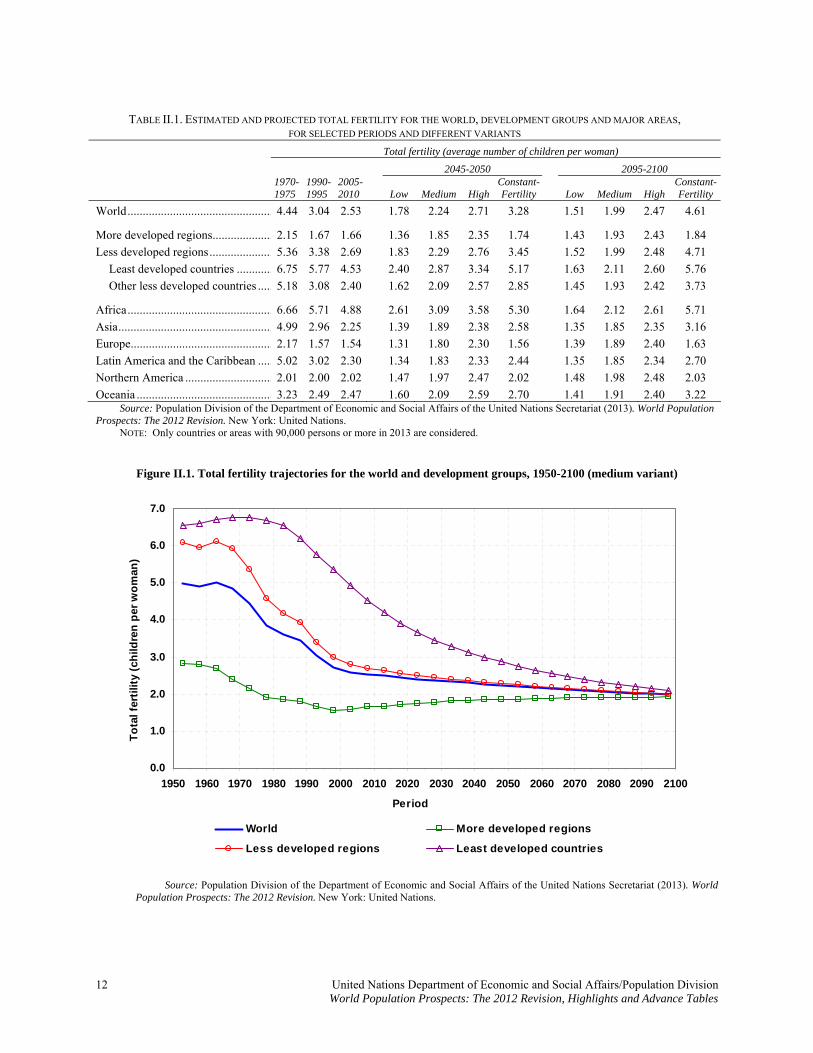
TABLE II.1. ESTIMATED AND PROJECTED TOTAL FERTILITY FOR THE WORLD, DEVELOPMENT GROUPS AND MAJOR AREAS,
FOR SELECTED PERIODS AND DIFFERENT VARIANTS
Total fertility (average number of children per woman)
2045-2050 2095-2100
1970-1975
1990-1995
2005-2010 Low Medium High
Constant-Fertility Low Medium High
Constant-Fertility
World................................................ 4.44 3.04 2.53 1.78 2.24 2.71 3.28 1.51 1.99 2.47 4.61
More developed regions.................... 2.15 1.67 1.66 1.36 1.85 2.35 1.74 1.43 1.93 2.43 1.84
Less developed regions..................... 5.36 3.38 2.69 1.83 2.29 2.76 3.45 1.52 1.99 2.48 4.71
Least developed countries ............ 6.75 5.77 4.53 2.40 2.87 3.34 5.17 1.63 2.11 2.60 5.76
Other less developed countries ..... 5.18 3.08 2.40 1.62 2.09 2.57 2.85 1.45 1.93 2.42 3.73
Africa................................................ 6.66 5.71 4.88 2.61 3.09 3.58 5.30 1.64 2.12 2.61 5.71
Asia................................................... 4.99 2.96 2.25 1.39 1.89 2.38 2.58 1.35 1.85 2.35 3.16
Europe............................................... 2.17 1.57 1.54 1.31 1.80 2.30 1.56 1.39 1.89 2.40 1.63
Latin America and the Caribbean ..... 5.02 3.02 2.30 1.34 1.83 2.33 2.44 1.35 1.85 2.34 2.70
Northern America ............................. 2.01 2.00 2.02 1.47 1.97 2.47 2.02 1.48 1.98 2.48 2.03
Oceania ............................................. 3.23 2.49 2.47 1.60 2.09 2.59 2.70 1.41 1.91 2.40 3.22 Source: Population Division of the Department of Economic and Social Affairs of the United Nations Secretariat (2013). World Population Prospects: The 2012 Revision. New York: United Nations.
NOTE: Only countries or areas with 90,000 persons or more in 2013 are considered.
Figure II.1. Total fertility trajectories for the world and development groups, 1950-2100 (medium variant)
0.0
1.0
2.0
3.0
4.0
5.0
6.0
7.0
1950 1960 1970 1980 1990 2000 2010 2020 2030 2040 2050 2060 2070 2080 2090 2100
Period
To
tal f
erti
lity
(ch
ildre
n p
er w
om
an)
World More developed regions
Less developed regions Least developed countries
Source: Population Division of the Department of Economic and Social Affairs of the United Nations Secretariat (2013). World Population Prospects: The 2012 Revision. New York: United Nations.
12 United Nations Department of Economic and Social Affairs/Population Division World Population Prospects: The 2012 Revision, Highlights and Advance Tables
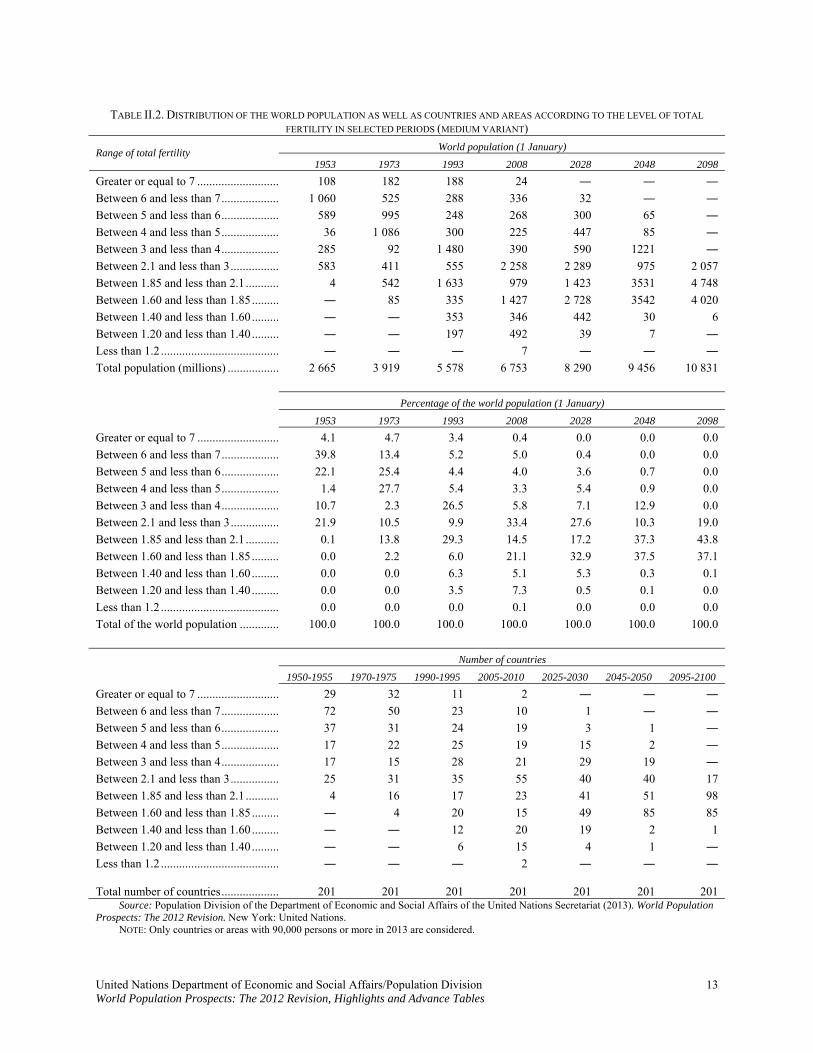
TABLE II.2. DISTRIBUTION OF THE WORLD POPULATION AS WELL AS COUNTRIES AND AREAS ACCORDING TO THE LEVEL OF TOTAL
FERTILITY IN SELECTED PERIODS (MEDIUM VARIANT)
World population (1 January) Range of total fertility
1953 1973 1993 2008 2028 2048 2098
Greater or equal to 7 ........................... 108 182 188 24 ― ― ―
Between 6 and less than 7................... 1 060 525 288 336 32 ― ―
Between 5 and less than 6................... 589 995 248 268 300 65 ―
Between 4 and less than 5................... 36 1 086 300 225 447 85 ―
Between 3 and less than 4................... 285 92 1 480 390 590 1221 ―
Between 2.1 and less than 3................ 583 411 555 2 258 2 289 975 2 057
Between 1.85 and less than 2.1........... 4 542 1 633 979 1 423 3531 4 748
Between 1.60 and less than 1.85......... ― 85 335 1 427 2 728 3542 4 020
Between 1.40 and less than 1.60......... ― ― 353 346 442 30 6
Between 1.20 and less than 1.40......... ― ― 197 492 39 7 ―
Less than 1.2 ....................................... ― ― ― 7 ― ― ―
Total population (millions) ................. 2 665 3 919 5 578 6 753 8 290 9 456 10 831
Percentage of the world population (1 January)
1953 1973 1993 2008 2028 2048 2098
Greater or equal to 7 ........................... 4.1 4.7 3.4 0.4 0.0 0.0 0.0
Between 6 and less than 7................... 39.8 13.4 5.2 5.0 0.4 0.0 0.0
Between 5 and less than 6................... 22.1 25.4 4.4 4.0 3.6 0.7 0.0
Between 4 and less than 5................... 1.4 27.7 5.4 3.3 5.4 0.9 0.0
Between 3 and less than 4................... 10.7 2.3 26.5 5.8 7.1 12.9 0.0
Between 2.1 and less than 3................ 21.9 10.5 9.9 33.4 27.6 10.3 19.0
Between 1.85 and less than 2.1........... 0.1 13.8 29.3 14.5 17.2 37.3 43.8
Between 1.60 and less than 1.85 ......... 0.0 2.2 6.0 21.1 32.9 37.5 37.1
Between 1.40 and less than 1.60 ......... 0.0 0.0 6.3 5.1 5.3 0.3 0.1
Between 1.20 and less than 1.40 ......... 0.0 0.0 3.5 7.3 0.5 0.1 0.0
Less than 1.2 ....................................... 0.0 0.0 0.0 0.1 0.0 0.0 0.0
Total of the world population ............. 100.0 100.0 100.0 100.0 100.0 100.0 100.0
Number of countries
1950-1955 1970-1975 1990-1995 2005-2010 2025-2030 2045-2050 2095-2100
Greater or equal to 7 ........................... 29 32 11 2 ― ― ―
Between 6 and less than 7................... 72 50 23 10 1 ― ―
Between 5 and less than 6................... 37 31 24 19 3 1 ―
Between 4 and less than 5................... 17 22 25 19 15 2 ―
Between 3 and less than 4................... 17 15 28 21 29 19 ―
Between 2.1 and less than 3................ 25 31 35 55 40 40 17
Between 1.85 and less than 2.1........... 4 16 17 23 41 51 98
Between 1.60 and less than 1.85......... ― 4 20 15 49 85 85
Between 1.40 and less than 1.60......... ― ― 12 20 19 2 1
Between 1.20 and less than 1.40......... ― ― 6 15 4 1 ―
Less than 1.2 ....................................... ― ― ― 2 ― ― ―
Total number of countries................... 201 201 201 201 201 201 201 Source: Population Division of the Department of Economic and Social Affairs of the United Nations Secretariat (2013). World Population Prospects: The 2012 Revision. New York: United Nations. NOTE: Only countries or areas with 90,000 persons or more in 2013 are considered.
United Nations Department of Economic and Social Affairs/Population Division 13 World Population Prospects: The 2012 Revision, Highlights and Advance Tables
14 United Nations Department of Economic and Social Affairs/Population Division World Population Prospects: The 2012 Revision, Highlights and Advance Tables
population is expected nearly to triple, passing from about 330 million in 2008 to close to 950 million in 2048, and could reach over 2 billion in 2098. These twelve countries are least developed countries—Afghanistan, Angola, Burkina Faso, Burundi, Chad, the Democratic Republic of the Congo, Mali, Niger, Nigeria, Somalia, Timor-Leste, Uganda—and several are highly affected by the HIV/AIDS epidemic. Moreover, a number of them have been experiencing civil strife and political instability in recent years, factors that militate against the provision of basic services for the population. The continuation of rapid population growth poses serious challenges to their future development. Despite the important contribution to population growth of countries with the highest fertility (those with a total fertility above 6 children per woman), these twelve countries account today for about 5.1 per cent of the world population and are expected to constitute respectively 10.2 and 19.3 per cent of the world population by 2048 and 2098, according to the medium variant. Countries with total fertility ranging from 4 to 6 children per woman account today for 7.0 per cent of the world population, and will account for about 12.1 per cent by 2048 (table II.2) because their fertility is expected to continue to decline from just 4.95 children per woman on average currently to 2.85 children per woman on average by 2045-2050, and to reach 2.1 children per woman by 2090-2095. In 2008, the majority of people in the developing world live in the 74 countries with total fertility ranging from 2.1 to 4 children per woman, which account for 43.7 per cent of the world population. Most of those countries are projected to have a total fertility below replacement level by 2040-2045 or even earlier, according to the medium variant. Overall, 139 countries or areas are projected to have below-replacement fertility in 2045-2050, with 88 having a total fertility lower than 1.85 children per woman. As a result, according to the medium variant, 75.2 per cent of the world population is expected to live in countries with below-replacement fertility in 2045-2050. This percentage is expected to increase up to 81 per cent by the end of the century, but by then 98 countries are assumed to have reached a sub-replacement fertility level between 1.85 and 2.1 children per woman on average. Fertility levels in developed countries, many of which experienced a “baby-boom” during the 1950s and 1960s, have generally declined since the early 1970s to below-replacement level. In fact, in 1975-1980, more than half of the 45 developed countries in the world already had below-replacement fertility. By 2005-2010, almost all developed countries had reached fertility levels below 2.1 children per woman (only Iceland and New Zealand have fertility levels equal or just above 2.1). Among them, 12 had reached historically unprecedented low fertility levels (below 1.4 children per woman), with Austria, Bosnia and Herzegovina, Germany, Hungary, Italy, Japan, Malta, Poland, Portugal, Romania, Slovakia and Ukraine exhibiting the lowest levels in the developed world. But the top five countries or areas experiencing in 2005-2010 the lowest fertility levels (below 1.3 children per woman) were Macao and Hong Kong (SARs of China), Bosnia and Herzegovina, the Republic of Korea and Singapore (table S.10). At the world level, the medium variant projects total fertility to be 2.24 children per woman in 2045-2050 (table II.1), with a convergence between countries which leads to 1.85 children per woman in the more developed regions and 2.29 children per woman in the less developed regions. That is, although the difference in total fertility between the more and the less developed regions narrows considerably by mid-century, the less developed regions are still expected to have a higher total fertility than the more developed regions, and some regions like Africa to have on average a fertility more than one child higher than in Asia or Latin America. That difference persists in all projection variants. Total fertility in the low variant is expected to be 1.36 children per woman in the more developed regions and 1.83 children per woman in the less developed regions. In the high variant, total fertility is projected to be 2.35 children per woman in the more developed regions and 2.76 children per woman in the less developed regions.
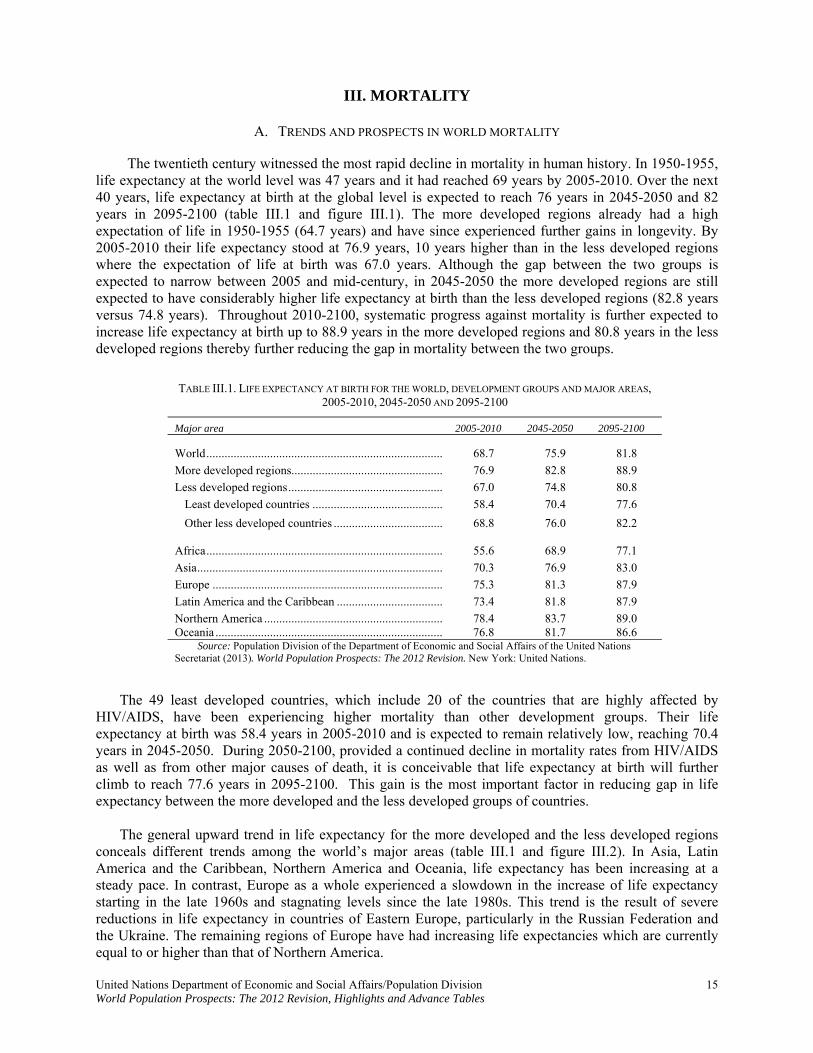
III. MORTALITY
A. TRENDS AND PROSPECTS IN WORLD MORTALITY The twentieth century witnessed the most rapid decline in mortality in human history. In 1950-1955, life expectancy at the world level was 47 years and it had reached 69 years by 2005-2010. Over the next 40 years, life expectancy at birth at the global level is expected to reach 76 years in 2045-2050 and 82 years in 2095-2100 (table III.1 and figure III.1). The more developed regions already had a high expectation of life in 1950-1955 (64.7 years) and have since experienced further gains in longevity. By 2005-2010 their life expectancy stood at 76.9 years, 10 years higher than in the less developed regions where the expectation of life at birth was 67.0 years. Although the gap between the two groups is expected to narrow between 2005 and mid-century, in 2045-2050 the more developed regions are still expected to have considerably higher life expectancy at birth than the less developed regions (82.8 years versus 74.8 years). Throughout 2010-2100, systematic progress against mortality is further expected to increase life expectancy at birth up to 88.9 years in the more developed regions and 80.8 years in the less developed regions thereby further reducing the gap in mortality between the two groups.
TABLE III.1. LIFE EXPECTANCY AT BIRTH FOR THE WORLD, DEVELOPMENT GROUPS AND MAJOR AREAS, 2005-2010, 2045-2050 AND 2095-2100
Major area 2005-2010 2045-2050 2095-2100
World.............................................................................. 68.7 75.9 81.8
More developed regions.................................................. 76.9 82.8 88.9
Less developed regions................................................... 67.0 74.8 80.8
Least developed countries ........................................... 58.4 70.4 77.6
Other less developed countries .................................... 68.8 76.0 82.2 Africa.............................................................................. 55.6 68.9 77.1
Asia................................................................................. 70.3 76.9 83.0
Europe ............................................................................ 75.3 81.3 87.9
Latin America and the Caribbean ................................... 73.4 81.8 87.9
Northern America ........................................................... 78.4 83.7 89.0 Oceania ........................................................................... 76.8 81.7 86.6 Source: Population Division of the Department of Economic and Social Affairs of the United Nations Secretariat (2013). World Population Prospects: The 2012 Revision. New York: United Nations.
The 49 least developed countries, which include 20 of the countries that are highly affected by HIV/AIDS, have been experiencing higher mortality than other development groups. Their life expectancy at birth was 58.4 years in 2005-2010 and is expected to remain relatively low, reaching 70.4 years in 2045-2050. During 2050-2100, provided a continued decline in mortality rates from HIV/AIDS as well as from other major causes of death, it is conceivable that life expectancy at birth will further climb to reach 77.6 years in 2095-2100. This gain is the most important factor in reducing gap in life expectancy between the more developed and the less developed groups of countries.
The general upward trend in life expectancy for the more developed and the less developed regions conceals different trends among the world’s major areas (table III.1 and figure III.2). In Asia, Latin America and the Caribbean, Northern America and Oceania, life expectancy has been increasing at a steady pace. In contrast, Europe as a whole experienced a slowdown in the increase of life expectancy starting in the late 1960s and stagnating levels since the late 1980s. This trend is the result of severe reductions in life expectancy in countries of Eastern Europe, particularly in the Russian Federation and the Ukraine. The remaining regions of Europe have had increasing life expectancies which are currently equal to or higher than that of Northern America.
United Nations Department of Economic and Social Affairs/Population Division 15 World Population Prospects: The 2012 Revision, Highlights and Advance Tables
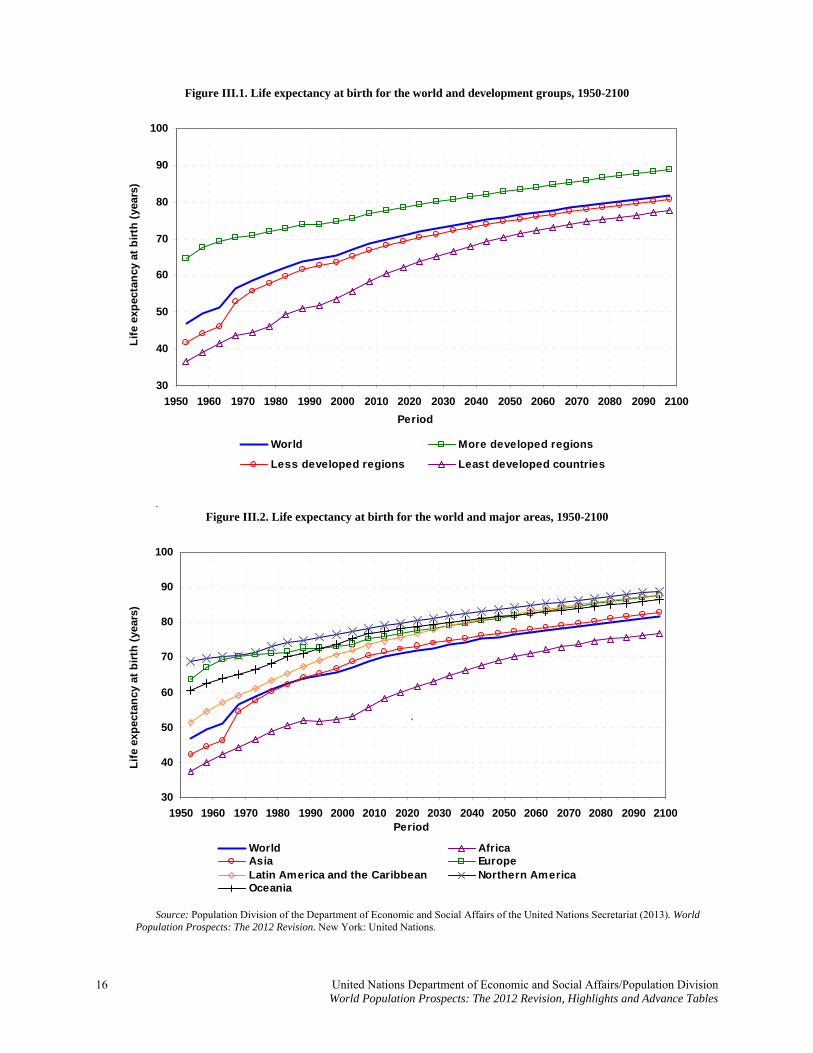
16 United Nations Department of Economic and Social Affairs/Population Division World Population Prospects: The 2012 Revision, Highlights and Advance Tables
Figure III.1. Life expectancy at birth for the world and development groups, 1950-2100
30
40
50
60
70
80
90
100
1950 1960 1970 1980 1990 2000 2010 2020 2030 2040 2050 2060 2070 2080 2090 2100
Period
Lif
e ex
pec
tan
cy a
t b
irth
(ye
ars)
World More developed regions
Less developed regions Least developed countries
. Figure III.2. Life expectancy at birth for the world and major areas, 1950-2100
30
40
50
60
70
80
90
100
1950 1960 1970 1980 1990 2000 2010 2020 2030 2040 2050 2060 2070 2080 2090 2100Period
Lif
e ex
pec
tan
cy a
t b
irth
(ye
ars)
World AfricaAsia EuropeLatin America and the Caribbean Northern AmericaOceania
`
Source: Population Division of the Department of Economic and Social Affairs of the United Nations Secretariat (2013). World Population Prospects: The 2012 Revision. New York: United Nations.
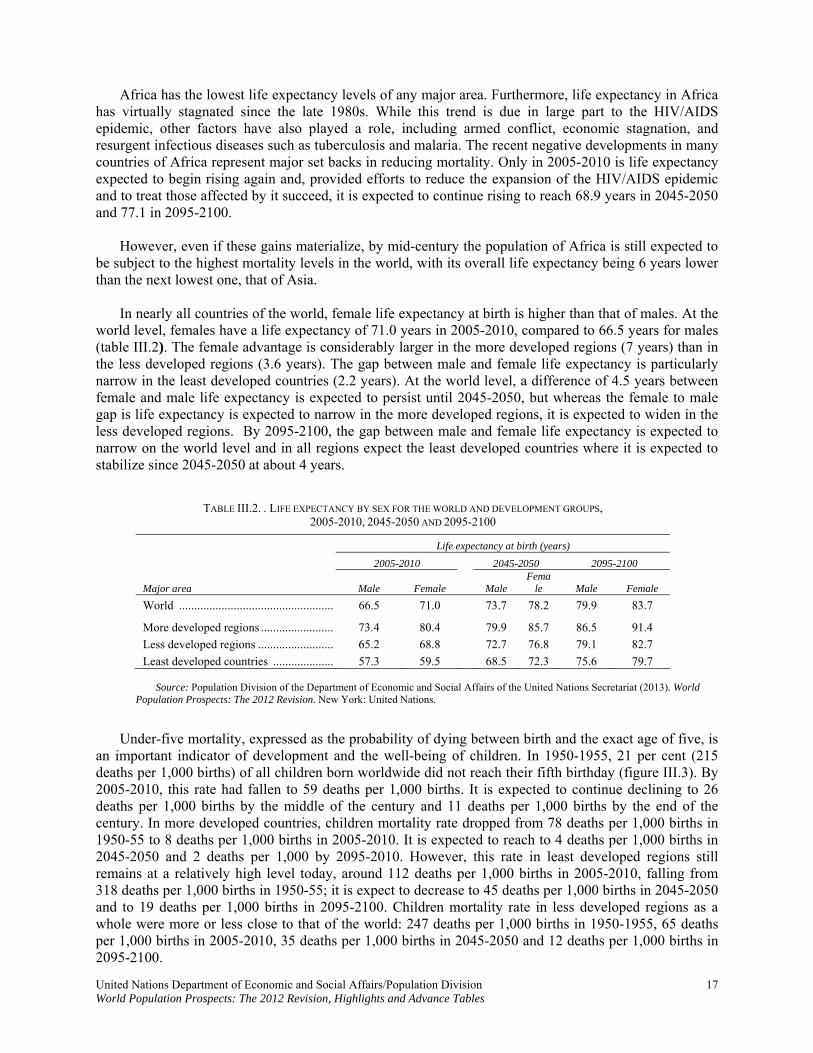
Africa has the lowest life expectancy levels of any major area. Furthermore, life expectancy in Africa has virtually stagnated since the late 1980s. While this trend is due in large part to the HIV/AIDS epidemic, other factors have also played a role, including armed conflict, economic stagnation, and resurgent infectious diseases such as tuberculosis and malaria. The recent negative developments in many countries of Africa represent major set backs in reducing mortality. Only in 2005-2010 is life expectancy expected to begin rising again and, provided efforts to reduce the expansion of the HIV/AIDS epidemic and to treat those affected by it succeed, it is expected to continue rising to reach 68.9 years in 2045-2050 and 77.1 in 2095-2100. However, even if these gains materialize, by mid-century the population of Africa is still expected to be subject to the highest mortality levels in the world, with its overall life expectancy being 6 years lower than the next lowest one, that of Asia. In nearly all countries of the world, female life expectancy at birth is higher than that of males. At the world level, females have a life expectancy of 71.0 years in 2005-2010, compared to 66.5 years for males (table III.2). The female advantage is considerably larger in the more developed regions (7 years) than in the less developed regions (3.6 years). The gap between male and female life expectancy is particularly narrow in the least developed countries (2.2 years). At the world level, a difference of 4.5 years between female and male life expectancy is expected to persist until 2045-2050, but whereas the female to male gap is life expectancy is expected to narrow in the more developed regions, it is expected to widen in the less developed regions. By 2095-2100, the gap between male and female life expectancy is expected to narrow on the world level and in all regions expect the least developed countries where it is expected to stabilize since 2045-2050 at about 4 years.
TABLE III.2. . LIFE EXPECTANCY BY SEX FOR THE WORLD AND DEVELOPMENT GROUPS, 2005-2010, 2045-2050 AND 2095-2100
Life expectancy at birth (years)
2005-2010 2045-2050 2095-2100
Major area Male Female Male Fema
le Male Female
World ................................................... 66.5 71.0 73.7 78.2 79.9 83.7
More developed regions ........................ 73.4 80.4 79.9 85.7 86.5 91.4
Less developed regions ......................... 65.2 68.8 72.7 76.8 79.1 82.7
Least developed countries .................... 57.3 59.5 68.5 72.3 75.6 79.7
Source: Population Division of the Department of Economic and Social Affairs of the United Nations Secretariat (2013). World Population Prospects: The 2012 Revision. New York: United Nations.
Under-five mortality, expressed as the probability of dying between birth and the exact age of five, is an important indicator of development and the well-being of children. In 1950-1955, 21 per cent (215 deaths per 1,000 births) of all children born worldwide did not reach their fifth birthday (figure III.3). By 2005-2010, this rate had fallen to 59 deaths per 1,000 births. It is expected to continue declining to 26 deaths per 1,000 births by the middle of the century and 11 deaths per 1,000 births by the end of the century. In more developed countries, children mortality rate dropped from 78 deaths per 1,000 births in 1950-55 to 8 deaths per 1,000 births in 2005-2010. It is expected to reach to 4 deaths per 1,000 births in 2045-2050 and 2 deaths per 1,000 by 2095-2010. However, this rate in least developed regions still remains at a relatively high level today, around 112 deaths per 1,000 births in 2005-2010, falling from 318 deaths per 1,000 births in 1950-55; it is expect to decrease to 45 deaths per 1,000 births in 2045-2050 and to 19 deaths per 1,000 births in 2095-2100. Children mortality rate in less developed regions as a whole were more or less close to that of the world: 247 deaths per 1,000 births in 1950-1955, 65 deaths per 1,000 births in 2005-2010, 35 deaths per 1,000 births in 2045-2050 and 12 deaths per 1,000 births in 2095-2100.
United Nations Department of Economic and Social Affairs/Population Division 17 World Population Prospects: The 2012 Revision, Highlights and Advance Tables
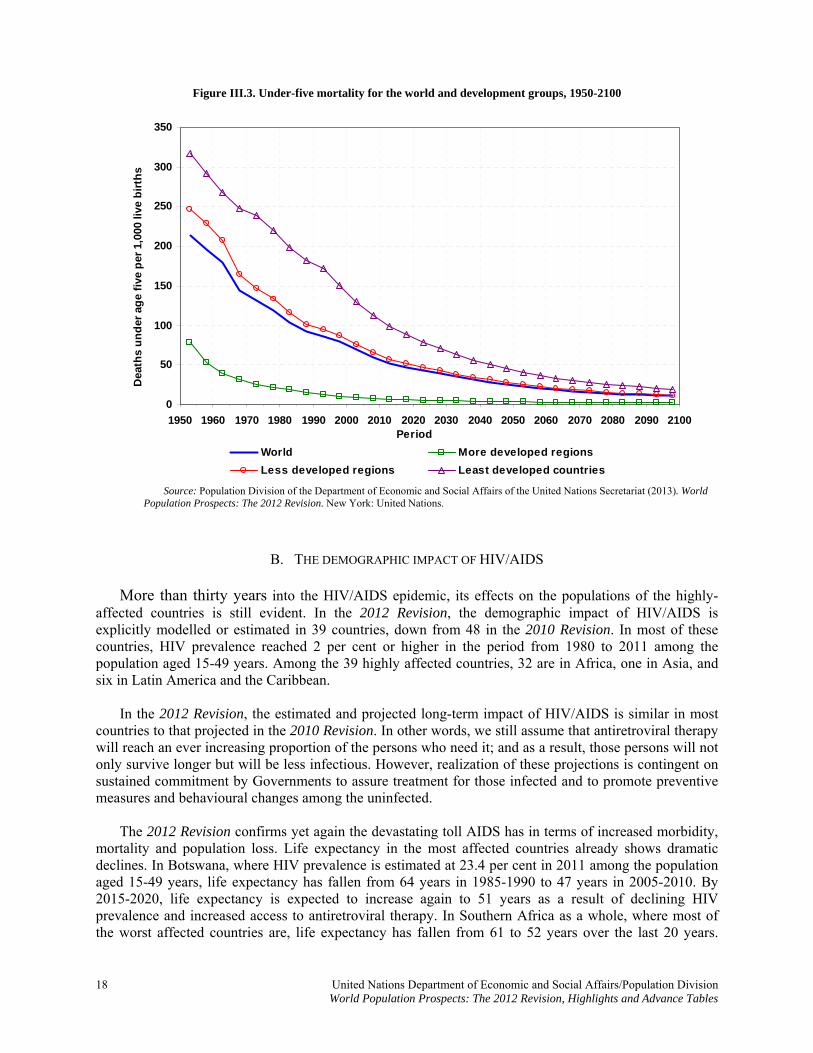
Figure III.3. Under-five mortality for the world and development groups, 1950-2100
0
50
100
150
200
250
300
350
1950 1960 1970 1980 1990 2000 2010 2020 2030 2040 2050 2060 2070 2080 2090 2100Period
Dea
ths
un
der
ag
e fi
ve p
er 1
,000
live
bir
ths
World More developed regions
Less developed regions Least developed countries
Source: Population Division of the Department of Economic and Social Affairs of the United Nations Secretariat (2013). World Population Prospects: The 2012 Revision. New York: United Nations.
B. THE DEMOGRAPHIC IMPACT OF HIV/AIDS
More than thirty years into the HIV/AIDS epidemic, its effects on the populations of the highly-affected countries is still evident. In the 2012 Revision, the demographic impact of HIV/AIDS is explicitly modelled or estimated in 39 countries, down from 48 in the 2010 Revision. In most of these countries, HIV prevalence reached 2 per cent or higher in the period from 1980 to 2011 among the population aged 15-49 years. Among the 39 highly affected countries, 32 are in Africa, one in Asia, and six in Latin America and the Caribbean. In the 2012 Revision, the estimated and projected long-term impact of HIV/AIDS is similar in most countries to that projected in the 2010 Revision. In other words, we still assume that antiretroviral therapy will reach an ever increasing proportion of the persons who need it; and as a result, those persons will not only survive longer but will be less infectious. However, realization of these projections is contingent on sustained commitment by Governments to assure treatment for those infected and to promote preventive measures and behavioural changes among the uninfected. The 2012 Revision confirms yet again the devastating toll AIDS has in terms of increased morbidity, mortality and population loss. Life expectancy in the most affected countries already shows dramatic declines. In Botswana, where HIV prevalence is estimated at 23.4 per cent in 2011 among the population aged 15-49 years, life expectancy has fallen from 64 years in 1985-1990 to 47 years in 2005-2010. By 2015-2020, life expectancy is expected to increase again to 51 years as a result of declining HIV prevalence and increased access to antiretroviral therapy. In Southern Africa as a whole, where most of the worst affected countries are, life expectancy has fallen from 61 to 52 years over the last 20 years.
18 United Nations Department of Economic and Social Affairs/Population Division World Population Prospects: The 2012 Revision, Highlights and Advance Tables
United Nations Department of Economic and Social Affairs/Population Division 19 World Population Prospects: The 2012 Revision, Highlights and Advance Tables
While the impact in Southern Africa is particularly stark, the majority of highly affected countries in Africa have experienced declines in life expectancy in the past twenty years because of the epidemic. The toll that HIV/AIDS is taking is already retarding progress in reducing child mortality. The impact of HIV on child mortality is particularly dramatic in countries that had achieved relatively low levels of child mortality before the epidemic began. In Zimbabwe, for instance, where under-five mortality was one of the lowest in sub-Saharan Africa, it has risen from 87 child deaths per 1,000 births in 1985-1990 to 99 per 1,000 in 2000-2005 and is projected to decline to 53 per 1,000 in 2010-2015. In Swaziland, under-five mortality has risen from 108 to 127 deaths per 1,000 births between 1985-1990 and 2000-2005, and is expected to decline to 92 deaths per 1,000 in 2010-2015. The impact of HIV/AIDS on child mortality is projected to decrease in the future with improved prevention of mother-to-child transmission and expanding coverage for HIV/AIDS treatment. Despite the effect of the epidemic on reducing population growth rates, the populations of affected countries are generally expected to be larger by mid-century than today, mainly because most of them maintain high to moderate fertility levels. In fact, owing to the downward revision of the prevalence of HIV/AIDS combined with the expected expansion of access to antiretroviral therapy and efforts to control the further spread of HIV, all the countries with the highest prevalence in 2011 are expected to experience positive population growth rates between 2005 and 2050.

IV. INTERNATIONAL MIGRATION International migration is the component of population change most difficult to measure and estimate reliably. Thus, the quality and quantity of the data used in the estimation and projection of net migration varies considerably by country. Furthermore, the movement of people across international boundaries, which is very often a response to changing socio-economic, political and environmental forces, is subject to a great deal of volatility. Refugee movements, for instance, may involve large numbers of people moving across boundaries in a short time. For these reasons, projections of future international migration levels are the least robust part of current population projections and reflect mainly a continuation of recent levels and trends in net migration. For those reasons, it was decided to provide an overview of the projections of migration until 2050. Estimates of net migration between the development groups show that since 1960 the more developed regions have been net gainers of emigrants from the less developed regions (table IV.1). Furthermore, net migration to the more developed regions has been increasing steadily from 1960 to 2010. During 2000-2010, the level of net migration to the more developed regions as a whole reached a peak of 3.46 million migrants annually. Within that period, Europe was the major area that had the highest level of net migration (1.88 million annually). Over the projection period, net migration to the more developed regions is projected to decline smoothly to about 2.3 million per year during 2040-2050, while the number of net migrants in Northern America is projected to remain almost constant at 1.2 million. With respect to the other major areas, Asia was by far the major source of migrants during 2000-2010 (1.78 million annually), followed by Latin America and the Caribbean (1.16 million annually) and then Africa (0.39 million annually). Over the projection period, Asia alone accounts for over half of all the net number of emigrants from the less developed regions to the more developed regions. At the country level, during 2000-2010, 32 of the 45 developed countries have been net receivers of international migrants. This group includes traditional countries of immigration such as Australia, Canada, New Zealand and the United States, most of the populous countries in Northern, Southern and Western Europe as well as the Russian Federation and Japan. The movement of people from less developed regions to more developed regions has dominated the world migration patterns for almost half a century, but flows among developing countries have also been important. Several developing countries or areas have been attracting migrants in large numbers, including, Israel, Kuwait, Malaysia, Qatar, Saudi Arabia, Singapore, South Africa, Thailand and the United Arab Emirates. Jordan and the Syrian Arab Republic have been the primary receivers of refugees from Iraq. Many African countries have been the destination of refugee flows from neighbouring countries. During 2000-2010, the countries having the highest levels of net emigration included Bangladesh, China, India, Indonesia, Mexico and the Philippines. Pakistan also registered high levels of net emigration, partly as a result of the repatriation of Afghani refugees. Though the results are not portrayed in table IV.1, the assumption for international migration after 2050 is that net migration will gradually decline and reach zero by 2100 in each country. We realize that this assumption is very unlikely to be realized but it is quite impossible to predict the levels of immigration or emigration within each country of the world for such a far horizon. Sending countries of today may become receiving countries and vice versa.
United Nations Department of Economic and Social Affairs/Population Division 21 World Population Prospects: The 2012 Revision, Highlights and Advance Tables
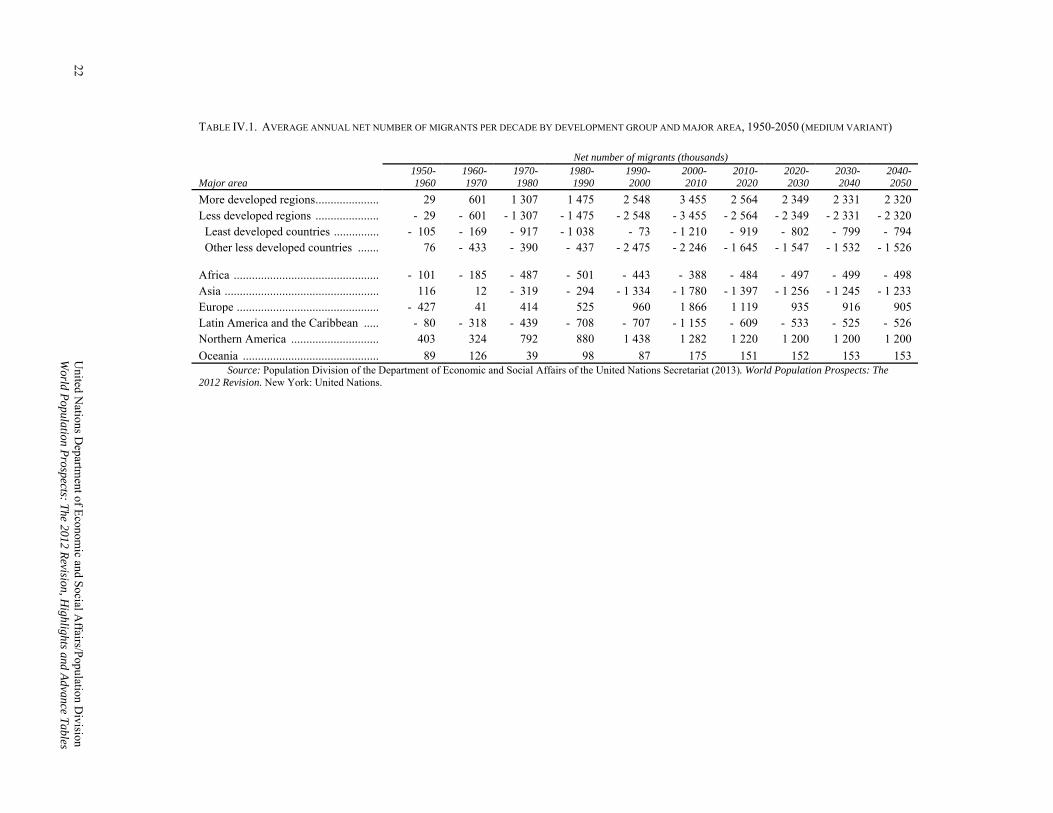
TABLE IV.1. AVERAGE ANNUAL NET NUMBER OF MIGRANTS PER DECADE BY DEVELOPMENT GROUP AND MAJOR AREA, 1950-2050 (MEDIUM VARIANT)
Net number of migrants (thousands)
Major area 1950-1960
1960-1970
1970-1980
1980-1990
1990-2000
2000-2010
2010-2020
2020-2030
2030-2040
2040-2050
More developed regions..................... 29 601 1 307 1 475 2 548 3 455 2 564 2 349 2 331 2 320 Less developed regions ..................... - 29 - 601 - 1 307 - 1 475 - 2 548 - 3 455 - 2 564 - 2 349 - 2 331 - 2 320 Least developed countries ............... - 105 - 169 - 917 - 1 038 - 73 - 1 210 - 919 - 802 - 799 - 794 Other less developed countries ....... 76 - 433 - 390 - 437 - 2 475 - 2 246 - 1 645 - 1 547 - 1 532 - 1 526 Africa ................................................ - 101 - 185 - 487 - 501 - 443 - 388 - 484 - 497 - 499 - 498 Asia ................................................... 116 12 - 319 - 294 - 1 334 - 1 780 - 1 397 - 1 256 - 1 245 - 1 233 Europe ............................................... - 427 41 414 525 960 1 866 1 119 935 916 905 Latin America and the Caribbean ..... - 80 - 318 - 439 - 708 - 707 - 1 155 - 609 - 533 - 525 - 526 Northern America ............................. 403 324 792 880 1 438 1 282 1 220 1 200 1 200 1 200
Oceania ............................................. 89 126 39 98 87 175 151 152 153 153 Source: Population Division of the Department of Economic and Social Affairs of the United Nations Secretariat (2013). World Population Prospects: The 2012 Revision. New York: United Nations.
22 United N
ations Departm
ent of Econom
ic and Social A
ffairs/Population D
ivision
World P
opulation Prospects: T
he 2012 Revision, H
ighlights and Advance T
ables
V. ASSUMPTIONS UNDERLYING THE 2012 REVISION The preparation of each new revision of the official population estimates and projections of the United Nations involves two distinct processes: (a) the incorporation of all new and relevant information regarding the past demographic dynamics of the population of each country or area of the world; and (b) the formulation of detailed assumptions about the future paths of fertility, mortality and international migration. The data sources used and the methods applied in revising past estimates of demographic indicators (i.e., those referring to 1950-2010) are presented online27 and in an Excel file (WPP2012_F02_METAINFO.XLS). The future population of each country is projected starting with an estimated population for 1 July 2010. Because population data are not necessarily available for that date, the 2010 estimate is derived from the most recent population data available for each country, obtained usually from a population census or a population register, projected to 2010 using all available data on fertility, mortality and international migration trends between the reference date of the population data available and 1 July 2010. In cases where data on the components of population change relative to the past 5 or 10 years are not available, estimated demographic trends are projections based on the most recent available data. Population data from all sources are evaluated for completeness, accuracy and consistency, and adjusted as necessary. To project the population until 2100, the United Nations Population Division uses assumptions regarding future trends in fertility, mortality and international migration. Because future trends cannot be known with certainty, a number of projection variants are produced. The following paragraphs summarize the main assumptions underlying the derivation of demographic indicators for the period starting in 2010 and ending in 2100.
A. FERTILITY ASSUMPTIONS: CONVERGENCE TOWARD LOW FERTILITY The fertility assumptions are described in terms of the following groups of countries:
High-fertility countries: Countries that until 2010 had no fertility reduction or only an incipient decline;
Medium-fertility countries: Countries where fertility has been declining but whose estimated
level is above the replacement level of 2.1 children per woman in 2005-2010; Low-fertility countries: Countries with total fertility at or below the replacement level of 2.1
children per woman in 2005-2010.
1. Medium-fertility assumption The 2012 Revision of the World Population Prospects uses the same probabilistic method for projecting total fertility as the 2010 Revision with two notable enhancements. First, the new revision incorporates the latest information from the 2010 round of censuses as well as newly-available surveys. Second, once countries reach below-replacement fertility the long-term fertility assumption is more data-driven and country-specific compared to previous assumptions. The method for long-term fertility projections was developed in collaboration with the Probabilistic Projections Group of the Center for Statistics and the Social Sciences (CSSS) of the University of Washington, and the Department of Statistics and Applied Probability and Saw Swee Hock School of Public Health of the National University
27 Data sources and related meta-information for the 2012 Revision of the World Population Prospects are available for each country from the following web page: http://esa.un.org/unpd/wpp/Documentation/data-sources.htm.
United Nations Department of Economic and Social Affairs/Population Division 23 World Population Prospects: The 2012 Revision, Highlights and Advance Tables
of Singapore.28 The method is based on empirical fertility trends estimated for the 2012 Revision for all countries29 of the world for the period 1950 to 2010 (or up to 2010-2015 for 37 countries with empirical data up to 2011 or 2012). There has been a general consensus that the evolution of fertility includes three broad phases (see figure V.1): (i) a high-fertility pre-transition phase, (ii) the fertility transition itself and (iii) a low-fertility post-transition phase during which fertility will probably fluctuate around or below 2.1 children per woman. These historic trends of fertility decline are re-estimated every second year by the United Nations Population Division, using the most recent empirical evidence from censuses, surveys, registers and other sources and after extensive re-evaluation of past historical trends in the light of all the information available and internal consistency checks with intercensal cohorts.
In past revisions of the World Population Prospects it was assumed that countries in the transition from high to low fertility will ultimately approach a fertility floor of 1.85 children per woman, regardless of their current position in the fertility transition. The transition from the current level of fertility to the fertility floor was expressed by three models of fertility change over time. These fertility projection models have been formalized since the 2004 Revision using a double-logistic function, defined by six deterministic parameters.30 For countries that were below replacement level, a much simpler model of fertility change was used. In general, it was assumed that fertility would recover from very low levels of fertility, following a uniform pace that would also converge to the fertility floor of 1.85 children per woman, just as in the high and medium fertility countries. The new probabilistic method used in the 2010 and 2012 Revisions for projecting total fertility consists of two separate processes: The first process models the sequence of change from high to low fertility (phase II of the fertility transition). For countries that are going through this fertility transition, the pace of the fertility decline is decomposed into a systematic decline and random distortion terms. The pace of the systematic decline in total fertility is modelled as a function of its level, based on the current UN methodology using a double-logistic decline function. The parameters of the double-logistic function are estimated using a Bayesian Hierarchical Model (BHM), which results in country-specific distributions for the parameters of the decline. These distributions are informed by historical trends within the country, as well as the variability in historical fertility trends of all countries that have already experienced a fertility decline. This approach not only allows one to take better into account the historical experience of each country, but also to reflect the uncertainty about future fertility decline based upon the past experience of all other countries at similar levels of fertility. Under these conditions, the pace of decline and the limit to which fertility will decline vary for each projected trajectory. The model is hierarchical because in addition to the information available at the country level, a second-level (namely, the world's experience through the information of all countries) is also used to inform the statistical distributions of the parameters of the double-logistic. This is particularly important for countries at the beginning of their fertility transition because limited information exists as to their speed of decline and future trajectories, so the future potential trajectories (and speed of decline) are mostly informed by the world's experience and the variability in trends experienced in other countries at similar fertility levels in the past. The Bayesian statistical approach itself is particularly adapted to estimate the parameters of the double-logistic model
28 Alkema L., A.E. Raftery, P. Gerland, S.J. Clark, F. Pelletier, T. Buettner, G.K. Heilig (2011). Probabilistic Projections of the Total Fertility Rate for All Countries. Demography, vol. 48, number 3, pp. 815-839, doi: 10.1007/s13524-011-0040-5 and Working Paper of the Center for Statistics and the Social Sciences, University of Washington, 2010, vol. 97. URL http://www.csss.washington.edu/Papers/wp97.pdf; Raftery, A.E., L. Alkema, and P. Gerland (2013). Bayesian Population Projections for the United Nations. Statistical Science. In press. http://www.imstat.org/sts/future_papers.html. 29 Only countries or areas with 90,000 persons or more in 2013 are considered. 30 United Nations, Department of Economic and Social Affairs, Population Division (2010). World Population Prospects. The 2006 Revision, Vol. III, ST/ESA/SER.A/263. Chapter VI. Methodology of the United Nations population estimates and projections, pp. 121-159. http://www.un.org/esa/population/publications/WPP2006RevVol_III/WPP2006RevVol_III_final.pdf.
24 United Nations Department of Economic and Social Affairs/Population Division World Population Prospects: The 2012 Revision, Highlights and Advance Tables
even when the number of empirical observations for each country is very limited (i.e., about 100 countries that started their fertility transition since the 1960s have nine or fewer observations). The second component of the projection model deals with countries once they have completed the demographic transition, and have reached Phase III of low fertility. For these countries, a time series model is used to project fertility which assumes that in the long run fertility will approach and fluctuate around country-specific ultimate fertility levels based on a Bayesian hierarchical model.31 The time series model uses the empirical evidence from low-fertility countries that have experienced fertility increases from a sub-replacement level after a completed fertility transition. Future long-term fertility levels in the 2012 Revision are now country-specific and informed by statistical distributions that incorporate the empirical experience of all low-fertility countries having already experienced a recovery, instead of the more normative assumption used in the 2010 Revision that was assuming a global long-term replacement-level of 2.1 children per woman. This new approach not only enables better accounting of the historical experience of each country, but also reflects the variability in historical fertility trends of all low-fertility countries, as well as the uncertainty about the pace of any potential fertility recovery and long-term fertility levels. The world mean parameter for the country-specific asymptotes is restricted to be no greater than the replacement level of 2.1 children per woman (with no lower limit, except to be greater than zero32). While the long-term assumption of a fertility increase is supported by the experience of many low-fertility countries in Europe and East Asia,33 the new approach additionally draws upon the country-specific experiences. In this approach, the projections for countries that have experienced extended periods of low fertility with no empirical evidence of an increase in fertility, can result in continuing low fertility levels with no fertility increase in the near future, as the research on “low fertility trap hypothesis” has argued for some low-fertility countries in Europe34 and East Asia.35 The two processes are schematically explained in figure V.1. During the observation period, the start of Phase II is determined by examining the maximum total fertility (or more precisely, the most recent local maximum within half a child of the global maximum to exclude random fluctuations in Phase I): the start of Phase II is deemed to be before 1950 for countries where this maximum is less than 5.5, and at the period of the local maximum for all other countries. The end of Phase II during the observation period is defined as the midpoint of the first two increases below 2 (if observed, else a country is still in Phase II).
31 Raftery, A.E., L. Alkema, and P. Gerland (2013). Bayesian Population Projections for the United Nations. Statistical Science. In press. http://www.imstat.org/sts/future_papers.html. 32 While the asymptote does not have an explicit lower bound, it does implicitly because any given total fertility trajectory is restricted not be smaller than 0.5 child. 33 Goldstein, J.R., T. Sobotka, and A. Jasilioniene (2009). The End of "Lowest-Low" Fertility? Population and Development Review, vol. 35, number 4, pp. 663-699. doi: 10.1111/j.1728-4457.2009.00304.x; Caltabiano, M., M. Castiglioni, and A. Rossina (2009). Lowest-low fertility: Signs of a recovery in Italy? Demographic Research, vol. 21, pp. 681–718. doi: 10.4054/DemRes.2009.21.23; Myrskyla, M., H.- P. Kohler, and F. C. Billari (2009). Advances in development reverse fertility declines. Nature, vol. 460, pp. 741–743. doi: 10.1038/nature08230; Sobotka, T. (2011). Fertility in Central and Eastern Europe after 1989: Collapse and Gradual Recovery. Historical Social Research-Historische Sozialforschung, vol. 36, number 2, pp. 246-296; Bongaarts, J.and T. Sobotka (2012). A Demographic Explanation for the Recent Rise in European Fertility. Population and Development Review 38(1):83-120. doi: 10.1111/j.1728-4457.2012.00473.x; Myrskylä, M., J.R. Goldstein, and Y.-h.A. Cheng (2013). New Cohort Fertility Forecasts for the Developed World: Rises, Falls, and Reversals. Population and Development Review 39(1):31-56. doi: 10.1111/j.1728-4457.2013.00572.x. 34 Wolfgang Lutz, V. Skirbekk, and M.R. Testa (2006). The Low Fertility Trap Hypothesis: Forces that May Lead to Further Postponement and Fewer Births in Europe. Vienna Yearbook of Population Research, Volume 4 (Postponement of Childbearing in Europe):167-192; Lutz, W. (2007). "The Future of Human Reproduction: Will Birth Rates Recover or Continue to Fall?" Ageing Horizons (7):15–21. 35 Jones, G.W., P.T. Straughan, and A.W.M. Chan (2009). Ultra-low fertility in Pacific Asia: trends, causes and policy issues. London; New York: Routledge; Frejka, T., G.W. Jones, and J.-P. Sardon (2010). East Asian Childbearing Patterns and Policy Developments. Population and Development Review 36(3):579-606. doi: 10.1111/j.1728-4457.2010.00347.x; Basten, S. (2013). Re-Examining the Fertility Assumptions for Pacific Asia in the UN's 2010 World Population Prospects. University of Oxford Department of Social Policy and Intervention, Barnett Papers in Social Research: 2013/1. Available at SSRN: http://www.spi.ox.ac.uk/fileadmin/documents/pdf/Barnett_Paper_13-01.pdf.
United Nations Department of Economic and Social Affairs/Population Division 25 World Population Prospects: The 2012 Revision, Highlights and Advance Tables
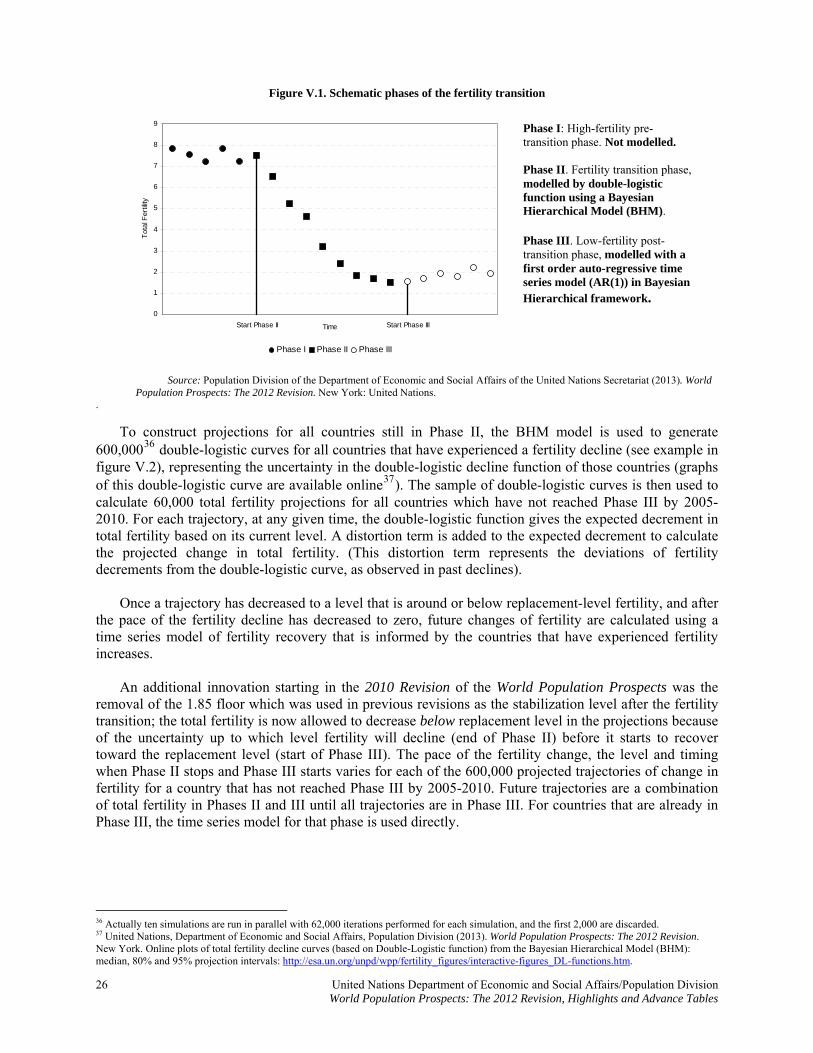
Figure V.1. Schematic phases of the fertility transition
Start Phase II Start Phase III
0
1
2
3
4
5
6
7
8
9
Time
Tot
al F
ertil
ity
Phase I Phase II Phase III
Phase I: High-fertility pre-transition phase. Not modelled. Phase II. Fertility transition phase, modelled by double-logistic function using a Bayesian Hierarchical Model (BHM).
Phase III. Low-fertility post-transition phase, modelled with a first order auto-regressive time series model (AR(1)) in Bayesian Hierarchical framework.
Source: Population Division of the Department of Economic and Social Affairs of the United Nations Secretariat (2013). World Population Prospects: The 2012 Revision. New York: United Nations.
.
To construct projections for all countries still in Phase II, the BHM model is used to generate 600,00036 double-logistic curves for all countries that have experienced a fertility decline (see example in figure V.2), representing the uncertainty in the double-logistic decline function of those countries (graphs of this double-logistic curve are available online37). The sample of double-logistic curves is then used to calculate 60,000 total fertility projections for all countries which have not reached Phase III by 2005-2010. For each trajectory, at any given time, the double-logistic function gives the expected decrement in total fertility based on its current level. A distortion term is added to the expected decrement to calculate the projected change in total fertility. (This distortion term represents the deviations of fertility decrements from the double-logistic curve, as observed in past declines). Once a trajectory has decreased to a level that is around or below replacement-level fertility, and after the pace of the fertility decline has decreased to zero, future changes of fertility are calculated using a time series model of fertility recovery that is informed by the countries that have experienced fertility increases. An additional innovation starting in the 2010 Revision of the World Population Prospects was the removal of the 1.85 floor which was used in previous revisions as the stabilization level after the fertility transition; the total fertility is now allowed to decrease below replacement level in the projections because of the uncertainty up to which level fertility will decline (end of Phase II) before it starts to recover toward the replacement level (start of Phase III). The pace of the fertility change, the level and timing when Phase II stops and Phase III starts varies for each of the 600,000 projected trajectories of change in fertility for a country that has not reached Phase III by 2005-2010. Future trajectories are a combination of total fertility in Phases II and III until all trajectories are in Phase III. For countries that are already in Phase III, the time series model for that phase is used directly.
36 Actually ten simulations are run in parallel with 62,000 iterations performed for each simulation, and the first 2,000 are discarded. 37 United Nations, Department of Economic and Social Affairs, Population Division (2013). World Population Prospects: The 2012 Revision. New York. Online plots of total fertility decline curves (based on Double-Logistic function) from the Bayesian Hierarchical Model (BHM): median, 80% and 95% projection intervals: http://esa.un.org/unpd/wpp/fertility_figures/interactive-figures_DL-functions.htm.
26 United Nations Department of Economic and Social Affairs/Population Division World Population Prospects: The 2012 Revision, Highlights and Advance Tables
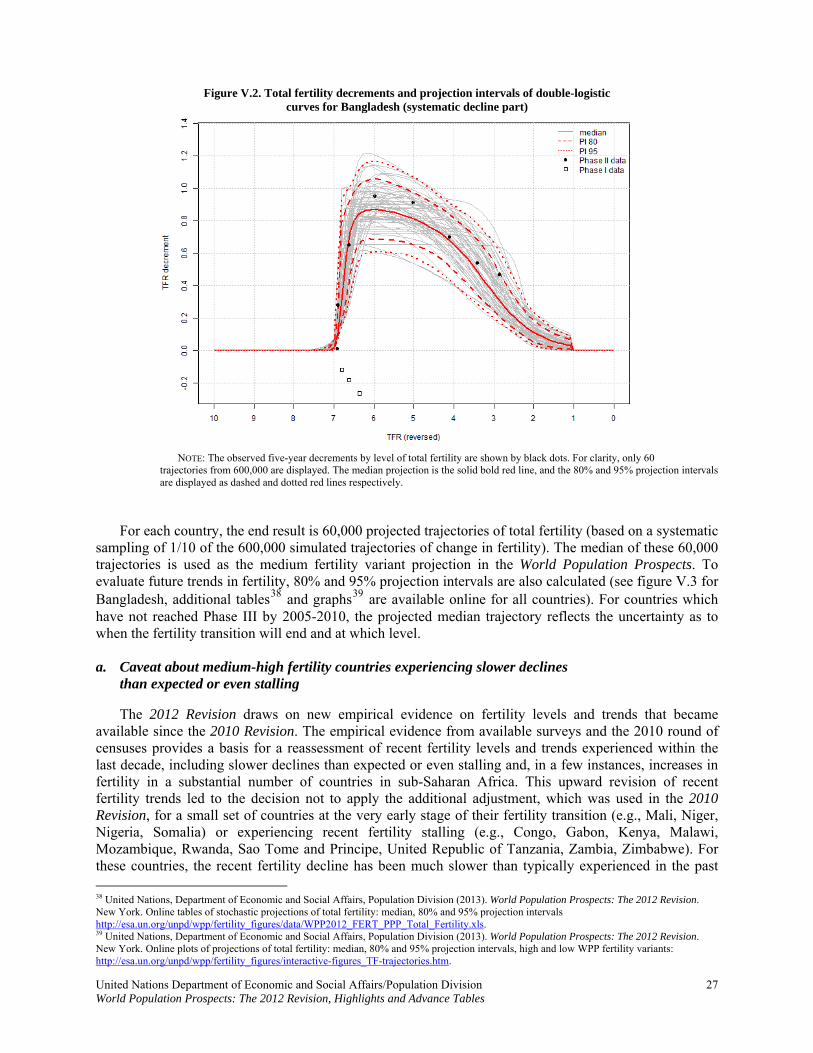
United Nations Department of Economic and Social Affairs/Population Division 27 World Population Prospects: The 2012 Revision, Highlights and Advance Tables
Figure V.2. Total fertility decrements and projection intervals of double-logistic curves for Bangladesh (systematic decline part)
NOTE: The observed five-year decrements by level of total fertility are shown by black dots. For clarity, only 60
trajectories from 600,000 are displayed. The median projection is the solid bold red line, and the 80% and 95% projection intervals are displayed as dashed and dotted red lines respectively.
For each country, the end result is 60,000 projected trajectories of total fertility (based on a systematic sampling of 1/10 of the 600,000 simulated trajectories of change in fertility). The median of these 60,000 trajectories is used as the medium fertility variant projection in the World Population Prospects. To evaluate future trends in fertility, 80% and 95% projection intervals are also calculated (see figure V.3 for Bangladesh, additional tables38 and graphs39 are available online for all countries). For countries which have not reached Phase III by 2005-2010, the projected median trajectory reflects the uncertainty as to when the fertility transition will end and at which level. a. Caveat about medium-high fertility countries experiencing slower declines than expected or even stalling The 2012 Revision draws on new empirical evidence on fertility levels and trends that became available since the 2010 Revision. The empirical evidence from available surveys and the 2010 round of censuses provides a basis for a reassessment of recent fertility levels and trends experienced within the last decade, including slower declines than expected or even stalling and, in a few instances, increases in fertility in a substantial number of countries in sub-Saharan Africa. This upward revision of recent fertility trends led to the decision not to apply the additional adjustment, which was used in the 2010 Revision, for a small set of countries at the very early stage of their fertility transition (e.g., Mali, Niger, Nigeria, Somalia) or experiencing recent fertility stalling (e.g., Congo, Gabon, Kenya, Malawi, Mozambique, Rwanda, Sao Tome and Principe, United Republic of Tanzania, Zambia, Zimbabwe). For these countries, the recent fertility decline has been much slower than typically experienced in the past 38 United Nations, Department of Economic and Social Affairs, Population Division (2013). World Population Prospects: The 2012 Revision. New York. Online tables of stochastic projections of total fertility: median, 80% and 95% projection intervals http://esa.un.org/unpd/wpp/fertility_figures/data/WPP2012_FERT_PPP_Total_Fertility.xls. 39 United Nations, Department of Economic and Social Affairs, Population Division (2013). World Population Prospects: The 2012 Revision. New York. Online plots of projections of total fertility: median, 80% and 95% projection intervals, high and low WPP fertility variants: http://esa.un.org/unpd/wpp/fertility_figures/interactive-figures_TF-trajectories.htm.
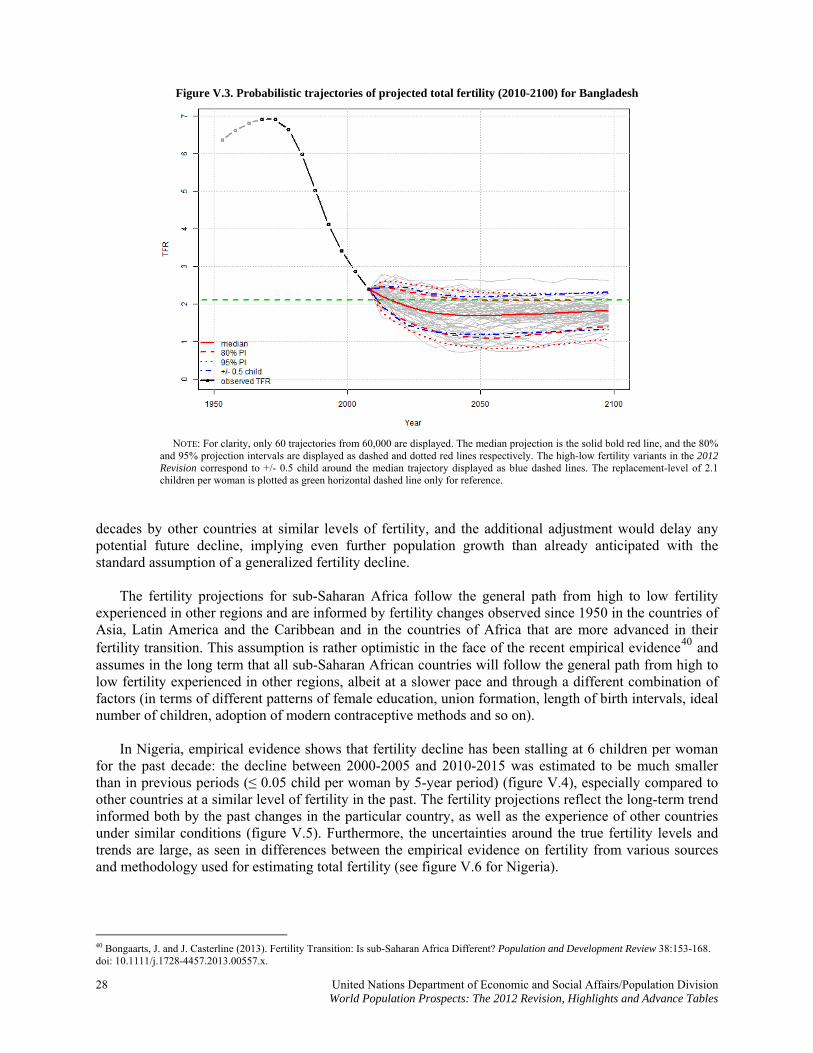
Figure V.3. Probabilistic trajectories of projected total fertility (2010-2100) for Bangladesh
NOTE: For clarity, only 60 trajectories from 60,000 are displayed. The median projection is the solid bold red line, and the 80% and 95% projection intervals are displayed as dashed and dotted red lines respectively. The high-low fertility variants in the 2012 Revision correspond to +/- 0.5 child around the median trajectory displayed as blue dashed lines. The replacement-level of 2.1 children per woman is plotted as green horizontal dashed line only for reference.
decades by other countries at similar levels of fertility, and the additional adjustment would delay any potential future decline, implying even further population growth than already anticipated with the standard assumption of a generalized fertility decline. The fertility projections for sub-Saharan Africa follow the general path from high to low fertility experienced in other regions and are informed by fertility changes observed since 1950 in the countries of Asia, Latin America and the Caribbean and in the countries of Africa that are more advanced in their fertility transition. This assumption is rather optimistic in the face of the recent empirical evidence40 and assumes in the long term that all sub-Saharan African countries will follow the general path from high to low fertility experienced in other regions, albeit at a slower pace and through a different combination of factors (in terms of different patterns of female education, union formation, length of birth intervals, ideal number of children, adoption of modern contraceptive methods and so on). In Nigeria, empirical evidence shows that fertility decline has been stalling at 6 children per woman for the past decade: the decline between 2000-2005 and 2010-2015 was estimated to be much smaller than in previous periods (≤ 0.05 child per woman by 5-year period) (figure V.4), especially compared to other countries at a similar level of fertility in the past. The fertility projections reflect the long-term trend informed both by the past changes in the particular country, as well as the experience of other countries under similar conditions (figure V.5). Furthermore, the uncertainties around the true fertility levels and trends are large, as seen in differences between the empirical evidence on fertility from various sources and methodology used for estimating total fertility (see figure V.6 for Nigeria).
40 Bongaarts, J. and J. Casterline (2013). Fertility Transition: Is sub-Saharan Africa Different? Population and Development Review 38:153-168. doi: 10.1111/j.1728-4457.2013.00557.x.
28 United Nations Department of Economic and Social Affairs/Population Division World Population Prospects: The 2012 Revision, Highlights and Advance Tables
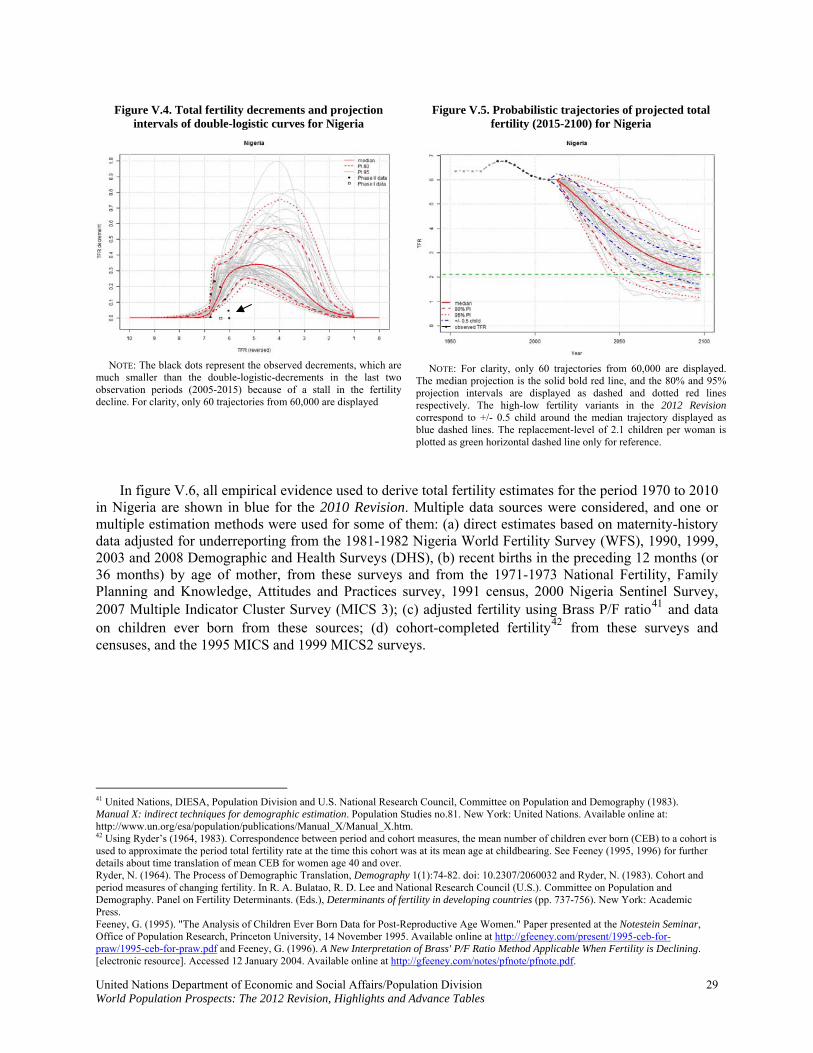
Figure V.4. Total fertility decrements and projection
intervals of double-logistic curves for Nigeria Figure V.5. Probabilistic trajectories of projected total
fertility (2015-2100) for Nigeria
NOTE: The black dots represent the observed decrements, which are much smaller than the double-logistic-decrements in the last two observation periods (2005-2015) because of a stall in the fertility decline. For clarity, only 60 trajectories from 60,000 are displayed
NOTE: For clarity, only 60 trajectories from 60,000 are displayed. The median projection is the solid bold red line, and the 80% and 95% projection intervals are displayed as dashed and dotted red lines respectively. The high-low fertility variants in the 2012 Revision correspond to +/- 0.5 child around the median trajectory displayed as blue dashed lines. The replacement-level of 2.1 children per woman is plotted as green horizontal dashed line only for reference.
In figure V.6, all empirical evidence used to derive total fertility estimates for the period 1970 to 2010 in Nigeria are shown in blue for the 2010 Revision. Multiple data sources were considered, and one or multiple estimation methods were used for some of them: (a) direct estimates based on maternity-history data adjusted for underreporting from the 1981-1982 Nigeria World Fertility Survey (WFS), 1990, 1999, 2003 and 2008 Demographic and Health Surveys (DHS), (b) recent births in the preceding 12 months (or 36 months) by age of mother, from these surveys and from the 1971-1973 National Fertility, Family Planning and Knowledge, Attitudes and Practices survey, 1991 census, 2000 Nigeria Sentinel Survey, 2007 Multiple Indicator Cluster Survey (MICS 3); (c) adjusted fertility using Brass P/F ratio41 and data on children ever born from these sources; (d) cohort-completed fertility42 from these surveys and censuses, and the 1995 MICS and 1999 MICS2 surveys.
41 United Nations, DIESA, Population Division and U.S. National Research Council, Committee on Population and Demography (1983). Manual X: indirect techniques for demographic estimation. Population Studies no.81. New York: United Nations. Available online at: http://www.un.org/esa/population/publications/Manual_X/Manual_X.htm. 42 Using Ryder’s (1964, 1983). Correspondence between period and cohort measures, the mean number of children ever born (CEB) to a cohort is used to approximate the period total fertility rate at the time this cohort was at its mean age at childbearing. See Feeney (1995, 1996) for further details about time translation of mean CEB for women age 40 and over. Ryder, N. (1964). The Process of Demographic Translation, Demography 1(1):74-82. doi: 10.2307/2060032 and Ryder, N. (1983). Cohort and period measures of changing fertility. In R. A. Bulatao, R. D. Lee and National Research Council (U.S.). Committee on Population and Demography. Panel on Fertility Determinants. (Eds.), Determinants of fertility in developing countries (pp. 737-756). New York: Academic Press. Feeney, G. (1995). "The Analysis of Children Ever Born Data for Post-Reproductive Age Women." Paper presented at the Notestein Seminar, Office of Population Research, Princeton University, 14 November 1995. Available online at http://gfeeney.com/present/1995-ceb-for-praw/1995-ceb-for-praw.pdf and Feeney, G. (1996). A New Interpretation of Brass' P/F Ratio Method Applicable When Fertility is Declining. [electronic resource]. Accessed 12 January 2004. Available online at http://gfeeney.com/notes/pfnote/pfnote.pdf.
United Nations Department of Economic and Social Affairs/Population Division 29 World Population Prospects: The 2012 Revision, Highlights and Advance Tables
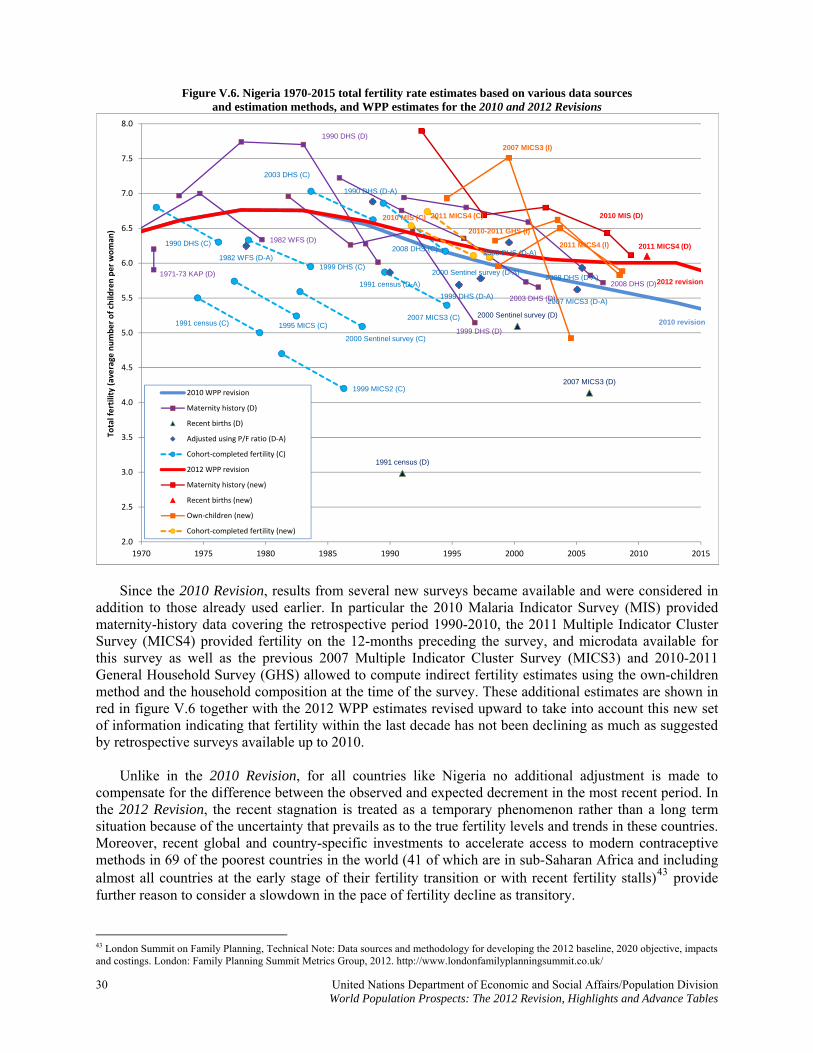
Figure V.6. Nigeria 1970-2015 total fertility rate estimates based on various data sources and estimation methods, and WPP estimates for the 2010 and 2012 Revisions
2010 revision
1971-73 KAP (D)
1982 WFS (D)
1990 DHS (D)
1999 DHS (D)
2003 DHS (D)
2008 DHS (D)
1991 census (D)
2000 Sentinel survey (D)
2007 MICS3 (D)
1982 WFS (D-A)
1990 DHS (D-A)
1991 census (D-A)
1999 DHS (D-A)
2000 Sentinel survey (D-A)
2003 DHS (D-A)
2007 MICS3 (D-A)
2008 DHS (D-A)
1990 DHS (C)
1991 census (C) 1995 MICS (C)
1999 DHS (C)
1999 MICS2 (C)
2000 Sentinel survey (C)
2003 DHS (C)
2007 MICS3 (C)
2008 DHS (C)
2012 revision
2010 MIS (D)
2011 MICS4 (D)
2007 MICS3 (I)
2010-2011 GHS (I)
2011 MICS4 (I)
2010 MIS (C) 2011 MICS4 (C)
2.0
2.5
3.0
3.5
4.0
4.5
5.0
5.5
6.0
6.5
7.0
7.5
8.0
1970 1975 1980 1985 1990 1995 2000 2005 2010 2015
Total fertility (average
number of child
ren per woman
)
2010 WPP revision
Maternity history (D)
Recent births (D)
Adjusted using P/F ratio (D‐A)
Cohort‐completed fertility (C)
2012 WPP revision
Maternity history (new)
Recent births (new)
Own‐children (new)
Cohort‐completed fertility (new)
Since the 2010 Revision, results from several new surveys became available and were considered in addition to those already used earlier. In particular the 2010 Malaria Indicator Survey (MIS) provided maternity-history data covering the retrospective period 1990-2010, the 2011 Multiple Indicator Cluster Survey (MICS4) provided fertility on the 12-months preceding the survey, and microdata available for this survey as well as the previous 2007 Multiple Indicator Cluster Survey (MICS3) and 2010-2011 General Household Survey (GHS) allowed to compute indirect fertility estimates using the own-children method and the household composition at the time of the survey. These additional estimates are shown in red in figure V.6 together with the 2012 WPP estimates revised upward to take into account this new set of information indicating that fertility within the last decade has not been declining as much as suggested by retrospective surveys available up to 2010. Unlike in the 2010 Revision, for all countries like Nigeria no additional adjustment is made to compensate for the difference between the observed and expected decrement in the most recent period. In the 2012 Revision, the recent stagnation is treated as a temporary phenomenon rather than a long term situation because of the uncertainty that prevails as to the true fertility levels and trends in these countries. Moreover, recent global and country-specific investments to accelerate access to modern contraceptive methods in 69 of the poorest countries in the world (41 of which are in sub-Saharan Africa and including almost all countries at the early stage of their fertility transition or with recent fertility stalls)43 provide further reason to consider a slowdown in the pace of fertility decline as transitory.
43 London Summit on Family Planning, Technical Note: Data sources and methodology for developing the 2012 baseline, 2020 objective, impacts and costings. London: Family Planning Summit Metrics Group, 2012. http://www.londonfamilyplanningsummit.co.uk/
30 United Nations Department of Economic and Social Affairs/Population Division World Population Prospects: The 2012 Revision, Highlights and Advance Tables
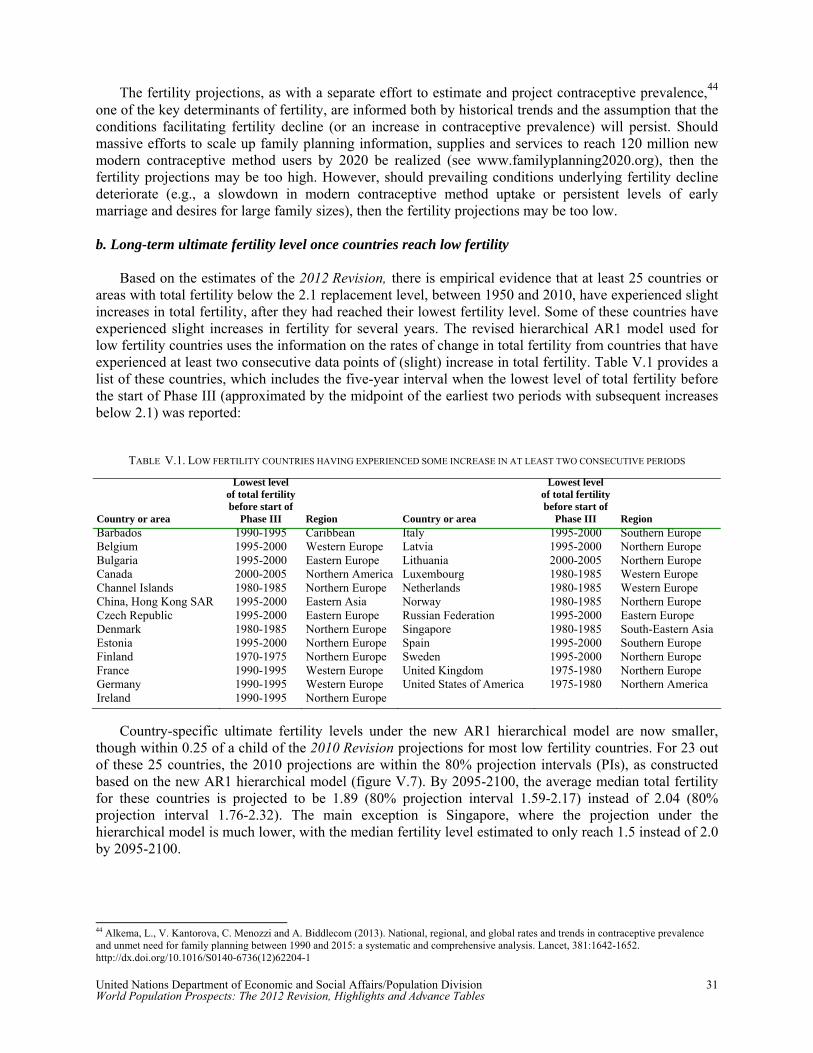
United Nations Department of Economic and Social Affairs/Population Division 31 World Population Prospects: The 2012 Revision, Highlights and Advance Tables
The fertility projections, as with a separate effort to estimate and project contraceptive prevalence,44 one of the key determinants of fertility, are informed both by historical trends and the assumption that the conditions facilitating fertility decline (or an increase in contraceptive prevalence) will persist. Should massive efforts to scale up family planning information, supplies and services to reach 120 million new modern contraceptive method users by 2020 be realized (see www.familyplanning2020.org), then the fertility projections may be too high. However, should prevailing conditions underlying fertility decline deteriorate (e.g., a slowdown in modern contraceptive method uptake or persistent levels of early marriage and desires for large family sizes), then the fertility projections may be too low. b. Long-term ultimate fertility level once countries reach low fertility Based on the estimates of the 2012 Revision, there is empirical evidence that at least 25 countries or areas with total fertility below the 2.1 replacement level, between 1950 and 2010, have experienced slight increases in total fertility, after they had reached their lowest fertility level. Some of these countries have experienced slight increases in fertility for several years. The revised hierarchical AR1 model used for low fertility countries uses the information on the rates of change in total fertility from countries that have experienced at least two consecutive data points of (slight) increase in total fertility. Table V.1 provides a list of these countries, which includes the five-year interval when the lowest level of total fertility before the start of Phase III (approximated by the midpoint of the earliest two periods with subsequent increases below 2.1) was reported:
TABLE V.1. LOW FERTILITY COUNTRIES HAVING EXPERIENCED SOME INCREASE IN AT LEAST TWO CONSECUTIVE PERIODS
Country or area
Lowest level of total fertility before start of
Phase III Region Country or area
Lowest level of total fertility before start of
Phase III Region Barbados 1990-1995 Caribbean Italy 1995-2000 Southern Europe Belgium 1995-2000 Western Europe Latvia 1995-2000 Northern Europe Bulgaria 1995-2000 Eastern Europe Lithuania 2000-2005 Northern Europe Canada 2000-2005 Northern America Luxembourg 1980-1985 Western Europe Channel Islands 1980-1985 Northern Europe Netherlands 1980-1985 Western Europe China, Hong Kong SAR 1995-2000 Eastern Asia Norway 1980-1985 Northern Europe Czech Republic 1995-2000 Eastern Europe Russian Federation 1995-2000 Eastern Europe Denmark 1980-1985 Northern Europe Singapore 1980-1985 South-Eastern Asia Estonia 1995-2000 Northern Europe Spain 1995-2000 Southern Europe Finland 1970-1975 Northern Europe Sweden 1995-2000 Northern Europe France 1990-1995 Western Europe United Kingdom 1975-1980 Northern Europe Germany 1990-1995 Western Europe United States of America 1975-1980 Northern America Ireland 1990-1995 Northern Europe
Country-specific ultimate fertility levels under the new AR1 hierarchical model are now smaller, though within 0.25 of a child of the 2010 Revision projections for most low fertility countries. For 23 out of these 25 countries, the 2010 projections are within the 80% projection intervals (PIs), as constructed based on the new AR1 hierarchical model (figure V.7). By 2095-2100, the average median total fertility for these countries is projected to be 1.89 (80% projection interval 1.59-2.17) instead of 2.04 (80% projection interval 1.76-2.32). The main exception is Singapore, where the projection under the hierarchical model is much lower, with the median fertility level estimated to only reach 1.5 instead of 2.0 by 2095-2100.
44 Alkema, L., V. Kantorova, C. Menozzi and A. Biddlecom (2013). National, regional, and global rates and trends in contraceptive prevalence and unmet need for family planning between 1990 and 2015: a systematic and comprehensive analysis. Lancet, 381:1642-1652. http://dx.doi.org/10.1016/S0140-6736(12)62204-1
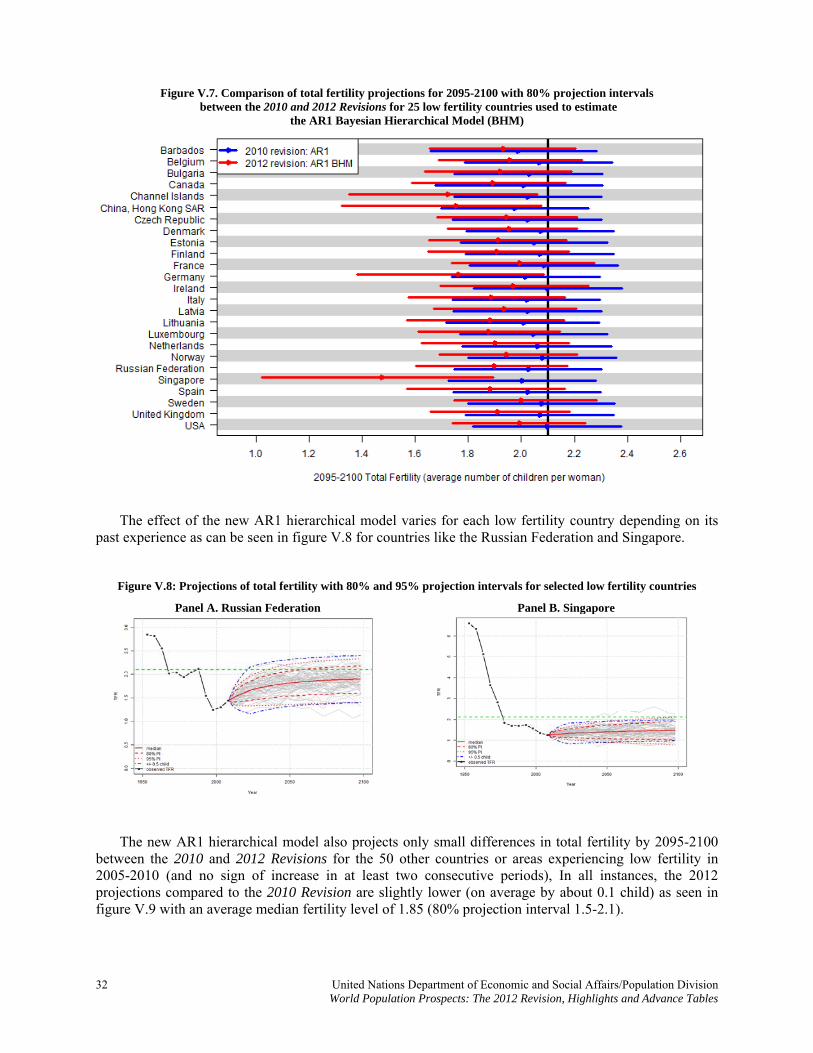
Figure V.7. Comparison of total fertility projections for 2095-2100 with 80% projection intervals between the 2010 and 2012 Revisions for 25 low fertility countries used to estimate
the AR1 Bayesian Hierarchical Model (BHM)
The effect of the new AR1 hierarchical model varies for each low fertility country depending on its past experience as can be seen in figure V.8 for countries like the Russian Federation and Singapore.
Figure V.8: Projections of total fertility with 80% and 95% projection intervals for selected low fertility countries
Panel A. Russian Federation
Panel B. Singapore
The new AR1 hierarchical model also projects only small differences in total fertility by 2095-2100 between the 2010 and 2012 Revisions for the 50 other countries or areas experiencing low fertility in 2005-2010 (and no sign of increase in at least two consecutive periods), In all instances, the 2012 projections compared to the 2010 Revision are slightly lower (on average by about 0.1 child) as seen in figure V.9 with an average median fertility level of 1.85 (80% projection interval 1.5-2.1).
32 United Nations Department of Economic and Social Affairs/Population Division World Population Prospects: The 2012 Revision, Highlights and Advance Tables
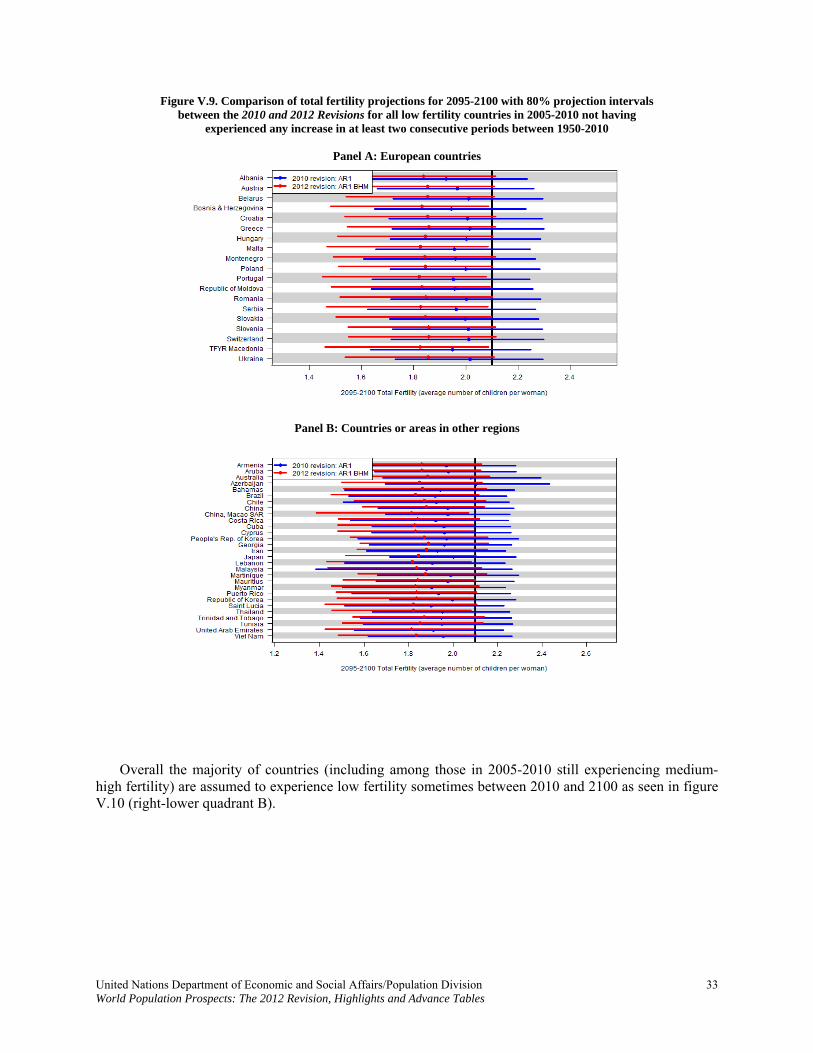
Figure V.9. Comparison of total fertility projections for 2095-2100 with 80% projection intervals between the 2010 and 2012 Revisions for all low fertility countries in 2005-2010 not having
experienced any increase in at least two consecutive periods between 1950-2010
Panel A: European countries
Panel B: Countries or areas in other regions
Overall the majority of countries (including among those in 2005-2010 still experiencing medium-high fertility) are assumed to experience low fertility sometimes between 2010 and 2100 as seen in figure V.10 (right-lower quadrant B).
United Nations Department of Economic and Social Affairs/Population Division 33 World Population Prospects: The 2012 Revision, Highlights and Advance Tables
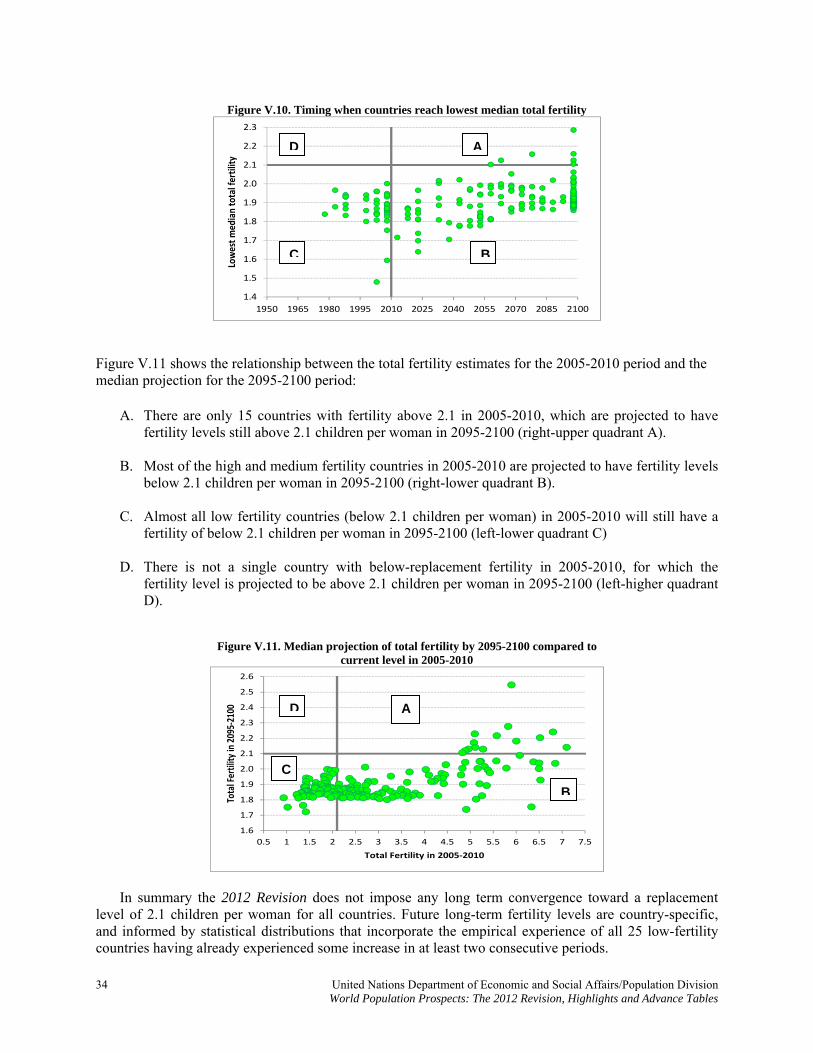
Figure V.10. Timing when countries reach lowest median total fertility
1.4
1.5
1.6
1.7
1.8
1.9
2.0
2.1
2.2
2.3
1950 1965 1980 1995 2010 2025 2040 2055 2070 2085 2100
Lowest med
ian total fertility
Figure V.11 shows the relationship between the total fertility estimates for the 2005-2010 period and the median projection for the 2095-2100 period:
A. There are only 15 countries with fertility above 2.1 in 2005-2010, which are projected to have fertility levels still above 2.1 children per woman in 2095-2100 (right-upper quadrant A).
B. Most of the high and medium fertility countries in 2005-2010 are projected to have fertility levels
below 2.1 children per woman in 2095-2100 (right-lower quadrant B).
C. Almost all low fertility countries (below 2.1 children per woman) in 2005-2010 will still have a fertility of below 2.1 children per woman in 2095-2100 (left-lower quadrant C)
D. There is not a single country with below-replacement fertility in 2005-2010, for which the
fertility level is projected to be above 2.1 children per woman in 2095-2100 (left-higher quadrant D).
Figure V.11. Median projection of total fertility by 2095-2100 compared to current level in 2005-2010
1.6
1.7
1.8
1.9
2.0
2.1
2.2
2.3
2.4
2.5
2.6
0.5 1 1.5 2 2.5 3 3.5 4 4.5 5 5.5 6 6.5 7 7.5
Total Fertility
in 209
5‐2100
Total Fertility in 2005‐2010
D A
C B
D A
C
B
In summary the 2012 Revision does not impose any long term convergence toward a replacement level of 2.1 children per woman for all countries. Future long-term fertility levels are country-specific, and informed by statistical distributions that incorporate the empirical experience of all 25 low-fertility countries having already experienced some increase in at least two consecutive periods.
34 United Nations Department of Economic and Social Affairs/Population Division World Population Prospects: The 2012 Revision, Highlights and Advance Tables
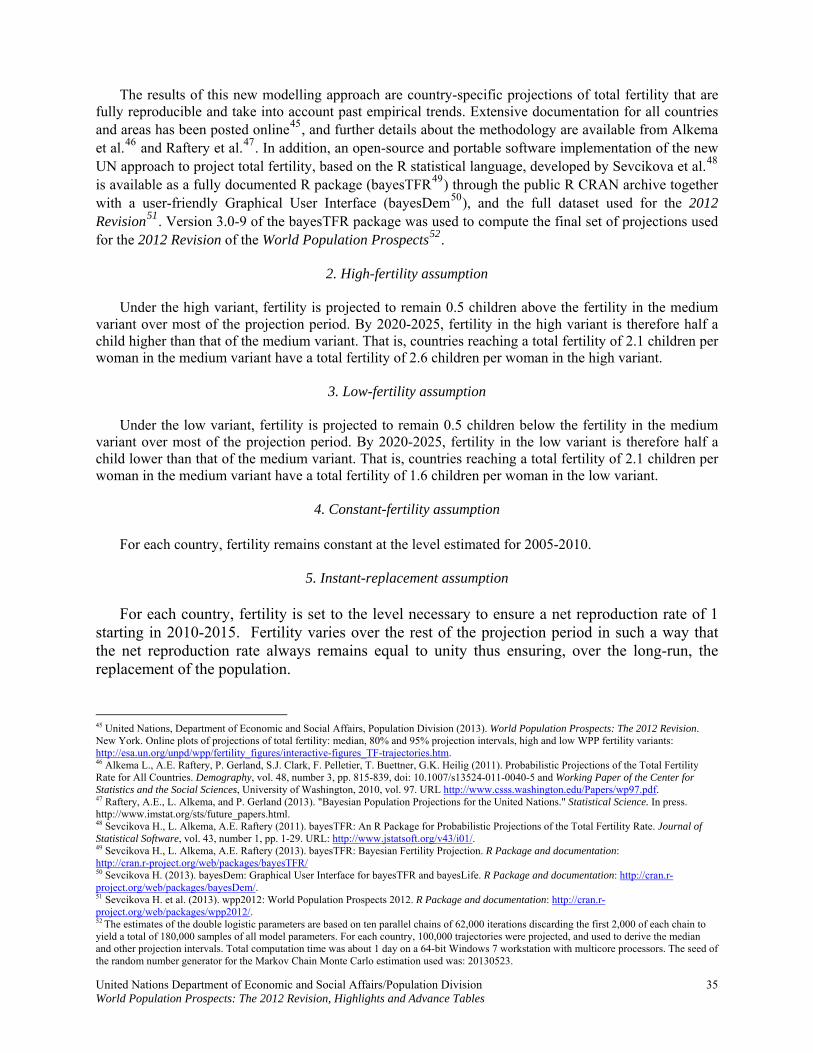
The results of this new modelling approach are country-specific projections of total fertility that are fully reproducible and take into account past empirical trends. Extensive documentation for all countries and areas has been posted online45, and further details about the methodology are available from Alkema et al.46 and Raftery et al.47. In addition, an open-source and portable software implementation of the new UN approach to project total fertility, based on the R statistical language, developed by Sevcikova et al.48 is available as a fully documented R package (bayesTFR49) through the public R CRAN archive together with a user-friendly Graphical User Interface (bayesDem50), and the full dataset used for the 2012 Revision51. Version 3.0-9 of the bayesTFR package was used to compute the final set of projections used for the 2012 Revision of the World Population Prospects52.
2. High-fertility assumption Under the high variant, fertility is projected to remain 0.5 children above the fertility in the medium variant over most of the projection period. By 2020-2025, fertility in the high variant is therefore half a child higher than that of the medium variant. That is, countries reaching a total fertility of 2.1 children per woman in the medium variant have a total fertility of 2.6 children per woman in the high variant.
3. Low-fertility assumption Under the low variant, fertility is projected to remain 0.5 children below the fertility in the medium variant over most of the projection period. By 2020-2025, fertility in the low variant is therefore half a child lower than that of the medium variant. That is, countries reaching a total fertility of 2.1 children per woman in the medium variant have a total fertility of 1.6 children per woman in the low variant.
4. Constant-fertility assumption
For each country, fertility remains constant at the level estimated for 2005-2010.
5. Instant-replacement assumption For each country, fertility is set to the level necessary to ensure a net reproduction rate of 1 starting in 2010-2015. Fertility varies over the rest of the projection period in such a way that the net reproduction rate always remains equal to unity thus ensuring, over the long-run, the replacement of the population.
45 United Nations, Department of Economic and Social Affairs, Population Division (2013). World Population Prospects: The 2012 Revision. New York. Online plots of projections of total fertility: median, 80% and 95% projection intervals, high and low WPP fertility variants: http://esa.un.org/unpd/wpp/fertility_figures/interactive-figures_TF-trajectories.htm. 46 Alkema L., A.E. Raftery, P. Gerland, S.J. Clark, F. Pelletier, T. Buettner, G.K. Heilig (2011). Probabilistic Projections of the Total Fertility Rate for All Countries. Demography, vol. 48, number 3, pp. 815-839, doi: 10.1007/s13524-011-0040-5 and Working Paper of the Center for Statistics and the Social Sciences, University of Washington, 2010, vol. 97. URL http://www.csss.washington.edu/Papers/wp97.pdf. 47 Raftery, A.E., L. Alkema, and P. Gerland (2013). "Bayesian Population Projections for the United Nations." Statistical Science. In press. http://www.imstat.org/sts/future_papers.html. 48 Sevcikova H., L. Alkema, A.E. Raftery (2011). bayesTFR: An R Package for Probabilistic Projections of the Total Fertility Rate. Journal of Statistical Software, vol. 43, number 1, pp. 1-29. URL: http://www.jstatsoft.org/v43/i01/. 49 Sevcikova H., L. Alkema, A.E. Raftery (2013). bayesTFR: Bayesian Fertility Projection. R Package and documentation: http://cran.r-project.org/web/packages/bayesTFR/ 50 Sevcikova H. (2013). bayesDem: Graphical User Interface for bayesTFR and bayesLife. R Package and documentation: http://cran.r-project.org/web/packages/bayesDem/. 51 Sevcikova H. et al. (2013). wpp2012: World Population Prospects 2012. R Package and documentation: http://cran.r-project.org/web/packages/wpp2012/. 52 The estimates of the double logistic parameters are based on ten parallel chains of 62,000 iterations discarding the first 2,000 of each chain to yield a total of 180,000 samples of all model parameters. For each country, 100,000 trajectories were projected, and used to derive the median and other projection intervals. Total computation time was about 1 day on a 64-bit Windows 7 workstation with multicore processors. The seed of the random number generator for the Markov Chain Monte Carlo estimation used was: 20130523.
United Nations Department of Economic and Social Affairs/Population Division 35 World Population Prospects: The 2012 Revision, Highlights and Advance Tables
B. MORTALITY ASSUMPTIONS: INCREASING LIFE EXPECTANCY FOR MOST COUNTRIES
1. Normal-mortality assumption Assumptions are made in terms of life expectancy at birth by sex. As in previous Revisions, for countries where mortality was assumed to follow a declining trend starting in 2010, life expectancy was generally assumed to rise over the projection period for most countries. In contrast with the assumptions made about future fertility trends, only one variant of future mortality trends (median path) was used for each country for the standard projection variants (e.g., high, medium and low fertility variants). The 2012 Revision of the World Population Prospects uses new probabilistic methods for projecting life expectancy at birth building on the same approach used in earlier revisions (i.e., modelling of the pace of change of life expectancy at a given level of mortality), but incorporates recent methodological developments done in collaboration with the Probabilistic Projections Group of the Center for Statistics and the Social Sciences (CSSS) of the University of Washington53. The standard mortality projection assumption used for the 2012 Revision introduces two new innovations: (1) future values of female life expectancy at birth are based on a new probabilistic projection model of life expectancy at birth (random walk with drift model where the drift is determined by a Bayesian Hierarchical Model (BHM))54, and (2) future male life expectancies at birth take into account the correlation between female and male life expectancies and the fact that female life expectancy is typically higher than for males. In the 2012 Revision, the gap between female and male life expectancies is a function of female life expectancy and modelled using a new autoregressive model with an error term that has a Student’s t-distribution rather than a normal one, to account for outliers, often corresponding to periods of conflicts, disasters or crises55. The method is based on empirical mortality trends estimated for the 2012 Revision for all countries56 of the world (excluding those having ever experienced 2% or more adult HIV prevalence) for the period 1950 to 2010 (or up to 2010-2015 for Afghanistan and Syria). a. General approach The often dramatic decline of mortality was - and is - a driving force behind the profound changes to population trends observed during the past two centuries. While first limited to a small number of countries in the world, the decline of mortality and rise in life expectancy has now become a global phenomenon. In past revisions of the World Population Prospects, for countries where mortality was assumed to follow a declining trend starting in 2010, the pace of improvement of life expectancy at birth was set deterministically for each sex and country based on one of five models of gains in life expectancy estimated from a broad empirical basis of increasing life expectancy during the period 1950 to 2005, covering life expectancies between 50 and about 85 years57. The models represented the average experience of this historical period grouped according to the 90th percentile (very fast, modelled on Japan), the 75th percentile (fast model) the arithmetic mean (medium model), the lowest 25th percentile (slow model), and the lowest 10th percentile (the very slow model). These models produce smaller gains
53 Raftery, A.E., N. Li, H. Ševčíková, P. Gerland, and G.K. Heilig (2012). "Bayesian probabilistic population projections for all countries." Proceedings of the National Academy of Sciences 109 (35):13915-13921. doi:10.1073/pnas.1211452109. 54 Raftery, A. E., J. E. Chunn, P. Gerland, and H. Ševčíková (2013). "Bayesian Probabilistic Projections of Life Expectancy for All Countries". Demography, 50(3), 777-801. doi:10.1007/s13524-012-0193-x. 55 Raftery, A. E., N. Lalic, and P. Gerland (2012). "Joint Probabilistic Projection of Female and Male Life Expectancy". Paper presented at the Annual Meeting of the Population Association of America, 3-5 May 2012, San Francisco, CA. http://paa2012.princeton.edu/download.aspx?submissionId=120140. 56 Only countries or areas with 90,000 persons or more in 2013 are considered. 57 United Nations, Department of Economic and Social Affairs, Population Division (2010). World Population Prospects. The 2006 Revision, Vol. III, ST/ESA/SER.A/263. Chapter VI. Methodology of the United Nations population estimates and projections, pp. 121-159. http://www.un.org/esa/population/publications/WPP2006RevVol_III/WPP2006RevVol_III_final.pdf.
36 United Nations Department of Economic and Social Affairs/Population Division World Population Prospects: The 2012 Revision, Highlights and Advance Tables
the higher the life expectancy already reached. The selection of a model for each country was based on recent trends in life expectancy by sex. For countries highly affected by the HIV/AIDS epidemic, the model incorporating a slow pace of mortality decline was generally used to project a certain slowdown in the reduction of general mortality risks not related to HIV/AIDS. The new probabilistic method used in the 2012 Revision for projecting life expectancy at birth is done in two separate steps: The first step focuses on progress made in female life expectancy at birth, and models the sequence of change from high to low mortality58. The transition from high to low mortality can be decomposed into two processes, each of which can be approximated by a logistic function. The first process consists of initial slow growth and diffusion of progress against mortality (e.g., small mortality improvements at low levels of life expectancy associated with diffusion of hygiene and improved nutrition), followed by a period of accelerated improvements, especially for infants and children (e.g., larger gains associated with greater social and economic development, mass immunization, etc.). The second process kicks in once the easiest gains have been achieved against infectious diseases, and produces continuing gains against non-communicable diseases. These improvements occur at a slower pace because of ever-greater challenges in preventing premature deaths at older ages resulting, among other things, from cardiovascular diseases and neoplasm, and to the delay of the onset of aging59. For all countries undergoing mortality transition, the pace of improvement in life expectancy at birth is decomposed into a systematic decline and random distortion terms. The pace of the systematic gains in life expectancy at birth is modelled as a function of its level, based on the current UN methodology using a double-logistic improvement function. The parameters of the double-logistic function are estimated using a Bayesian Hierarchical Model (BHM), which results in country-specific distributions for the parameters of the gains in life expectancy. These distributions are informed by historical trends within the country (including pre-1950 data for 29 countries with good vital registration60), as well as the variability in historical mortality trends of all countries. For the 2012 Revision, historical series have only been included in this analysis since 1870 due to the lack of clear mortality decline in the ten countries with earlier data. This approach not only allows to better take into account the historical experience of each country (at least since the 1950s for all countries), but also to reflect the uncertainty about future gains in life expectancy at birth based the past experience of all other countries at similar level of mortality. The model is hierarchical because in addition to the information available at the country level, a second-level (i.e., the world's experience through the information of all the countries) is used to inform the statistical distributions of the parameters of the double-logistic. Under these conditions, the pace of improvement and the asymptotic limit in future gains in female life expectancy vary for each projected trajectory, but ultimately is informed and constrained by the finding that the rate of increase of maximum female life expectancy over the past 150 years has been
58 Raftery, A. E., J. E. Chunn, P. Gerland, and H. Ševčíková (2013). "Bayesian Probabilistic Projections of Life Expectancy for All Countries". Demography, 50(3), 777-801. doi:10.1007/s13524-012-0193-x. 59 Fogel, R.W. (2004). The escape from hunger and premature death, 1700–2100: Europe, America, and the Third World. Cambridge, UK: Cambridge University Press. Riley, J. C. (2001). Rising life expectancy: A global history. Cambridge, UK: Cambridge University Press. 60 Consolidated historical dataset (e0F_supplemental.txt and e0M_supplemental.txt for female and male respectively) for 29 countries or areas covering the period 1750-1950 (including 20 countries with data since at least 1900) as part of the R Package used for this analysis (bayesLife and wpp2012), and based on a series for 5-year periods from the following sources: (1) University of California at Berkeley (USA), and Max Planck Institute for Demographic Research (Germany). (2012). Human Mortality Database Available at www.mortality.org or www.humanmortality.de. Data downloaded on 9 Jan. 2012; (2) University of California at Berkeley (USA), Max Planck Institute for Demographic Research (Germany), and Institut National d’Etudes Demographiques (France). Human Life-Table Database (2011). Available at www.lifetable.de. Data downloaded on 29 Dec. 2011; (3) Statistics Finland (2006). Statistical Yearbook of Finland 2006; (4) Hungarian Central Statistical Office (2006). Hungary Demographic Yearbook 2005; (5) Japan Ministry of Internal Affairs and Communication (2012). Historical Statistics of Japan. Available at: www.stat.go.jp/english/data/chouki/; (6) Andreev E.M. et al. (1998). Demographic History of Russia 1927-1959. Informatika, Moscow.
United Nations Department of Economic and Social Affairs/Population Division 37 World Population Prospects: The 2012 Revision, Highlights and Advance Tables
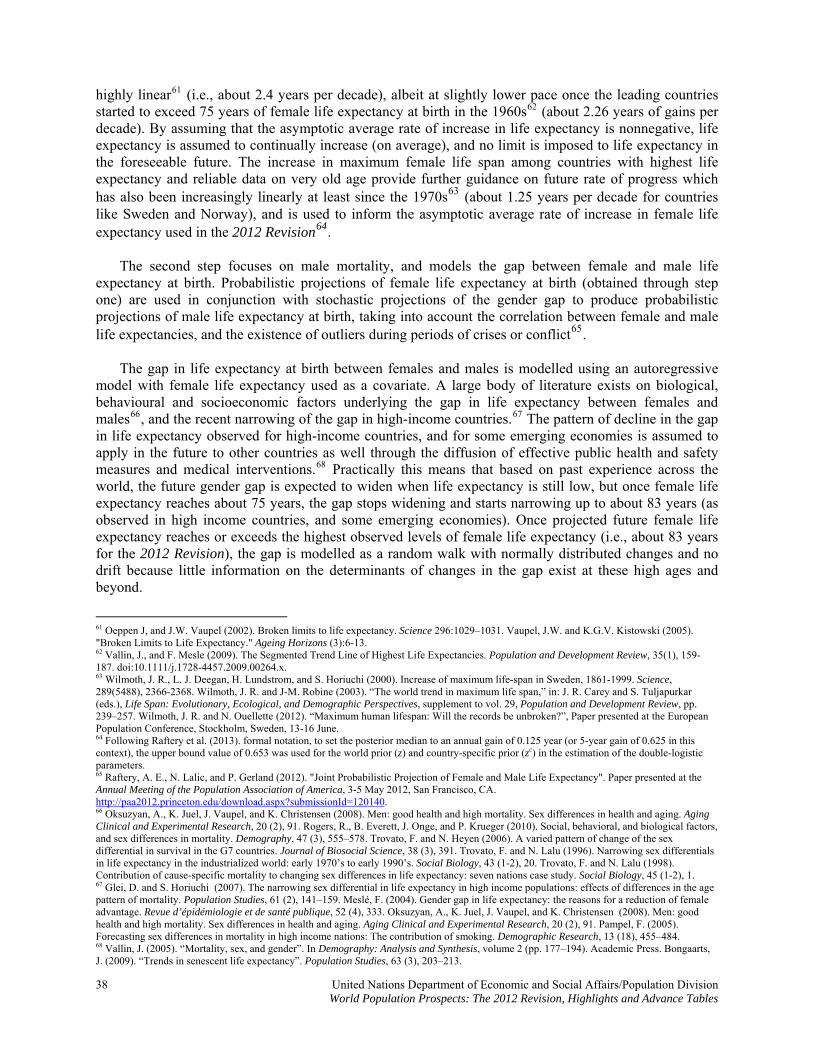
highly linear61 (i.e., about 2.4 years per decade), albeit at slightly lower pace once the leading countries started to exceed 75 years of female life expectancy at birth in the 1960s62 (about 2.26 years of gains per decade). By assuming that the asymptotic average rate of increase in life expectancy is nonnegative, life expectancy is assumed to continually increase (on average), and no limit is imposed to life expectancy in the foreseeable future. The increase in maximum female life span among countries with highest life expectancy and reliable data on very old age provide further guidance on future rate of progress which has also been increasingly linearly at least since the 1970s63 (about 1.25 years per decade for countries like Sweden and Norway), and is used to inform the asymptotic average rate of increase in female life expectancy used in the 2012 Revision64. The second step focuses on male mortality, and models the gap between female and male life expectancy at birth. Probabilistic projections of female life expectancy at birth (obtained through step one) are used in conjunction with stochastic projections of the gender gap to produce probabilistic projections of male life expectancy at birth, taking into account the correlation between female and male life expectancies, and the existence of outliers during periods of crises or conflict65. The gap in life expectancy at birth between females and males is modelled using an autoregressive model with female life expectancy used as a covariate. A large body of literature exists on biological, behavioural and socioeconomic factors underlying the gap in life expectancy between females and males66, and the recent narrowing of the gap in high-income countries.67 The pattern of decline in the gap in life expectancy observed for high-income countries, and for some emerging economies is assumed to apply in the future to other countries as well through the diffusion of effective public health and safety measures and medical interventions.68 Practically this means that based on past experience across the world, the future gender gap is expected to widen when life expectancy is still low, but once female life expectancy reaches about 75 years, the gap stops widening and starts narrowing up to about 83 years (as observed in high income countries, and some emerging economies). Once projected future female life expectancy reaches or exceeds the highest observed levels of female life expectancy (i.e., about 83 years for the 2012 Revision), the gap is modelled as a random walk with normally distributed changes and no drift because little information on the determinants of changes in the gap exist at these high ages and beyond.
61 Oeppen J, and J.W. Vaupel (2002). Broken limits to life expectancy. Science 296:1029–1031. Vaupel, J.W. and K.G.V. Kistowski (2005). "Broken Limits to Life Expectancy." Ageing Horizons (3):6-13. 62 Vallin, J., and F. Mesle (2009). The Segmented Trend Line of Highest Life Expectancies. Population and Development Review, 35(1), 159-187. doi:10.1111/j.1728-4457.2009.00264.x. 63 Wilmoth, J. R., L. J. Deegan, H. Lundstrom, and S. Horiuchi (2000). Increase of maximum life-span in Sweden, 1861-1999. Science, 289(5488), 2366-2368. Wilmoth, J. R. and J-M. Robine (2003). “The world trend in maximum life span,” in: J. R. Carey and S. Tuljapurkar (eds.), Life Span: Evolutionary, Ecological, and Demographic Perspectives, supplement to vol. 29, Population and Development Review, pp. 239–257. Wilmoth, J. R. and N. Ouellette (2012). “Maximum human lifespan: Will the records be unbroken?”, Paper presented at the European Population Conference, Stockholm, Sweden, 13-16 June. 64 Following Raftery et al. (2013). formal notation, to set the posterior median to an annual gain of 0.125 year (or 5-year gain of 0.625 in this context), the upper bound value of 0.653 was used for the world prior (z) and country-specific prior (zc) in the estimation of the double-logistic parameters. 65 Raftery, A. E., N. Lalic, and P. Gerland (2012). "Joint Probabilistic Projection of Female and Male Life Expectancy". Paper presented at the Annual Meeting of the Population Association of America, 3-5 May 2012, San Francisco, CA. http://paa2012.princeton.edu/download.aspx?submissionId=120140. 66 Oksuzyan, A., K. Juel, J. Vaupel, and K. Christensen (2008). Men: good health and high mortality. Sex differences in health and aging. Aging Clinical and Experimental Research, 20 (2), 91. Rogers, R., B. Everett, J. Onge, and P. Krueger (2010). Social, behavioral, and biological factors, and sex differences in mortality. Demography, 47 (3), 555–578. Trovato, F. and N. Heyen (2006). A varied pattern of change of the sex differential in survival in the G7 countries. Journal of Biosocial Science, 38 (3), 391. Trovato, F. and N. Lalu (1996). Narrowing sex differentials in life expectancy in the industrialized world: early 1970’s to early 1990’s. Social Biology, 43 (1-2), 20. Trovato, F. and N. Lalu (1998). Contribution of cause-specific mortality to changing sex differences in life expectancy: seven nations case study. Social Biology, 45 (1-2), 1. 67 Glei, D. and S. Horiuchi (2007). The narrowing sex differential in life expectancy in high income populations: effects of differences in the age pattern of mortality. Population Studies, 61 (2), 141–159. Meslé, F. (2004). Gender gap in life expectancy: the reasons for a reduction of female advantage. Revue d’épidémiologie et de santé publique, 52 (4), 333. Oksuzyan, A., K. Juel, J. Vaupel, and K. Christensen (2008). Men: good health and high mortality. Sex differences in health and aging. Aging Clinical and Experimental Research, 20 (2), 91. Pampel, F. (2005). Forecasting sex differences in mortality in high income nations: The contribution of smoking. Demographic Research, 13 (18), 455–484. 68 Vallin, J. (2005). “Mortality, sex, and gender”. In Demography: Analysis and Synthesis, volume 2 (pp. 177–194). Academic Press. Bongaarts, J. (2009). “Trends in senescent life expectancy”. Population Studies, 63 (3), 203–213.
38 United Nations Department of Economic and Social Affairs/Population Division World Population Prospects: The 2012 Revision, Highlights and Advance Tables
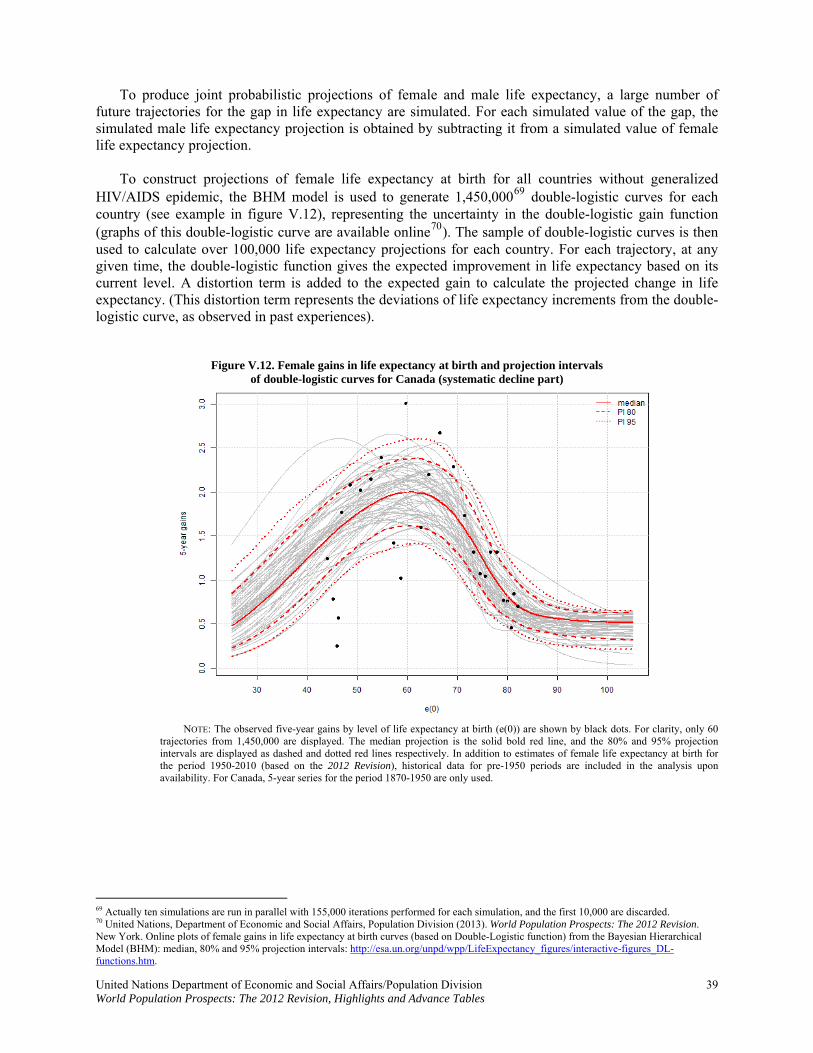
To produce joint probabilistic projections of female and male life expectancy, a large number of future trajectories for the gap in life expectancy are simulated. For each simulated value of the gap, the simulated male life expectancy projection is obtained by subtracting it from a simulated value of female life expectancy projection. To construct projections of female life expectancy at birth for all countries without generalized HIV/AIDS epidemic, the BHM model is used to generate 1,450,00069 double-logistic curves for each country (see example in figure V.12), representing the uncertainty in the double-logistic gain function (graphs of this double-logistic curve are available online70). The sample of double-logistic curves is then used to calculate over 100,000 life expectancy projections for each country. For each trajectory, at any given time, the double-logistic function gives the expected improvement in life expectancy based on its current level. A distortion term is added to the expected gain to calculate the projected change in life expectancy. (This distortion term represents the deviations of life expectancy increments from the double-logistic curve, as observed in past experiences).
Figure V.12. Female gains in life expectancy at birth and projection intervals of double-logistic curves for Canada (systematic decline part)
NOTE: The observed five-year gains by level of life expectancy at birth (e(0)) are shown by black dots. For clarity, only 60 trajectories from 1,450,000 are displayed. The median projection is the solid bold red line, and the 80% and 95% projection intervals are displayed as dashed and dotted red lines respectively. In addition to estimates of female life expectancy at birth for the period 1950-2010 (based on the 2012 Revision), historical data for pre-1950 periods are included in the analysis upon availability. For Canada, 5-year series for the period 1870-1950 are only used.
69 Actually ten simulations are run in parallel with 155,000 iterations performed for each simulation, and the first 10,000 are discarded. 70 United Nations, Department of Economic and Social Affairs, Population Division (2013). World Population Prospects: The 2012 Revision. New York. Online plots of female gains in life expectancy at birth curves (based on Double-Logistic function) from the Bayesian Hierarchical Model (BHM): median, 80% and 95% projection intervals: http://esa.un.org/unpd/wpp/LifeExpectancy_figures/interactive-figures_DL-functions.htm.
United Nations Department of Economic and Social Affairs/Population Division 39 World Population Prospects: The 2012 Revision, Highlights and Advance Tables
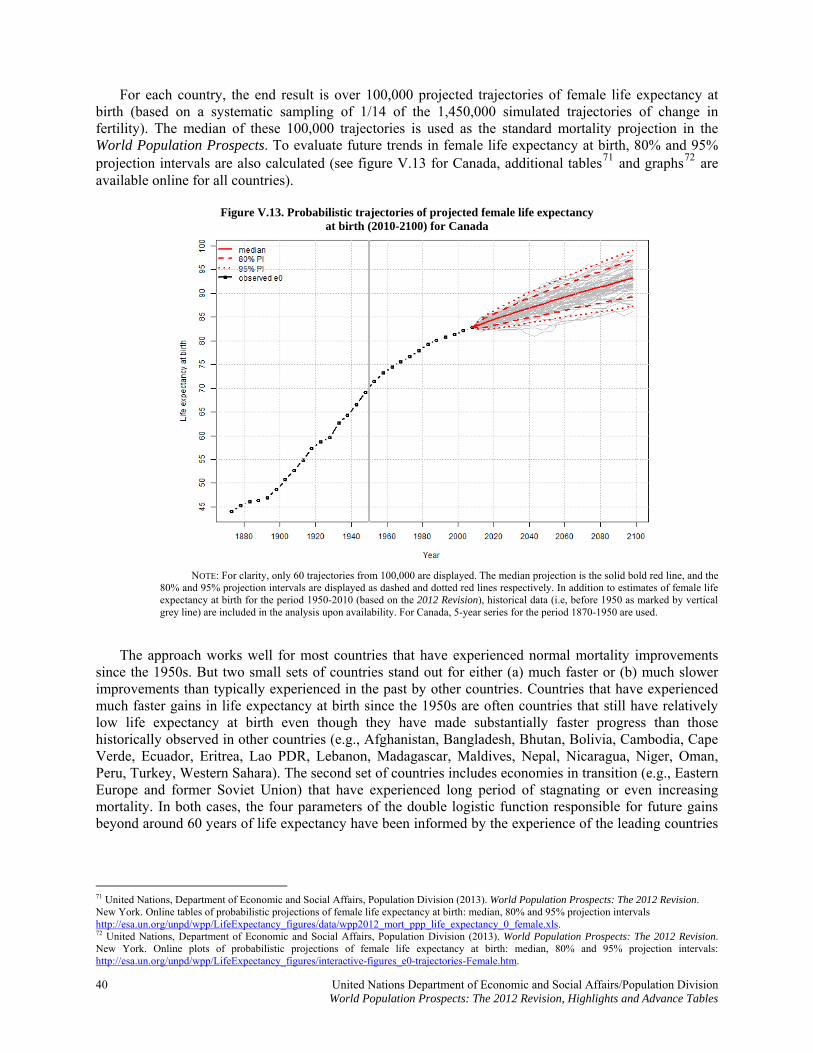
For each country, the end result is over 100,000 projected trajectories of female life expectancy at birth (based on a systematic sampling of 1/14 of the 1,450,000 simulated trajectories of change in fertility). The median of these 100,000 trajectories is used as the standard mortality projection in the World Population Prospects. To evaluate future trends in female life expectancy at birth, 80% and 95% projection intervals are also calculated (see figure V.13 for Canada, additional tables71 and graphs72 are available online for all countries).
Figure V.13. Probabilistic trajectories of projected female life expectancy at birth (2010-2100) for Canada
NOTE: For clarity, only 60 trajectories from 100,000 are displayed. The median projection is the solid bold red line, and the 80% and 95% projection intervals are displayed as dashed and dotted red lines respectively. In addition to estimates of female life expectancy at birth for the period 1950-2010 (based on the 2012 Revision), historical data (i.e, before 1950 as marked by vertical grey line) are included in the analysis upon availability. For Canada, 5-year series for the period 1870-1950 are used.
The approach works well for most countries that have experienced normal mortality improvements since the 1950s. But two small sets of countries stand out for either (a) much faster or (b) much slower improvements than typically experienced in the past by other countries. Countries that have experienced much faster gains in life expectancy at birth since the 1950s are often countries that still have relatively low life expectancy at birth even though they have made substantially faster progress than those historically observed in other countries (e.g., Afghanistan, Bangladesh, Bhutan, Bolivia, Cambodia, Cape Verde, Ecuador, Eritrea, Lao PDR, Lebanon, Madagascar, Maldives, Nepal, Nicaragua, Niger, Oman, Peru, Turkey, Western Sahara). The second set of countries includes economies in transition (e.g., Eastern Europe and former Soviet Union) that have experienced long period of stagnating or even increasing mortality. In both cases, the four parameters of the double logistic function responsible for future gains beyond around 60 years of life expectancy have been informed by the experience of the leading countries
71 United Nations, Department of Economic and Social Affairs, Population Division (2013). World Population Prospects: The 2012 Revision. New York. Online tables of probabilistic projections of female life expectancy at birth: median, 80% and 95% projection intervals http://esa.un.org/unpd/wpp/LifeExpectancy_figures/data/wpp2012_mort_ppp_life_expectancy_0_female.xls. 72 United Nations, Department of Economic and Social Affairs, Population Division (2013). World Population Prospects: The 2012 Revision. New York. Online plots of probabilistic projections of female life expectancy at birth: median, 80% and 95% projection intervals: http://esa.un.org/unpd/wpp/LifeExpectancy_figures/interactive-figures_e0-trajectories-Female.htm.
40 United Nations Department of Economic and Social Affairs/Population Division World Population Prospects: The 2012 Revision, Highlights and Advance Tables
in their region73. In the first case, this approach was used to temper over-optimistic gains for some countries in the distant future that would lead to implausible crossovers in long term projections (e.g., lagging countries today becoming leaders by 2100). In the second case, this approach was used to provide further guidance on long term potential gains for countries that have experienced mortality stagnation or worsening (i.e., in the long run these countries will gradually catch up with the more advanced countries in their region). To construct projections of male life expectancy at birth, the gender gap autoregressive model is used in conjunction with probabilistic projections of female life expectancy at birth to generate 100,000 trajectories for each country (see example in figure V.14), representing the uncertainty in the future gap between female and male life expectancy projections (graphs of the gender gap trajectories are available online74).
Figure V.14. Gap in female-male life expectancy at birth and projection intervals for Canada
NOTE: The observed gap between female and male life expectancy at birth are shown by black dots and solid line. For clarity, only 60 trajectories from 100,000 are displayed. The median projection is the solid bold red line, and the 80% and 95% projection intervals are displayed as dashed and dotted red lines respectively.
73 Following Raftery et al. (2013). formal notation, country-specific priors were specified for the first set of countries for the upper bound of the Δc3, Δc4, kc and zc double-logistic parameters while for the second set of countries lower bound were used for these parameters. In general, the upper quartile of the distribution of these parameters for the best performers in each region was used to inform other countries. 74 United Nations, Department of Economic and Social Affairs, Population Division (2013). World Population Prospects: The 2012 Revision. New York. Online plots of female-male gap in life expectancy at birth: median, 80% and 95% projection intervals: http://esa.un.org/unpd/wpp/LifeExpectancy_figures/interactive-figures_e0-MFGap.htm.
United Nations Department of Economic and Social Affairs/Population Division 41 World Population Prospects: The 2012 Revision, Highlights and Advance Tables
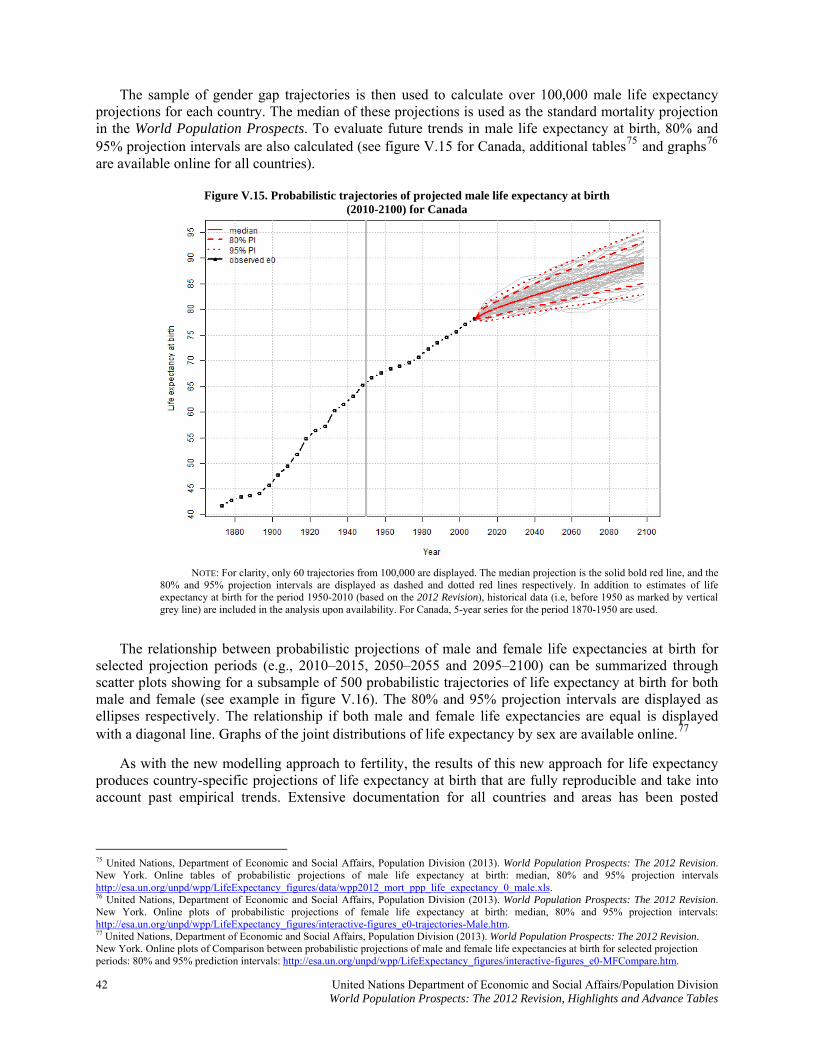
The sample of gender gap trajectories is then used to calculate over 100,000 male life expectancy projections for each country. The median of these projections is used as the standard mortality projection in the World Population Prospects. To evaluate future trends in male life expectancy at birth, 80% and 95% projection intervals are also calculated (see figure V.15 for Canada, additional tables75 and graphs76 are available online for all countries).
Figure V.15. Probabilistic trajectories of projected male life expectancy at birth (2010-2100) for Canada
NOTE: For clarity, only 60 trajectories from 100,000 are displayed. The median projection is the solid bold red line, and the 80% and 95% projection intervals are displayed as dashed and dotted red lines respectively. In addition to estimates of life expectancy at birth for the period 1950-2010 (based on the 2012 Revision), historical data (i.e, before 1950 as marked by vertical grey line) are included in the analysis upon availability. For Canada, 5-year series for the period 1870-1950 are used.
The relationship between probabilistic projections of male and female life expectancies at birth for selected projection periods (e.g., 2010–2015, 2050–2055 and 2095–2100) can be summarized through scatter plots showing for a subsample of 500 probabilistic trajectories of life expectancy at birth for both male and female (see example in figure V.16). The 80% and 95% projection intervals are displayed as ellipses respectively. The relationship if both male and female life expectancies are equal is displayed with a diagonal line. Graphs of the joint distributions of life expectancy by sex are available online.77
As with the new modelling approach to fertility, the results of this new approach for life expectancy produces country-specific projections of life expectancy at birth that are fully reproducible and take into account past empirical trends. Extensive documentation for all countries and areas has been posted
75 United Nations, Department of Economic and Social Affairs, Population Division (2013). World Population Prospects: The 2012 Revision. New York. Online tables of probabilistic projections of male life expectancy at birth: median, 80% and 95% projection intervals http://esa.un.org/unpd/wpp/LifeExpectancy_figures/data/wpp2012_mort_ppp_life_expectancy_0_male.xls. 76 United Nations, Department of Economic and Social Affairs, Population Division (2013). World Population Prospects: The 2012 Revision. New York. Online plots of probabilistic projections of female life expectancy at birth: median, 80% and 95% projection intervals: http://esa.un.org/unpd/wpp/LifeExpectancy_figures/interactive-figures_e0-trajectories-Male.htm. 77 United Nations, Department of Economic and Social Affairs, Population Division (2013). World Population Prospects: The 2012 Revision. New York. Online plots of Comparison between probabilistic projections of male and female life expectancies at birth for selected projection periods: 80% and 95% prediction intervals: http://esa.un.org/unpd/wpp/LifeExpectancy_figures/interactive-figures_e0-MFCompare.htm.
42 United Nations Department of Economic and Social Affairs/Population Division World Population Prospects: The 2012 Revision, Highlights and Advance Tables
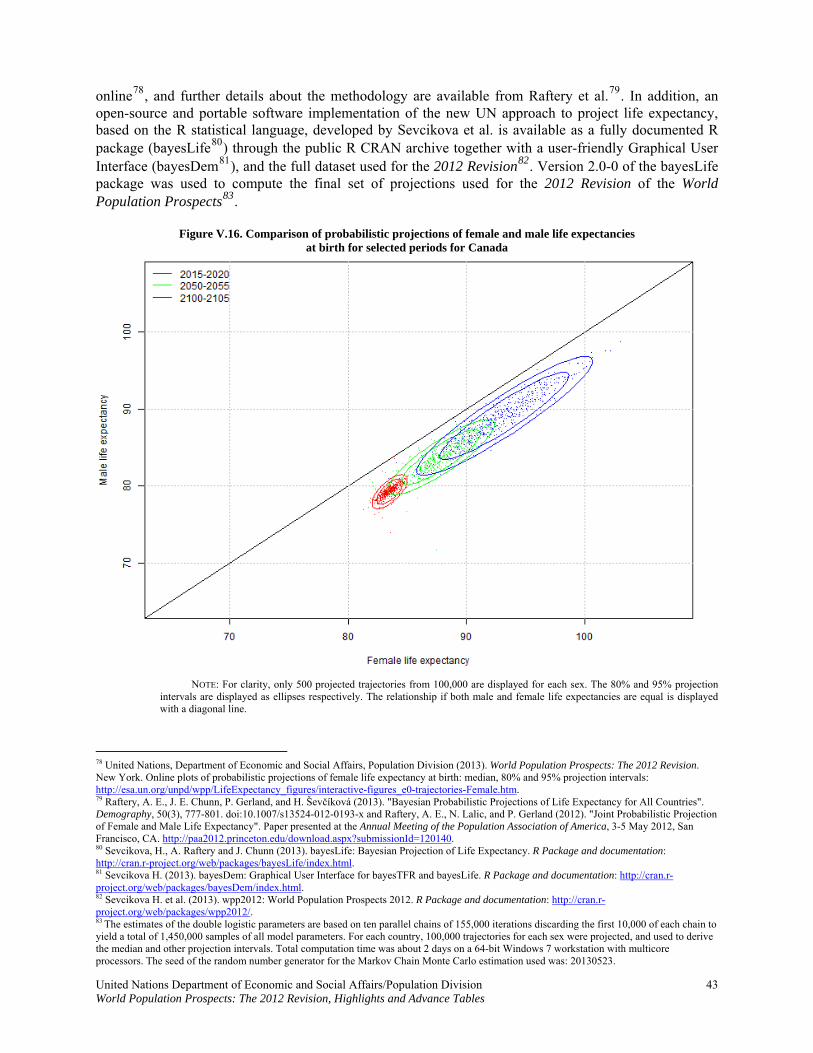
online78, and further details about the methodology are available from Raftery et al.79. In addition, an open-source and portable software implementation of the new UN approach to project life expectancy, based on the R statistical language, developed by Sevcikova et al. is available as a fully documented R package (bayesLife80) through the public R CRAN archive together with a user-friendly Graphical User Interface (bayesDem81), and the full dataset used for the 2012 Revision82. Version 2.0-0 of the bayesLife package was used to compute the final set of projections used for the 2012 Revision of the World Population Prospects83.
Figure V.16. Comparison of probabilistic projections of female and male life expectancies at birth for selected periods for Canada
NOTE: For clarity, only 500 projected trajectories from 100,000 are displayed for each sex. The 80% and 95% projection intervals are displayed as ellipses respectively. The relationship if both male and female life expectancies are equal is displayed with a diagonal line.
78 United Nations, Department of Economic and Social Affairs, Population Division (2013). World Population Prospects: The 2012 Revision. New York. Online plots of probabilistic projections of female life expectancy at birth: median, 80% and 95% projection intervals: http://esa.un.org/unpd/wpp/LifeExpectancy_figures/interactive-figures_e0-trajectories-Female.htm. 79 Raftery, A. E., J. E. Chunn, P. Gerland, and H. Ševčíková (2013). "Bayesian Probabilistic Projections of Life Expectancy for All Countries". Demography, 50(3), 777-801. doi:10.1007/s13524-012-0193-x and Raftery, A. E., N. Lalic, and P. Gerland (2012). "Joint Probabilistic Projection of Female and Male Life Expectancy". Paper presented at the Annual Meeting of the Population Association of America, 3-5 May 2012, San Francisco, CA. http://paa2012.princeton.edu/download.aspx?submissionId=120140. 80 Sevcikova, H., A. Raftery and J. Chunn (2013). bayesLife: Bayesian Projection of Life Expectancy. R Package and documentation: http://cran.r-project.org/web/packages/bayesLife/index.html. 81 Sevcikova H. (2013). bayesDem: Graphical User Interface for bayesTFR and bayesLife. R Package and documentation: http://cran.r-project.org/web/packages/bayesDem/index.html. 82 Sevcikova H. et al. (2013). wpp2012: World Population Prospects 2012. R Package and documentation: http://cran.r-project.org/web/packages/wpp2012/. 83 The estimates of the double logistic parameters are based on ten parallel chains of 155,000 iterations discarding the first 10,000 of each chain to yield a total of 1,450,000 samples of all model parameters. For each country, 100,000 trajectories for each sex were projected, and used to derive the median and other projection intervals. Total computation time was about 2 days on a 64-bit Windows 7 workstation with multicore processors. The seed of the random number generator for the Markov Chain Monte Carlo estimation used was: 20130523.
United Nations Department of Economic and Social Affairs/Population Division 43 World Population Prospects: The 2012 Revision, Highlights and Advance Tables

Projection of the age pattern of mortality Once the path of future expectation of life was determined, mortality rates by five-year age group and sex, consistent with the expectation of life at birth for each quinquennium were calculated. For countries with recent empirical information on the age patterns of mortality, mortality rates for the projection period were obtained by extrapolating the most recent set of mortality rates by the rates of change from either (a) country-specific historical trends upon availability, reliability and consistency over time using an extended Lee-Carter approach84, or (b) typical age-specific patterns of mortality improvement by level of mortality estimated from individual countries experiences included in the Human Mortality Database85, or from extended model life tables86. In both instances additional constrains might have been used at younger and/or older ages to insure greater consistency in sex differentials, especially at very high levels of projected life expectancies.
In other words, under such procedures, the empirical or estimated age pattern of mortality is transformed as life expectancy changes over time. For countries lacking recent or reliable information on age patterns of mortality, mortality rates were directly obtained from an underlying model life table. A choice could be made among nine model life table systems, four proposed by Coale and Demeny87; Coale, Demeny and Vaughn88; Coale and Guo89 and five model systems for developing countries produced by the United Nations90. These nine model life tables have been updated and extended by the Population Division in order to cover the whole age range up 100 years, and a range of life expectancies from 20 to 100.0 years91. It must be noted that the last available entry in the revised system of model life tables of 100.0 year of life expectancy, for both males and females, are not meant to represent a ceiling for human longevity.
The general approach to the projection of mortality just described is not appropriate for countries significantly affected by the HIV/AIDS epidemic. A detailed description of assumptions made and models used to estimate and project the demographic impact of HIV/AIDS is given in the next section.
2. The impact of HIV/AIDS on mortality
This Revision incorporates the demographic impact of the HIV/AIDS epidemic for 39 countries where HIV prevalence among persons aged 15 to 49 was ever equal to or greater than two per cent between 1980 and 2011 in the general population. Among the 39 countries considered, 32 countries are in Africa, 1 are in Asia and 6 in Latin America and the Caribbean (table V.2). For those countries, especially those having experienced prevalence rates of five per cent or more, a different approach for the estimation
84 Li, N., R. Lee and P. Gerland (2013). Extending the Lee-Carter method to model the rotation of age patterns of mortality-decline for long-term projection. Demography, In press. doi:10.1007/s13524-013-0232-2. In this case, the extended Lee-Carter approach is constrained to the projected median UN life expectancy at birth by selecting appropriate increases in the level parameter (kt) for each of the projection periods with the age pattern (ax) based on the most recent period or the average 1950-2010 period, and the age pattern of mortality improvement (bx) gradually changes by level of mortality to reflect the fact that mortality decline is decelerating at younger ages and accelerating at old ages. 85 Andreev, K., D. Gu, and P. Gerland (2013). Patterns of Mortality Improvement by Level of Life Expectancy at Birth. Paper presented at the Annual Meeting of the Population Association of America, New Orleans, LA. http://paa2013.princeton.edu/papers/132554. Note: available demographic data permits reliable estimation of the patterns of mortality improvement only up to 75-80 years of e0 for males, and 80-85 years for females. For extrapolating patterns of mortality improvement into higher levels of life expectancy at birth, smoothed linear trends were extrapolated for levels of life expectancy at birth up to 105-110 years of age. 86 Li, N. and P. Gerland (2011). Modifying the Lee-Carter Method to Project Mortality Changes up to 2100. Paper presented at the Annual Meeting of the Population Association of America (PAA), Washington, DC. http://paa2011.princeton.edu/papers/110555. 87 Coale, A. J., and Demeny, P. G. (1966). Regional model life tables and stable populations. Princeton, N.J., Princeton University Press. 88 Coale, A. J., Demeny, P. G., & Vaughan, B. (1983). Regional model life tables and stable populations (2nd ed.). New York: Academic Press. 89 Coale, A. J., and Guo, G. (1989). Revised Regional Model Life Tables at Very Low Levels of Mortality. Population Index, 55(4), 613-643. http://www.jstor.org/stable/3644567 90 United Nations, Dept. of International Economic and Social Affairs, Population Division (1982). Model life tables for developing countries. Population studies, no. 77. New York: United Nations. http://www.un.org/esa/population/publications/Model_Life_Tables/Model_Life_Tables.htm 91 United Nations Population Division (2010). World population prospects: the 2010 revision—WPP 2010 extended model life tables. New York: United Nations. Available online at: http://esa.un.org/unpd/wpp/Model-Life-Tables/download-page.html.
44 United Nations Department of Economic and Social Affairs/Population Division World Population Prospects: The 2012 Revision, Highlights and Advance Tables
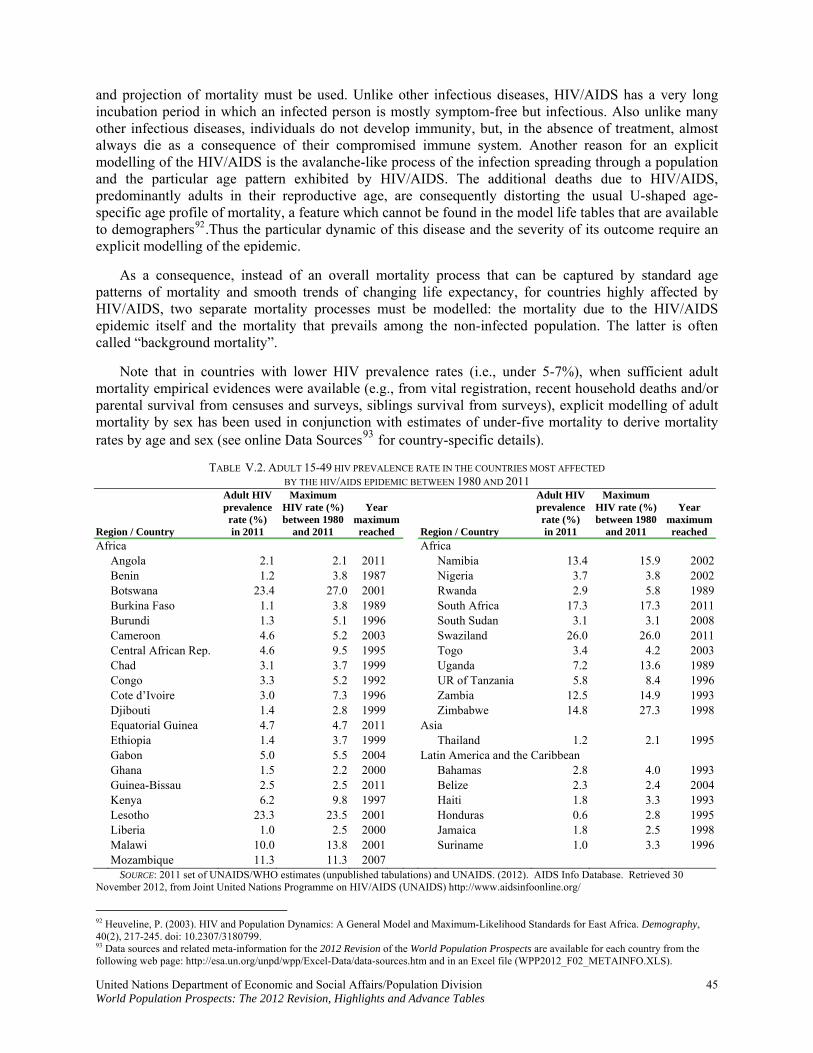
and projection of mortality must be used. Unlike other infectious diseases, HIV/AIDS has a very long incubation period in which an infected person is mostly symptom-free but infectious. Also unlike many other infectious diseases, individuals do not develop immunity, but, in the absence of treatment, almost always die as a consequence of their compromised immune system. Another reason for an explicit modelling of the HIV/AIDS is the avalanche-like process of the infection spreading through a population and the particular age pattern exhibited by HIV/AIDS. The additional deaths due to HIV/AIDS, predominantly adults in their reproductive age, are consequently distorting the usual U-shaped age-specific age profile of mortality, a feature which cannot be found in the model life tables that are available to demographers92.Thus the particular dynamic of this disease and the severity of its outcome require an explicit modelling of the epidemic.
As a consequence, instead of an overall mortality process that can be captured by standard age patterns of mortality and smooth trends of changing life expectancy, for countries highly affected by HIV/AIDS, two separate mortality processes must be modelled: the mortality due to the HIV/AIDS epidemic itself and the mortality that prevails among the non-infected population. The latter is often called “background mortality”.
Note that in countries with lower HIV prevalence rates (i.e., under 5-7%), when sufficient adult mortality empirical evidences were available (e.g., from vital registration, recent household deaths and/or parental survival from censuses and surveys, siblings survival from surveys), explicit modelling of adult mortality by sex has been used in conjunction with estimates of under-five mortality to derive mortality rates by age and sex (see online Data Sources93 for country-specific details).
TABLE V.2. ADULT 15-49 HIV PREVALENCE RATE IN THE COUNTRIES MOST AFFECTED BY THE HIV/AIDS EPIDEMIC BETWEEN 1980 AND 2011
Region / Country
Adult HIV prevalence rate (%) in 2011
Maximum HIV rate (%)between 1980
and 2011
Year maximum reached Region / Country
Adult HIV prevalence rate (%) in 2011
Maximum HIV rate (%)between 1980
and 2011
Year maximum reached
Africa Africa Angola 2.1 2.1 2011 Namibia 13.4 15.9 2002 Benin 1.2 3.8 1987 Nigeria 3.7 3.8 2002 Botswana 23.4 27.0 2001 Rwanda 2.9 5.8 1989 Burkina Faso 1.1 3.8 1989 South Africa 17.3 17.3 2011 Burundi 1.3 5.1 1996 South Sudan 3.1 3.1 2008 Cameroon 4.6 5.2 2003 Swaziland 26.0 26.0 2011 Central African Rep. 4.6 9.5 1995 Togo 3.4 4.2 2003 Chad 3.1 3.7 1999 Uganda 7.2 13.6 1989 Congo 3.3 5.2 1992 UR of Tanzania 5.8 8.4 1996 Cote d’Ivoire 3.0 7.3 1996 Zambia 12.5 14.9 1993 Djibouti 1.4 2.8 1999 Zimbabwe 14.8 27.3 1998 Equatorial Guinea 4.7 4.7 2011 Asia Ethiopia 1.4 3.7 1999 Thailand 1.2 2.1 1995 Gabon 5.0 5.5 2004 Latin America and the Caribbean Ghana 1.5 2.2 2000 Bahamas 2.8 4.0 1993 Guinea-Bissau 2.5 2.5 2011 Belize 2.3 2.4 2004 Kenya 6.2 9.8 1997 Haiti 1.8 3.3 1993 Lesotho 23.3 23.5 2001 Honduras 0.6 2.8 1995 Liberia 1.0 2.5 2000 Jamaica 1.8 2.5 1998 Malawi 10.0 13.8 2001 Suriname 1.0 3.3 1996 Mozambique 11.3 11.3 2007 SOURCE: 2011 set of UNAIDS/WHO estimates (unpublished tabulations) and UNAIDS. (2012). AIDS Info Database. Retrieved 30 November 2012, from Joint United Nations Programme on HIV/AIDS (UNAIDS) http://www.aidsinfoonline.org/
92 Heuveline, P. (2003). HIV and Population Dynamics: A General Model and Maximum-Likelihood Standards for East Africa. Demography, 40(2), 217-245. doi: 10.2307/3180799. 93 Data sources and related meta-information for the 2012 Revision of the World Population Prospects are available for each country from the following web page: http://esa.un.org/unpd/wpp/Excel-Data/data-sources.htm and in an Excel file (WPP2012_F02_METAINFO.XLS).
United Nations Department of Economic and Social Affairs/Population Division 45 World Population Prospects: The 2012 Revision, Highlights and Advance Tables
However, in the countries most highly affected by the HIV/AIDS epidemic, their mortality is projected by modelling explicitly the course of the epidemic and projecting the yearly incidence of HIV infection. The model (and its latest Spectrum/EPP software implementation94) developed by the UNAIDS Reference Group on Estimates, Modelling and Projections95,96, and all epidemiological parameters (including treatment data) used by UNAIDS to prepare the 2011 set of UNAIDS/WHO estimates97 for the 2012 Global Report98 have been used to derive the mortality impact due to HIV/AIDS.
The projection assumptions used in the 2012 Revision assumes that the HIV incidence rate observed though 2011 will decline by 2100 to about 1/10 its 2011 value following an exponential decay function. The sex ratio of HIV incidence (female to male incidence for age 15-49) is assumed to follow a linear trend from its 2011 value to reach 1.1 in 2050 and to remain constant afterwards. Both for children and adults, the proportion of the HIV-positive population receiving treatment in each country uses estimates prepared by the World Health Organization and UNAIDS, and coverage is projected to reach 85% in 2050 if it is current below 85% or stay constant if it is above it. Coverage of interventions to prevent mother-to-child transmission of HIV is assumed to remain constant until 2100 at the level reached in each of the affected countries in 2011.
3. Constant-mortality assumption Under this assumption, mortality over the projection period is maintained constant for each country at the level estimated for 2005-2010.
C. INTERNATIONAL MIGRATION ASSUMPTIONS
1. Normal migration assumption Under the normal migration assumption, the future path of international migration is set on the basis of past international migration estimates and consideration of the policy stance of each country with regard to future international migration flows. Projected levels of net migration are generally kept constant over the next decades. After 2050, it is assumed that net migration will gradually decline and reach zero by 2100.
2. Zero-migration assumption Under this assumption, for each country, international migration is set to zero starting in 2010-2015.
94 A special release of Spectrum (UNPOP100, 4 April 2013). specially extended to handle higher life expectancy projections up to age 100 was used for the 2012 revision. Public versions of Spectrum are available at: http://www.futuresinstitute.org/pages/resources.aspx. 95 Stanecki, K., Garnett, G. P., and Ghys, P. D. (2012). Developments in the field of HIV estimates: methods, parameters and trends. Sexually Transmitted Infections, 88(Suppl 2), i1-i2. doi: 10.1136/sextrans-2012-050885. 96 Stover, J., Brown, T., and Marston, M. (2012). Updates to the Spectrum/Estimation and Projection Package (EPP) model to estimate HIV trends for adults and children. Sexually Transmitted Infections, 88 Suppl 2, i11-16. doi: 10.1136/sextrans-2012-050640. 97 The only exception was a revised age pattern of incidence by sex for generalized epidemic provided by UNAIDS in Nov. 2012 (mean age of new infections equal to 28.1 for females and 32.5 for males). 98 UNAIDS (2012). Global report: UNAIDS report on the global AIDS epidemic 2012 (pp. 210). Geneva, Switzerland: Joint United Nations Programme on HIV/AIDS. Available online at: http://www.unaids.org/en/media/unaids/contentassets/documents/ epidemiology/2012/gr2012/20121120_UNAIDS_Global_Report_2012_with_annexes_en.pdf.
46 United Nations Department of Economic and Social Affairs/Population Division World Population Prospects: The 2012 Revision, Highlights and Advance Tables
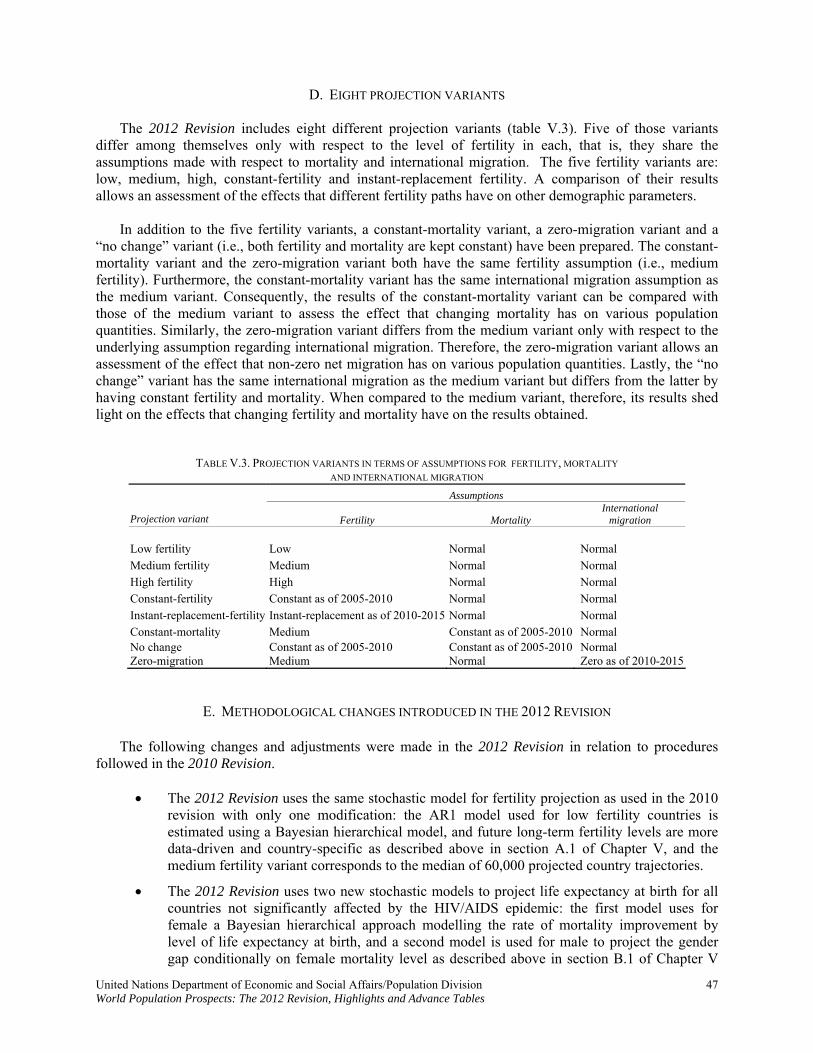
D. EIGHT PROJECTION VARIANTS The 2012 Revision includes eight different projection variants (table V.3). Five of those variants differ among themselves only with respect to the level of fertility in each, that is, they share the assumptions made with respect to mortality and international migration. The five fertility variants are: low, medium, high, constant-fertility and instant-replacement fertility. A comparison of their results allows an assessment of the effects that different fertility paths have on other demographic parameters. In addition to the five fertility variants, a constant-mortality variant, a zero-migration variant and a “no change” variant (i.e., both fertility and mortality are kept constant) have been prepared. The constant-mortality variant and the zero-migration variant both have the same fertility assumption (i.e., medium fertility). Furthermore, the constant-mortality variant has the same international migration assumption as the medium variant. Consequently, the results of the constant-mortality variant can be compared with those of the medium variant to assess the effect that changing mortality has on various population quantities. Similarly, the zero-migration variant differs from the medium variant only with respect to the underlying assumption regarding international migration. Therefore, the zero-migration variant allows an assessment of the effect that non-zero net migration has on various population quantities. Lastly, the “no change” variant has the same international migration as the medium variant but differs from the latter by having constant fertility and mortality. When compared to the medium variant, therefore, its results shed light on the effects that changing fertility and mortality have on the results obtained.
TABLE V.3. PROJECTION VARIANTS IN TERMS OF ASSUMPTIONS FOR FERTILITY, MORTALITY
AND INTERNATIONAL MIGRATION
Assumptions
Projection variant Fertility Mortality International
migration Low fertility Low Normal Normal
Medium fertility Medium Normal Normal
High fertility High Normal Normal
Constant-fertility Constant as of 2005-2010 Normal Normal
Instant-replacement-fertility Instant-replacement as of 2010-2015 Normal Normal
Constant-mortality Medium Constant as of 2005-2010 Normal No change Constant as of 2005-2010 Constant as of 2005-2010 Normal Zero-migration Medium Normal Zero as of 2010-2015
E. METHODOLOGICAL CHANGES INTRODUCED IN THE 2012 REVISION The following changes and adjustments were made in the 2012 Revision in relation to procedures followed in the 2010 Revision.
The 2012 Revision uses the same stochastic model for fertility projection as used in the 2010 revision with only one modification: the AR1 model used for low fertility countries is estimated using a Bayesian hierarchical model, and future long-term fertility levels are more data-driven and country-specific as described above in section A.1 of Chapter V, and the medium fertility variant corresponds to the median of 60,000 projected country trajectories.
The 2012 Revision uses two new stochastic models to project life expectancy at birth for all countries not significantly affected by the HIV/AIDS epidemic: the first model uses for female a Bayesian hierarchical approach modelling the rate of mortality improvement by level of life expectancy at birth, and a second model is used for male to project the gender gap conditionally on female mortality level as described above in section B.1 of Chapter V
United Nations Department of Economic and Social Affairs/Population Division 47 World Population Prospects: The 2012 Revision, Highlights and Advance Tables
48 United Nations Department of Economic and Social Affairs/Population Division World Population Prospects: The 2012 Revision, Highlights and Advance Tables
The medium mortality variant corresponds to the median of 100,000 projected country trajectories by sex.
The 2012 Revision uses new age-specific patterns of mortality improvement by level of mortality to project mortality patterns for countries with reliable recent mortality data by age and sex.
In the 2012 Revision, the impact of HIV/AIDS on mortality is modelled explicitly for 39 countries where HIV prevalence among persons aged 15 to 49 was ever equal to or greater than two per cent between 1980 and 2011 in the general population.

VI. SUMMARY TABLES

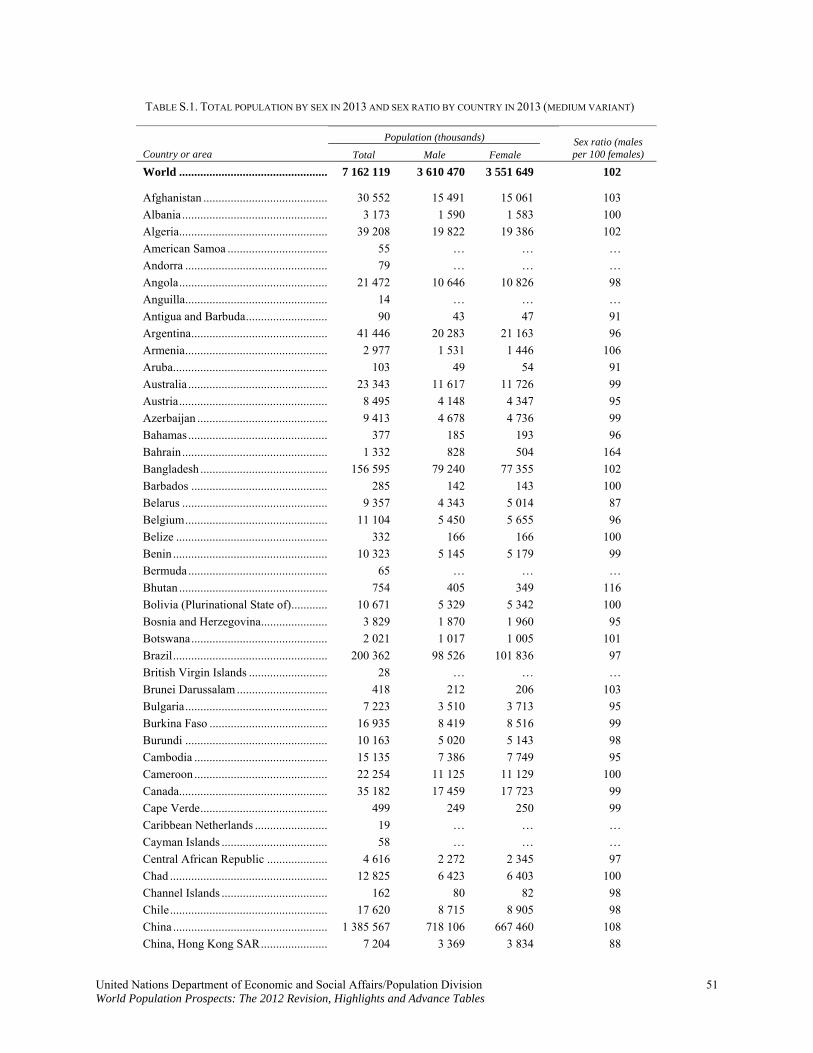
TABLE S.1. TOTAL POPULATION BY SEX IN 2013 AND SEX RATIO BY COUNTRY IN 2013 (MEDIUM VARIANT)
Population (thousands)
Country or area Total Male Female Sex ratio (males per 100 females)
World .................................................. 7 162 119 3 610 470 3 551 649 102
Afghanistan .......................................... 30 552 15 491 15 061 103
Albania................................................. 3 173 1 590 1 583 100
Algeria.................................................. 39 208 19 822 19 386 102
American Samoa .................................. 55 … … …
Andorra ................................................ 79 … … …
Angola.................................................. 21 472 10 646 10 826 98
Anguilla................................................ 14 … … …
Antigua and Barbuda............................ 90 43 47 91
Argentina.............................................. 41 446 20 283 21 163 96
Armenia................................................ 2 977 1 531 1 446 106
Aruba.................................................... 103 49 54 91
Australia ............................................... 23 343 11 617 11 726 99
Austria.................................................. 8 495 4 148 4 347 95
Azerbaijan ............................................ 9 413 4 678 4 736 99
Bahamas............................................... 377 185 193 96
Bahrain................................................. 1 332 828 504 164
Bangladesh ........................................... 156 595 79 240 77 355 102
Barbados .............................................. 285 142 143 100
Belarus ................................................. 9 357 4 343 5 014 87
Belgium................................................ 11 104 5 450 5 655 96
Belize ................................................... 332 166 166 100
Benin .................................................... 10 323 5 145 5 179 99
Bermuda............................................... 65 … … …
Bhutan .................................................. 754 405 349 116
Bolivia (Plurinational State of)............. 10 671 5 329 5 342 100
Bosnia and Herzegovina....................... 3 829 1 870 1 960 95
Botswana.............................................. 2 021 1 017 1 005 101
Brazil.................................................... 200 362 98 526 101 836 97
British Virgin Islands ........................... 28 … … …
Brunei Darussalam ............................... 418 212 206 103
Bulgaria................................................ 7 223 3 510 3 713 95
Burkina Faso ........................................ 16 935 8 419 8 516 99
Burundi ................................................ 10 163 5 020 5 143 98
Cambodia ............................................. 15 135 7 386 7 749 95
Cameroon ............................................. 22 254 11 125 11 129 100
Canada.................................................. 35 182 17 459 17 723 99
Cape Verde........................................... 499 249 250 99
Caribbean Netherlands ......................... 19 … … …
Cayman Islands .................................... 58 … … …
Central African Republic ..................... 4 616 2 272 2 345 97
Chad ..................................................... 12 825 6 423 6 403 100
Channel Islands .................................... 162 80 82 98
Chile..................................................... 17 620 8 715 8 905 98
China .................................................... 1 385 567 718 106 667 460 108
China, Hong Kong SAR....................... 7 204 3 369 3 834 88
United Nations Department of Economic and Social Affairs/Population Division 51 World Population Prospects: The 2012 Revision, Highlights and Advance Tables
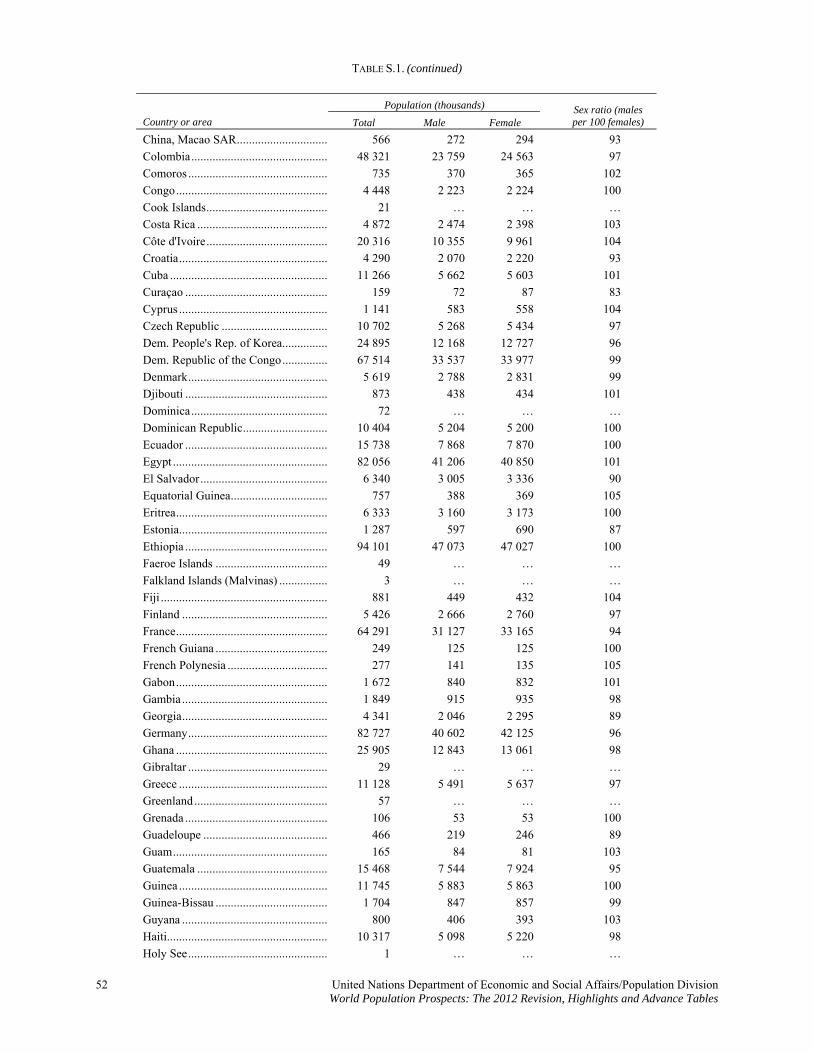
TABLE S.1. (continued)
Population (thousands)
Country or area Total Male Female Sex ratio (males
per 100 females)
China, Macao SAR............................... 566 272 294 93
Colombia.............................................. 48 321 23 759 24 563 97
Comoros ............................................... 735 370 365 102
Congo................................................... 4 448 2 223 2 224 100
Cook Islands......................................... 21 … … …
Costa Rica ............................................ 4 872 2 474 2 398 103
Côte d'Ivoire......................................... 20 316 10 355 9 961 104
Croatia.................................................. 4 290 2 070 2 220 93
Cuba ..................................................... 11 266 5 662 5 603 101
Curaçao ................................................ 159 72 87 83
Cyprus .................................................. 1 141 583 558 104
Czech Republic .................................... 10 702 5 268 5 434 97
Dem. People's Rep. of Korea................ 24 895 12 168 12 727 96
Dem. Republic of the Congo................ 67 514 33 537 33 977 99
Denmark............................................... 5 619 2 788 2 831 99
Djibouti ................................................ 873 438 434 101
Dominica.............................................. 72 … … …
Dominican Republic............................. 10 404 5 204 5 200 100
Ecuador ................................................ 15 738 7 868 7 870 100
Egypt .................................................... 82 056 41 206 40 850 101
El Salvador........................................... 6 340 3 005 3 336 90
Equatorial Guinea................................. 757 388 369 105
Eritrea................................................... 6 333 3 160 3 173 100
Estonia.................................................. 1 287 597 690 87
Ethiopia ................................................ 94 101 47 073 47 027 100
Faeroe Islands ...................................... 49 … … …
Falkland Islands (Malvinas) ................. 3 … … …
Fiji ........................................................ 881 449 432 104
Finland ................................................. 5 426 2 666 2 760 97
France................................................... 64 291 31 127 33 165 94
French Guiana ...................................... 249 125 125 100
French Polynesia .................................. 277 141 135 105
Gabon................................................... 1 672 840 832 101
Gambia................................................. 1 849 915 935 98
Georgia................................................. 4 341 2 046 2 295 89
Germany............................................... 82 727 40 602 42 125 96
Ghana ................................................... 25 905 12 843 13 061 98
Gibraltar ............................................... 29 … … …
Greece .................................................. 11 128 5 491 5 637 97
Greenland............................................. 57 … … …
Grenada ................................................ 106 53 53 100
Guadeloupe .......................................... 466 219 246 89
Guam.................................................... 165 84 81 103
Guatemala ............................................ 15 468 7 544 7 924 95
Guinea .................................................. 11 745 5 883 5 863 100
Guinea-Bissau ...................................... 1 704 847 857 99
Guyana ................................................. 800 406 393 103
Haiti...................................................... 10 317 5 098 5 220 98
Holy See............................................... 1 … … …
52 United Nations Department of Economic and Social Affairs/Population Division World Population Prospects: The 2012 Revision, Highlights and Advance Tables
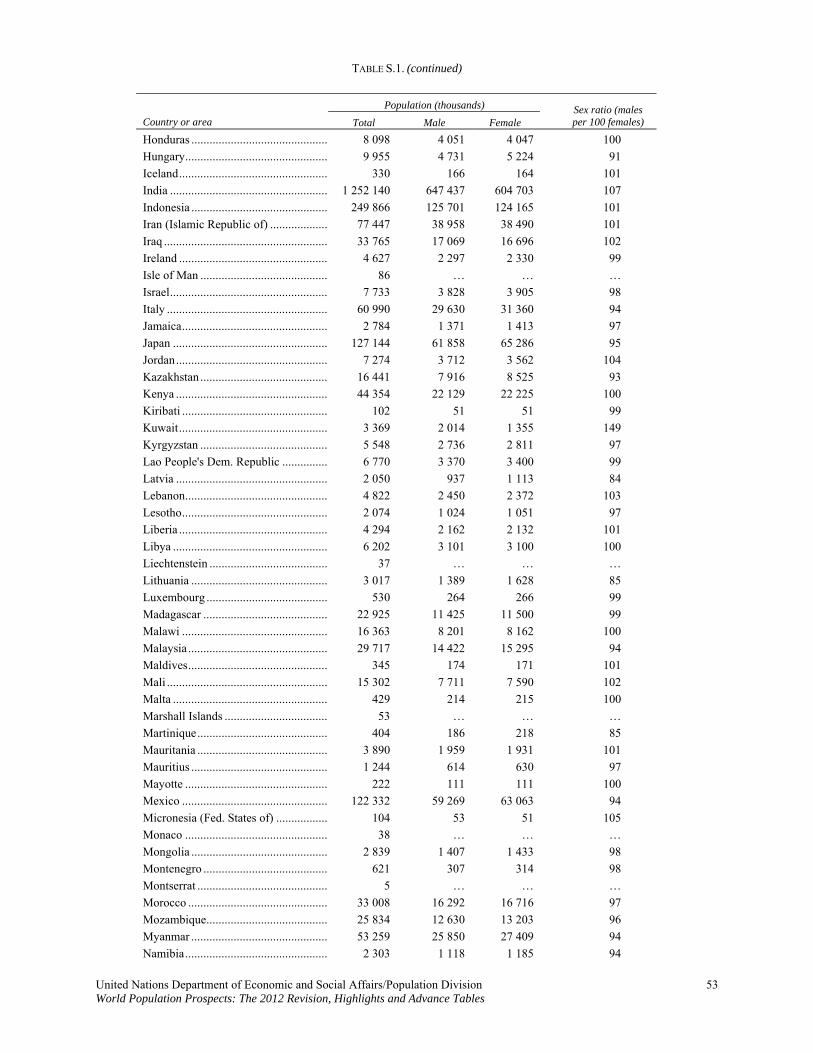
TABLE S.1. (continued)
Population (thousands)
Country or area Total Male Female Sex ratio (males per 100 females)
Honduras .............................................. 8 098 4 051 4 047 100
Hungary................................................ 9 955 4 731 5 224 91
Iceland.................................................. 330 166 164 101
India ..................................................... 1 252 140 647 437 604 703 107
Indonesia .............................................. 249 866 125 701 124 165 101
Iran (Islamic Republic of) .................... 77 447 38 958 38 490 101
Iraq ....................................................... 33 765 17 069 16 696 102
Ireland .................................................. 4 627 2 297 2 330 99
Isle of Man ........................................... 86 … … …
Israel..................................................... 7 733 3 828 3 905 98
Italy ...................................................... 60 990 29 630 31 360 94
Jamaica................................................. 2 784 1 371 1 413 97
Japan .................................................... 127 144 61 858 65 286 95
Jordan................................................... 7 274 3 712 3 562 104
Kazakhstan ........................................... 16 441 7 916 8 525 93
Kenya ................................................... 44 354 22 129 22 225 100
Kiribati ................................................. 102 51 51 99
Kuwait.................................................. 3 369 2 014 1 355 149
Kyrgyzstan ........................................... 5 548 2 736 2 811 97
Lao People's Dem. Republic ................ 6 770 3 370 3 400 99
Latvia ................................................... 2 050 937 1 113 84
Lebanon................................................ 4 822 2 450 2 372 103
Lesotho................................................. 2 074 1 024 1 051 97
Liberia .................................................. 4 294 2 162 2 132 101
Libya .................................................... 6 202 3 101 3 100 100
Liechtenstein ........................................ 37 … … …
Lithuania .............................................. 3 017 1 389 1 628 85
Luxembourg ......................................... 530 264 266 99
Madagascar .......................................... 22 925 11 425 11 500 99
Malawi ................................................. 16 363 8 201 8 162 100
Malaysia ............................................... 29 717 14 422 15 295 94
Maldives............................................... 345 174 171 101
Mali ...................................................... 15 302 7 711 7 590 102
Malta .................................................... 429 214 215 100
Marshall Islands ................................... 53 … … …
Martinique............................................ 404 186 218 85
Mauritania ............................................ 3 890 1 959 1 931 101
Mauritius .............................................. 1 244 614 630 97
Mayotte ................................................ 222 111 111 100
Mexico ................................................. 122 332 59 269 63 063 94
Micronesia (Fed. States of) .................. 104 53 51 105
Monaco ................................................ 38 … … …
Mongolia .............................................. 2 839 1 407 1 433 98
Montenegro .......................................... 621 307 314 98
Montserrat ............................................ 5 … … …
Morocco ............................................... 33 008 16 292 16 716 97
Mozambique......................................... 25 834 12 630 13 203 96
Myanmar .............................................. 53 259 25 850 27 409 94
Namibia................................................ 2 303 1 118 1 185 94
United Nations Department of Economic and Social Affairs/Population Division 53 World Population Prospects: The 2012 Revision, Highlights and Advance Tables
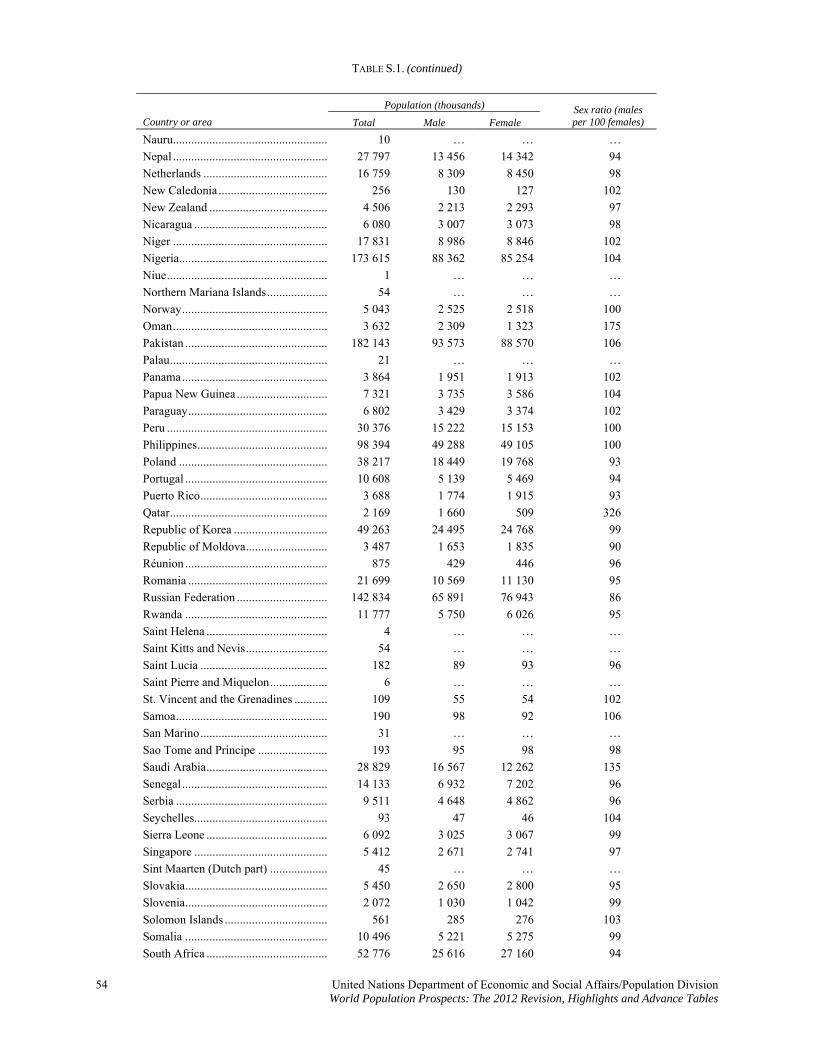
TABLE S.1. (continued)
Population (thousands)
Country or area Total Male Female Sex ratio (males per 100 females)
Nauru.................................................... 10 … … …
Nepal .................................................... 27 797 13 456 14 342 94
Netherlands .......................................... 16 759 8 309 8 450 98
New Caledonia ..................................... 256 130 127 102
New Zealand ........................................ 4 506 2 213 2 293 97
Nicaragua ............................................. 6 080 3 007 3 073 98
Niger .................................................... 17 831 8 986 8 846 102
Nigeria.................................................. 173 615 88 362 85 254 104
Niue...................................................... 1 … … …
Northern Mariana Islands..................... 54 … … …
Norway................................................. 5 043 2 525 2 518 100
Oman.................................................... 3 632 2 309 1 323 175
Pakistan ................................................ 182 143 93 573 88 570 106
Palau..................................................... 21 … … …
Panama................................................. 3 864 1 951 1 913 102
Papua New Guinea............................... 7 321 3 735 3 586 104
Paraguay............................................... 6 802 3 429 3 374 102
Peru ...................................................... 30 376 15 222 15 153 100
Philippines............................................ 98 394 49 288 49 105 100
Poland .................................................. 38 217 18 449 19 768 93
Portugal ................................................ 10 608 5 139 5 469 94
Puerto Rico........................................... 3 688 1 774 1 915 93
Qatar..................................................... 2 169 1 660 509 326
Republic of Korea ................................ 49 263 24 495 24 768 99
Republic of Moldova............................ 3 487 1 653 1 835 90
Réunion ................................................ 875 429 446 96
Romania ............................................... 21 699 10 569 11 130 95
Russian Federation ............................... 142 834 65 891 76 943 86
Rwanda ................................................ 11 777 5 750 6 026 95
Saint Helena ......................................... 4 … … …
Saint Kitts and Nevis............................ 54 … … …
Saint Lucia ........................................... 182 89 93 96
Saint Pierre and Miquelon.................... 6 … … …
St. Vincent and the Grenadines ............ 109 55 54 102
Samoa................................................... 190 98 92 106
San Marino........................................... 31 … … …
Sao Tome and Principe ........................ 193 95 98 98
Saudi Arabia......................................... 28 829 16 567 12 262 135
Senegal ................................................. 14 133 6 932 7 202 96
Serbia ................................................... 9 511 4 648 4 862 96
Seychelles............................................. 93 47 46 104
Sierra Leone ......................................... 6 092 3 025 3 067 99
Singapore ............................................. 5 412 2 671 2 741 97
Sint Maarten (Dutch part) .................... 45 … … …
Slovakia................................................ 5 450 2 650 2 800 95
Slovenia................................................ 2 072 1 030 1 042 99
Solomon Islands ................................... 561 285 276 103
Somalia ................................................ 10 496 5 221 5 275 99
South Africa ......................................... 52 776 25 616 27 160 94
54 United Nations Department of Economic and Social Affairs/Population Division World Population Prospects: The 2012 Revision, Highlights and Advance Tables
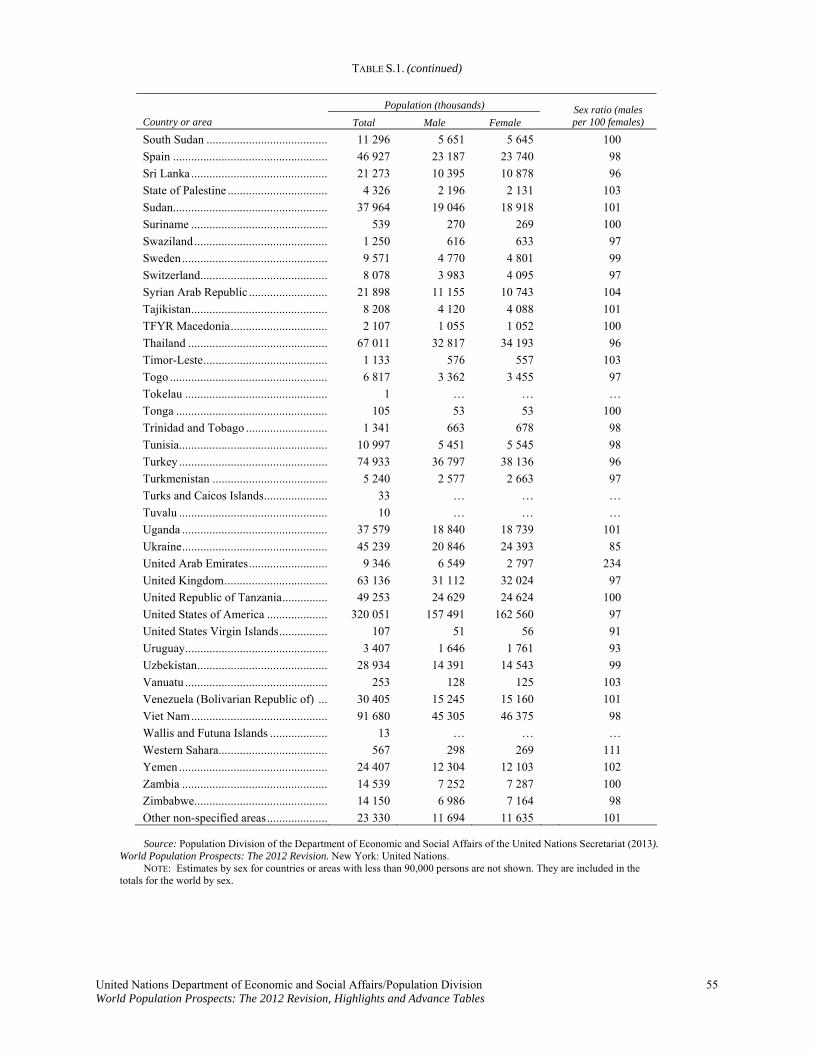
TABLE S.1. (continued)
United Nations Department of Economic and Social Affairs/Population Division 55 World Population Prospects: The 2012 Revision, Highlights and Advance Tables
Population (thousands)
Country or area Total Male Female Sex ratio (males per 100 females)
South Sudan ......................................... 11 296 5 651 5 645 100
Spain .................................................... 46 927 23 187 23 740 98
Sri Lanka .............................................. 21 273 10 395 10 878 96
State of Palestine .................................. 4 326 2 196 2 131 103
Sudan.................................................... 37 964 19 046 18 918 101
Suriname .............................................. 539 270 269 100
Swaziland............................................. 1 250 616 633 97
Sweden................................................. 9 571 4 770 4 801 99
Switzerland........................................... 8 078 3 983 4 095 97
Syrian Arab Republic ........................... 21 898 11 155 10 743 104
Tajikistan.............................................. 8 208 4 120 4 088 101
TFYR Macedonia................................. 2 107 1 055 1 052 100
Thailand ............................................... 67 011 32 817 34 193 96
Timor-Leste.......................................... 1 133 576 557 103
Togo ..................................................... 6 817 3 362 3 455 97
Tokelau ................................................ 1 … … …
Tonga ................................................... 105 53 53 100
Trinidad and Tobago ............................ 1 341 663 678 98
Tunisia.................................................. 10 997 5 451 5 545 98
Turkey .................................................. 74 933 36 797 38 136 96
Turkmenistan ....................................... 5 240 2 577 2 663 97
Turks and Caicos Islands...................... 33 … … …
Tuvalu .................................................. 10 … … …
Uganda ................................................. 37 579 18 840 18 739 101
Ukraine................................................. 45 239 20 846 24 393 85
United Arab Emirates........................... 9 346 6 549 2 797 234
United Kingdom................................... 63 136 31 112 32 024 97
United Republic of Tanzania................ 49 253 24 629 24 624 100
United States of America ..................... 320 051 157 491 162 560 97
United States Virgin Islands................. 107 51 56 91
Uruguay................................................ 3 407 1 646 1 761 93
Uzbekistan............................................ 28 934 14 391 14 543 99
Vanuatu ................................................ 253 128 125 103
Venezuela (Bolivarian Republic of) .... 30 405 15 245 15 160 101
Viet Nam.............................................. 91 680 45 305 46 375 98
Wallis and Futuna Islands .................... 13 … … …
Western Sahara..................................... 567 298 269 111
Yemen .................................................. 24 407 12 304 12 103 102
Zambia ................................................. 14 539 7 252 7 287 100
Zimbabwe............................................. 14 150 6 986 7 164 98
Other non-specified areas..................... 23 330 11 694 11 635 101
Source: Population Division of the Department of Economic and Social Affairs of the United Nations Secretariat (2013). World Population Prospects: The 2012 Revision. New York: United Nations. NOTE: Estimates by sex for countries or areas with less than 90,000 persons are not shown. They are included in the totals for the world by sex.
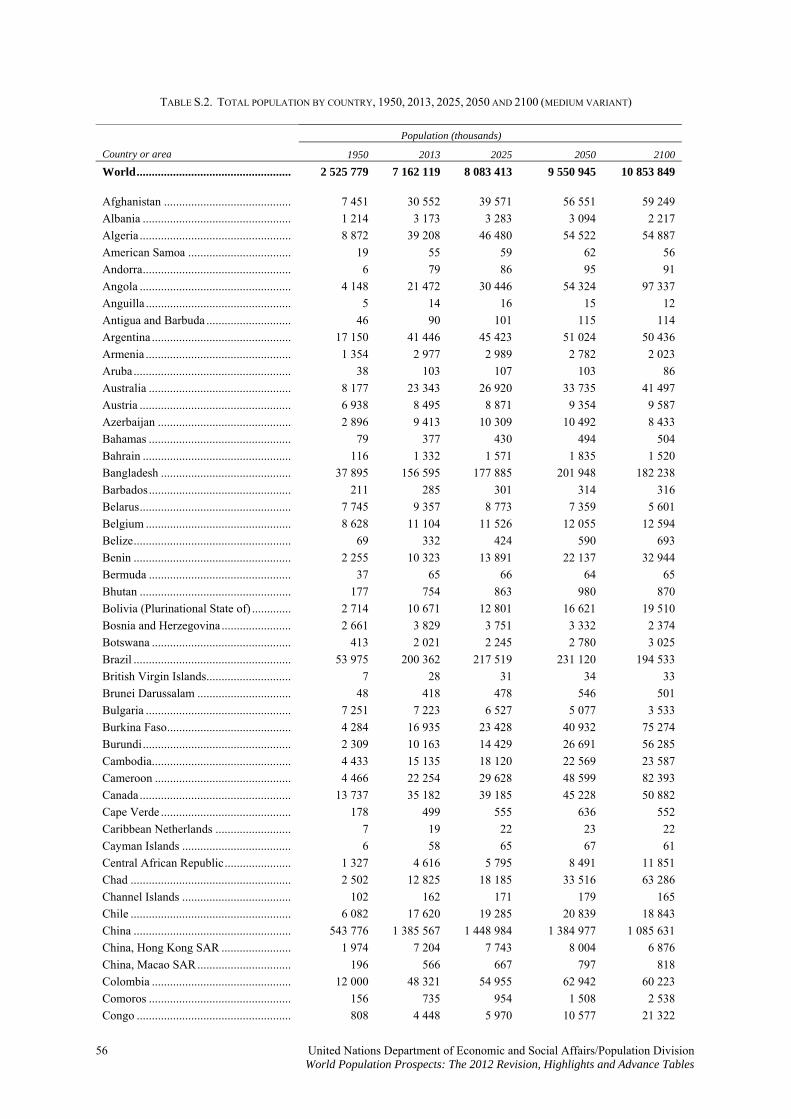
TABLE S.2. TOTAL POPULATION BY COUNTRY, 1950, 2013, 2025, 2050 AND 2100 (MEDIUM VARIANT)
Population (thousands)
Country or area 1950 2013 2025 2050 2100
World................................................... 2 525 779 7 162 119 8 083 413 9 550 945 10 853 849
Afghanistan .......................................... 7 451 30 552 39 571 56 551 59 249
Albania ................................................. 1 214 3 173 3 283 3 094 2 217
Algeria .................................................. 8 872 39 208 46 480 54 522 54 887
American Samoa .................................. 19 55 59 62 56
Andorra................................................. 6 79 86 95 91
Angola .................................................. 4 148 21 472 30 446 54 324 97 337
Anguilla ................................................ 5 14 16 15 12
Antigua and Barbuda ............................ 46 90 101 115 114
Argentina .............................................. 17 150 41 446 45 423 51 024 50 436
Armenia ................................................ 1 354 2 977 2 989 2 782 2 023
Aruba.................................................... 38 103 107 103 86
Australia ............................................... 8 177 23 343 26 920 33 735 41 497
Austria .................................................. 6 938 8 495 8 871 9 354 9 587
Azerbaijan ............................................ 2 896 9 413 10 309 10 492 8 433
Bahamas ............................................... 79 377 430 494 504
Bahrain ................................................. 116 1 332 1 571 1 835 1 520
Bangladesh ........................................... 37 895 156 595 177 885 201 948 182 238
Barbados............................................... 211 285 301 314 316
Belarus.................................................. 7 745 9 357 8 773 7 359 5 601
Belgium ................................................ 8 628 11 104 11 526 12 055 12 594
Belize.................................................... 69 332 424 590 693
Benin .................................................... 2 255 10 323 13 891 22 137 32 944
Bermuda ............................................... 37 65 66 64 65
Bhutan .................................................. 177 754 863 980 870
Bolivia (Plurinational State of) ............. 2 714 10 671 12 801 16 621 19 510
Bosnia and Herzegovina ....................... 2 661 3 829 3 751 3 332 2 374
Botswana .............................................. 413 2 021 2 245 2 780 3 025
Brazil .................................................... 53 975 200 362 217 519 231 120 194 533
British Virgin Islands............................ 7 28 31 34 33
Brunei Darussalam ............................... 48 418 478 546 501
Bulgaria ................................................ 7 251 7 223 6 527 5 077 3 533
Burkina Faso......................................... 4 284 16 935 23 428 40 932 75 274
Burundi................................................. 2 309 10 163 14 429 26 691 56 285
Cambodia.............................................. 4 433 15 135 18 120 22 569 23 587
Cameroon ............................................. 4 466 22 254 29 628 48 599 82 393
Canada.................................................. 13 737 35 182 39 185 45 228 50 882
Cape Verde ........................................... 178 499 555 636 552
Caribbean Netherlands ......................... 7 19 22 23 22
Cayman Islands .................................... 6 58 65 67 61
Central African Republic...................... 1 327 4 616 5 795 8 491 11 851
Chad ..................................................... 2 502 12 825 18 185 33 516 63 286
Channel Islands .................................... 102 162 171 179 165
Chile ..................................................... 6 082 17 620 19 285 20 839 18 843
China .................................................... 543 776 1 385 567 1 448 984 1 384 977 1 085 631
China, Hong Kong SAR ....................... 1 974 7 204 7 743 8 004 6 876
China, Macao SAR............................... 196 566 667 797 818
Colombia .............................................. 12 000 48 321 54 955 62 942 60 223
Comoros ............................................... 156 735 954 1 508 2 538
Congo ................................................... 808 4 448 5 970 10 577 21 322
56 United Nations Department of Economic and Social Affairs/Population Division World Population Prospects: The 2012 Revision, Highlights and Advance Tables
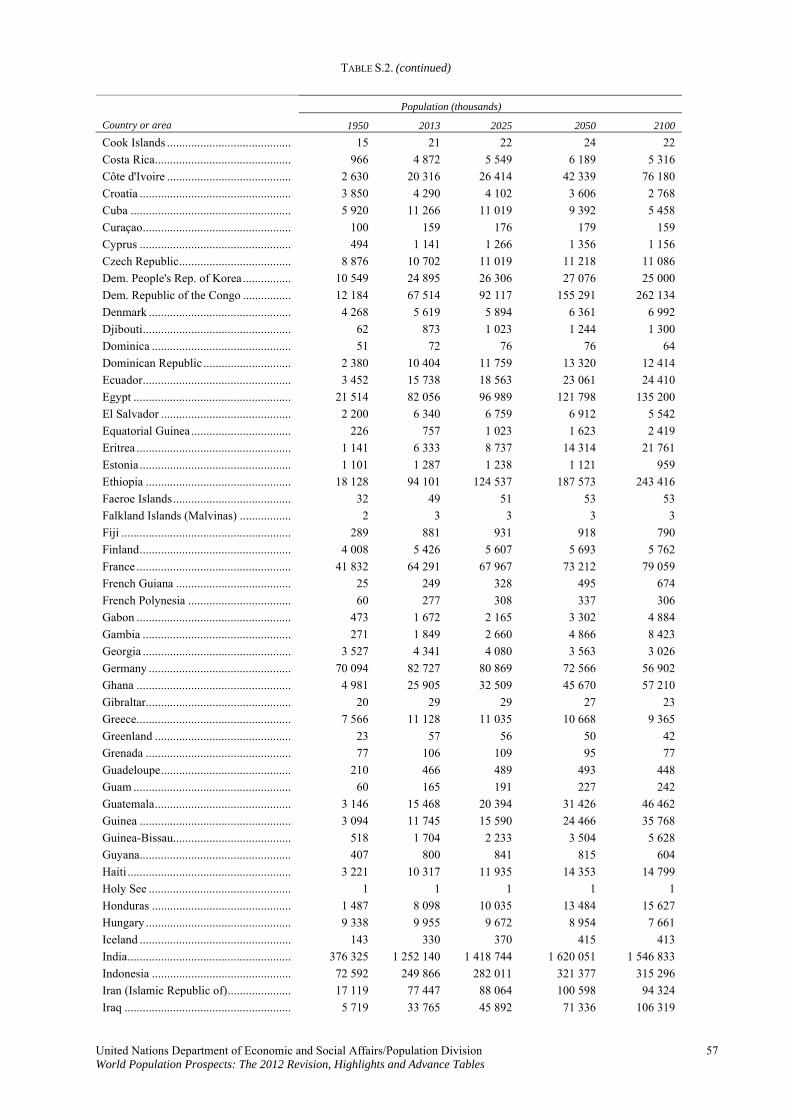
TABLE S.2. (continued)
Population (thousands)
Country or area 1950 2013 2025 2050 2100
Cook Islands ......................................... 15 21 22 24 22
Costa Rica............................................. 966 4 872 5 549 6 189 5 316
Côte d'Ivoire ......................................... 2 630 20 316 26 414 42 339 76 180
Croatia .................................................. 3 850 4 290 4 102 3 606 2 768
Cuba ..................................................... 5 920 11 266 11 019 9 392 5 458
Curaçao................................................. 100 159 176 179 159
Cyprus .................................................. 494 1 141 1 266 1 356 1 156
Czech Republic..................................... 8 876 10 702 11 019 11 218 11 086
Dem. People's Rep. of Korea................ 10 549 24 895 26 306 27 076 25 000
Dem. Republic of the Congo ................ 12 184 67 514 92 117 155 291 262 134
Denmark ............................................... 4 268 5 619 5 894 6 361 6 992
Djibouti................................................. 62 873 1 023 1 244 1 300
Dominica .............................................. 51 72 76 76 64
Dominican Republic ............................. 2 380 10 404 11 759 13 320 12 414
Ecuador................................................. 3 452 15 738 18 563 23 061 24 410
Egypt .................................................... 21 514 82 056 96 989 121 798 135 200
El Salvador ........................................... 2 200 6 340 6 759 6 912 5 542
Equatorial Guinea ................................. 226 757 1 023 1 623 2 419
Eritrea ................................................... 1 141 6 333 8 737 14 314 21 761
Estonia .................................................. 1 101 1 287 1 238 1 121 959
Ethiopia ................................................ 18 128 94 101 124 537 187 573 243 416
Faeroe Islands....................................... 32 49 51 53 53
Falkland Islands (Malvinas) ................. 2 3 3 3 3
Fiji ........................................................ 289 881 931 918 790
Finland.................................................. 4 008 5 426 5 607 5 693 5 762
France ................................................... 41 832 64 291 67 967 73 212 79 059
French Guiana ...................................... 25 249 328 495 674
French Polynesia .................................. 60 277 308 337 306
Gabon ................................................... 473 1 672 2 165 3 302 4 884
Gambia ................................................. 271 1 849 2 660 4 866 8 423
Georgia ................................................. 3 527 4 341 4 080 3 563 3 026
Germany ............................................... 70 094 82 727 80 869 72 566 56 902
Ghana ................................................... 4 981 25 905 32 509 45 670 57 210
Gibraltar................................................ 20 29 29 27 23
Greece................................................... 7 566 11 128 11 035 10 668 9 365
Greenland ............................................. 23 57 56 50 42
Grenada ................................................ 77 106 109 95 77
Guadeloupe........................................... 210 466 489 493 448
Guam .................................................... 60 165 191 227 242
Guatemala............................................. 3 146 15 468 20 394 31 426 46 462
Guinea .................................................. 3 094 11 745 15 590 24 466 35 768
Guinea-Bissau....................................... 518 1 704 2 233 3 504 5 628
Guyana.................................................. 407 800 841 815 604
Haiti ...................................................... 3 221 10 317 11 935 14 353 14 799
Holy See ............................................... 1 1 1 1 1
Honduras .............................................. 1 487 8 098 10 035 13 484 15 627
Hungary ................................................ 9 338 9 955 9 672 8 954 7 661
Iceland .................................................. 143 330 370 415 413
India...................................................... 376 325 1 252 140 1 418 744 1 620 051 1 546 833
Indonesia .............................................. 72 592 249 866 282 011 321 377 315 296
Iran (Islamic Republic of)..................... 17 119 77 447 88 064 100 598 94 324
Iraq ....................................................... 5 719 33 765 45 892 71 336 106 319
United Nations Department of Economic and Social Affairs/Population Division 57 World Population Prospects: The 2012 Revision, Highlights and Advance Tables
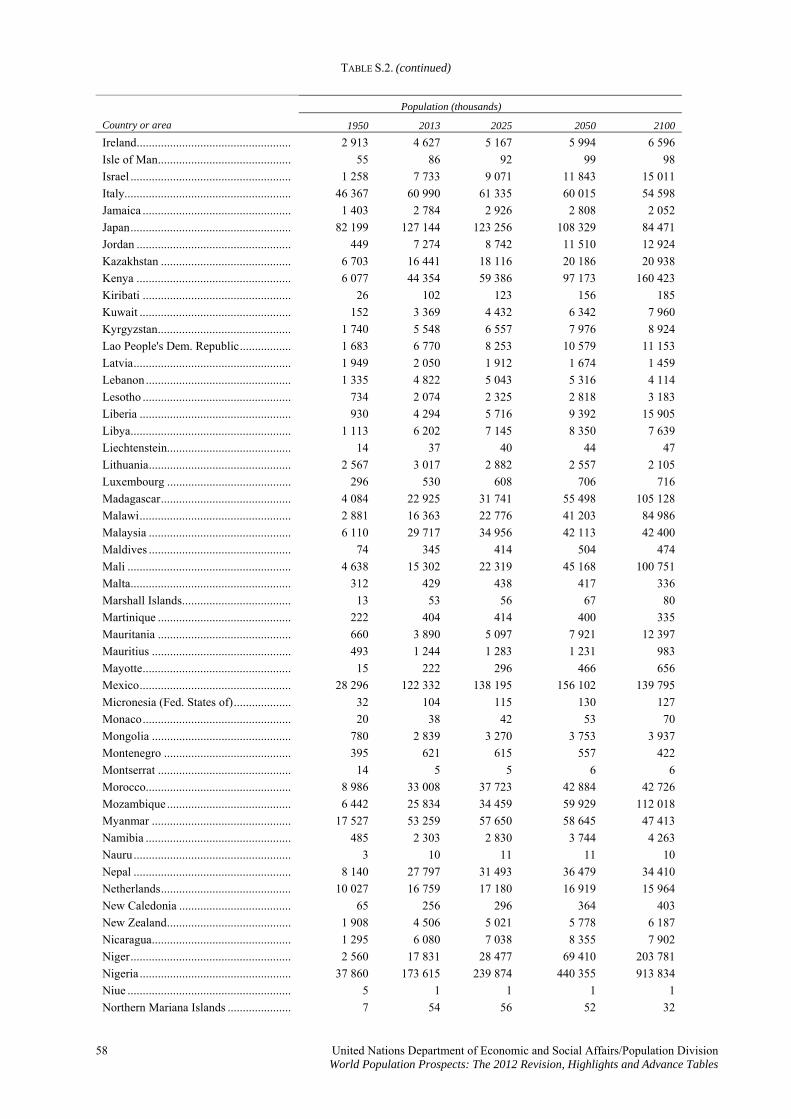
TABLE S.2. (continued)
Population (thousands)
Country or area 1950 2013 2025 2050 2100
Ireland................................................... 2 913 4 627 5 167 5 994 6 596
Isle of Man............................................ 55 86 92 99 98
Israel ..................................................... 1 258 7 733 9 071 11 843 15 011
Italy....................................................... 46 367 60 990 61 335 60 015 54 598
Jamaica ................................................. 1 403 2 784 2 926 2 808 2 052
Japan..................................................... 82 199 127 144 123 256 108 329 84 471
Jordan ................................................... 449 7 274 8 742 11 510 12 924
Kazakhstan ........................................... 6 703 16 441 18 116 20 186 20 938
Kenya ................................................... 6 077 44 354 59 386 97 173 160 423
Kiribati ................................................. 26 102 123 156 185
Kuwait .................................................. 152 3 369 4 432 6 342 7 960
Kyrgyzstan............................................ 1 740 5 548 6 557 7 976 8 924
Lao People's Dem. Republic................. 1 683 6 770 8 253 10 579 11 153
Latvia.................................................... 1 949 2 050 1 912 1 674 1 459
Lebanon................................................ 1 335 4 822 5 043 5 316 4 114
Lesotho ................................................. 734 2 074 2 325 2 818 3 183
Liberia .................................................. 930 4 294 5 716 9 392 15 905
Libya..................................................... 1 113 6 202 7 145 8 350 7 639
Liechtenstein......................................... 14 37 40 44 47
Lithuania............................................... 2 567 3 017 2 882 2 557 2 105
Luxembourg ......................................... 296 530 608 706 716
Madagascar........................................... 4 084 22 925 31 741 55 498 105 128
Malawi.................................................. 2 881 16 363 22 776 41 203 84 986
Malaysia ............................................... 6 110 29 717 34 956 42 113 42 400
Maldives ............................................... 74 345 414 504 474
Mali ...................................................... 4 638 15 302 22 319 45 168 100 751
Malta..................................................... 312 429 438 417 336
Marshall Islands.................................... 13 53 56 67 80
Martinique ............................................ 222 404 414 400 335
Mauritania ............................................ 660 3 890 5 097 7 921 12 397
Mauritius .............................................. 493 1 244 1 283 1 231 983
Mayotte................................................. 15 222 296 466 656
Mexico.................................................. 28 296 122 332 138 195 156 102 139 795
Micronesia (Fed. States of)................... 32 104 115 130 127
Monaco................................................. 20 38 42 53 70
Mongolia .............................................. 780 2 839 3 270 3 753 3 937
Montenegro .......................................... 395 621 615 557 422
Montserrat ............................................ 14 5 5 6 6
Morocco................................................ 8 986 33 008 37 723 42 884 42 726
Mozambique ......................................... 6 442 25 834 34 459 59 929 112 018
Myanmar .............................................. 17 527 53 259 57 650 58 645 47 413
Namibia ................................................ 485 2 303 2 830 3 744 4 263
Nauru.................................................... 3 10 11 11 10
Nepal .................................................... 8 140 27 797 31 493 36 479 34 410
Netherlands........................................... 10 027 16 759 17 180 16 919 15 964
New Caledonia ..................................... 65 256 296 364 403
New Zealand......................................... 1 908 4 506 5 021 5 778 6 187
Nicaragua.............................................. 1 295 6 080 7 038 8 355 7 902
Niger..................................................... 2 560 17 831 28 477 69 410 203 781
Nigeria .................................................. 37 860 173 615 239 874 440 355 913 834
Niue ...................................................... 5 1 1 1 1
Northern Mariana Islands ..................... 7 54 56 52 32
58 United Nations Department of Economic and Social Affairs/Population Division World Population Prospects: The 2012 Revision, Highlights and Advance Tables
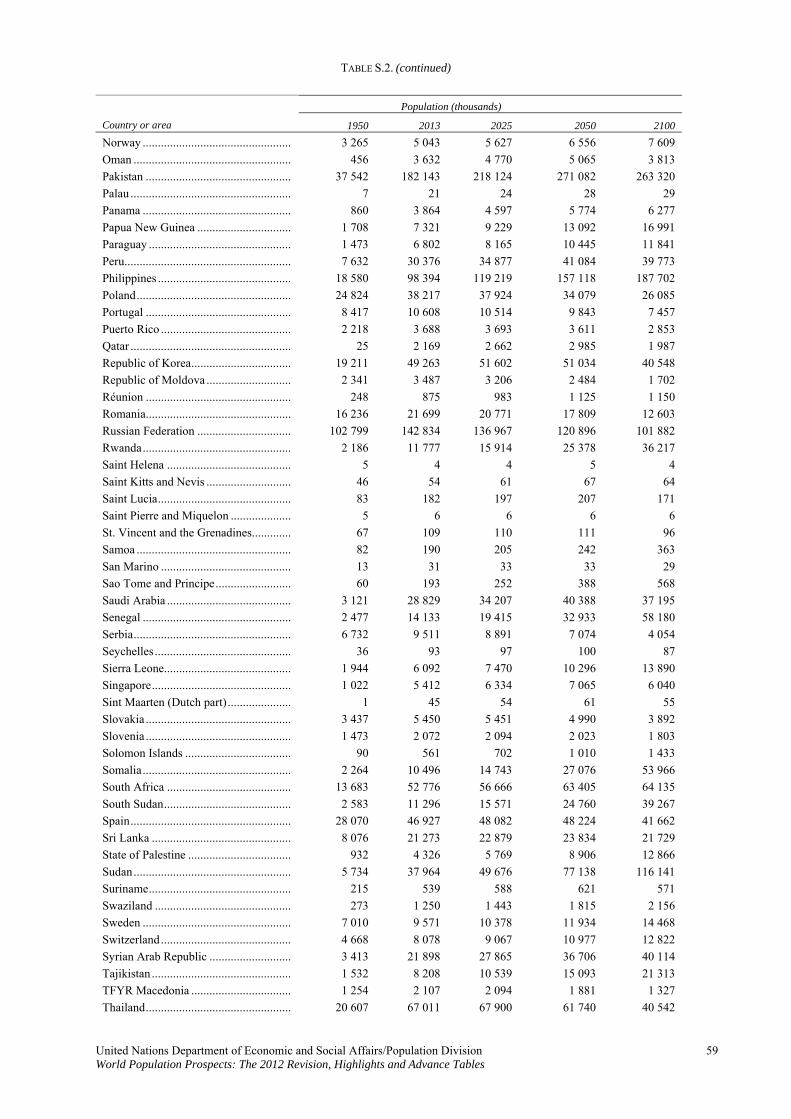
TABLE S.2. (continued)
Population (thousands)
Country or area 1950 2013 2025 2050 2100
Norway ................................................. 3 265 5 043 5 627 6 556 7 609
Oman .................................................... 456 3 632 4 770 5 065 3 813
Pakistan ................................................ 37 542 182 143 218 124 271 082 263 320
Palau ..................................................... 7 21 24 28 29
Panama ................................................. 860 3 864 4 597 5 774 6 277
Papua New Guinea ............................... 1 708 7 321 9 229 13 092 16 991
Paraguay ............................................... 1 473 6 802 8 165 10 445 11 841
Peru....................................................... 7 632 30 376 34 877 41 084 39 773
Philippines ............................................ 18 580 98 394 119 219 157 118 187 702
Poland................................................... 24 824 38 217 37 924 34 079 26 085
Portugal ................................................ 8 417 10 608 10 514 9 843 7 457
Puerto Rico ........................................... 2 218 3 688 3 693 3 611 2 853
Qatar ..................................................... 25 2 169 2 662 2 985 1 987
Republic of Korea................................. 19 211 49 263 51 602 51 034 40 548
Republic of Moldova ............................ 2 341 3 487 3 206 2 484 1 702
Réunion ................................................ 248 875 983 1 125 1 150
Romania................................................ 16 236 21 699 20 771 17 809 12 603
Russian Federation ............................... 102 799 142 834 136 967 120 896 101 882
Rwanda................................................. 2 186 11 777 15 914 25 378 36 217
Saint Helena ......................................... 5 4 4 5 4
Saint Kitts and Nevis ............................ 46 54 61 67 64
Saint Lucia............................................ 83 182 197 207 171
Saint Pierre and Miquelon .................... 5 6 6 6 6
St. Vincent and the Grenadines............. 67 109 110 111 96
Samoa ................................................... 82 190 205 242 363
San Marino ........................................... 13 31 33 33 29
Sao Tome and Principe......................... 60 193 252 388 568
Saudi Arabia ......................................... 3 121 28 829 34 207 40 388 37 195
Senegal ................................................. 2 477 14 133 19 415 32 933 58 180
Serbia.................................................... 6 732 9 511 8 891 7 074 4 054
Seychelles............................................. 36 93 97 100 87
Sierra Leone.......................................... 1 944 6 092 7 470 10 296 13 890
Singapore.............................................. 1 022 5 412 6 334 7 065 6 040
Sint Maarten (Dutch part)..................... 1 45 54 61 55
Slovakia ................................................ 3 437 5 450 5 451 4 990 3 892
Slovenia ................................................ 1 473 2 072 2 094 2 023 1 803
Solomon Islands ................................... 90 561 702 1 010 1 433
Somalia................................................. 2 264 10 496 14 743 27 076 53 966
South Africa ......................................... 13 683 52 776 56 666 63 405 64 135
South Sudan.......................................... 2 583 11 296 15 571 24 760 39 267
Spain..................................................... 28 070 46 927 48 082 48 224 41 662
Sri Lanka .............................................. 8 076 21 273 22 879 23 834 21 729
State of Palestine .................................. 932 4 326 5 769 8 906 12 866
Sudan.................................................... 5 734 37 964 49 676 77 138 116 141
Suriname............................................... 215 539 588 621 571
Swaziland ............................................. 273 1 250 1 443 1 815 2 156
Sweden ................................................. 7 010 9 571 10 378 11 934 14 468
Switzerland........................................... 4 668 8 078 9 067 10 977 12 822
Syrian Arab Republic ........................... 3 413 21 898 27 865 36 706 40 114
Tajikistan .............................................. 1 532 8 208 10 539 15 093 21 313
TFYR Macedonia ................................. 1 254 2 107 2 094 1 881 1 327
Thailand................................................ 20 607 67 011 67 900 61 740 40 542
United Nations Department of Economic and Social Affairs/Population Division 59 World Population Prospects: The 2012 Revision, Highlights and Advance Tables
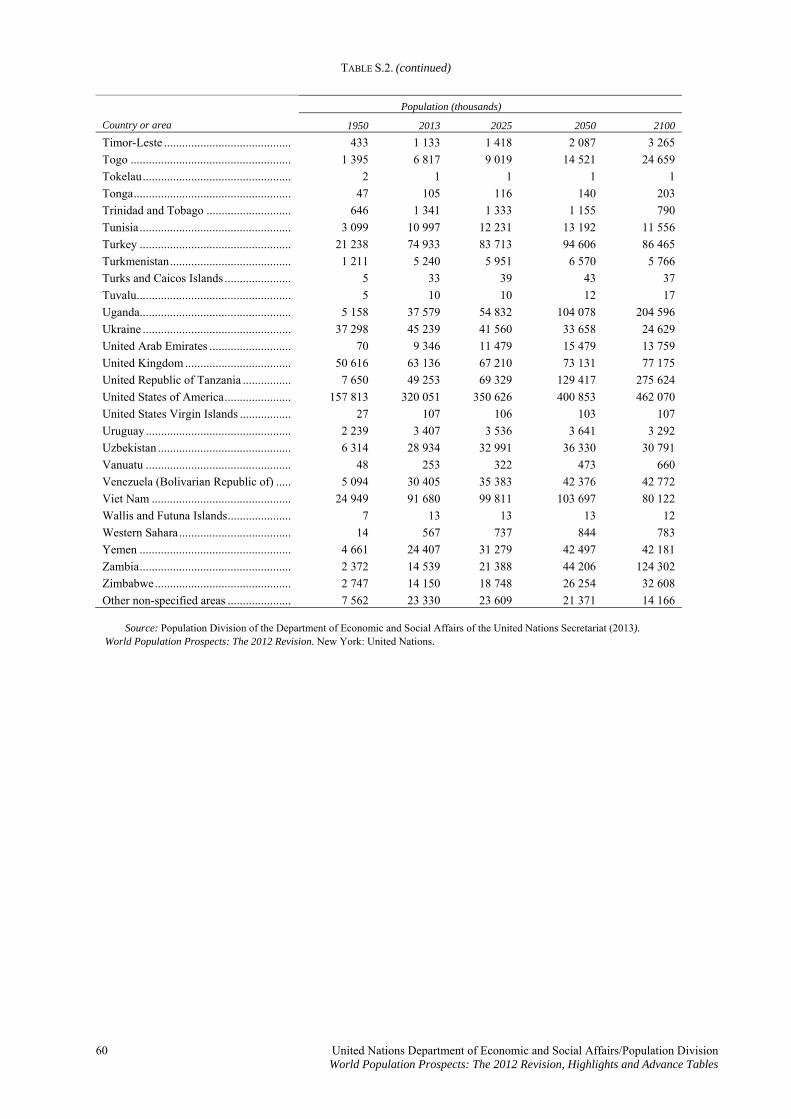
TABLE S.2. (continued)
60 United Nations Department of Economic and Social Affairs/Population Division World Population Prospects: The 2012 Revision, Highlights and Advance Tables
Population (thousands)
Country or area 1950 2013 2025 2050 2100
Timor-Leste .......................................... 433 1 133 1 418 2 087 3 265
Togo ..................................................... 1 395 6 817 9 019 14 521 24 659
Tokelau................................................. 2 1 1 1 1
Tonga.................................................... 47 105 116 140 203
Trinidad and Tobago ............................ 646 1 341 1 333 1 155 790
Tunisia .................................................. 3 099 10 997 12 231 13 192 11 556
Turkey .................................................. 21 238 74 933 83 713 94 606 86 465
Turkmenistan........................................ 1 211 5 240 5 951 6 570 5 766
Turks and Caicos Islands ...................... 5 33 39 43 37
Tuvalu................................................... 5 10 10 12 17
Uganda.................................................. 5 158 37 579 54 832 104 078 204 596
Ukraine ................................................. 37 298 45 239 41 560 33 658 24 629
United Arab Emirates ........................... 70 9 346 11 479 15 479 13 759
United Kingdom ................................... 50 616 63 136 67 210 73 131 77 175
United Republic of Tanzania ................ 7 650 49 253 69 329 129 417 275 624
United States of America...................... 157 813 320 051 350 626 400 853 462 070
United States Virgin Islands ................. 27 107 106 103 107
Uruguay ................................................ 2 239 3 407 3 536 3 641 3 292
Uzbekistan ............................................ 6 314 28 934 32 991 36 330 30 791
Vanuatu ................................................ 48 253 322 473 660
Venezuela (Bolivarian Republic of) ..... 5 094 30 405 35 383 42 376 42 772
Viet Nam .............................................. 24 949 91 680 99 811 103 697 80 122
Wallis and Futuna Islands..................... 7 13 13 13 12
Western Sahara..................................... 14 567 737 844 783
Yemen .................................................. 4 661 24 407 31 279 42 497 42 181
Zambia.................................................. 2 372 14 539 21 388 44 206 124 302
Zimbabwe............................................. 2 747 14 150 18 748 26 254 32 608
Other non-specified areas ..................... 7 562 23 330 23 609 21 371 14 166
Source: Population Division of the Department of Economic and Social Affairs of the United Nations Secretariat (2013). World Population Prospects: The 2012 Revision. New York: United Nations.
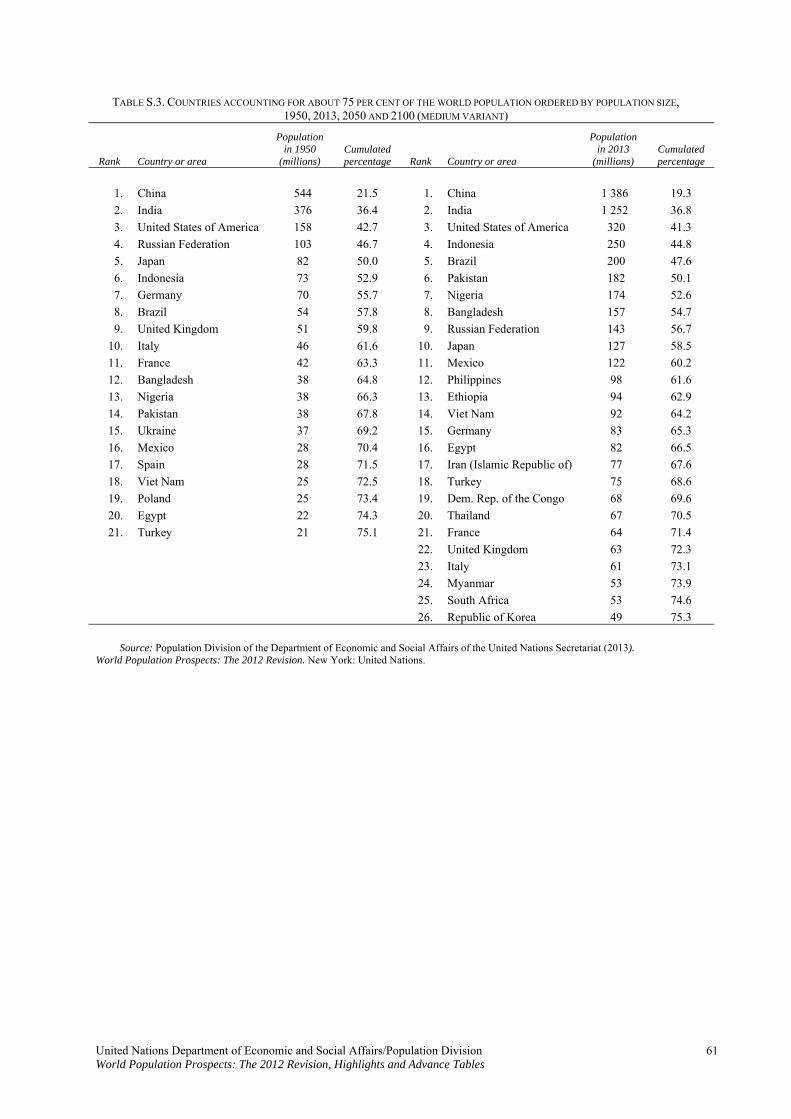
TABLE S.3. COUNTRIES ACCOUNTING FOR ABOUT 75 PER CENT OF THE WORLD POPULATION ORDERED BY POPULATION SIZE, 1950, 2013, 2050 AND 2100 (MEDIUM VARIANT)
Rank Country or area
Population in 1950
(millions) Cumulated percentage Rank Country or area
Population in 2013
(millions) Cumulated percentage
1. China 544 21.5 1. China 1 386 19.3
2. India 376 36.4 2. India 1 252 36.8
3. United States of America 158 42.7 3. United States of America 320 41.3
4. Russian Federation 103 46.7 4. Indonesia 250 44.8
5. Japan 82 50.0 5. Brazil 200 47.6
6. Indonesia 73 52.9 6. Pakistan 182 50.1
7. Germany 70 55.7 7. Nigeria 174 52.6
8. Brazil 54 57.8 8. Bangladesh 157 54.7
9. United Kingdom 51 59.8 9. Russian Federation 143 56.7
10. Italy 46 61.6 10. Japan 127 58.5
11. France 42 63.3 11. Mexico 122 60.2
12. Bangladesh 38 64.8 12. Philippines 98 61.6
13. Nigeria 38 66.3 13. Ethiopia 94 62.9
14. Pakistan 38 67.8 14. Viet Nam 92 64.2
15. Ukraine 37 69.2 15. Germany 83 65.3
16. Mexico 28 70.4 16. Egypt 82 66.5
17. Spain 28 71.5 17. Iran (Islamic Republic of) 77 67.6
18. Viet Nam 25 72.5 18. Turkey 75 68.6
19. Poland 25 73.4 19. Dem. Rep. of the Congo 68 69.6
20. Egypt 22 74.3 20. Thailand 67 70.5
21. Turkey 21 75.1 21. France 64 71.4
22. United Kingdom 63 72.3
23. Italy 61 73.1
24. Myanmar 53 73.9
25. South Africa 53 74.6
26. Republic of Korea 49 75.3
Source: Population Division of the Department of Economic and Social Affairs of the United Nations Secretariat (2013). World Population Prospects: The 2012 Revision. New York: United Nations.
United Nations Department of Economic and Social Affairs/Population Division 61 World Population Prospects: The 2012 Revision, Highlights and Advance Tables
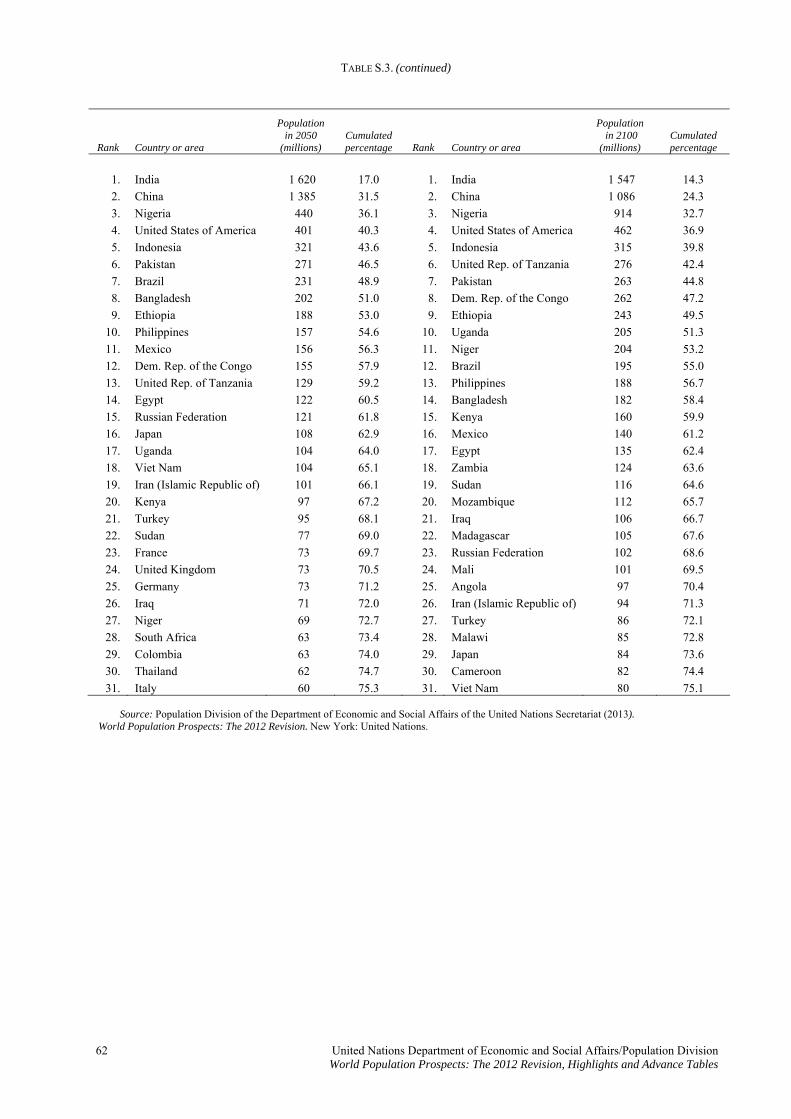
TABLE S.3. (continued)
62 United Nations Department of Economic and Social Affairs/Population Division World Population Prospects: The 2012 Revision, Highlights and Advance Tables
Rank Country or area
Population in 2050
(millions) Cumulated percentage Rank Country or area
Population in 2100
(millions) Cumulated percentage
1. India 1 620 17.0 1. India 1 547 14.3
2. China 1 385 31.5 2. China 1 086 24.3
3. Nigeria 440 36.1 3. Nigeria 914 32.7
4. United States of America 401 40.3 4. United States of America 462 36.9
5. Indonesia 321 43.6 5. Indonesia 315 39.8
6. Pakistan 271 46.5 6. United Rep. of Tanzania 276 42.4
7. Brazil 231 48.9 7. Pakistan 263 44.8
8. Bangladesh 202 51.0 8. Dem. Rep. of the Congo 262 47.2
9. Ethiopia 188 53.0 9. Ethiopia 243 49.5
10. Philippines 157 54.6 10. Uganda 205 51.3
11. Mexico 156 56.3 11. Niger 204 53.2
12. Dem. Rep. of the Congo 155 57.9 12. Brazil 195 55.0
13. United Rep. of Tanzania 129 59.2 13. Philippines 188 56.7
14. Egypt 122 60.5 14. Bangladesh 182 58.4
15. Russian Federation 121 61.8 15. Kenya 160 59.9
16. Japan 108 62.9 16. Mexico 140 61.2
17. Uganda 104 64.0 17. Egypt 135 62.4
18. Viet Nam 104 65.1 18. Zambia 124 63.6
19. Iran (Islamic Republic of) 101 66.1 19. Sudan 116 64.6
20. Kenya 97 67.2 20. Mozambique 112 65.7
21. Turkey 95 68.1 21. Iraq 106 66.7
22. Sudan 77 69.0 22. Madagascar 105 67.6
23. France 73 69.7 23. Russian Federation 102 68.6
24. United Kingdom 73 70.5 24. Mali 101 69.5
25. Germany 73 71.2 25. Angola 97 70.4
26. Iraq 71 72.0 26. Iran (Islamic Republic of) 94 71.3
27. Niger 69 72.7 27. Turkey 86 72.1
28. South Africa 63 73.4 28. Malawi 85 72.8
29. Colombia 63 74.0 29. Japan 84 73.6
30. Thailand 62 74.7 30. Cameroon 82 74.4
31. Italy 60 75.3 31. Viet Nam 80 75.1 Source: Population Division of the Department of Economic and Social Affairs of the United Nations Secretariat (2013). World Population Prospects: The 2012 Revision. New York: United Nations.
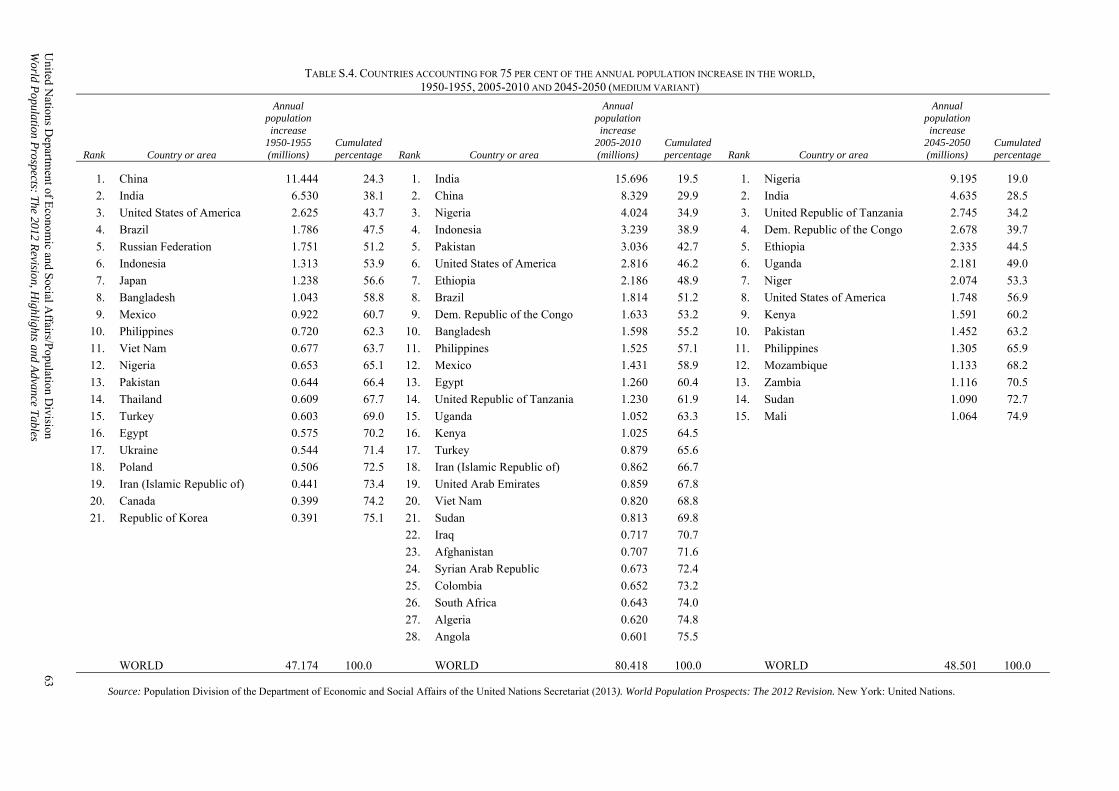
United N
ations Departm
ent of Econom
ic and Social A
ffairs/Population D
ivision 63
World P
opulation Prospects: T
he 2012 Revision, H
ighlights and Advance T
ables
TABLE S.4. COUNTRIES ACCOUNTING FOR 75 PER CENT OF THE ANNUAL POPULATION INCREASE IN THE WORLD, 1950-1955, 2005-2010 AND 2045-2050 (MEDIUM VARIANT)
Rank Country or area
Annual population increase
1950-1955 (millions)
Cumulated percentage Rank Country or area
Annual population increase
2005-2010 (millions)
Cumulated percentage Rank Country or area
Annual population increase
2045-2050 (millions)
Cumulated percentage
1. China 11.444 24.3 1. India 15.696 19.5 1. Nigeria 9.195 19.0
2. India 6.530 38.1 2. China 8.329 29.9 2. India 4.635 28.5
3. United States of America 2.625 43.7 3. Nigeria 4.024 34.9 3. United Republic of Tanzania 2.745 34.2
4. Brazil 1.786 47.5 4. Indonesia 3.239 38.9 4. Dem. Republic of the Congo 2.678 39.7
5. Russian Federation 1.751 51.2 5. Pakistan 3.036 42.7 5. Ethiopia 2.335 44.5
6. Indonesia 1.313 53.9 6. United States of America 2.816 46.2 6. Uganda 2.181 49.0
7. Japan 1.238 56.6 7. Ethiopia 2.186 48.9 7. Niger 2.074 53.3
8. Bangladesh 1.043 58.8 8. Brazil 1.814 51.2 8. United States of America 1.748 56.9
9. Mexico 0.922 60.7 9. Dem. Republic of the Congo 1.633 53.2 9. Kenya 1.591 60.2
10. Philippines 0.720 62.3 10. Bangladesh 1.598 55.2 10. Pakistan 1.452 63.2
11. Viet Nam 0.677 63.7 11. Philippines 1.525 57.1 11. Philippines 1.305 65.9
12. Nigeria 0.653 65.1 12. Mexico 1.431 58.9 12. Mozambique 1.133 68.2
13. Pakistan 0.644 66.4 13. Egypt 1.260 60.4 13. Zambia 1.116 70.5
14. Thailand 0.609 67.7 14. United Republic of Tanzania 1.230 61.9 14. Sudan 1.090 72.7
15. Turkey 0.603 69.0 15. Uganda 1.052 63.3 15. Mali 1.064 74.9
16. Egypt 0.575 70.2 16. Kenya 1.025 64.5
17. Ukraine 0.544 71.4 17. Turkey 0.879 65.6
18. Poland 0.506 72.5 18. Iran (Islamic Republic of) 0.862 66.7
19. Iran (Islamic Republic of) 0.441 73.4 19. United Arab Emirates 0.859 67.8
20. Canada 0.399 74.2 20. Viet Nam 0.820 68.8
21. Republic of Korea 0.391 75.1 21. Sudan 0.813 69.8
22. Iraq 0.717 70.7
23. Afghanistan 0.707 71.6
24. Syrian Arab Republic 0.673 72.4
25. Colombia 0.652 73.2
26. South Africa 0.643 74.0
27. Algeria 0.620 74.8
28. Angola 0.601 75.5
WORLD 47.174 100.0 WORLD 80.418 100.0 WORLD 48.501 100.0 Source: Population Division of the Department of Economic and Social Affairs of the United Nations Secretariat (2013). World Population Prospects: The 2012 Revision. New York: United Nations.
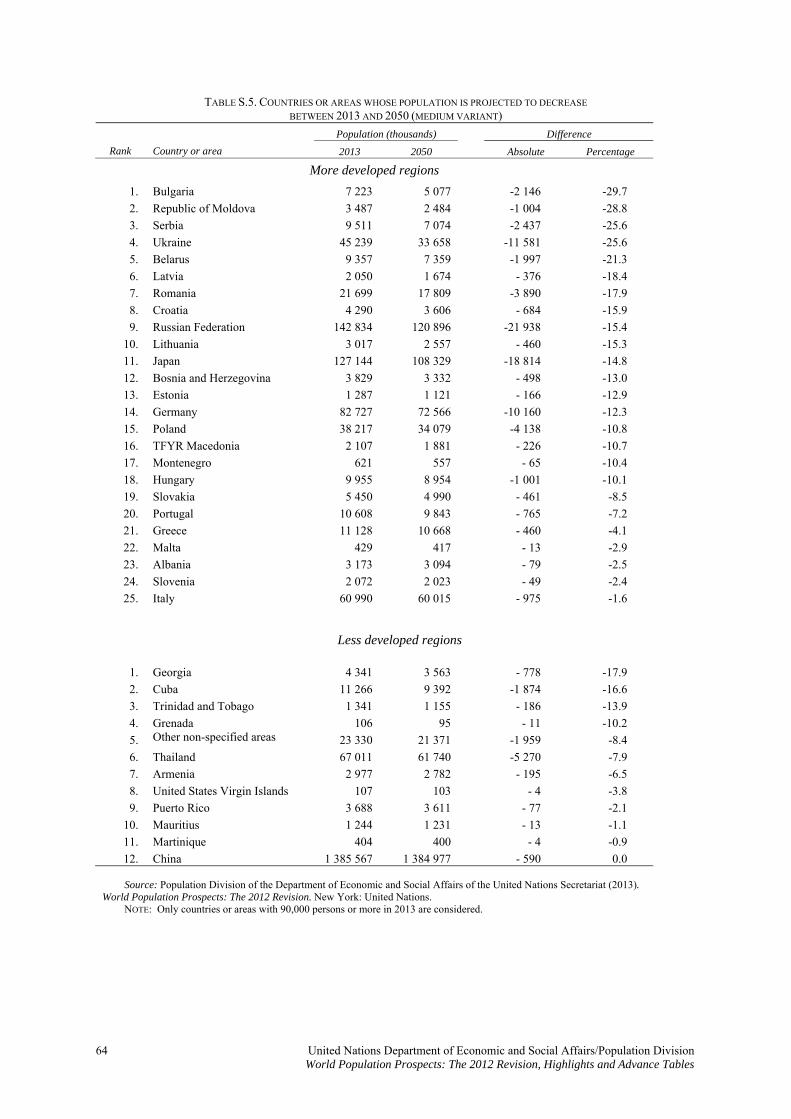
TABLE S.5. COUNTRIES OR AREAS WHOSE POPULATION IS PROJECTED TO DECREASE BETWEEN 2013 AND 2050 (MEDIUM VARIANT)
Population (thousands) Difference
Rank Country or area 2013 2050 Absolute Percentage
More developed regions
1. Bulgaria 7 223 5 077 -2 146 -29.7
2. Republic of Moldova 3 487 2 484 -1 004 -28.8
3. Serbia 9 511 7 074 -2 437 -25.6
4. Ukraine 45 239 33 658 -11 581 -25.6
5. Belarus 9 357 7 359 -1 997 -21.3
6. Latvia 2 050 1 674 - 376 -18.4
7. Romania 21 699 17 809 -3 890 -17.9
8. Croatia 4 290 3 606 - 684 -15.9
9. Russian Federation 142 834 120 896 -21 938 -15.4
10. Lithuania 3 017 2 557 - 460 -15.3
11. Japan 127 144 108 329 -18 814 -14.8
12. Bosnia and Herzegovina 3 829 3 332 - 498 -13.0
13. Estonia 1 287 1 121 - 166 -12.9
14. Germany 82 727 72 566 -10 160 -12.3
15. Poland 38 217 34 079 -4 138 -10.8
16. TFYR Macedonia 2 107 1 881 - 226 -10.7
17. Montenegro 621 557 - 65 -10.4
18. Hungary 9 955 8 954 -1 001 -10.1
19. Slovakia 5 450 4 990 - 461 -8.5
20. Portugal 10 608 9 843 - 765 -7.2
21. Greece 11 128 10 668 - 460 -4.1
22. Malta 429 417 - 13 -2.9
23. Albania 3 173 3 094 - 79 -2.5
24. Slovenia 2 072 2 023 - 49 -2.4
25. Italy 60 990 60 015 - 975 -1.6
Less developed regions
1. Georgia 4 341 3 563 - 778 -17.9
2. Cuba 11 266 9 392 -1 874 -16.6
3. Trinidad and Tobago 1 341 1 155 - 186 -13.9
4. Grenada 106 95 - 11 -10.2
5. Other non-specified areas 23 330 21 371 -1 959 -8.4
6. Thailand 67 011 61 740 -5 270 -7.9
7. Armenia 2 977 2 782 - 195 -6.5
8. United States Virgin Islands 107 103 - 4 -3.8
9. Puerto Rico 3 688 3 611 - 77 -2.1
10. Mauritius 1 244 1 231 - 13 -1.1
11. Martinique 404 400 - 4 -0.9
12. China 1 385 567 1 384 977 - 590 0.0 Source: Population Division of the Department of Economic and Social Affairs of the United Nations Secretariat (2013). World Population Prospects: The 2012 Revision. New York: United Nations. NOTE: Only countries or areas with 90,000 persons or more in 2013 are considered.
64 United Nations Department of Economic and Social Affairs/Population Division World Population Prospects: The 2012 Revision, Highlights and Advance Tables
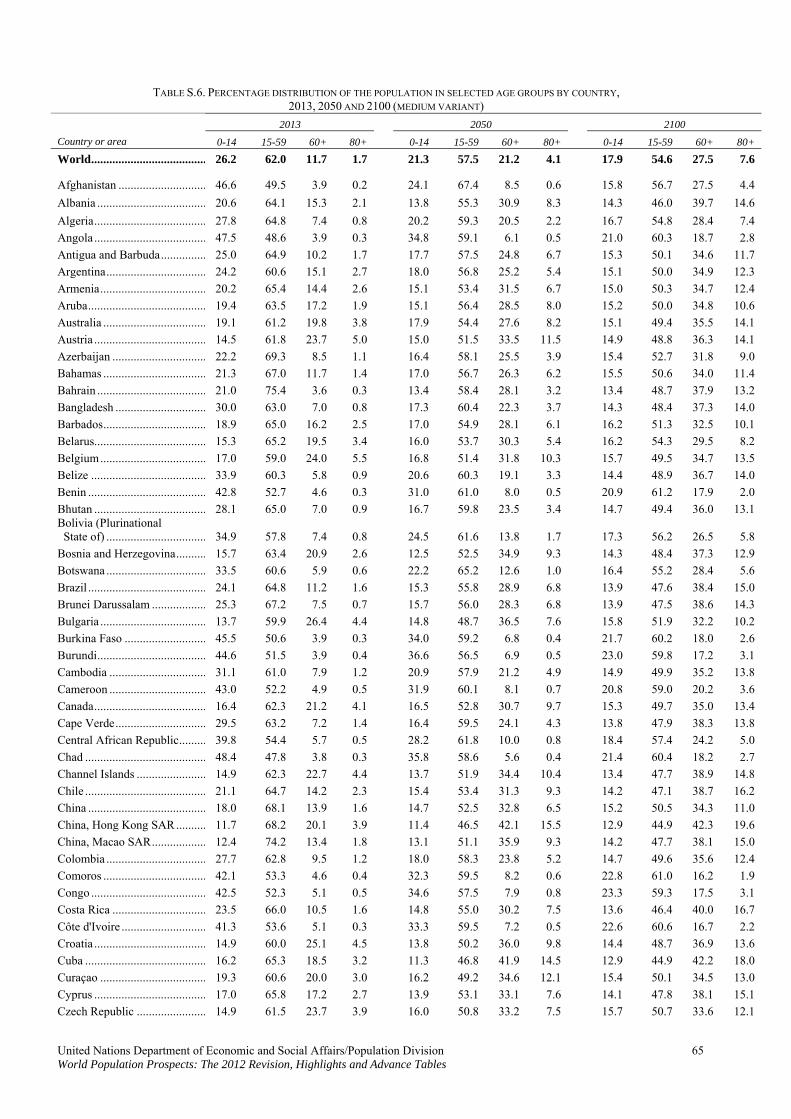
TABLE S.6. PERCENTAGE DISTRIBUTION OF THE POPULATION IN SELECTED AGE GROUPS BY COUNTRY, 2013, 2050 AND 2100 (MEDIUM VARIANT)
2013 2050 2100
Country or area 0-14 15-59 60+ 80+ 0-14 15-59 60+ 80+ 0-14 15-59 60+ 80+
World...................................... 26.2 62.0 11.7 1.7 21.3 57.5 21.2 4.1 17.9 54.6 27.5 7.6
Afghanistan ............................. 46.6 49.5 3.9 0.2 24.1 67.4 8.5 0.6 15.8 56.7 27.5 4.4
Albania .................................... 20.6 64.1 15.3 2.1 13.8 55.3 30.9 8.3 14.3 46.0 39.7 14.6
Algeria..................................... 27.8 64.8 7.4 0.8 20.2 59.3 20.5 2.2 16.7 54.8 28.4 7.4
Angola ..................................... 47.5 48.6 3.9 0.3 34.8 59.1 6.1 0.5 21.0 60.3 18.7 2.8
Antigua and Barbuda............... 25.0 64.9 10.2 1.7 17.7 57.5 24.8 6.7 15.3 50.1 34.6 11.7
Argentina................................. 24.2 60.6 15.1 2.7 18.0 56.8 25.2 5.4 15.1 50.0 34.9 12.3
Armenia................................... 20.2 65.4 14.4 2.6 15.1 53.4 31.5 6.7 15.0 50.3 34.7 12.4
Aruba....................................... 19.4 63.5 17.2 1.9 15.1 56.4 28.5 8.0 15.2 50.0 34.8 10.6
Australia .................................. 19.1 61.2 19.8 3.8 17.9 54.4 27.6 8.2 15.1 49.4 35.5 14.1
Austria ..................................... 14.5 61.8 23.7 5.0 15.0 51.5 33.5 11.5 14.9 48.8 36.3 14.1
Azerbaijan ............................... 22.2 69.3 8.5 1.1 16.4 58.1 25.5 3.9 15.4 52.7 31.8 9.0
Bahamas .................................. 21.3 67.0 11.7 1.4 17.0 56.7 26.3 6.2 15.5 50.6 34.0 11.4
Bahrain .................................... 21.0 75.4 3.6 0.3 13.4 58.4 28.1 3.2 13.4 48.7 37.9 13.2
Bangladesh .............................. 30.0 63.0 7.0 0.8 17.3 60.4 22.3 3.7 14.3 48.4 37.3 14.0
Barbados.................................. 18.9 65.0 16.2 2.5 17.0 54.9 28.1 6.1 16.2 51.3 32.5 10.1
Belarus..................................... 15.3 65.2 19.5 3.4 16.0 53.7 30.3 5.4 16.2 54.3 29.5 8.2
Belgium................................... 17.0 59.0 24.0 5.5 16.8 51.4 31.8 10.3 15.7 49.5 34.7 13.5
Belize ...................................... 33.9 60.3 5.8 0.9 20.6 60.3 19.1 3.3 14.4 48.9 36.7 14.0
Benin ....................................... 42.8 52.7 4.6 0.3 31.0 61.0 8.0 0.5 20.9 61.2 17.9 2.0
Bhutan ..................................... 28.1 65.0 7.0 0.9 16.7 59.8 23.5 3.4 14.7 49.4 36.0 13.1 Bolivia (Plurinational State of) ................................. 34.9 57.8 7.4 0.8 24.5 61.6 13.8 1.7 17.3 56.2 26.5 5.8
Bosnia and Herzegovina.......... 15.7 63.4 20.9 2.6 12.5 52.5 34.9 9.3 14.3 48.4 37.3 12.9
Botswana ................................. 33.5 60.6 5.9 0.6 22.2 65.2 12.6 1.0 16.4 55.2 28.4 5.6
Brazil ....................................... 24.1 64.8 11.2 1.6 15.3 55.8 28.9 6.8 13.9 47.6 38.4 15.0
Brunei Darussalam .................. 25.3 67.2 7.5 0.7 15.7 56.0 28.3 6.8 13.9 47.5 38.6 14.3
Bulgaria ................................... 13.7 59.9 26.4 4.4 14.8 48.7 36.5 7.6 15.8 51.9 32.2 10.2
Burkina Faso ........................... 45.5 50.6 3.9 0.3 34.0 59.2 6.8 0.4 21.7 60.2 18.0 2.6
Burundi.................................... 44.6 51.5 3.9 0.4 36.6 56.5 6.9 0.5 23.0 59.8 17.2 3.1
Cambodia ................................ 31.1 61.0 7.9 1.2 20.9 57.9 21.2 4.9 14.9 49.9 35.2 13.8
Cameroon ................................ 43.0 52.2 4.9 0.5 31.9 60.1 8.1 0.7 20.8 59.0 20.2 3.6
Canada..................................... 16.4 62.3 21.2 4.1 16.5 52.8 30.7 9.7 15.3 49.7 35.0 13.4
Cape Verde.............................. 29.5 63.2 7.2 1.4 16.4 59.5 24.1 4.3 13.8 47.9 38.3 13.8
Central African Republic......... 39.8 54.4 5.7 0.5 28.2 61.8 10.0 0.8 18.4 57.4 24.2 5.0
Chad ........................................ 48.4 47.8 3.8 0.3 35.8 58.6 5.6 0.4 21.4 60.4 18.2 2.7
Channel Islands ....................... 14.9 62.3 22.7 4.4 13.7 51.9 34.4 10.4 13.4 47.7 38.9 14.8
Chile ........................................ 21.1 64.7 14.2 2.3 15.4 53.4 31.3 9.3 14.2 47.1 38.7 16.2
China ....................................... 18.0 68.1 13.9 1.6 14.7 52.5 32.8 6.5 15.2 50.5 34.3 11.0
China, Hong Kong SAR.......... 11.7 68.2 20.1 3.9 11.4 46.5 42.1 15.5 12.9 44.9 42.3 19.6
China, Macao SAR.................. 12.4 74.2 13.4 1.8 13.1 51.1 35.9 9.3 14.2 47.7 38.1 15.0
Colombia ................................. 27.7 62.8 9.5 1.2 18.0 58.3 23.8 5.2 14.7 49.6 35.6 12.4
Comoros .................................. 42.1 53.3 4.6 0.4 32.3 59.5 8.2 0.6 22.8 61.0 16.2 1.9
Congo ...................................... 42.5 52.3 5.1 0.5 34.6 57.5 7.9 0.8 23.3 59.3 17.5 3.1
Costa Rica ............................... 23.5 66.0 10.5 1.6 14.8 55.0 30.2 7.5 13.6 46.4 40.0 16.7
Côte d'Ivoire ............................ 41.3 53.6 5.1 0.3 33.3 59.5 7.2 0.5 22.6 60.6 16.7 2.2
Croatia ..................................... 14.9 60.0 25.1 4.5 13.8 50.2 36.0 9.8 14.4 48.7 36.9 13.6
Cuba ........................................ 16.2 65.3 18.5 3.2 11.3 46.8 41.9 14.5 12.9 44.9 42.2 18.0
Curaçao ................................... 19.3 60.6 20.0 3.0 16.2 49.2 34.6 12.1 15.4 50.1 34.5 13.0
Cyprus ..................................... 17.0 65.8 17.2 2.7 13.9 53.1 33.1 7.6 14.1 47.8 38.1 15.1
Czech Republic ....................... 14.9 61.5 23.7 3.9 16.0 50.8 33.2 7.5 15.7 50.7 33.6 12.1
United Nations Department of Economic and Social Affairs/Population Division 65 World Population Prospects: The 2012 Revision, Highlights and Advance Tables
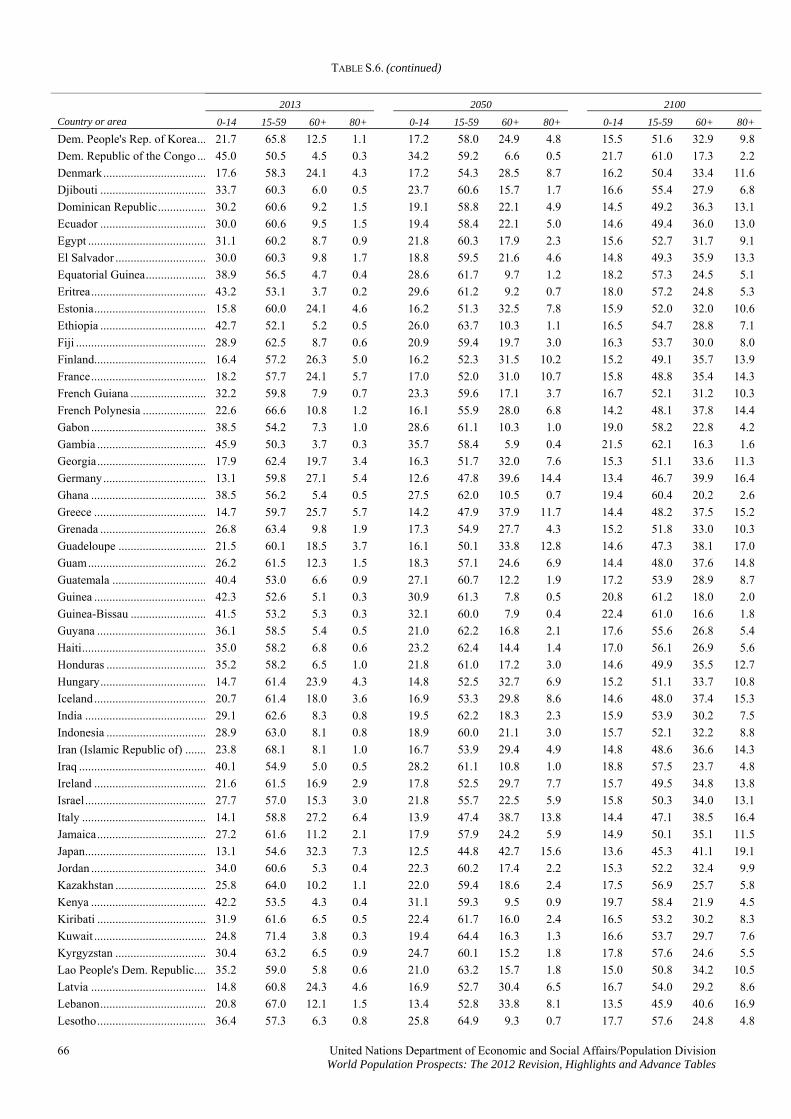
TABLE S.6. (continued)
2013 2050 2100
Country or area 0-14 15-59 60+ 80+ 0-14 15-59 60+ 80+ 0-14 60+ 80+ 15-59
Dem. People's Rep. of Korea... 21.7 65.8 12.5 1.1 17.2 58.0 24.9 4.8 15.5 51.6 32.9 9.8
Dem. Republic of the Congo ... 45.0 50.5 4.5 0.3 34.2 59.2 6.6 0.5 21.7 61.0 17.3 2.2
Denmark.................................. 17.6 58.3 24.1 4.3 17.2 54.3 28.5 8.7 16.2 50.4 33.4 11.6
Djibouti ................................... 33.7 60.3 6.0 0.5 23.7 60.6 15.7 1.7 16.6 55.4 27.9 6.8
Dominican Republic................ 30.2 60.6 9.2 1.5 19.1 58.8 22.1 4.9 14.5 49.2 36.3 13.1
Ecuador ................................... 30.0 60.6 9.5 1.5 19.4 58.4 22.1 5.0 14.6 49.4 36.0 13.0
Egypt ....................................... 31.1 60.2 8.7 0.9 21.8 60.3 17.9 2.3 15.6 52.7 31.7 9.1
El Salvador .............................. 30.0 60.3 9.8 1.7 18.8 59.5 21.6 4.6 14.8 49.3 35.9 13.3
Equatorial Guinea.................... 38.9 56.5 4.7 0.4 28.6 61.7 9.7 1.2 18.2 57.3 24.5 5.1
Eritrea...................................... 43.2 53.1 3.7 0.2 29.6 61.2 9.2 0.7 18.0 57.2 24.8 5.3
Estonia..................................... 15.8 60.0 24.1 4.6 16.2 51.3 32.5 7.8 15.9 52.0 32.0 10.6
Ethiopia ................................... 42.7 52.1 5.2 0.5 26.0 63.7 10.3 1.1 16.5 54.7 28.8 7.1
Fiji ........................................... 28.9 62.5 8.7 0.6 20.9 59.4 19.7 3.0 16.3 53.7 30.0 8.0
Finland..................................... 16.4 57.2 26.3 5.0 16.2 52.3 31.5 10.2 15.2 49.1 35.7 13.9
France...................................... 18.2 57.7 24.1 5.7 17.0 52.0 31.0 10.7 15.8 48.8 35.4 14.3
French Guiana ......................... 32.2 59.8 7.9 0.7 23.3 59.6 17.1 3.7 16.7 52.1 31.2 10.3
French Polynesia ..................... 22.6 66.6 10.8 1.2 16.1 55.9 28.0 6.8 14.2 48.1 37.8 14.4
Gabon ...................................... 38.5 54.2 7.3 1.0 28.6 61.1 10.3 1.0 19.0 58.2 22.8 4.2
Gambia .................................... 45.9 50.3 3.7 0.3 35.7 58.4 5.9 0.4 21.5 62.1 16.3 1.6
Georgia.................................... 17.9 62.4 19.7 3.4 16.3 51.7 32.0 7.6 15.3 51.1 33.6 11.3
Germany.................................. 13.1 59.8 27.1 5.4 12.6 47.8 39.6 14.4 13.4 46.7 39.9 16.4
Ghana ...................................... 38.5 56.2 5.4 0.5 27.5 62.0 10.5 0.7 19.4 60.4 20.2 2.6
Greece ..................................... 14.7 59.7 25.7 5.7 14.2 47.9 37.9 11.7 14.4 48.2 37.5 15.2
Grenada ................................... 26.8 63.4 9.8 1.9 17.3 54.9 27.7 4.3 15.2 51.8 33.0 10.3
Guadeloupe ............................. 21.5 60.1 18.5 3.7 16.1 50.1 33.8 12.8 14.6 47.3 38.1 17.0
Guam....................................... 26.2 61.5 12.3 1.5 18.3 57.1 24.6 6.9 14.4 48.0 37.6 14.8
Guatemala ............................... 40.4 53.0 6.6 0.9 27.1 60.7 12.2 1.9 17.2 53.9 28.9 8.7
Guinea ..................................... 42.3 52.6 5.1 0.3 30.9 61.3 7.8 0.5 20.8 61.2 18.0 2.0
Guinea-Bissau ......................... 41.5 53.2 5.3 0.3 32.1 60.0 7.9 0.4 22.4 61.0 16.6 1.8
Guyana .................................... 36.1 58.5 5.4 0.5 21.0 62.2 16.8 2.1 17.6 55.6 26.8 5.4
Haiti......................................... 35.0 58.2 6.8 0.6 23.2 62.4 14.4 1.4 17.0 56.1 26.9 5.6
Honduras ................................. 35.2 58.2 6.5 1.0 21.8 61.0 17.2 3.0 14.6 49.9 35.5 12.7
Hungary................................... 14.7 61.4 23.9 4.3 14.8 52.5 32.7 6.9 15.2 51.1 33.7 10.8
Iceland..................................... 20.7 61.4 18.0 3.6 16.9 53.3 29.8 8.6 14.6 48.0 37.4 15.3
India ........................................ 29.1 62.6 8.3 0.8 19.5 62.2 18.3 2.3 15.9 53.9 30.2 7.5
Indonesia ................................. 28.9 63.0 8.1 0.8 18.9 60.0 21.1 3.0 15.7 52.1 32.2 8.8
Iran (Islamic Republic of) ....... 23.8 68.1 8.1 1.0 16.7 53.9 29.4 4.9 14.8 48.6 36.6 14.3
Iraq .......................................... 40.1 54.9 5.0 0.5 28.2 61.1 10.8 1.0 18.8 57.5 23.7 4.8
Ireland ..................................... 21.6 61.5 16.9 2.9 17.8 52.5 29.7 7.7 15.7 49.5 34.8 13.8
Israel........................................ 27.7 57.0 15.3 3.0 21.8 55.7 22.5 5.9 15.8 50.3 34.0 13.1
Italy ......................................... 14.1 58.8 27.2 6.4 13.9 47.4 38.7 13.8 14.4 47.1 38.5 16.4
Jamaica.................................... 27.2 61.6 11.2 2.1 17.9 57.9 24.2 5.9 14.9 50.1 35.1 11.5
Japan........................................ 13.1 54.6 32.3 7.3 12.5 44.8 42.7 15.6 13.6 45.3 41.1 19.1
Jordan ...................................... 34.0 60.6 5.3 0.4 22.3 60.2 17.4 2.2 15.3 52.2 32.4 9.9
Kazakhstan .............................. 25.8 64.0 10.2 1.1 22.0 59.4 18.6 2.4 17.5 56.9 25.7 5.8
Kenya ...................................... 42.2 53.5 4.3 0.4 31.1 59.3 9.5 0.9 19.7 58.4 21.9 4.5
Kiribati .................................... 31.9 61.6 6.5 0.5 22.4 61.7 16.0 2.4 16.5 53.2 30.2 8.3
Kuwait ..................................... 24.8 71.4 3.8 0.3 19.4 64.4 16.3 1.3 16.6 53.7 29.7 7.6
Kyrgyzstan .............................. 30.4 63.2 6.5 0.9 24.7 60.1 15.2 1.8 17.8 57.6 24.6 5.5
Lao People's Dem. Republic.... 35.2 59.0 5.8 0.6 21.0 63.2 15.7 1.8 15.0 50.8 34.2 10.5
Latvia ...................................... 14.8 60.8 24.3 4.6 16.9 52.7 30.4 6.5 16.7 54.0 29.2 8.6
Lebanon................................... 20.8 67.0 12.1 1.5 13.4 52.8 33.8 8.1 13.5 45.9 40.6 16.9
Lesotho.................................... 36.4 57.3 6.3 0.8 25.8 64.9 9.3 0.7 17.7 57.6 24.8 4.8
66 United Nations Department of Economic and Social Affairs/Population Division World Population Prospects: The 2012 Revision, Highlights and Advance Tables
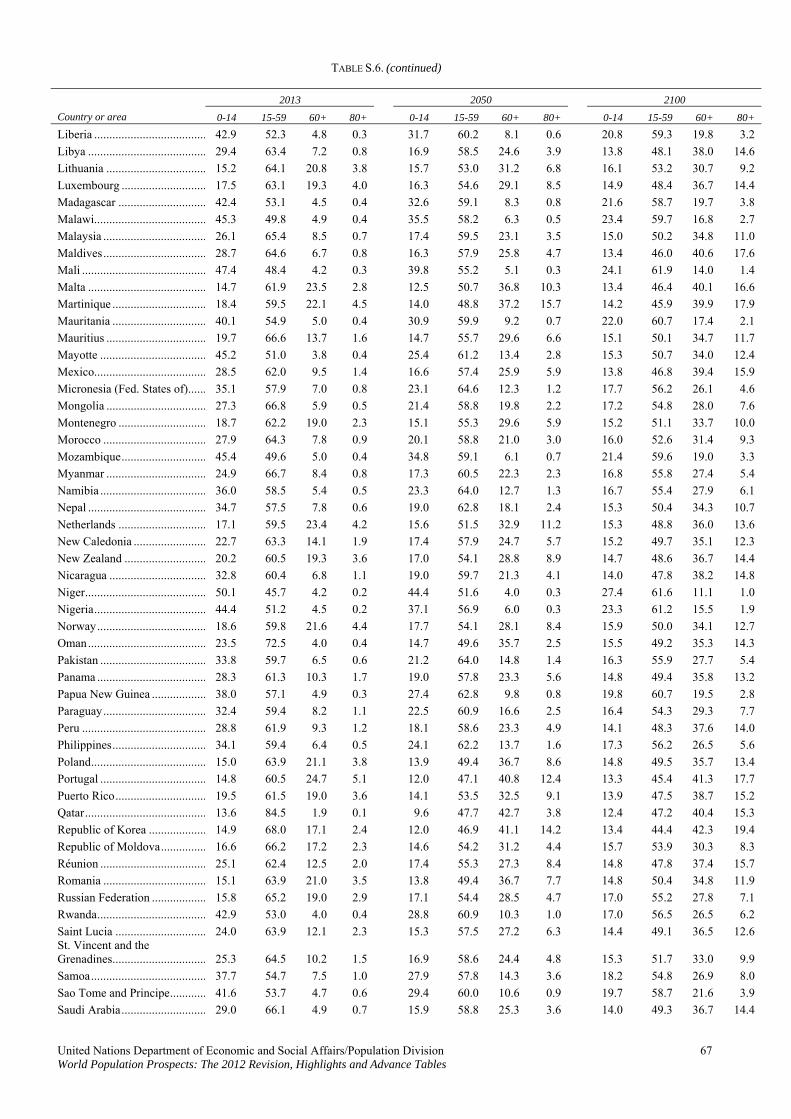
TABLE S.6. (continued)
2013 2050 2100
Country or area 0-14 15-59 60+ 80+ 0-14 15-59 60+ 80+ 0-14 15-59 60+ 80+
Liberia ..................................... 42.9 52.3 4.8 0.3 31.7 60.2 8.1 0.6 20.8 59.3 19.8 3.2
Libya ....................................... 29.4 63.4 7.2 0.8 16.9 58.5 24.6 3.9 13.8 48.1 38.0 14.6
Lithuania ................................. 15.2 64.1 20.8 3.8 15.7 53.0 31.2 6.8 16.1 53.2 30.7 9.2
Luxembourg ............................ 17.5 63.1 19.3 4.0 16.3 54.6 29.1 8.5 14.9 48.4 36.7 14.4
Madagascar ............................. 42.4 53.1 4.5 0.4 32.6 59.1 8.3 0.8 21.6 58.7 19.7 3.8
Malawi..................................... 45.3 49.8 4.9 0.4 35.5 58.2 6.3 0.5 23.4 59.7 16.8 2.7
Malaysia .................................. 26.1 65.4 8.5 0.7 17.4 59.5 23.1 3.5 15.0 50.2 34.8 11.0
Maldives.................................. 28.7 64.6 6.7 0.8 16.3 57.9 25.8 4.7 13.4 46.0 40.6 17.6
Mali ......................................... 47.4 48.4 4.2 0.3 39.8 55.2 5.1 0.3 24.1 61.9 14.0 1.4
Malta ....................................... 14.7 61.9 23.5 2.8 12.5 50.7 36.8 10.3 13.4 46.4 40.1 16.6
Martinique ............................... 18.4 59.5 22.1 4.5 14.0 48.8 37.2 15.7 14.2 45.9 39.9 17.9
Mauritania ............................... 40.1 54.9 5.0 0.4 30.9 59.9 9.2 0.7 22.0 60.7 17.4 2.1
Mauritius ................................. 19.7 66.6 13.7 1.6 14.7 55.7 29.6 6.6 15.1 50.1 34.7 11.7
Mayotte ................................... 45.2 51.0 3.8 0.4 25.4 61.2 13.4 2.8 15.3 50.7 34.0 12.4
Mexico..................................... 28.5 62.0 9.5 1.4 16.6 57.4 25.9 5.9 13.8 46.8 39.4 15.9
Micronesia (Fed. States of)...... 35.1 57.9 7.0 0.8 23.1 64.6 12.3 1.2 17.7 56.2 26.1 4.6
Mongolia ................................. 27.3 66.8 5.9 0.5 21.4 58.8 19.8 2.2 17.2 54.8 28.0 7.6
Montenegro ............................. 18.7 62.2 19.0 2.3 15.1 55.3 29.6 5.9 15.2 51.1 33.7 10.0
Morocco .................................. 27.9 64.3 7.8 0.9 20.1 58.8 21.0 3.0 16.0 52.6 31.4 9.3
Mozambique............................ 45.4 49.6 5.0 0.4 34.8 59.1 6.1 0.7 21.4 59.6 19.0 3.3
Myanmar ................................. 24.9 66.7 8.4 0.8 17.3 60.5 22.3 2.3 16.8 55.8 27.4 5.4
Namibia ................................... 36.0 58.5 5.4 0.5 23.3 64.0 12.7 1.3 16.7 55.4 27.9 6.1
Nepal ....................................... 34.7 57.5 7.8 0.6 19.0 62.8 18.1 2.4 15.3 50.4 34.3 10.7
Netherlands ............................. 17.1 59.5 23.4 4.2 15.6 51.5 32.9 11.2 15.3 48.8 36.0 13.6
New Caledonia ........................ 22.7 63.3 14.1 1.9 17.4 57.9 24.7 5.7 15.2 49.7 35.1 12.3
New Zealand ........................... 20.2 60.5 19.3 3.6 17.0 54.1 28.8 8.9 14.7 48.6 36.7 14.4
Nicaragua ................................ 32.8 60.4 6.8 1.1 19.0 59.7 21.3 4.1 14.0 47.8 38.2 14.8
Niger........................................ 50.1 45.7 4.2 0.2 44.4 51.6 4.0 0.3 27.4 61.6 11.1 1.0
Nigeria..................................... 44.4 51.2 4.5 0.2 37.1 56.9 6.0 0.3 23.3 61.2 15.5 1.9
Norway.................................... 18.6 59.8 21.6 4.4 17.7 54.1 28.1 8.4 15.9 50.0 34.1 12.7
Oman....................................... 23.5 72.5 4.0 0.4 14.7 49.6 35.7 2.5 15.5 49.2 35.3 14.3
Pakistan ................................... 33.8 59.7 6.5 0.6 21.2 64.0 14.8 1.4 16.3 55.9 27.7 5.4
Panama .................................... 28.3 61.3 10.3 1.7 19.0 57.8 23.3 5.6 14.8 49.4 35.8 13.2
Papua New Guinea .................. 38.0 57.1 4.9 0.3 27.4 62.8 9.8 0.8 19.8 60.7 19.5 2.8
Paraguay.................................. 32.4 59.4 8.2 1.1 22.5 60.9 16.6 2.5 16.4 54.3 29.3 7.7
Peru ......................................... 28.8 61.9 9.3 1.2 18.1 58.6 23.3 4.9 14.1 48.3 37.6 14.0
Philippines............................... 34.1 59.4 6.4 0.5 24.1 62.2 13.7 1.6 17.3 56.2 26.5 5.6
Poland...................................... 15.0 63.9 21.1 3.8 13.9 49.4 36.7 8.6 14.8 49.5 35.7 13.4
Portugal ................................... 14.8 60.5 24.7 5.1 12.0 47.1 40.8 12.4 13.3 45.4 41.3 17.7
Puerto Rico.............................. 19.5 61.5 19.0 3.6 14.1 53.5 32.5 9.1 13.9 47.5 38.7 15.2
Qatar........................................ 13.6 84.5 1.9 0.1 9.6 47.7 42.7 3.8 12.4 47.2 40.4 15.3
Republic of Korea ................... 14.9 68.0 17.1 2.4 12.0 46.9 41.1 14.2 13.4 44.4 42.3 19.4
Republic of Moldova............... 16.6 66.2 17.2 2.3 14.6 54.2 31.2 4.4 15.7 53.9 30.3 8.3
Réunion ................................... 25.1 62.4 12.5 2.0 17.4 55.3 27.3 8.4 14.8 47.8 37.4 15.7
Romania .................................. 15.1 63.9 21.0 3.5 13.8 49.4 36.7 7.7 14.8 50.4 34.8 11.9
Russian Federation .................. 15.8 65.2 19.0 2.9 17.1 54.4 28.5 4.7 17.0 55.2 27.8 7.1
Rwanda.................................... 42.9 53.0 4.0 0.4 28.8 60.9 10.3 1.0 17.0 56.5 26.5 6.2
Saint Lucia .............................. 24.0 63.9 12.1 2.3 15.3 57.5 27.2 6.3 14.4 49.1 36.5 12.6 St. Vincent and the Grenadines............................... 25.3 64.5 10.2 1.5 16.9 58.6 24.4 4.8 15.3 51.7 33.0 9.9
Samoa...................................... 37.7 54.7 7.5 1.0 27.9 57.8 14.3 3.6 18.2 54.8 26.9 8.0
Sao Tome and Principe............ 41.6 53.7 4.7 0.6 29.4 60.0 10.6 0.9 19.7 58.7 21.6 3.9
Saudi Arabia............................ 29.0 66.1 4.9 0.7 15.9 58.8 25.3 3.6 14.0 49.3 36.7 14.4
United Nations Department of Economic and Social Affairs/Population Division 67 World Population Prospects: The 2012 Revision, Highlights and Advance Tables
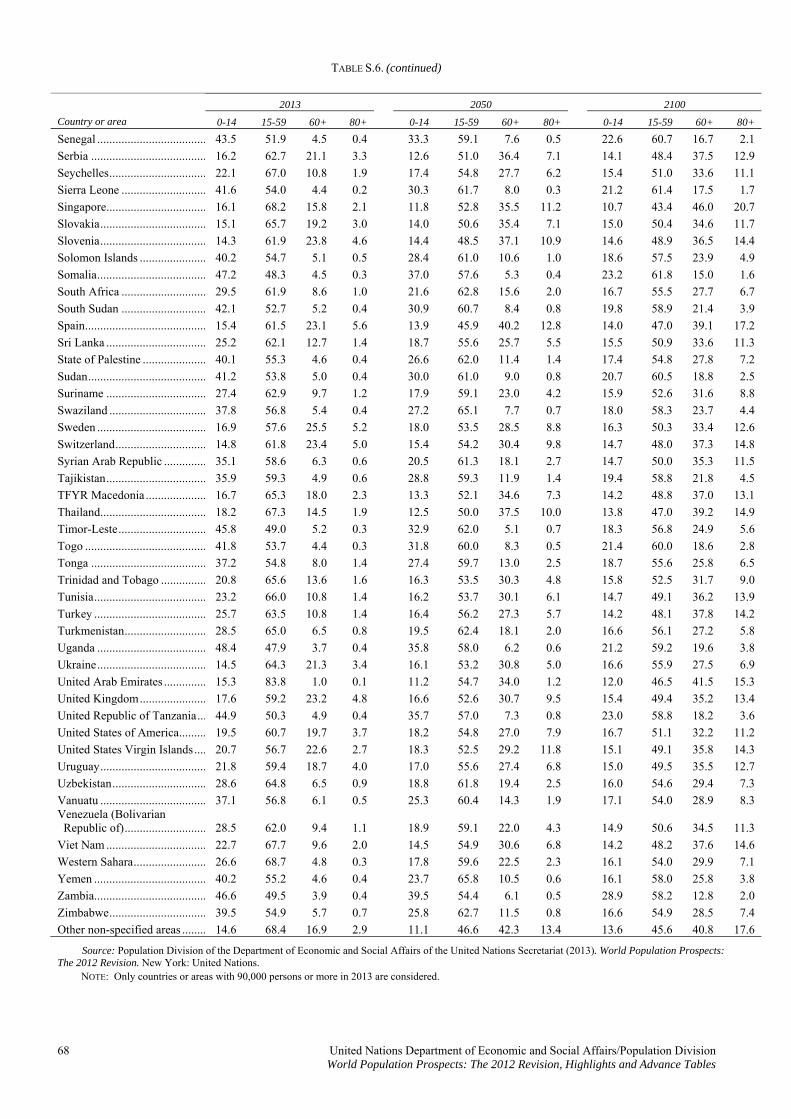
TABLE S.6. (continued)
68 United Nations Department of Economic and Social Affairs/Population Division World Population Prospects: The 2012 Revision, Highlights and Advance Tables
2013 2050 2100
Country or area 0-14 15-59 60+ 80+ 0-14 15-59 60+ 80+ 0-14 15-59 60+ 80+
Senegal .................................... 43.5 51.9 4.5 0.4 33.3 59.1 7.6 0.5 22.6 60.7 16.7 2.1
Serbia ...................................... 16.2 62.7 21.1 3.3 12.6 51.0 36.4 7.1 14.1 48.4 37.5 12.9
Seychelles................................ 22.1 67.0 10.8 1.9 17.4 54.8 27.7 6.2 15.4 51.0 33.6 11.1
Sierra Leone ............................ 41.6 54.0 4.4 0.2 30.3 61.7 8.0 0.3 21.2 61.4 17.5 1.7
Singapore................................. 16.1 68.2 15.8 2.1 11.8 52.8 35.5 11.2 10.7 43.4 46.0 20.7
Slovakia................................... 15.1 65.7 19.2 3.0 14.0 50.6 35.4 7.1 15.0 50.4 34.6 11.7
Slovenia................................... 14.3 61.9 23.8 4.6 14.4 48.5 37.1 10.9 14.6 48.9 36.5 14.4
Solomon Islands ...................... 40.2 54.7 5.1 0.5 28.4 61.0 10.6 1.0 18.6 57.5 23.9 4.9
Somalia.................................... 47.2 48.3 4.5 0.3 37.0 57.6 5.3 0.4 23.2 61.8 15.0 1.6
South Africa ............................ 29.5 61.9 8.6 1.0 21.6 62.8 15.6 2.0 16.7 55.5 27.7 6.7
South Sudan ............................ 42.1 52.7 5.2 0.4 30.9 60.7 8.4 0.8 19.8 58.9 21.4 3.9
Spain........................................ 15.4 61.5 23.1 5.6 13.9 45.9 40.2 12.8 14.0 47.0 39.1 17.2
Sri Lanka ................................. 25.2 62.1 12.7 1.4 18.7 55.6 25.7 5.5 15.5 50.9 33.6 11.3
State of Palestine ..................... 40.1 55.3 4.6 0.4 26.6 62.0 11.4 1.4 17.4 54.8 27.8 7.2
Sudan....................................... 41.2 53.8 5.0 0.4 30.0 61.0 9.0 0.8 20.7 60.5 18.8 2.5
Suriname ................................. 27.4 62.9 9.7 1.2 17.9 59.1 23.0 4.2 15.9 52.6 31.6 8.8
Swaziland ................................ 37.8 56.8 5.4 0.4 27.2 65.1 7.7 0.7 18.0 58.3 23.7 4.4
Sweden .................................... 16.9 57.6 25.5 5.2 18.0 53.5 28.5 8.8 16.3 50.3 33.4 12.6
Switzerland.............................. 14.8 61.8 23.4 5.0 15.4 54.2 30.4 9.8 14.7 48.0 37.3 14.8
Syrian Arab Republic .............. 35.1 58.6 6.3 0.6 20.5 61.3 18.1 2.7 14.7 50.0 35.3 11.5
Tajikistan................................. 35.9 59.3 4.9 0.6 28.8 59.3 11.9 1.4 19.4 58.8 21.8 4.5
TFYR Macedonia .................... 16.7 65.3 18.0 2.3 13.3 52.1 34.6 7.3 14.2 48.8 37.0 13.1
Thailand................................... 18.2 67.3 14.5 1.9 12.5 50.0 37.5 10.0 13.8 47.0 39.2 14.9
Timor-Leste............................. 45.8 49.0 5.2 0.3 32.9 62.0 5.1 0.7 18.3 56.8 24.9 5.6
Togo ........................................ 41.8 53.7 4.4 0.3 31.8 60.0 8.3 0.5 21.4 60.0 18.6 2.8
Tonga ...................................... 37.2 54.8 8.0 1.4 27.4 59.7 13.0 2.5 18.7 55.6 25.8 6.5
Trinidad and Tobago ............... 20.8 65.6 13.6 1.6 16.3 53.5 30.3 4.8 15.8 52.5 31.7 9.0
Tunisia..................................... 23.2 66.0 10.8 1.4 16.2 53.7 30.1 6.1 14.7 49.1 36.2 13.9
Turkey ..................................... 25.7 63.5 10.8 1.4 16.4 56.2 27.3 5.7 14.2 48.1 37.8 14.2
Turkmenistan........................... 28.5 65.0 6.5 0.8 19.5 62.4 18.1 2.0 16.6 56.1 27.2 5.8
Uganda .................................... 48.4 47.9 3.7 0.4 35.8 58.0 6.2 0.6 21.2 59.2 19.6 3.8
Ukraine.................................... 14.5 64.3 21.3 3.4 16.1 53.2 30.8 5.0 16.6 55.9 27.5 6.9
United Arab Emirates .............. 15.3 83.8 1.0 0.1 11.2 54.7 34.0 1.2 12.0 46.5 41.5 15.3
United Kingdom...................... 17.6 59.2 23.2 4.8 16.6 52.6 30.7 9.5 15.4 49.4 35.2 13.4
United Republic of Tanzania... 44.9 50.3 4.9 0.4 35.7 57.0 7.3 0.8 23.0 58.8 18.2 3.6
United States of America......... 19.5 60.7 19.7 3.7 18.2 54.8 27.0 7.9 16.7 51.1 32.2 11.2
United States Virgin Islands.... 20.7 56.7 22.6 2.7 18.3 52.5 29.2 11.8 15.1 49.1 35.8 14.3
Uruguay................................... 21.8 59.4 18.7 4.0 17.0 55.6 27.4 6.8 15.0 49.5 35.5 12.7
Uzbekistan............................... 28.6 64.8 6.5 0.9 18.8 61.8 19.4 2.5 16.0 54.6 29.4 7.3
Vanuatu ................................... 37.1 56.8 6.1 0.5 25.3 60.4 14.3 1.9 17.1 54.0 28.9 8.3 Venezuela (Bolivarian Republic of)........................... 28.5 62.0 9.4 1.1 18.9 59.1 22.0 4.3 14.9 50.6 34.5 11.3
Viet Nam ................................. 22.7 67.7 9.6 2.0 14.5 54.9 30.6 6.8 14.2 48.2 37.6 14.6
Western Sahara........................ 26.6 68.7 4.8 0.3 17.8 59.6 22.5 2.3 16.1 54.0 29.9 7.1
Yemen ..................................... 40.2 55.2 4.6 0.4 23.7 65.8 10.5 0.6 16.1 58.0 25.8 3.8
Zambia..................................... 46.6 49.5 3.9 0.4 39.5 54.4 6.1 0.5 28.9 58.2 12.8 2.0
Zimbabwe................................ 39.5 54.9 5.7 0.7 25.8 62.7 11.5 0.8 16.6 54.9 28.5 7.4
Other non-specified areas ........ 14.6 68.4 16.9 2.9 11.1 46.6 42.3 13.4 13.6 45.6 40.8 17.6
Source: Population Division of the Department of Economic and Social Affairs of the United Nations Secretariat (2013). World Population Prospects: The 2012 Revision. New York: United Nations. NOTE: Only countries or areas with 90,000 persons or more in 2013 are considered.
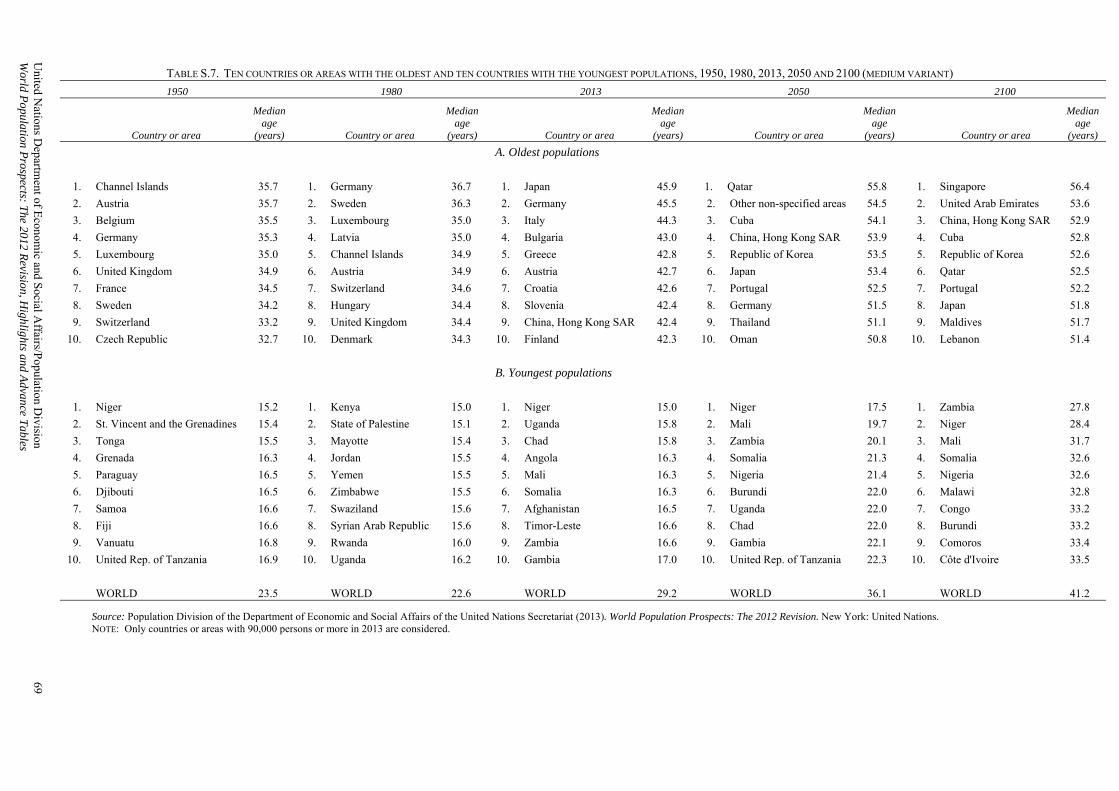
United N
ations Departm
ent of Econom
ic and Social A
ffairs/Population D
ivision 69 W
orld Population P
rospects: The 2012 R
evision, Highlights and A
dvance Tables
TABLE S.7. TEN COUNTRIES OR AREAS WITH THE OLDEST AND TEN COUNTRIES WITH THE YOUNGEST POPULATIONS, 1950, 1980, 2013, 2050 AND 2100 (MEDIUM VARIANT) 1950 1980 2013 2050 2100
Country or area
Median age
(years) Country or area
Median age
(years) Country or area
Median age
(years) Country or area
Median age
(years) Country or area
Median age
(years)
A. Oldest populations
1. Channel Islands 35.7 1. Germany 36.7 Japan 45.9 1. Qatar 55.8 1. Singapore 56.4 1.
Austria 35.7 2. Sweden 36.3 2. Germany 45.5 2. 2. Other non-specified areas 54.5 2. United Arab Emirates 53.6
3. Belgium 35.5 3. 35.0 3. Italy 44.3 3. Cuba 54.1 3. China, Hong Kong SAR Luxembourg 52.9
4. Germany 35.3 4. Latvia 35.0 4. Bulgaria 43.0 4. China, Hong Kong SAR 53.9 4. Cuba 52.8
5. Luxembourg 5. Channel Islands 34.9 5. Greece 42.8 5. Republic of Korea 53.5 35.0 5. Republic of Korea 52.6
6. United Kingdom 34.9 6. Austria 34.9 Austria 42.7 6. Japan 53.4 6. Qatar 52.5 6.
France 34.5 7. Switzerland 34.6 7. Croatia 42.6 7. 7. Portugal 52.5 7. Portugal 52.2
8. Sweden 34.2 8. 34.4 8. Slovenia 42.4 8. Germany 51.5 8. Japan Hungary 51.8
9. Switzerland 33.2 9. United Kingdom 34.4 9. China, Hong Kong SAR 42.4 9. Thailand 51.1 9. Maldives 51.7
10. Czech Republic 10. Denmark 34.3 10. Finland 42.3 10. Oman 50.8 32.7 10. Lebanon 51.4
B. Youngest populations
1. Niger 15.2 1. Kenya 15.0 1. Niger 15.0 1. Niger 17.5 1. Zambia 27.8
2. St. Vincent and the Grenadines 15.4 State of Palestine 15.1 2. Uganda 15.8 2. Mali 19.7 2. 2. Niger 28.4
3. Tonga 15.5 3. Mayotte 15.4 3. Chad 15.8 3. Zambia 20.1 3. Mali 31.7
4. 16.3 4. Jordan 15.5 4. Angola 16.3 4. Somalia Grenada 21.3 4. Somalia 32.6
5. Paraguay 16.5 5. Yemen 15.5 5. Mali 16.3 5. Nigeria 21.4 5. Nigeria 32.6
6. Djibouti 16.5 6. Zimbabwe 15.5 6. Somalia 16.3 6. Burundi 22.0 6. Malawi 32.8
7. Samoa 16.6 Swaziland 15.6 7. 7. Afghanistan 16.5 7. Uganda 22.0 7. Congo 33.2
8. Fiji 16.6 8. Syrian Arab Republic 15.6 8. Timor-Leste 16.6 8. Chad 22.0 8. Burundi 33.2
9. Vanuatu 16.8 9. Rwanda 16.0 9. Zambia 16.6 9. Gambia 22.1 9. Comoros 33.4
10. United Rep. of Tanzania 16.9 10. Uganda 16.2 10. Gambia 17.0 10. United Rep. of Tanzania 22.3 10. Côte d'Ivoire 33.5
WORLD 23.5 WORLD 22.6 WORLD 29.2 WORLD 36.1 WORLD 41.2
Source: Population Division of the Department of Economic and Social Affairs of the United Nations Secretariat (2013). World Population Prospects: The 2012 Revision. New York: United Nations. NOTE: Only countries or areas with 90,000 persons or more in 2013 are considered.
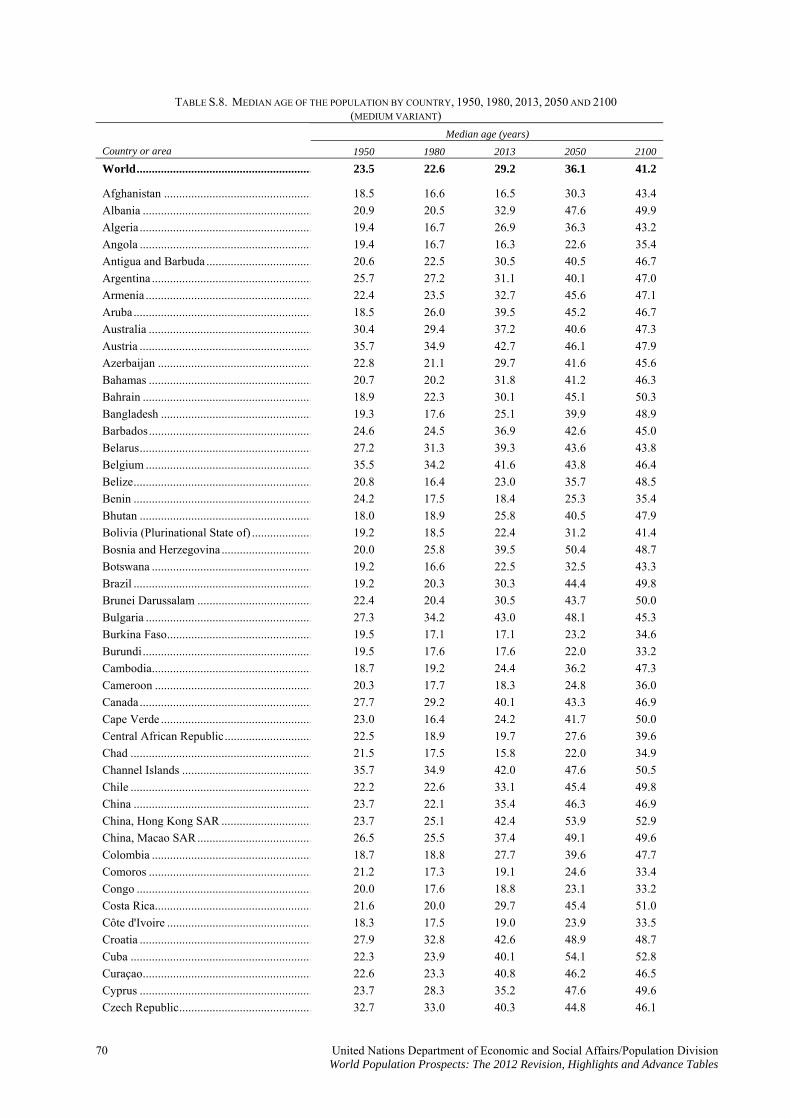
TABLE S.8. MEDIAN AGE OF THE POPULATION BY COUNTRY, 1950, 1980, 2013, 2050 AND 2100 (MEDIUM VARIANT)
Median age (years)
Country or area 1950 1980 2013 2050 2100
World.......................................................... 23.5 22.6 29.2 36.1 41.2
Afghanistan ................................................. 18.5 16.6 16.5 30.3 43.4
Albania ........................................................ 20.9 20.5 32.9 47.6 49.9
Algeria ......................................................... 19.4 16.7 26.9 36.3 43.2
Angola ......................................................... 19.4 16.7 16.3 22.6 35.4
Antigua and Barbuda ................................... 20.6 22.5 30.5 40.5 46.7
Argentina ..................................................... 25.7 27.2 31.1 40.1 47.0
Armenia ....................................................... 22.4 23.5 32.7 45.6 47.1
Aruba........................................................... 18.5 26.0 39.5 45.2 46.7
Australia ...................................................... 30.4 29.4 37.2 40.6 47.3
Austria ......................................................... 35.7 34.9 42.7 46.1 47.9
Azerbaijan ................................................... 22.8 21.1 29.7 41.6 45.6
Bahamas ...................................................... 20.7 20.2 31.8 41.2 46.3
Bahrain ........................................................ 18.9 22.3 30.1 45.1 50.3
Bangladesh .................................................. 19.3 17.6 25.1 39.9 48.9
Barbados...................................................... 24.6 24.5 36.9 42.6 45.0
Belarus......................................................... 27.2 31.3 39.3 43.6 43.8
Belgium ....................................................... 35.5 34.2 41.6 43.8 46.4
Belize........................................................... 20.8 16.4 23.0 35.7 48.5
Benin ........................................................... 24.2 17.5 18.4 25.3 35.4
Bhutan ......................................................... 18.0 18.9 25.8 40.5 47.9
Bolivia (Plurinational State of) .................... 19.2 18.5 22.4 31.2 41.4
Bosnia and Herzegovina .............................. 20.0 25.8 39.5 50.4 48.7
Botswana ..................................................... 19.2 16.6 22.5 32.5 43.3
Brazil ........................................................... 19.2 20.3 30.3 44.4 49.8
Brunei Darussalam ...................................... 22.4 20.4 30.5 43.7 50.0
Bulgaria ....................................................... 27.3 34.2 43.0 48.1 45.3
Burkina Faso................................................ 19.5 17.1 17.1 23.2 34.6
Burundi........................................................ 19.5 17.6 17.6 22.0 33.2
Cambodia..................................................... 18.7 19.2 24.4 36.2 47.3
Cameroon .................................................... 20.3 17.7 18.3 24.8 36.0
Canada......................................................... 27.7 29.2 40.1 43.3 46.9
Cape Verde .................................................. 23.0 16.4 24.2 41.7 50.0
Central African Republic............................. 22.5 18.9 19.7 27.6 39.6
Chad ............................................................ 21.5 17.5 15.8 22.0 34.9
Channel Islands ........................................... 35.7 34.9 42.0 47.6 50.5
Chile ............................................................ 22.2 22.6 33.1 45.4 49.8
China ........................................................... 23.7 22.1 35.4 46.3 46.9
China, Hong Kong SAR .............................. 23.7 25.1 42.4 53.9 52.9
China, Macao SAR...................................... 26.5 25.5 37.4 49.1 49.6
Colombia ..................................................... 18.7 18.8 27.7 39.6 47.7
Comoros ...................................................... 21.2 17.3 19.1 24.6 33.4
Congo .......................................................... 20.0 17.6 18.8 23.1 33.2
Costa Rica.................................................... 21.6 20.0 29.7 45.4 51.0
Côte d'Ivoire ................................................ 18.3 17.5 19.0 23.9 33.5
Croatia ......................................................... 27.9 32.8 42.6 48.9 48.7
Cuba ............................................................ 22.3 23.9 40.1 54.1 52.8
Curaçao........................................................ 22.6 23.3 40.8 46.2 46.5
Cyprus ......................................................... 23.7 28.3 35.2 47.6 49.6
Czech Republic............................................ 32.7 33.0 40.3 44.8 46.1
70 United Nations Department of Economic and Social Affairs/Population Division World Population Prospects: The 2012 Revision, Highlights and Advance Tables
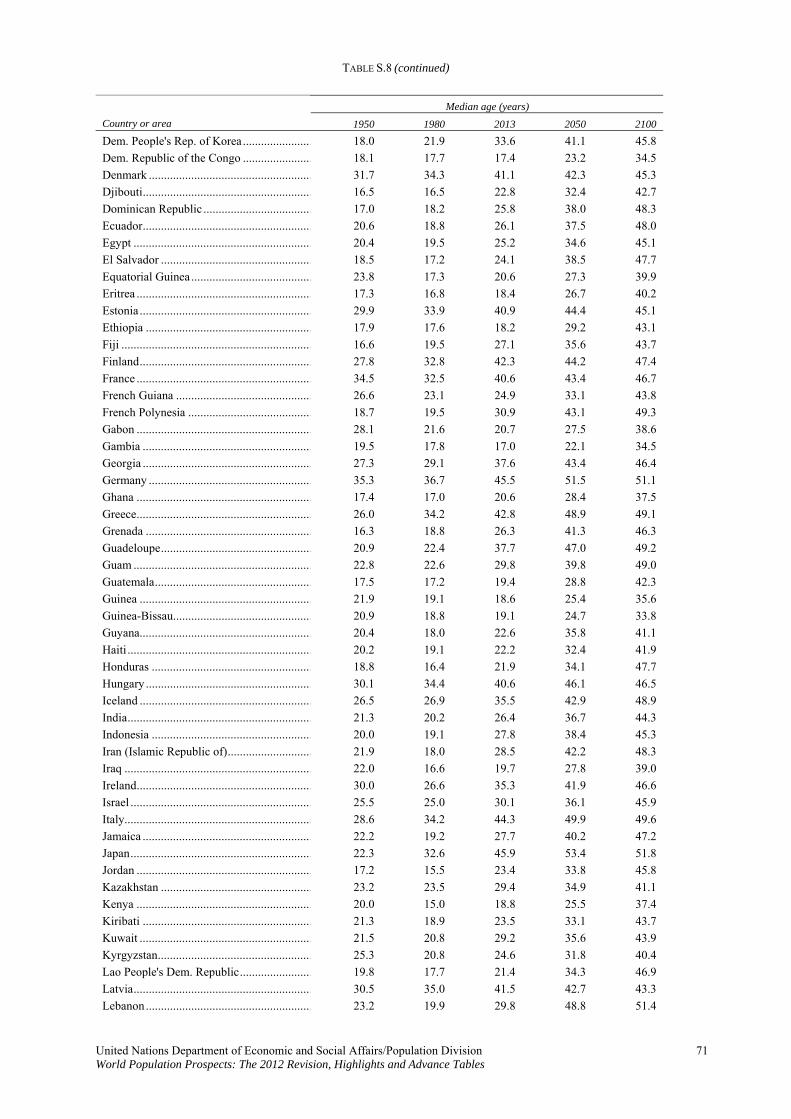
TABLE S.8 (continued)
Median age (years)
Country or area 1950 1980 2013 2050 2100
Dem. People's Rep. of Korea....................... 18.0 21.9 33.6 41.1 45.8
Dem. Republic of the Congo ....................... 18.1 17.7 17.4 23.2 34.5
Denmark ...................................................... 31.7 34.3 41.1 42.3 45.3
Djibouti........................................................ 16.5 16.5 22.8 32.4 42.7
Dominican Republic .................................... 17.0 18.2 25.8 38.0 48.3
Ecuador........................................................ 20.6 18.8 26.1 37.5 48.0
Egypt ........................................................... 20.4 19.5 25.2 34.6 45.1
El Salvador .................................................. 18.5 17.2 24.1 38.5 47.7
Equatorial Guinea ........................................ 23.8 17.3 20.6 27.3 39.9
Eritrea .......................................................... 17.3 16.8 18.4 26.7 40.2
Estonia ......................................................... 29.9 33.9 40.9 44.4 45.1
Ethiopia ....................................................... 17.9 17.6 18.2 29.2 43.1
Fiji ............................................................... 16.6 19.5 27.1 35.6 43.7
Finland......................................................... 27.8 32.8 42.3 44.2 47.4
France .......................................................... 34.5 32.5 40.6 43.4 46.7
French Guiana ............................................. 26.6 23.1 24.9 33.1 43.8
French Polynesia ......................................... 18.7 19.5 30.9 43.1 49.3
Gabon .......................................................... 28.1 21.6 20.7 27.5 38.6
Gambia ........................................................ 19.5 17.8 17.0 22.1 34.5
Georgia ........................................................ 27.3 29.1 37.6 43.4 46.4
Germany ...................................................... 35.3 36.7 45.5 51.5 51.1
Ghana .......................................................... 17.4 17.0 20.6 28.4 37.5
Greece.......................................................... 26.0 34.2 42.8 48.9 49.1
Grenada ....................................................... 16.3 18.8 26.3 41.3 46.3
Guadeloupe.................................................. 20.9 22.4 37.7 47.0 49.2
Guam ........................................................... 22.8 22.6 29.8 39.8 49.0
Guatemala.................................................... 17.5 17.2 19.4 28.8 42.3
Guinea ......................................................... 21.9 19.1 18.6 25.4 35.6
Guinea-Bissau.............................................. 20.9 18.8 19.1 24.7 33.8
Guyana......................................................... 20.4 18.0 22.6 35.8 41.1
Haiti ............................................................. 20.2 19.1 22.2 32.4 41.9
Honduras ..................................................... 18.8 16.4 21.9 34.1 47.7
Hungary ....................................................... 30.1 34.4 40.6 46.1 46.5
Iceland ......................................................... 26.5 26.9 35.5 42.9 48.9
India............................................................. 21.3 20.2 26.4 36.7 44.3
Indonesia ..................................................... 20.0 19.1 27.8 38.4 45.3
Iran (Islamic Republic of)............................ 21.9 18.0 28.5 42.2 48.3
Iraq .............................................................. 22.0 16.6 19.7 27.8 39.0
Ireland.......................................................... 30.0 26.6 35.3 41.9 46.6
Israel ............................................................ 25.5 25.0 30.1 36.1 45.9
Italy.............................................................. 28.6 34.2 44.3 49.9 49.6
Jamaica ........................................................ 22.2 19.2 27.7 40.2 47.2
Japan............................................................ 22.3 32.6 45.9 53.4 51.8
Jordan .......................................................... 17.2 15.5 23.4 33.8 45.8
Kazakhstan .................................................. 23.2 23.5 29.4 34.9 41.1
Kenya .......................................................... 20.0 15.0 18.8 25.5 37.4
Kiribati ........................................................ 21.3 18.9 23.5 33.1 43.7
Kuwait ......................................................... 21.5 20.8 29.2 35.6 43.9
Kyrgyzstan................................................... 25.3 20.8 24.6 31.8 40.4
Lao People's Dem. Republic........................ 19.8 17.7 21.4 34.3 46.9
Latvia........................................................... 30.5 35.0 41.5 42.7 43.3
Lebanon....................................................... 23.2 19.9 29.8 48.8 51.4
United Nations Department of Economic and Social Affairs/Population Division 71 World Population Prospects: The 2012 Revision, Highlights and Advance Tables
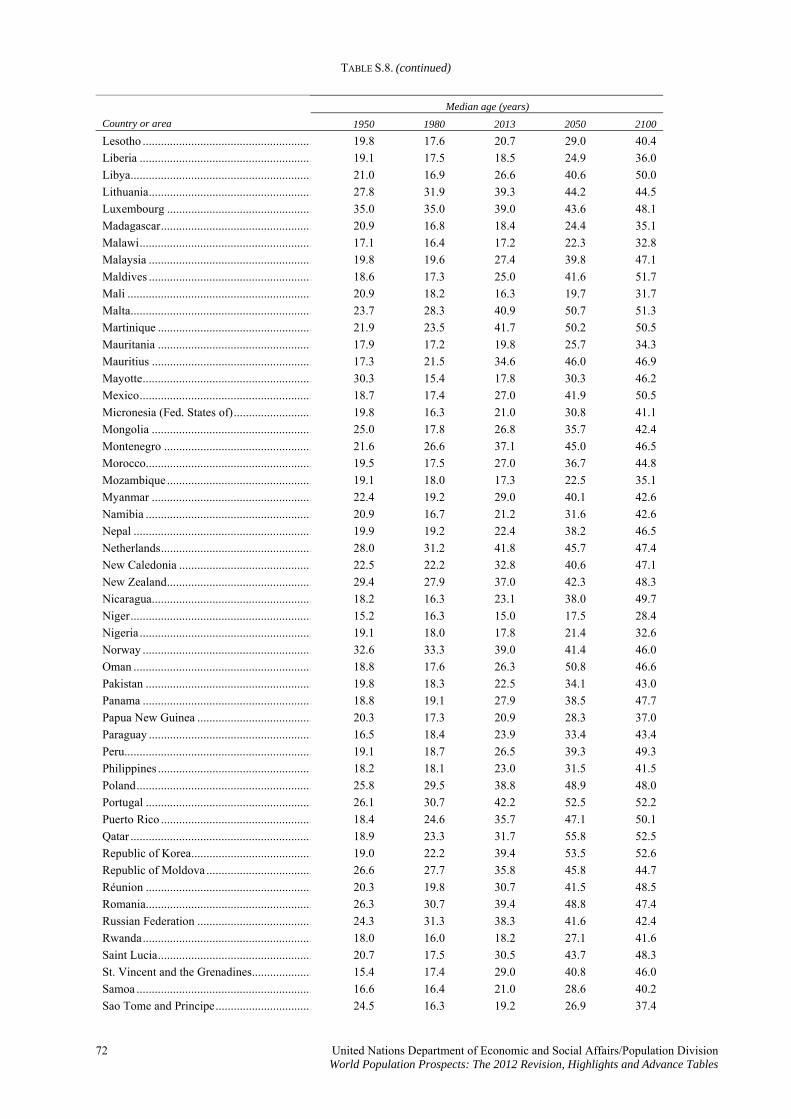
TABLE S.8. (continued)
Median age (years)
Country or area 1950 1980 2013 2050 2100
Lesotho ........................................................ 19.8 17.6 20.7 29.0 40.4
Liberia ......................................................... 19.1 17.5 18.5 24.9 36.0
Libya............................................................ 21.0 16.9 26.6 40.6 50.0
Lithuania...................................................... 27.8 31.9 39.3 44.2 44.5
Luxembourg ................................................ 35.0 35.0 39.0 43.6 48.1
Madagascar.................................................. 20.9 16.8 18.4 24.4 35.1
Malawi......................................................... 17.1 16.4 17.2 22.3 32.8
Malaysia ...................................................... 19.8 19.6 27.4 39.8 47.1
Maldives ...................................................... 18.6 17.3 25.0 41.6 51.7
Mali ............................................................. 20.9 18.2 16.3 19.7 31.7
Malta............................................................ 23.7 28.3 40.9 50.7 51.3
Martinique ................................................... 21.9 23.5 41.7 50.2 50.5
Mauritania ................................................... 17.9 17.2 19.8 25.7 34.3
Mauritius ..................................................... 17.3 21.5 34.6 46.0 46.9
Mayotte........................................................ 30.3 15.4 17.8 30.3 46.2
Mexico......................................................... 18.7 17.4 27.0 41.9 50.5
Micronesia (Fed. States of).......................... 19.8 16.3 21.0 30.8 41.1
Mongolia ..................................................... 25.0 17.8 26.8 35.7 42.4
Montenegro ................................................. 21.6 26.6 37.1 45.0 46.5
Morocco....................................................... 19.5 17.5 27.0 36.7 44.8
Mozambique ................................................ 19.1 18.0 17.3 22.5 35.1
Myanmar ..................................................... 22.4 19.2 29.0 40.1 42.6
Namibia ....................................................... 20.9 16.7 21.2 31.6 42.6
Nepal ........................................................... 19.9 19.2 22.4 38.2 46.5
Netherlands.................................................. 28.0 31.2 41.8 45.7 47.4
New Caledonia ............................................ 22.5 22.2 32.8 40.6 47.1
New Zealand................................................ 29.4 27.9 37.0 42.3 48.3
Nicaragua..................................................... 18.2 16.3 23.1 38.0 49.7
Niger............................................................ 15.2 16.3 15.0 17.5 28.4
Nigeria ......................................................... 19.1 18.0 17.8 21.4 32.6
Norway ........................................................ 32.6 33.3 39.0 41.4 46.0
Oman ........................................................... 18.8 17.6 26.3 50.8 46.6
Pakistan ....................................................... 19.8 18.3 22.5 34.1 43.0
Panama ........................................................ 18.8 19.1 27.9 38.5 47.7
Papua New Guinea ...................................... 20.3 17.3 20.9 28.3 37.0
Paraguay ...................................................... 16.5 18.4 23.9 33.4 43.4
Peru.............................................................. 19.1 18.7 26.5 39.3 49.3
Philippines ................................................... 18.2 18.1 23.0 31.5 41.5
Poland.......................................................... 25.8 29.5 38.8 48.9 48.0
Portugal ....................................................... 26.1 30.7 42.2 52.5 52.2
Puerto Rico .................................................. 18.4 24.6 35.7 47.1 50.1
Qatar ............................................................ 18.9 23.3 31.7 55.8 52.5
Republic of Korea........................................ 19.0 22.2 39.4 53.5 52.6
Republic of Moldova ................................... 26.6 27.7 35.8 45.8 44.7
Réunion ....................................................... 20.3 19.8 30.7 41.5 48.5
Romania....................................................... 26.3 30.7 39.4 48.8 47.4
Russian Federation ...................................... 24.3 31.3 38.3 41.6 42.4
Rwanda........................................................ 18.0 16.0 18.2 27.1 41.6
Saint Lucia................................................... 20.7 17.5 30.5 43.7 48.3
St. Vincent and the Grenadines.................... 15.4 17.4 29.0 40.8 46.0
Samoa .......................................................... 16.6 16.4 21.0 28.6 40.2
Sao Tome and Principe................................ 24.5 16.3 19.2 26.9 37.4
72 United Nations Department of Economic and Social Affairs/Population Division World Population Prospects: The 2012 Revision, Highlights and Advance Tables
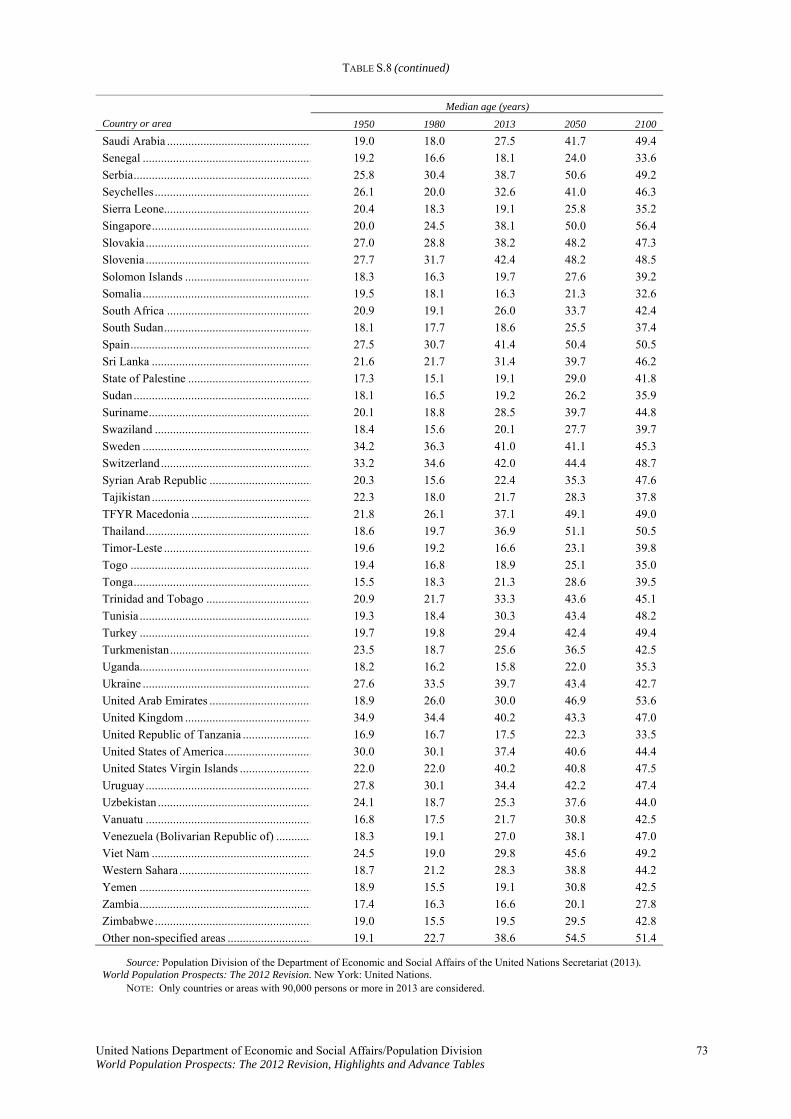
TABLE S.8 (continued)
United Nations Department of Economic and Social Affairs/Population Division 73 World Population Prospects: The 2012 Revision, Highlights and Advance Tables
Median age (years)
Country or area 1950 1980 2013 2050 2100
Saudi Arabia ................................................ 19.0 18.0 27.5 41.7 49.4
Senegal ........................................................ 19.2 16.6 18.1 24.0 33.6
Serbia........................................................... 25.8 30.4 38.7 50.6 49.2
Seychelles.................................................... 26.1 20.0 32.6 41.0 46.3
Sierra Leone................................................. 20.4 18.3 19.1 25.8 35.2
Singapore..................................................... 20.0 24.5 38.1 50.0 56.4
Slovakia ....................................................... 27.0 28.8 38.2 48.2 47.3
Slovenia ....................................................... 27.7 31.7 42.4 48.2 48.5
Solomon Islands .......................................... 18.3 16.3 19.7 27.6 39.2
Somalia........................................................ 19.5 18.1 16.3 21.3 32.6
South Africa ................................................ 20.9 19.1 26.0 33.7 42.4
South Sudan................................................. 18.1 17.7 18.6 25.5 37.4
Spain............................................................ 27.5 30.7 41.4 50.4 50.5
Sri Lanka ..................................................... 21.6 21.7 31.4 39.7 46.2
State of Palestine ......................................... 17.3 15.1 19.1 29.0 41.8
Sudan........................................................... 18.1 16.5 19.2 26.2 35.9
Suriname...................................................... 20.1 18.8 28.5 39.7 44.8
Swaziland .................................................... 18.4 15.6 20.1 27.7 39.7
Sweden ........................................................ 34.2 36.3 41.0 41.1 45.3
Switzerland.................................................. 33.2 34.6 42.0 44.4 48.7
Syrian Arab Republic .................................. 20.3 15.6 22.4 35.3 47.6
Tajikistan ..................................................... 22.3 18.0 21.7 28.3 37.8
TFYR Macedonia ........................................ 21.8 26.1 37.1 49.1 49.0
Thailand....................................................... 18.6 19.7 36.9 51.1 50.5
Timor-Leste ................................................. 19.6 19.2 16.6 23.1 39.8
Togo ............................................................ 19.4 16.8 18.9 25.1 35.0
Tonga........................................................... 15.5 18.3 21.3 28.6 39.5
Trinidad and Tobago ................................... 20.9 21.7 33.3 43.6 45.1
Tunisia ......................................................... 19.3 18.4 30.3 43.4 48.2
Turkey ......................................................... 19.7 19.8 29.4 42.4 49.4
Turkmenistan............................................... 23.5 18.7 25.6 36.5 42.5
Uganda......................................................... 18.2 16.2 15.8 22.0 35.3
Ukraine ........................................................ 27.6 33.5 39.7 43.4 42.7
United Arab Emirates .................................. 18.9 26.0 30.0 46.9 53.6
United Kingdom .......................................... 34.9 34.4 40.2 43.3 47.0
United Republic of Tanzania ....................... 16.9 16.7 17.5 22.3 33.5
United States of America............................. 30.0 30.1 37.4 40.6 44.4
United States Virgin Islands ........................ 22.0 22.0 40.2 40.8 47.5
Uruguay ....................................................... 27.8 30.1 34.4 42.2 47.4
Uzbekistan ................................................... 24.1 18.7 25.3 37.6 44.0
Vanuatu ....................................................... 16.8 17.5 21.7 30.8 42.5
Venezuela (Bolivarian Republic of) ............ 18.3 19.1 27.0 38.1 47.0
Viet Nam ..................................................... 24.5 19.0 29.8 45.6 49.2
Western Sahara............................................ 18.7 21.2 28.3 38.8 44.2
Yemen ......................................................... 18.9 15.5 19.1 30.8 42.5
Zambia......................................................... 17.4 16.3 16.6 20.1 27.8
Zimbabwe.................................................... 19.0 15.5 19.5 29.5 42.8
Other non-specified areas ............................ 19.1 22.7 38.6 54.5 51.4
Source: Population Division of the Department of Economic and Social Affairs of the United Nations Secretariat (2013). World Population Prospects: The 2012 Revision. New York: United Nations. NOTE: Only countries or areas with 90,000 persons or more in 2013 are considered.
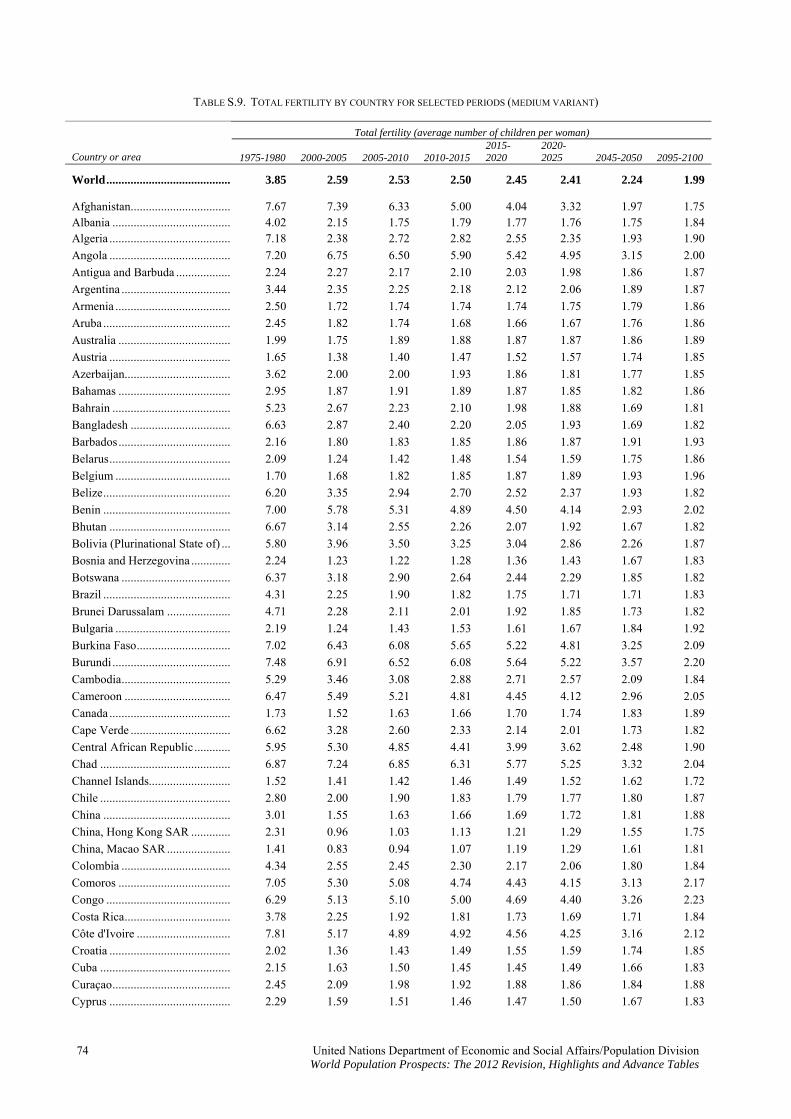
TABLE S.9. TOTAL FERTILITY BY COUNTRY FOR SELECTED PERIODS (MEDIUM VARIANT)
Total fertility (average number of children per woman)
Country or area 1975-1980 2000-2005 2005-2010 2010-2015 2015-2020
2020-2025 2045-2050 2095-2100
World......................................... 3.85 2.59 2.53 2.50 2.45 2.41 2.24 1.99
Afghanistan................................. 7.67 7.39 6.33 5.00 4.04 3.32 1.97 1.75 Albania ....................................... 4.02 2.15 1.75 1.79 1.77 1.76 1.75 1.84 Algeria ........................................ 7.18 2.38 2.72 2.82 2.55 2.35 1.93 1.90
Angola ........................................ 7.20 6.75 6.50 5.90 5.42 4.95 3.15 2.00
Antigua and Barbuda .................. 2.24 2.27 2.17 2.10 2.03 1.98 1.86 1.87
Argentina .................................... 3.44 2.35 2.25 2.18 2.12 2.06 1.89 1.87
Armenia ...................................... 2.50 1.72 1.74 1.74 1.74 1.75 1.79 1.86
Aruba .......................................... 2.45 1.82 1.74 1.68 1.66 1.67 1.76 1.86
Australia ..................................... 1.99 1.75 1.89 1.88 1.87 1.87 1.86 1.89
Austria ........................................ 1.65 1.38 1.40 1.47 1.52 1.57 1.74 1.85
Azerbaijan................................... 3.62 2.00 2.00 1.93 1.86 1.81 1.77 1.85
Bahamas ..................................... 2.95 1.87 1.91 1.89 1.87 1.85 1.82 1.86
Bahrain ....................................... 5.23 2.67 2.23 2.10 1.98 1.88 1.69 1.81
Bangladesh ................................. 6.63 2.87 2.40 2.20 2.05 1.93 1.69 1.82
Barbados..................................... 2.16 1.80 1.83 1.85 1.86 1.87 1.91 1.93
Belarus........................................ 2.09 1.24 1.42 1.48 1.54 1.59 1.75 1.86
Belgium ...................................... 1.70 1.68 1.82 1.85 1.87 1.89 1.93 1.96
Belize.......................................... 6.20 3.35 2.94 2.70 2.52 2.37 1.93 1.82
Benin .......................................... 7.00 5.78 5.31 4.89 4.50 4.14 2.93 2.02
Bhutan ........................................ 6.67 3.14 2.55 2.26 2.07 1.92 1.67 1.82
Bolivia (Plurinational State of) ... 5.80 3.96 3.50 3.25 3.04 2.86 2.26 1.87
Bosnia and Herzegovina ............. 2.24 1.23 1.22 1.28 1.36 1.43 1.67 1.83
Botswana .................................... 6.37 3.18 2.90 2.64 2.44 2.29 1.85 1.82
Brazil .......................................... 4.31 2.25 1.90 1.82 1.75 1.71 1.71 1.83
Brunei Darussalam ..................... 4.71 2.28 2.11 2.01 1.92 1.85 1.73 1.82
Bulgaria ...................................... 2.19 1.24 1.43 1.53 1.61 1.67 1.84 1.92
Burkina Faso............................... 7.02 6.43 6.08 5.65 5.22 4.81 3.25 2.09
Burundi ....................................... 7.48 6.91 6.52 6.08 5.64 5.22 3.57 2.20
Cambodia.................................... 5.29 3.46 3.08 2.88 2.71 2.57 2.09 1.84
Cameroon ................................... 6.47 5.49 5.21 4.81 4.45 4.12 2.96 2.05
Canada ........................................ 1.73 1.52 1.63 1.66 1.70 1.74 1.83 1.89
Cape Verde ................................. 6.62 3.28 2.60 2.33 2.14 2.01 1.73 1.82
Central African Republic ............ 5.95 5.30 4.85 4.41 3.99 3.62 2.48 1.90
Chad ........................................... 6.87 7.24 6.85 6.31 5.77 5.25 3.32 2.04
Channel Islands........................... 1.52 1.41 1.42 1.46 1.49 1.52 1.62 1.72
Chile ........................................... 2.80 2.00 1.90 1.83 1.79 1.77 1.80 1.87
China .......................................... 3.01 1.55 1.63 1.66 1.69 1.72 1.81 1.88
China, Hong Kong SAR ............. 2.31 0.96 1.03 1.13 1.21 1.29 1.55 1.75
China, Macao SAR ..................... 1.41 0.83 0.94 1.07 1.19 1.29 1.61 1.81
Colombia .................................... 4.34 2.55 2.45 2.30 2.17 2.06 1.80 1.84
Comoros ..................................... 7.05 5.30 5.08 4.74 4.43 4.15 3.13 2.17
Congo ......................................... 6.29 5.13 5.10 5.00 4.69 4.40 3.26 2.23
Costa Rica................................... 3.78 2.25 1.92 1.81 1.73 1.69 1.71 1.84
Côte d'Ivoire ............................... 7.81 5.17 4.89 4.92 4.56 4.25 3.16 2.12
Croatia ........................................ 2.02 1.36 1.43 1.49 1.55 1.59 1.74 1.85
Cuba ........................................... 2.15 1.63 1.50 1.45 1.45 1.49 1.66 1.83
Curaçao....................................... 2.45 2.09 1.98 1.92 1.88 1.86 1.84 1.88
Cyprus ........................................ 2.29 1.59 1.51 1.46 1.47 1.50 1.67 1.83
74 United Nations Department of Economic and Social Affairs/Population Division World Population Prospects: The 2012 Revision, Highlights and Advance Tables
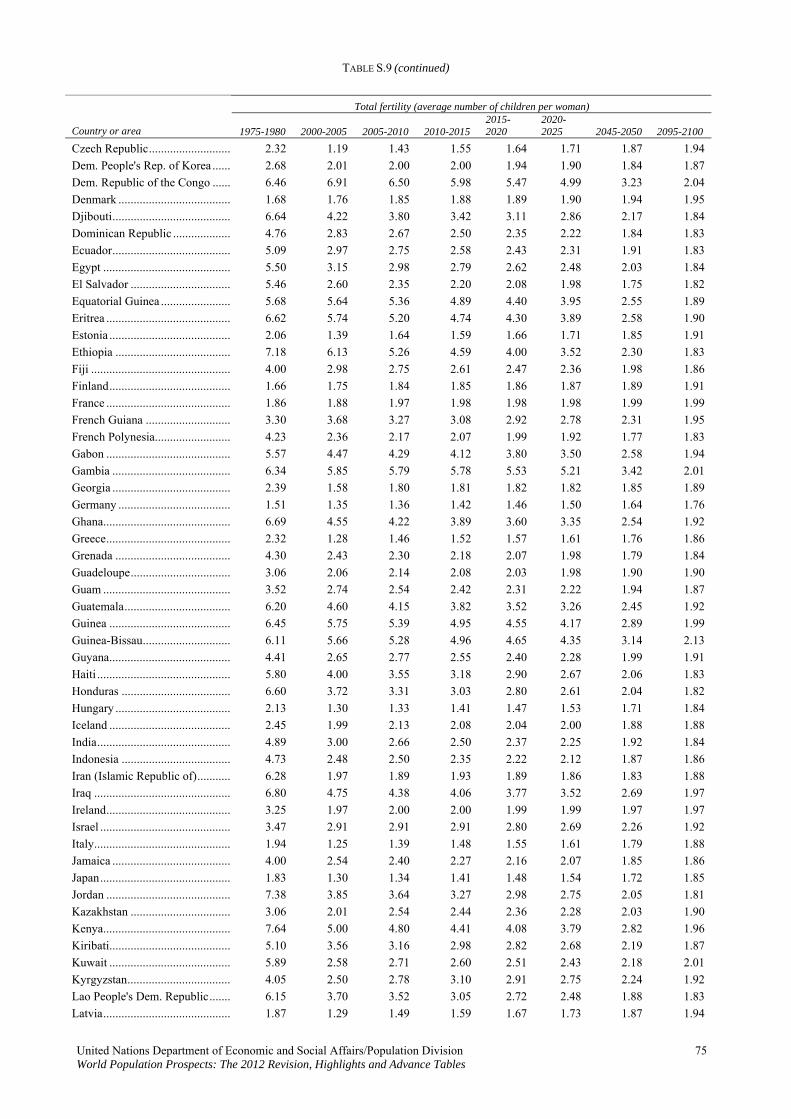
TABLE S.9 (continued)
Total fertility (average number of children per woman)
Country or area 1975-1980 2000-2005 2005-2010 2015-2020
2020-2025 2045-2050 2095-2100 2010-2015
Czech Republic........................... 2.32 1.19 1.43 1.55 1.64 1.71 1.87 1.94
2.00 1.94 1.84 Dem. People's Rep. of Korea ...... 2.68 2.01 2.00 1.90 1.87
Dem. Republic of the Congo ...... 6.46 6.91 6.50 5.98 5.47 4.99 3.23 2.04
Denmark ..................................... 1.68 1.76 1.85 1.88 1.89 1.90 1.94 1.95
Djibouti....................................... 6.64 4.22 3.80 3.42 3.11 2.86 2.17 1.84
Dominican Republic ................... 4.76 2.83 2.67 2.50 2.35 2.22 1.84 1.83
Ecuador....................................... 2.97 2.75 2.58 2.43 2.31 1.91 1.83 5.09
Egypt .......................................... 5.50 3.15 2.98 2.79 2.62 2.48 2.03 1.84
El Salvador ................................. 5.46 2.60 2.35 2.20 2.08 1.98 1.75 1.82
Equatorial Guinea ....................... 5.68 5.64 5.36 4.89 4.40 3.95 2.55 1.89
Eritrea ......................................... 6.62 5.74 5.20 4.74 4.30 3.89 2.58 1.90
Estonia ........................................ 2.06 1.39 1.64 1.59 1.66 1.71 1.85 1.91
Ethiopia ...................................... 7.18 6.13 5.26 4.59 4.00 3.52 2.30 1.83
Fiji .............................................. 4.00 2.98 2.75 2.61 2.47 2.36 1.98 1.86
Finland........................................ 1.66 1.75 1.84 1.85 1.86 1.87 1.89 1.91
France ......................................... 1.88 1.97 1.98 1.98 1.98 1.99 1.99 1.86
French Guiana ............................ 3.30 3.68 3.27 3.08 2.92 2.78 2.31 1.95
French Polynesia......................... 4.23 2.36 2.17 2.07 1.99 1.92 1.77 1.83
Gabon ......................................... 5.57 4.47 4.29 4.12 3.80 3.50 2.58 1.94
Gambia ....................................... 6.34 5.85 5.79 5.78 5.53 5.21 3.42 2.01
Georgia ....................................... 2.39 1.58 1.80 1.81 1.82 1.82 1.85 1.89
Germany ..................................... 1.51 1.35 1.36 1.42 1.46 1.50 1.64 1.76
Ghana.......................................... 6.69 4.55 4.22 3.89 3.60 3.35 2.54 1.92
Greece......................................... 2.32 1.28 1.46 1.52 1.57 1.61 1.76 1.86
Grenada ...................................... 2.43 2.30 2.18 2.07 1.98 1.79 1.84 4.30
Guadeloupe................................. 3.06 2.06 2.14 2.08 2.03 1.98 1.90 1.90
Guam .......................................... 3.52 2.74 2.54 2.42 2.31 2.22 1.94 1.87
Guatemala................................... 6.20 4.60 4.15 3.82 3.52 3.26 2.45 1.92
Guinea ........................................ 6.45 5.75 5.39 4.95 4.55 4.17 2.89 1.99
Guinea-Bissau............................. 6.11 5.66 5.28 4.96 4.65 4.35 3.14 2.13
Guyana........................................ 4.41 2.65 2.77 2.55 2.40 2.28 1.99 1.91
Haiti ............................................ 5.80 4.00 3.55 3.18 2.90 2.67 2.06 1.83
Honduras .................................... 6.60 3.72 3.31 3.03 2.80 2.61 2.04 1.82
Hungary ...................................... 1.30 1.33 1.41 1.47 1.53 1.71 1.84 2.13
Iceland ........................................ 2.45 1.99 2.13 2.08 2.04 2.00 1.88 1.88
India............................................ 4.89 3.00 2.66 2.50 2.37 2.25 1.92 1.84
Indonesia .................................... 4.73 2.48 2.50 2.35 2.22 2.12 1.87 1.86
Iran (Islamic Republic of)........... 6.28 1.97 1.89 1.93 1.89 1.86 1.83 1.88
Iraq ............................................. 6.80 4.75 4.38 4.06 3.77 3.52 2.69 1.97
Ireland......................................... 3.25 1.97 2.00 2.00 1.99 1.99 1.97 1.97
Israel ........................................... 3.47 2.91 2.91 2.91 2.80 2.69 2.26 1.92
Italy............................................. 1.94 1.25 1.39 1.48 1.55 1.61 1.79 1.88
Jamaica ....................................... 2.54 2.40 2.27 2.16 2.07 1.85 1.86 4.00
Japan........................................... 1.83 1.30 1.34 1.41 1.48 1.54 1.72 1.85
Jordan ......................................... 7.38 3.85 3.64 3.27 2.98 2.75 2.05 1.81
Kazakhstan ................................. 3.06 2.01 2.54 2.44 2.36 2.28 2.03 1.90
Kenya.......................................... 7.64 5.00 4.80 4.41 4.08 3.79 2.82 1.96
Kiribati........................................ 5.10 3.56 3.16 2.98 2.82 2.68 2.19 1.87
Kuwait ........................................ 5.89 2.58 2.71 2.60 2.51 2.43 2.18 2.01
Kyrgyzstan.................................. 4.05 2.50 2.78 3.10 2.91 2.75 2.24 1.92
Lao People's Dem. Republic....... 6.15 3.70 3.52 3.05 2.72 2.48 1.88 1.83
Latvia.......................................... 1.87 1.29 1.49 1.59 1.67 1.73 1.87 1.94
United Nations Department of Economic and Social Affairs/Population Division 75 World Population Prospects: The 2012 Revision, Highlights and Advance Tables
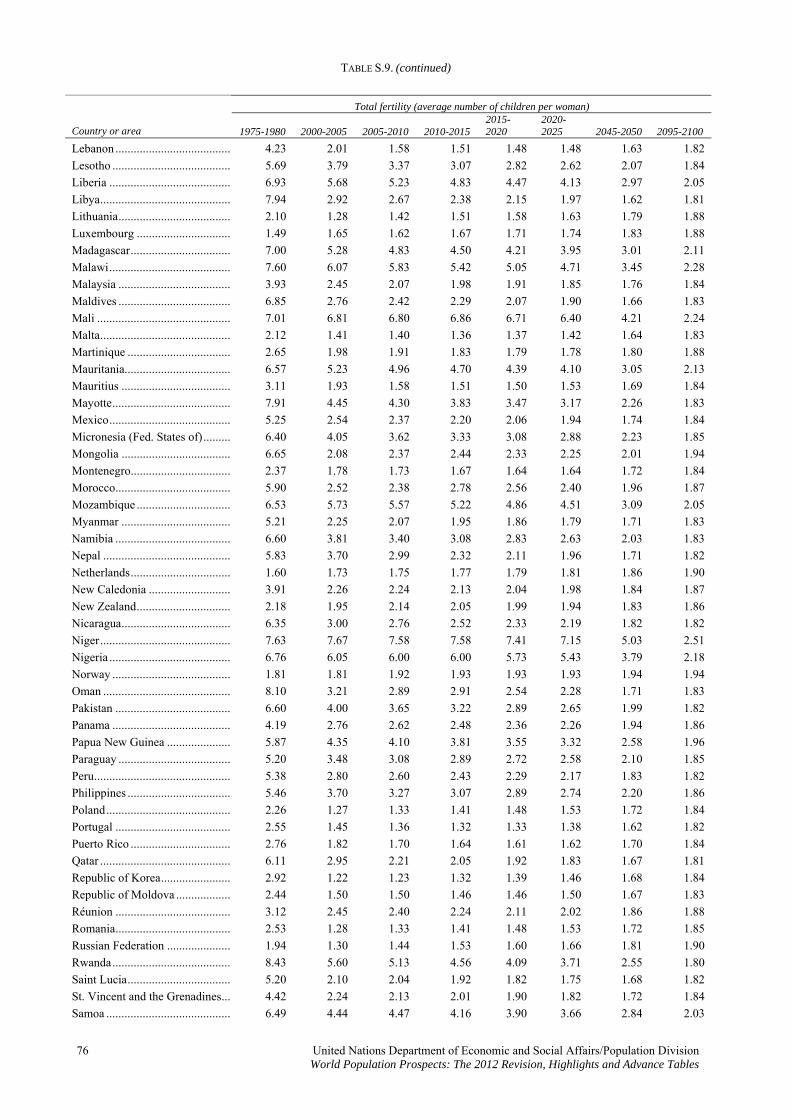
TABLE S.9. (continued)
Total fertility (average number of children per woman)
Country or area 1975-1980 2000-2005 2005-2010 2015-2020
2020-2025 2045-2050 2095-2100 2010-2015
Lebanon ...................................... 4.23 2.01 1.58 1.51 1.48 1.48 1.63 1.82
Lesotho ....................................... 5.69 3.79 3.37 3.07 2.82 2.62 2.07 1.84
Liberia ........................................ 6.93 5.68 5.23 4.83 4.47 4.13 2.97 2.05
Libya........................................... 7.94 2.92 2.67 2.38 2.15 1.97 1.62 1.81
Lithuania..................................... 2.10 1.28 1.42 1.51 1.58 1.63 1.79 1.88
Luxembourg ............................... 1.49 1.65 1.62 1.67 1.71 1.74 1.83 1.88
Madagascar................................. 7.00 5.28 4.83 4.50 4.21 3.95 3.01 2.11
Malawi........................................ 7.60 6.07 5.83 5.42 5.05 4.71 3.45 2.28
Malaysia ..................................... 3.93 2.45 2.07 1.98 1.91 1.85 1.76 1.84
Maldives ..................................... 6.85 2.76 2.42 2.29 2.07 1.90 1.66 1.83
Mali ............................................ 7.01 6.81 6.80 6.86 6.71 6.40 4.21 2.24
Malta........................................... 2.12 1.41 1.40 1.36 1.37 1.42 1.64 1.83
Martinique .................................. 2.65 1.98 1.91 1.83 1.79 1.78 1.80 1.88
Mauritania................................... 6.57 5.23 4.96 4.70 4.39 4.10 3.05 2.13
Mauritius .................................... 3.11 1.93 1.58 1.51 1.50 1.53 1.69 1.84
Mayotte....................................... 7.91 4.45 4.30 3.83 3.47 3.17 2.26 1.83
Mexico........................................ 5.25 2.54 2.37 2.20 2.06 1.94 1.74 1.84
Micronesia (Fed. States of)......... 6.40 4.05 3.62 3.33 3.08 2.88 2.23 1.85
Mongolia .................................... 6.65 2.08 2.37 2.44 2.33 2.25 2.01 1.94
Montenegro................................. 2.37 1.78 1.73 1.67 1.64 1.64 1.72 1.84
Morocco...................................... 5.90 2.52 2.38 2.78 2.56 2.40 1.96 1.87
Mozambique ............................... 6.53 5.73 5.57 5.22 4.86 4.51 3.09 2.05
Myanmar .................................... 5.21 2.25 2.07 1.95 1.86 1.79 1.71 1.83
Namibia ...................................... 6.60 3.81 3.40 3.08 2.83 2.63 2.03 1.83
Nepal .......................................... 5.83 3.70 2.99 2.32 2.11 1.96 1.71 1.82
Netherlands................................. 1.60 1.73 1.75 1.77 1.79 1.81 1.86 1.90
New Caledonia ........................... 3.91 2.26 2.24 2.13 2.04 1.98 1.84 1.87
New Zealand............................... 2.18 1.95 2.14 2.05 1.99 1.94 1.83 1.86
Nicaragua.................................... 6.35 3.00 2.76 2.52 2.33 2.19 1.82 1.82
Niger........................................... 7.63 7.67 7.58 7.58 7.41 7.15 5.03 2.51
Nigeria ........................................ 6.76 6.05 6.00 6.00 5.73 5.43 3.79 2.18
Norway ....................................... 1.81 1.81 1.92 1.93 1.93 1.93 1.94 1.94
Oman .......................................... 8.10 3.21 2.89 2.91 2.54 2.28 1.71 1.83
Pakistan ...................................... 6.60 4.00 3.65 3.22 2.89 2.65 1.99 1.82
Panama ....................................... 4.19 2.76 2.62 2.48 2.36 2.26 1.94 1.86
Papua New Guinea ..................... 5.87 4.35 4.10 3.81 3.55 3.32 2.58 1.96
Paraguay ..................................... 5.20 3.48 3.08 2.89 2.72 2.58 2.10 1.85
Peru............................................. 5.38 2.80 2.60 2.43 2.29 2.17 1.83 1.82
Philippines .................................. 5.46 3.70 3.27 3.07 2.89 2.74 2.20 1.86
Poland......................................... 2.26 1.27 1.33 1.41 1.48 1.53 1.72 1.84
Portugal ...................................... 2.55 1.45 1.36 1.32 1.33 1.38 1.62 1.82
Puerto Rico ................................. 2.76 1.82 1.70 1.64 1.61 1.62 1.70 1.84
Qatar ........................................... 6.11 2.95 2.21 2.05 1.92 1.83 1.67 1.81
Republic of Korea....................... 2.92 1.22 1.23 1.32 1.39 1.46 1.68 1.84
Republic of Moldova .................. 2.44 1.50 1.50 1.46 1.46 1.50 1.67 1.83
Réunion ...................................... 3.12 2.45 2.40 2.24 2.11 2.02 1.86 1.88
Romania...................................... 2.53 1.28 1.33 1.41 1.48 1.53 1.72 1.85
Russian Federation ..................... 1.94 1.30 1.44 1.53 1.60 1.66 1.81 1.90
Rwanda....................................... 8.43 5.60 5.13 4.56 4.09 3.71 2.55 1.80
Saint Lucia.................................. 5.20 2.10 2.04 1.92 1.82 1.75 1.68 1.82
St. Vincent and the Grenadines... 4.42 2.24 2.13 2.01 1.90 1.82 1.72 1.84
Samoa ......................................... 6.49 4.44 4.47 4.16 3.90 3.66 2.84 2.03
76 United Nations Department of Economic and Social Affairs/Population Division World Population Prospects: The 2012 Revision, Highlights and Advance Tables
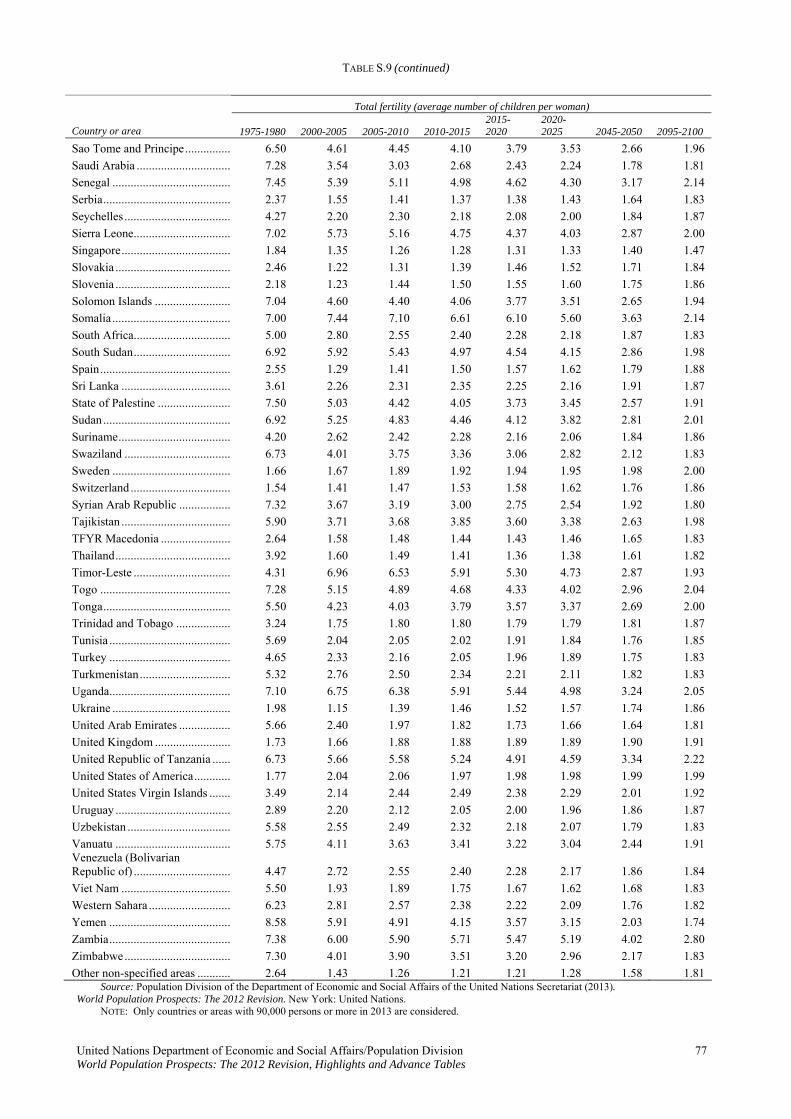
TABLE S.9 (continued)
United Nations Department of Economic and Social Affairs/Population Division 77 World Population Prospects: The 2012 Revision, Highlights and Advance Tables
Total fertility (average number of children per woman)
Country or area 1975-1980 2000-2005 2005-2010 2010-2015 2015-2020
2020-2025 2045-2050 2095-2100
Sao Tome and Principe............... 6.50 4.61 4.45 4.10 3.79 3.53 2.66 1.96
Saudi Arabia ............................... 7.28 3.54 3.03 2.68 2.43 2.24 1.78 1.81
Senegal ....................................... 7.45 5.39 5.11 4.98 4.62 4.30 3.17 2.14
Serbia.......................................... 2.37 1.55 1.41 1.37 1.38 1.43 1.64 1.83
Seychelles ................................... 4.27 2.20 2.30 2.18 2.08 2.00 1.84 1.87
Sierra Leone................................ 7.02 5.73 5.16 4.75 4.37 4.03 2.87 2.00
Singapore.................................... 1.84 1.35 1.26 1.28 1.31 1.33 1.40 1.47
Slovakia ...................................... 2.46 1.22 1.31 1.39 1.46 1.52 1.71 1.84
Slovenia ...................................... 2.18 1.23 1.44 1.50 1.55 1.60 1.75 1.86
Solomon Islands ......................... 7.04 4.60 4.40 4.06 3.77 3.51 2.65 1.94
Somalia....................................... 7.00 7.44 7.10 6.61 6.10 5.60 3.63 2.14
South Africa................................ 5.00 2.80 2.55 2.40 2.28 2.18 1.87 1.83
South Sudan................................ 6.92 5.92 5.43 4.97 4.54 4.15 2.86 1.98
Spain........................................... 2.55 1.29 1.41 1.50 1.57 1.62 1.79 1.88
Sri Lanka .................................... 3.61 2.26 2.31 2.35 2.25 2.16 1.91 1.87
State of Palestine ........................ 7.50 5.03 4.42 4.05 3.73 3.45 2.57 1.91
Sudan .......................................... 6.92 5.25 4.83 4.46 4.12 3.82 2.81 2.01
Suriname..................................... 4.20 2.62 2.42 2.28 2.16 2.06 1.84 1.86
Swaziland ................................... 6.73 4.01 3.75 3.36 3.06 2.82 2.12 1.83
Sweden ....................................... 1.66 1.67 1.89 1.92 1.94 1.95 1.98 2.00
Switzerland ................................. 1.54 1.41 1.47 1.53 1.58 1.62 1.76 1.86
Syrian Arab Republic ................. 7.32 3.67 3.19 3.00 2.75 2.54 1.92 1.80
Tajikistan .................................... 5.90 3.71 3.68 3.85 3.60 3.38 2.63 1.98
TFYR Macedonia ....................... 2.64 1.58 1.48 1.44 1.43 1.46 1.65 1.83
Thailand...................................... 3.92 1.60 1.49 1.41 1.36 1.38 1.61 1.82
Timor-Leste ................................ 4.31 6.96 6.53 5.91 5.30 4.73 2.87 1.93
Togo ........................................... 7.28 5.15 4.89 4.68 4.33 4.02 2.96 2.04
Tonga.......................................... 5.50 4.23 4.03 3.79 3.57 3.37 2.69 2.00
Trinidad and Tobago .................. 3.24 1.75 1.80 1.80 1.79 1.79 1.81 1.87
Tunisia ........................................ 5.69 2.04 2.05 2.02 1.91 1.84 1.76 1.85
Turkey ........................................ 4.65 2.33 2.16 2.05 1.96 1.89 1.75 1.83
Turkmenistan.............................. 5.32 2.76 2.50 2.34 2.21 2.11 1.82 1.83
Uganda........................................ 7.10 6.75 6.38 5.91 5.44 4.98 3.24 2.05
Ukraine ....................................... 1.98 1.15 1.39 1.46 1.52 1.57 1.74 1.86
United Arab Emirates ................. 5.66 2.40 1.97 1.82 1.73 1.66 1.64 1.81
United Kingdom ......................... 1.73 1.66 1.88 1.88 1.89 1.89 1.90 1.91
United Republic of Tanzania ...... 6.73 5.66 5.58 5.24 4.91 4.59 3.34 2.22
United States of America............ 1.77 2.04 2.06 1.97 1.98 1.98 1.99 1.99
United States Virgin Islands ....... 3.49 2.14 2.44 2.49 2.38 2.29 2.01 1.92
Uruguay ...................................... 2.89 2.20 2.12 2.05 2.00 1.96 1.86 1.87
Uzbekistan .................................. 5.58 2.55 2.49 2.32 2.18 2.07 1.79 1.83
Vanuatu ...................................... 5.75 4.11 3.63 3.41 3.22 3.04 2.44 1.91 Venezuela (Bolivarian Republic of) ................................ 4.47 2.72 2.55 2.40 2.28 2.17 1.86 1.84
Viet Nam .................................... 5.50 1.93 1.89 1.75 1.67 1.62 1.68 1.83
Western Sahara ........................... 6.23 2.81 2.57 2.38 2.22 2.09 1.76 1.82
Yemen ........................................ 8.58 5.91 4.91 4.15 3.57 3.15 2.03 1.74
Zambia........................................ 7.38 6.00 5.90 5.71 5.47 5.19 4.02 2.80
Zimbabwe................................... 7.30 4.01 3.90 3.51 3.20 2.96 2.17 1.83
Other non-specified areas ........... 2.64 1.43 1.26 1.21 1.21 1.28 1.58 1.81 Source: Population Division of the Department of Economic and Social Affairs of the United Nations Secretariat (2013). World Population Prospects: The 2012 Revision. New York: United Nations. NOTE: Only countries or areas with 90,000 persons or more in 2013 are considered.
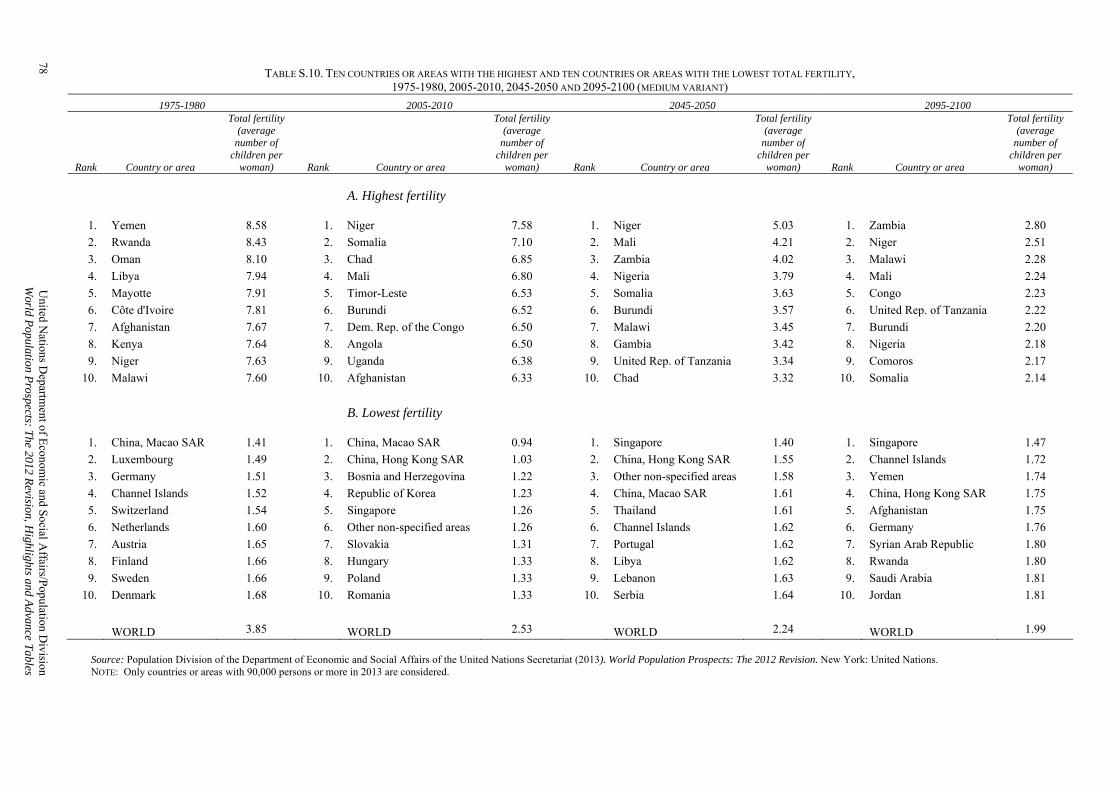
78 U
nited Nations D
epartment of E
conomic and S
ocial Affairs/P
opulation Division
World P
opulation Prospects: T
he 2012 Revision, H
ighlights and Advance T
ables
TABLE S.10. TEN COUNTRIES OR AREAS WITH THE HIGHEST AND TEN COUNTRIES OR AREAS WITH THE LOWEST TOTAL FERTILITY, 1975-1980, 2005-2010, 2045-2050 AND 2095-2100 (MEDIUM VARIANT)
1975-1980 2005-2010 2045-2050 2095-2100
Rank Country or area
Total fertility (average
number of children per
woman) Rank Country or area
Total fertility (average
number of children per
woman) Rank Country or area
Total fertility (average
number of children per
woman) Rank Country or area
Total fertility (average
number of children per
woman)
A. Highest fertility
1. Yemen 8.58 1. Niger 7.58 1. Niger 5.03 1. Zambia 2.80
2. Rwanda 8.43 2. Somalia 7.10 2. Mali 4.21 2. Niger 2.51
3. Oman 8.10 3. Chad 6.85 3. Zambia 4.02 3. Malawi 2.28
4. Libya 7.94 4. Mali 6.80 4. Nigeria 3.79 4. Mali 2.24
5. Mayotte 7.91 5. Timor-Leste 6.53 5. Somalia 3.63 5. Congo 2.23
6. Côte d'Ivoire 7.81 6. Burundi 6.52 6. Burundi 3.57 6. United Rep. of Tanzania 2.22
7. Afghanistan 7.67 7. Dem. Rep. of the Congo 6.50 7. Malawi 3.45 7. Burundi 2.20
8. Kenya 7.64 8. Angola 6.50 8. Gambia 3.42 8. Nigeria 2.18
9. Niger 7.63 9. Uganda 6.38 9. United Rep. of Tanzania 3.34 9. Comoros 2.17
10. Malawi 7.60 10. Afghanistan 6.33 10. Chad 3.32 10. Somalia 2.14
B. Lowest fertility
1. China, Macao SAR 1.41 1. China, Macao SAR 0.94 1. Singapore 1.40 1. Singapore 1.47
2. Luxembourg 1.49 2. China, Hong Kong SAR 1.03 2. China, Hong Kong SAR 1.55 2. Channel Islands 1.72
3. Germany 1.51 3. Bosnia and Herzegovina 1.22 3. Other non-specified areas 1.58 3. Yemen 1.74
4. Channel Islands 1.52 4. Republic of Korea 1.23 4. China, Macao SAR 1.61 4. China, Hong Kong SAR 1.75
5. Switzerland 1.54 5. Singapore 1.26 5. Thailand 1.61 5. Afghanistan 1.75
6. Netherlands 1.60 6. Other non-specified areas 1.26 6. Channel Islands 1.62 6. Germany 1.76
7. Austria 1.65 7. Slovakia 1.31 7. Portugal 1.62 7. Syrian Arab Republic 1.80
8. Finland 1.66 8. Hungary 1.33 8. Libya 1.62 8. Rwanda 1.80
9. Sweden 1.66 9. Poland 1.33 9. Lebanon 1.63 9. Saudi Arabia 1.81
10. Denmark 1.68 10. Romania 1.33 10. Serbia 1.64 10. Jordan 1.81
WORLD 3.85 WORLD 2.53 WORLD 2.24 WORLD 1.99
Source: Population Division of the Department of Economic and Social Affairs of the United Nations Secretariat (2013). World Population Prospects: The 2012 Revision. New York: United Nations. NOTE: Only countries or areas with 90,000 persons or more in 2013 are considered.
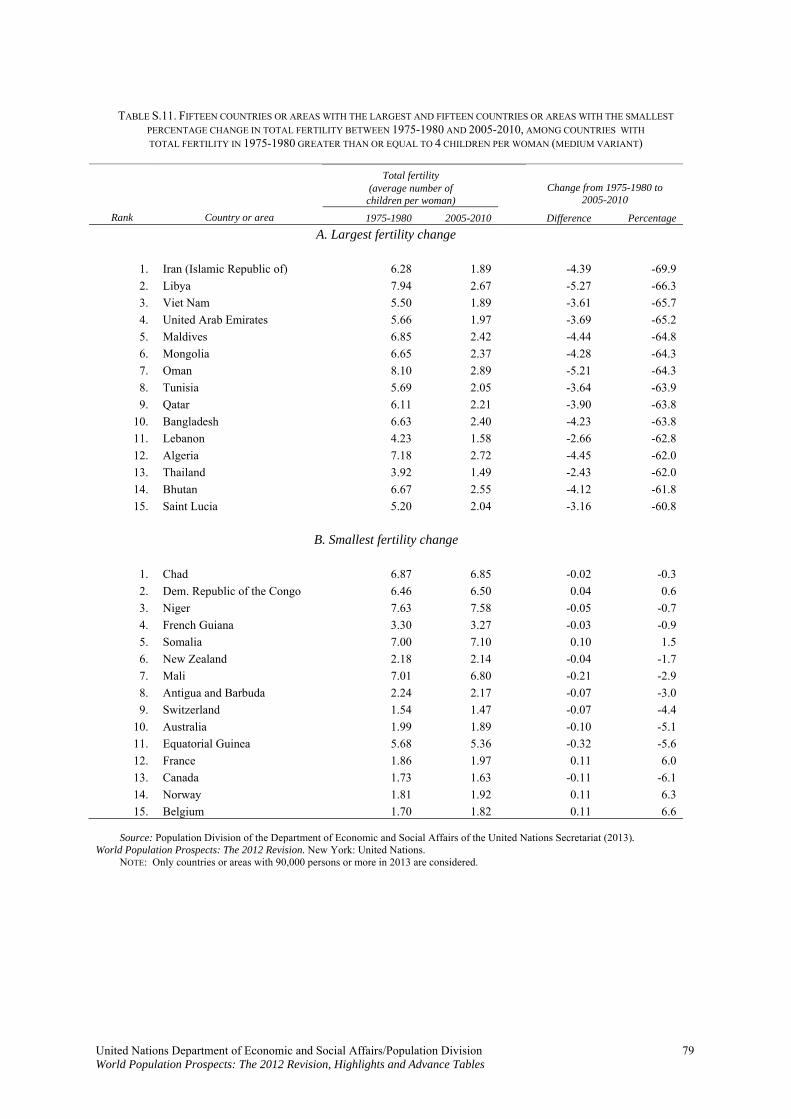
TABLE S.11. FIFTEEN COUNTRIES OR AREAS WITH THE LARGEST AND FIFTEEN COUNTRIES OR AREAS WITH THE SMALLEST
PERCENTAGE CHANGE IN TOTAL FERTILITY BETWEEN 1975-1980 AND 2005-2010, AMONG COUNTRIES WITH TOTAL FERTILITY IN 1975-1980 GREATER THAN OR EQUAL TO 4 CHILDREN PER WOMAN (MEDIUM VARIANT)
Total fertility
(average number of children per woman)
Change from 1975-1980 to 2005-2010
Rank Country or area 1975-1980 2005-2010 Difference Percentage
A. Largest fertility change
1. Iran (Islamic Republic of) 6.28 1.89 -4.39 -69.9
2. Libya 7.94 2.67 -5.27 -66.3
3. Viet Nam 5.50 1.89 -3.61 -65.7
4. United Arab Emirates 5.66 1.97 -3.69 -65.2
5. Maldives 6.85 2.42 -4.44 -64.8
6. Mongolia 6.65 2.37 -4.28 -64.3
7. Oman 8.10 2.89 -5.21 -64.3
8. Tunisia 5.69 2.05 -3.64 -63.9
9. Qatar 6.11 2.21 -3.90 -63.8
10. Bangladesh 6.63 2.40 -4.23 -63.8
11. Lebanon 4.23 1.58 -2.66 -62.8
12. Algeria 7.18 2.72 -4.45 -62.0
13. Thailand 3.92 1.49 -2.43 -62.0
14. Bhutan 6.67 2.55 -4.12 -61.8
15. Saint Lucia 5.20 2.04 -3.16 -60.8
B. Smallest fertility change
1. Chad 6.87 6.85 -0.02 -0.3
2. Dem. Republic of the Congo 6.46 6.50 0.04 0.6
3. Niger 7.63 7.58 -0.05 -0.7
4. French Guiana 3.30 3.27 -0.03 -0.9
5. Somalia 7.00 7.10 0.10 1.5
6. New Zealand 2.18 2.14 -0.04 -1.7
7. Mali 7.01 6.80 -0.21 -2.9
8. Antigua and Barbuda 2.24 2.17 -0.07 -3.0
9. Switzerland 1.54 1.47 -0.07 -4.4
10. Australia 1.99 1.89 -0.10 -5.1
11. Equatorial Guinea 5.68 5.36 -0.32 -5.6
12. France 1.86 1.97 0.11 6.0
13. Canada 1.73 1.63 -0.11 -6.1
14. Norway 1.81 1.92 0.11 6.3
15. Belgium 1.70 1.82 0.11 6.6
Source: Population Division of the Department of Economic and Social Affairs of the United Nations Secretariat (2013). World Population Prospects: The 2012 Revision. New York: United Nations. NOTE: Only countries or areas with 90,000 persons or more in 2013 are considered.
United Nations Department of Economic and Social Affairs/Population Division 79 World Population Prospects: The 2012 Revision, Highlights and Advance Tables
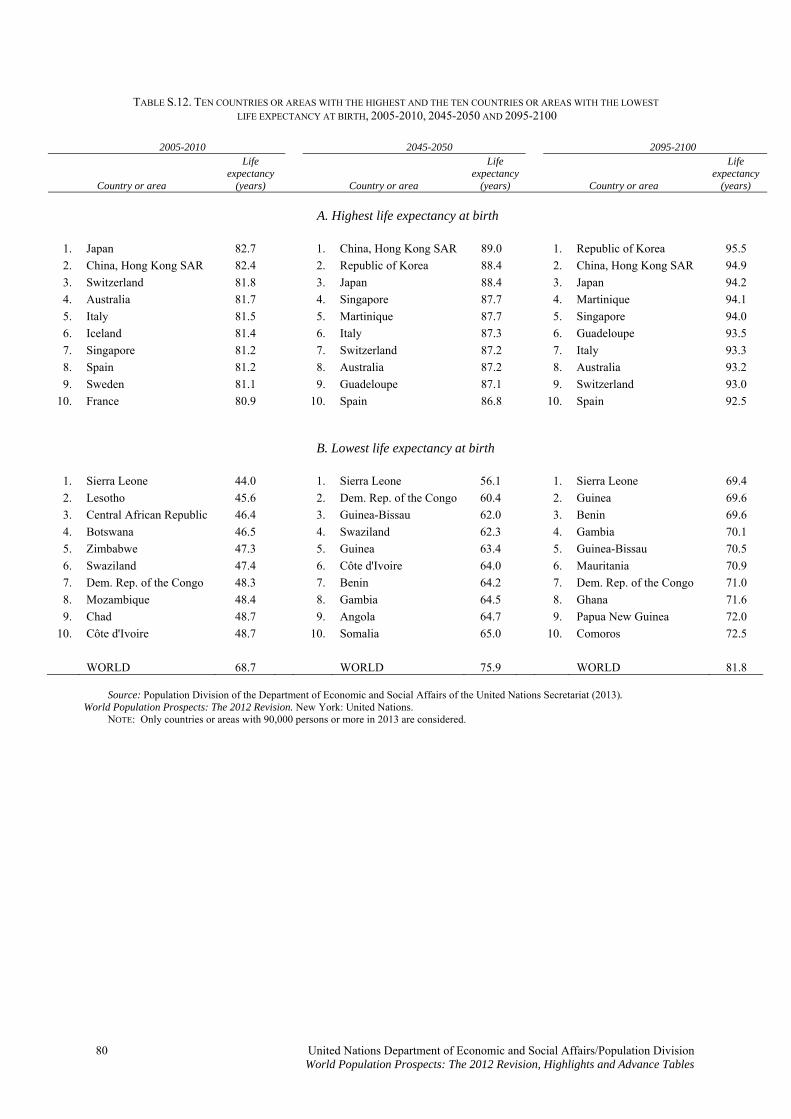
TABLE S.12. TEN COUNTRIES OR AREAS WITH THE HIGHEST AND THE TEN COUNTRIES OR AREAS WITH THE LOWEST LIFE EXPECTANCY AT BIRTH, 2005-2010, 2045-2050 AND 2095-2100
2005-2010 2045-2050 2095-2100
Country or area
Life expectancy
(years) Country or area
Life expectancy
(years) Country or area
Life expectancy
(years)
A. Highest life expectancy at birth
1. Japan 82.7 1. China, Hong Kong SAR 89.0 1. Republic of Korea 95.5
2. China, Hong Kong SAR 82.4 2. Republic of Korea 88.4 2. China, Hong Kong SAR 94.9
3. Switzerland 81.8 3. Japan 88.4 3. Japan 94.2
4. Australia 81.7 4. Singapore 87.7 4. Martinique 94.1
5. Italy 81.5 5. Martinique 87.7 5. Singapore 94.0
6. Iceland 81.4 6. Italy 87.3 6. Guadeloupe 93.5
7. Singapore 81.2 7. Switzerland 87.2 7. Italy 93.3
8. Spain 81.2 8. Australia 87.2 8. Australia 93.2
9. Sweden 81.1 9. Guadeloupe 87.1 9. Switzerland 93.0
10. France 80.9 10. Spain 86.8 10. Spain 92.5
B. Lowest life expectancy at birth
1. Sierra Leone 44.0 1. Sierra Leone 56.1 1. Sierra Leone 69.4
2. Lesotho 45.6 2. Dem. Rep. of the Congo 60.4 2. Guinea 69.6
3. Central African Republic 46.4 3. Guinea-Bissau 62.0 3. Benin 69.6
4. Botswana 46.5 4. Swaziland 62.3 4. Gambia 70.1
5. Zimbabwe 47.3 5. Guinea 63.4 5. Guinea-Bissau 70.5
6. Swaziland 47.4 6. Côte d'Ivoire 64.0 6. Mauritania 70.9
7. Dem. Rep. of the Congo 48.3 7. Benin 64.2 7. Dem. Rep. of the Congo 71.0
8. Mozambique 48.4 8. Gambia 64.5 8. Ghana 71.6
9. Chad 48.7 9. Angola 64.7 9. Papua New Guinea 72.0
10. Côte d'Ivoire 48.7 10. Somalia 65.0 10. Comoros 72.5
WORLD 68.7 WORLD 75.9 WORLD 81.8 Source: Population Division of the Department of Economic and Social Affairs of the United Nations Secretariat (2013). World Population Prospects: The 2012 Revision. New York: United Nations. NOTE: Only countries or areas with 90,000 persons or more in 2013 are considered.
80 United Nations Department of Economic and Social Affairs/Population Division World Population Prospects: The 2012 Revision, Highlights and Advance Tables
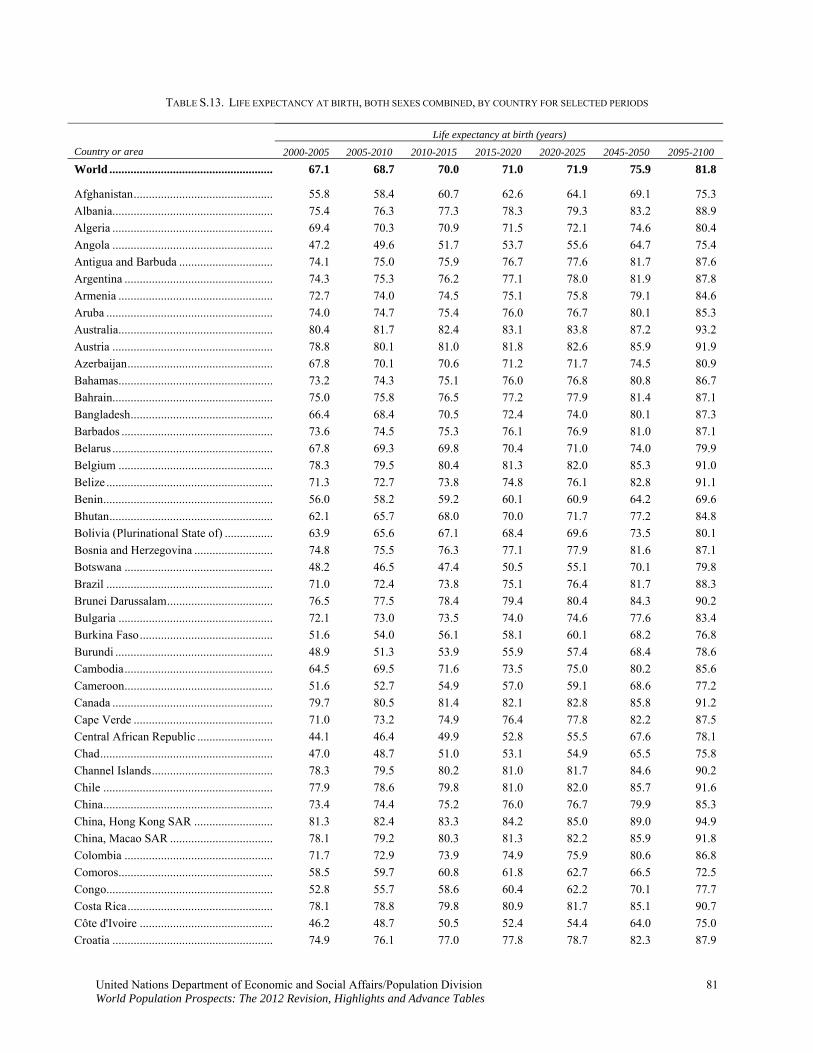
TABLE S.13. LIFE EXPECTANCY AT BIRTH, BOTH SEXES COMBINED, BY COUNTRY FOR SELECTED PERIODS
Life expectancy at birth (years)
Country or area 2000-2005 2005-2010 2010-2015 2015-2020 2020-2025 2045-2050 2095-2100
World ...................................................... 67.1 68.7 70.0 71.0 71.9 75.9 81.8
Afghanistan.............................................. 55.8 58.4 60.7 62.6 64.1 69.1 75.3
Albania..................................................... 75.4 76.3 77.3 78.3 79.3 83.2 88.9
Algeria ..................................................... 69.4 70.3 70.9 71.5 72.1 74.6 80.4
Angola ..................................................... 47.2 49.6 51.7 53.7 55.6 64.7 75.4
Antigua and Barbuda ............................... 74.1 75.0 75.9 76.7 77.6 81.7 87.6
Argentina ................................................. 74.3 75.3 76.2 77.1 78.0 81.9 87.8
Armenia ................................................... 72.7 74.0 74.5 75.1 75.8 79.1 84.6
Aruba ....................................................... 74.0 74.7 75.4 76.0 76.7 80.1 85.3
Australia................................................... 80.4 81.7 82.4 83.1 83.8 87.2 93.2
Austria ..................................................... 78.8 80.1 81.0 81.8 82.6 85.9 91.9
Azerbaijan................................................ 67.8 70.1 70.6 71.2 71.7 74.5 80.9
Bahamas................................................... 73.2 74.3 75.1 76.0 76.8 80.8 86.7
Bahrain..................................................... 75.0 75.8 76.5 77.2 77.9 81.4 87.1
Bangladesh............................................... 66.4 68.4 70.5 72.4 74.0 80.1 87.3
Barbados .................................................. 73.6 74.5 75.3 76.1 76.9 81.0 87.1
Belarus ..................................................... 67.8 69.3 69.8 70.4 71.0 74.0 79.9
Belgium ................................................... 78.3 79.5 80.4 81.3 82.0 85.3 91.0
Belize ....................................................... 71.3 72.7 73.8 74.8 76.1 82.8 91.1
Benin........................................................ 56.0 58.2 59.2 60.1 60.9 64.2 69.6
Bhutan...................................................... 62.1 65.7 68.0 70.0 71.7 77.2 84.8
Bolivia (Plurinational State of) ................ 63.9 65.6 67.1 68.4 69.6 73.5 80.1
Bosnia and Herzegovina .......................... 74.8 75.5 76.3 77.1 77.9 81.6 87.1
Botswana ................................................. 48.2 46.5 47.4 50.5 55.1 70.1 79.8
Brazil ....................................................... 71.0 72.4 73.8 75.1 76.4 81.7 88.3
Brunei Darussalam................................... 76.5 77.5 78.4 79.4 80.4 84.3 90.2
Bulgaria ................................................... 72.1 73.0 73.5 74.0 74.6 77.6 83.4
Burkina Faso............................................ 51.6 54.0 56.1 58.1 60.1 68.2 76.8
Burundi .................................................... 48.9 51.3 53.9 55.9 57.4 68.4 78.6
Cambodia................................................. 64.5 69.5 71.6 73.5 75.0 80.2 85.6
Cameroon................................................. 51.6 52.7 54.9 57.0 59.1 68.6 77.2
Canada ..................................................... 79.7 80.5 81.4 82.1 82.8 85.8 91.2
Cape Verde .............................................. 71.0 73.2 74.9 76.4 77.8 82.2 87.5
Central African Republic ......................... 44.1 46.4 49.9 52.8 55.5 67.6 78.1
Chad......................................................... 47.0 48.7 51.0 53.1 54.9 65.5 75.8
Channel Islands........................................ 78.3 79.5 80.2 81.0 81.7 84.6 90.2
Chile ........................................................ 77.9 78.6 79.8 81.0 82.0 85.7 91.6
China........................................................ 73.4 74.4 75.2 76.0 76.7 79.9 85.3
China, Hong Kong SAR .......................... 81.3 82.4 83.3 84.2 85.0 89.0 94.9
China, Macao SAR .................................. 78.1 79.2 80.3 81.3 82.2 85.9 91.8
Colombia ................................................. 71.7 72.9 73.9 74.9 75.9 80.6 86.8
Comoros................................................... 58.5 59.7 60.8 61.8 62.7 66.5 72.5
Congo....................................................... 52.8 55.7 58.6 60.4 62.2 70.1 77.7
Costa Rica................................................ 78.1 78.8 79.8 80.9 81.7 85.1 90.7
Côte d'Ivoire ............................................ 46.2 48.7 50.5 52.4 54.4 64.0 75.0
Croatia ..................................................... 74.9 76.1 77.0 77.8 78.7 82.3 87.9
United Nations Department of Economic and Social Affairs/Population Division 81 World Population Prospects: The 2012 Revision, Highlights and Advance Tables
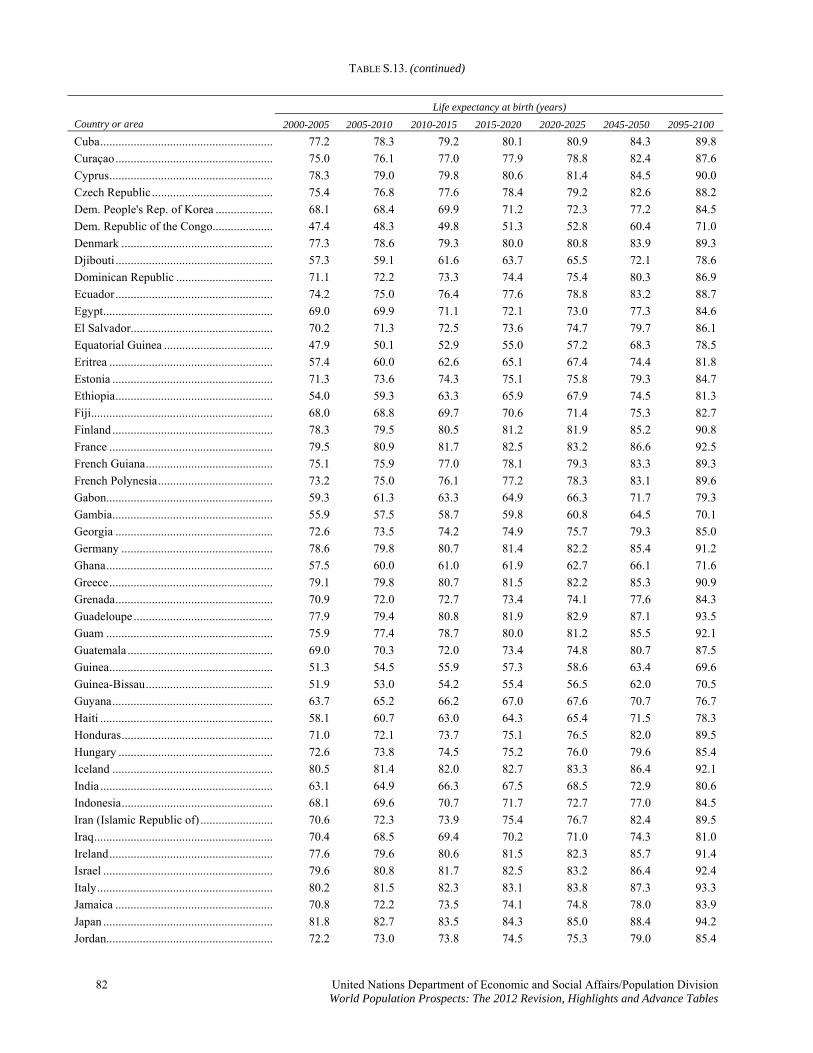
TABLE S.13. (continued)
Life expectancy at birth (years)
Country or area 2000-2005 2005-2010 2010-2015 2015-2020 2020-2025 2045-2050 2095-2100
Cuba......................................................... 77.2 78.3 79.2 80.1 80.9 84.3 89.8
Curaçao.................................................... 75.0 76.1 77.0 77.9 78.8 82.4 87.6
Cyprus...................................................... 78.3 79.8 80.6 79.0 81.4 84.5 90.0
Czech Republic ........................................ 75.4 76.8 77.6 78.4 79.2 82.6 88.2
Dem. People's Rep. of Korea ................... 68.1 68.4 69.9 71.2 72.3 77.2 84.5
Dem. Republic of the Congo.................... 47.4 48.3 49.8 51.3 52.8 60.4 71.0
Denmark .................................................. 77.3 78.6 79.3 80.0 80.8 83.9 89.3
Djibouti .................................................... 57.3 59.1 61.6 63.7 65.5 72.1 78.6
Dominican Republic ................................ 71.1 72.2 73.3 74.4 75.4 80.3 86.9
Ecuador.................................................... 74.2 75.0 76.4 77.6 78.8 83.2 88.7
Egypt........................................................ 69.0 69.9 71.1 72.1 73.0 77.3 84.6
El Salvador............................................... 70.2 71.3 72.5 73.6 74.7 79.7 86.1
Equatorial Guinea .................................... 47.9 50.1 52.9 55.0 57.2 68.3 78.5
Eritrea ...................................................... 57.4 60.0 62.6 65.1 67.4 74.4 81.8
Estonia ..................................................... 71.3 73.6 74.3 75.1 75.8 79.3 84.7
Ethiopia.................................................... 54.0 59.3 63.3 65.9 67.9 74.5 81.3
Fiji............................................................ 68.0 68.8 69.7 70.6 71.4 75.3 82.7
Finland ..................................................... 78.3 79.5 80.5 81.2 81.9 85.2 90.8
France ...................................................... 79.5 80.9 81.7 82.5 83.2 86.6 92.5
French Guiana.......................................... 75.1 75.9 77.0 78.1 79.3 83.3 89.3
French Polynesia...................................... 73.2 75.0 76.1 77.2 78.3 83.1 89.6
Gabon....................................................... 59.3 61.3 63.3 64.9 66.3 71.7 79.3
Gambia..................................................... 55.9 57.5 58.7 59.8 60.8 64.5 70.1
Georgia .................................................... 72.6 73.5 74.2 74.9 75.7 79.3 85.0
Germany .................................................. 78.6 79.8 80.7 81.4 82.2 85.4 91.2
Ghana....................................................... 57.5 60.0 61.0 61.9 62.7 66.1 71.6
Greece...................................................... 79.1 79.8 80.7 81.5 82.2 85.3 90.9
Grenada.................................................... 70.9 72.0 72.7 73.4 74.1 77.6 84.3
Guadeloupe .............................................. 77.9 79.4 80.8 81.9 82.9 87.1 93.5
Guam ....................................................... 75.9 77.4 78.7 80.0 81.2 85.5 92.1
Guatemala ................................................ 69.0 70.3 72.0 73.4 74.8 80.7 87.5
Guinea...................................................... 51.3 54.5 55.9 57.3 58.6 63.4 69.6
Guinea-Bissau.......................................... 51.9 53.0 54.2 55.4 56.5 62.0 70.5
Guyana..................................................... 63.7 65.2 66.2 67.0 67.6 70.7 76.7
Haiti ......................................................... 58.1 60.7 63.0 64.3 65.4 71.5 78.3
Honduras.................................................. 71.0 72.1 73.7 75.1 76.5 82.0 89.5
Hungary ................................................... 72.6 73.8 74.5 75.2 76.0 79.6 85.4
Iceland ..................................................... 80.5 81.4 82.0 82.7 83.3 86.4 92.1
India ......................................................... 63.1 64.9 66.3 67.5 68.5 72.9 80.6
Indonesia.................................................. 68.1 69.6 70.7 71.7 72.7 77.0 84.5
Iran (Islamic Republic of) ........................ 70.6 72.3 73.9 75.4 76.7 82.4 89.5
Iraq........................................................... 70.4 68.5 69.4 70.2 71.0 74.3 81.0
Ireland...................................................... 77.6 79.6 80.6 81.5 82.3 85.7 91.4
Israel ........................................................ 79.6 80.8 81.7 82.5 83.2 86.4 92.4
Italy.......................................................... 80.2 81.5 82.3 83.1 83.8 87.3 93.3
Jamaica .................................................... 70.8 72.2 73.5 74.1 74.8 78.0 83.9
Japan ........................................................ 81.8 82.7 83.5 84.3 85.0 88.4 94.2
Jordan....................................................... 72.2 73.0 73.8 74.5 75.3 79.0 85.4
82 United Nations Department of Economic and Social Affairs/Population Division World Population Prospects: The 2012 Revision, Highlights and Advance Tables
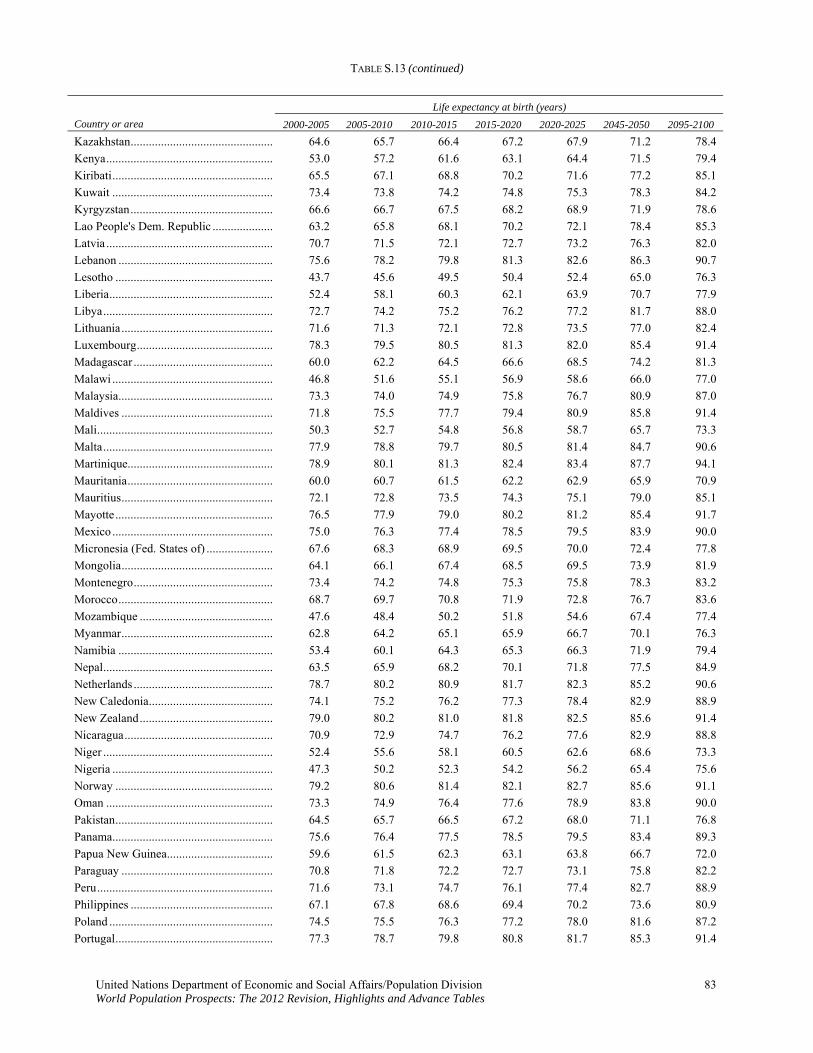
TABLE S.13 (continued)
Life expectancy at birth (years)
Country or area 2000-2005 2010-2015 2015-2020 2020-2025 2045-2050 2095-2100 2005-2010
Kazakhstan............................................... 64.6 65.7 66.4 67.2 67.9 71.2 78.4
Kenya....................................................... 53.0 57.2 61.6 63.1 64.4 71.5 79.4
Kiribati..................................................... 65.5 67.1 68.8 70.2 71.6 77.2 85.1
Kuwait ..................................................... 73.4 73.8 74.2 74.8 75.3 78.3 84.2
Kyrgyzstan............................................... 66.6 66.7 67.5 68.2 68.9 71.9 78.6
Lao People's Dem. Republic .................... 63.2 65.8 68.1 70.2 72.1 78.4 85.3
Latvia ....................................................... 70.7 71.5 72.1 72.7 73.2 76.3 82.0
Lebanon ................................................... 75.6 78.2 79.8 81.3 82.6 86.3 90.7
Lesotho .................................................... 43.7 45.6 49.5 50.4 52.4 65.0 76.3
Liberia...................................................... 52.4 58.1 60.3 62.1 63.9 70.7 77.9
Libya........................................................ 72.7 74.2 75.2 76.2 77.2 81.7 88.0
Lithuania.................................................. 71.6 71.3 72.1 72.8 73.5 77.0 82.4
Luxembourg............................................. 78.3 79.5 80.5 81.3 82.0 85.4 91.4
Madagascar .............................................. 60.0 62.2 64.5 66.6 68.5 74.2 81.3
Malawi ..................................................... 46.8 51.6 55.1 56.9 58.6 66.0 77.0
Malaysia................................................... 73.3 74.0 74.9 75.8 76.7 80.9 87.0
Maldives .................................................. 71.8 75.5 77.7 79.4 80.9 85.8 91.4
Mali.......................................................... 50.3 52.7 54.8 56.8 58.7 65.7 73.3
Malta........................................................ 77.9 78.8 79.7 80.5 81.4 84.7 90.6
Martinique................................................ 78.9 80.1 81.3 82.4 83.4 87.7 94.1
Mauritania................................................ 60.0 60.7 61.5 62.2 62.9 65.9 70.9
Mauritius.................................................. 72.1 72.8 73.5 74.3 75.1 79.0 85.1
Mayotte.................................................... 76.5 77.9 79.0 80.2 81.2 85.4 91.7
Mexico ..................................................... 75.0 76.3 77.4 78.5 79.5 83.9 90.0
Micronesia (Fed. States of) ...................... 67.6 68.3 68.9 69.5 70.0 72.4 77.8
Mongolia.................................................. 64.1 66.1 67.4 68.5 69.5 73.9 81.9
Montenegro.............................................. 73.4 74.2 74.8 75.3 75.8 78.3 83.2
Morocco................................................... 68.7 69.7 70.8 71.9 72.8 76.7 83.6
Mozambique ............................................ 47.6 48.4 50.2 51.8 54.6 67.4 77.4
Myanmar.................................................. 62.8 64.2 65.1 65.9 66.7 70.1 76.3
Namibia ................................................... 53.4 60.1 64.3 65.3 66.3 71.9 79.4
Nepal........................................................ 63.5 65.9 68.2 70.1 71.8 77.5 84.9
Netherlands .............................................. 78.7 80.2 80.9 81.7 82.3 85.2 90.6
New Caledonia......................................... 74.1 75.2 76.2 77.3 78.4 82.9 88.9
New Zealand............................................ 79.0 80.2 81.0 81.8 82.5 85.6 91.4
Nicaragua................................................. 70.9 72.9 74.7 76.2 77.6 82.9 88.8
Niger ........................................................ 52.4 55.6 58.1 60.5 62.6 68.6 73.3
Nigeria ..................................................... 47.3 50.2 52.3 54.2 56.2 65.4 75.6
Norway .................................................... 79.2 80.6 81.4 82.1 82.7 85.6 91.1
Oman ....................................................... 73.3 74.9 76.4 77.6 78.9 83.8 90.0
Pakistan.................................................... 64.5 65.7 66.5 67.2 68.0 71.1 76.8
Panama..................................................... 75.6 76.4 77.5 78.5 79.5 83.4 89.3
Papua New Guinea................................... 59.6 61.5 62.3 63.1 63.8 66.7 72.0
Paraguay .................................................. 70.8 71.8 72.2 72.7 73.1 75.8 82.2
Peru.......................................................... 71.6 73.1 74.7 76.1 77.4 82.7 88.9
Philippines ............................................... 67.1 67.8 68.6 69.4 70.2 73.6 80.9
Poland ...................................................... 74.5 75.5 76.3 77.2 78.0 81.6 87.2
Portugal.................................................... 77.3 78.7 79.8 80.8 81.7 85.3 91.4
United Nations Department of Economic and Social Affairs/Population Division 83 World Population Prospects: The 2012 Revision, Highlights and Advance Tables
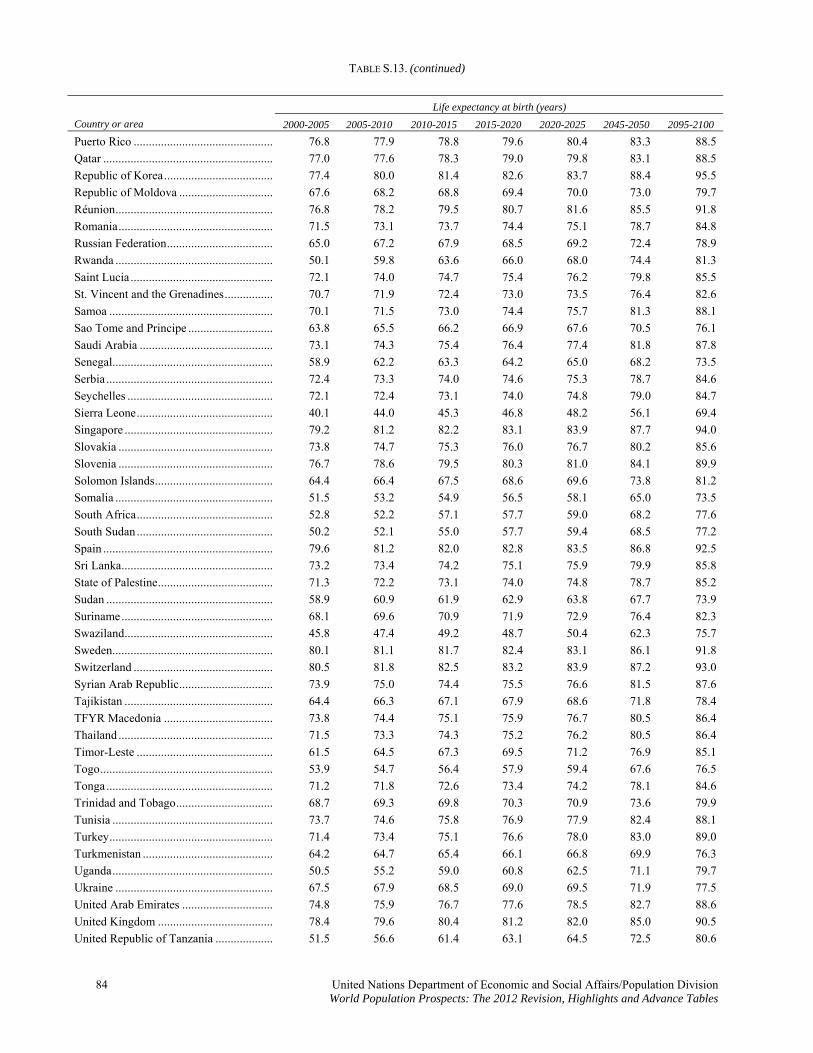
TABLE S.13. (continued)
Life expectancy at birth (years)
Country or area 2000-2005 2010-2015 2015-2020 2020-2025 2045-2050 2095-2100 2005-2010
Puerto Rico .............................................. 76.8 77.9 78.8 79.6 80.4 83.3 88.5
Qatar ........................................................ 77.0 77.6 78.3 79.0 79.8 83.1 88.5
Republic of Korea.................................... 77.4 80.0 81.4 82.6 83.7 88.4 95.5
Republic of Moldova ............................... 67.6 68.2 68.8 69.4 70.0 73.0 79.7
Réunion.................................................... 76.8 78.2 79.5 80.7 81.6 85.5 91.8
Romania................................................... 71.5 73.1 73.7 74.4 75.1 78.7 84.8
Russian Federation................................... 65.0 67.2 67.9 68.5 69.2 72.4 78.9
Rwanda .................................................... 50.1 59.8 63.6 66.0 68.0 74.4 81.3
Saint Lucia ............................................... 72.1 74.0 74.7 75.4 76.2 79.8 85.5
St. Vincent and the Grenadines................ 70.7 71.9 72.4 73.0 73.5 76.4 82.6
Samoa ...................................................... 70.1 71.5 73.0 74.4 75.7 81.3 88.1
Sao Tome and Principe ............................ 63.8 65.5 66.2 66.9 67.6 70.5 76.1
Saudi Arabia ............................................ 73.1 74.3 75.4 76.4 77.4 81.8 87.8
Senegal..................................................... 58.9 62.2 63.3 64.2 65.0 68.2 73.5
Serbia ....................................................... 72.4 73.3 74.0 74.6 75.3 78.7 84.6
Seychelles ................................................ 72.1 72.4 73.1 74.0 74.8 79.0 84.7
Sierra Leone............................................. 40.1 44.0 45.3 46.8 48.2 56.1 69.4
Singapore ................................................. 79.2 81.2 82.2 83.1 83.9 87.7 94.0
Slovakia ................................................... 73.8 74.7 75.3 76.0 76.7 80.2 85.6
Slovenia ................................................... 76.7 78.6 79.5 80.3 81.0 84.1 89.9
Solomon Islands....................................... 64.4 66.4 67.5 68.6 69.6 73.8 81.2
Somalia .................................................... 51.5 53.2 54.9 56.5 58.1 65.0 73.5
South Africa............................................. 52.8 52.2 57.1 57.7 59.0 68.2 77.6
South Sudan ............................................. 50.2 52.1 55.0 57.7 59.4 68.5 77.2
Spain ........................................................ 79.6 81.2 82.0 82.8 83.5 86.8 92.5
Sri Lanka.................................................. 73.2 73.4 74.2 75.1 75.9 79.9 85.8
State of Palestine...................................... 71.3 72.2 73.1 74.0 74.8 78.7 85.2
Sudan ....................................................... 58.9 60.9 61.9 62.9 63.8 67.7 73.9
Suriname.................................................. 68.1 69.6 70.9 71.9 72.9 76.4 82.3
Swaziland................................................. 45.8 47.4 49.2 48.7 50.4 62.3 75.7
Sweden..................................................... 80.1 81.1 81.7 82.4 83.1 86.1 91.8
Switzerland .............................................. 80.5 81.8 82.5 83.2 83.9 87.2 93.0
Syrian Arab Republic............................... 73.9 75.0 74.4 75.5 76.6 81.5 87.6
Tajikistan ................................................. 64.4 66.3 67.1 67.9 68.6 71.8 78.4
TFYR Macedonia .................................... 73.8 74.4 75.1 75.9 76.7 80.5 86.4
Thailand ................................................... 71.5 73.3 74.3 75.2 76.2 80.5 86.4
Timor-Leste ............................................. 61.5 64.5 67.3 69.5 71.2 76.9 85.1
Togo......................................................... 53.9 54.7 56.4 57.9 59.4 67.6 76.5
Tonga ....................................................... 71.2 71.8 72.6 73.4 74.2 78.1 84.6
Trinidad and Tobago................................ 68.7 69.3 69.8 70.3 70.9 73.6 79.9
Tunisia ..................................................... 73.7 74.6 75.8 76.9 77.9 82.4 88.1
Turkey...................................................... 71.4 73.4 75.1 76.6 78.0 83.0 89.0
Turkmenistan ........................................... 64.2 64.7 65.4 66.1 66.8 69.9 76.3
Uganda..................................................... 50.5 55.2 59.0 60.8 62.5 71.1 79.7
Ukraine .................................................... 67.5 67.9 68.5 69.0 69.5 71.9 77.5
United Arab Emirates .............................. 74.8 75.9 76.7 77.6 78.5 82.7 88.6
United Kingdom ...................................... 78.4 79.6 80.4 81.2 82.0 85.0 90.5
United Republic of Tanzania ................... 51.5 56.6 61.4 63.1 64.5 72.5 80.6
84 United Nations Department of Economic and Social Affairs/Population Division World Population Prospects: The 2012 Revision, Highlights and Advance Tables
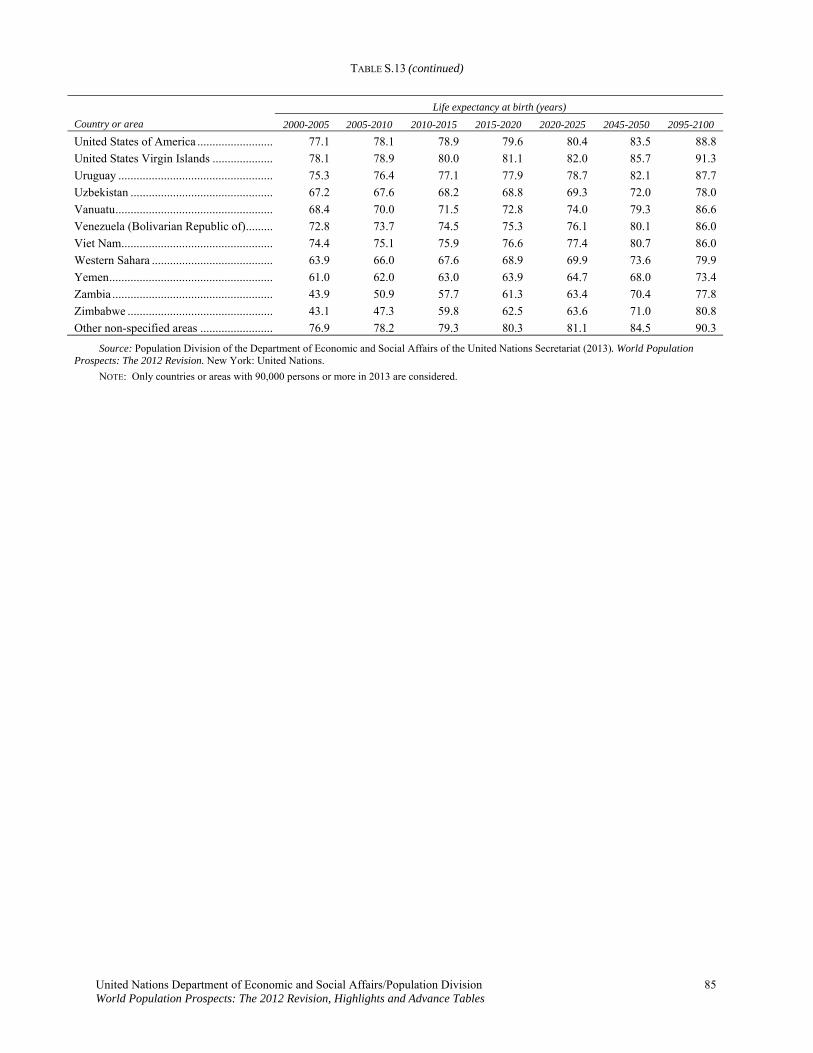
TABLE S.13 (continued)
United Nations Department of Economic and Social Affairs/Population Division 85 World Population Prospects: The 2012 Revision, Highlights and Advance Tables
Life expectancy at birth (years)
Country or area 2000-2005 2005-2010 2010-2015 2015-2020 2020-2025 2045-2050 2095-2100
United States of America ......................... 77.1 78.1 78.9 79.6 80.4 83.5 88.8
United States Virgin Islands .................... 78.1 78.9 80.0 81.1 82.0 85.7 91.3
Uruguay ................................................... 75.3 76.4 77.1 77.9 78.7 82.1 87.7
Uzbekistan ............................................... 67.2 67.6 68.2 68.8 69.3 72.0 78.0
Vanuatu.................................................... 68.4 70.0 71.5 72.8 74.0 79.3 86.6
Venezuela (Bolivarian Republic of)......... 72.8 73.7 74.5 75.3 76.1 80.1 86.0
Viet Nam.................................................. 74.4 75.1 75.9 76.6 77.4 80.7 86.0
Western Sahara ........................................ 63.9 66.0 67.6 68.9 69.9 73.6 79.9
Yemen...................................................... 61.0 62.0 63.0 63.9 64.7 68.0 73.4
Zambia ..................................................... 43.9 50.9 57.7 61.3 63.4 70.4 77.8
Zimbabwe ................................................ 43.1 47.3 59.8 62.5 63.6 71.0 80.8
Other non-specified areas ........................ 76.9 78.2 79.3 80.3 81.1 84.5 90.3
Source: Population Division of the Department of Economic and Social Affairs of the United Nations Secretariat (2013). World Population Prospects: The 2012 Revision. New York: United Nations.
NOTE: Only countries or areas with 90,000 persons or more in 2013 are considered.
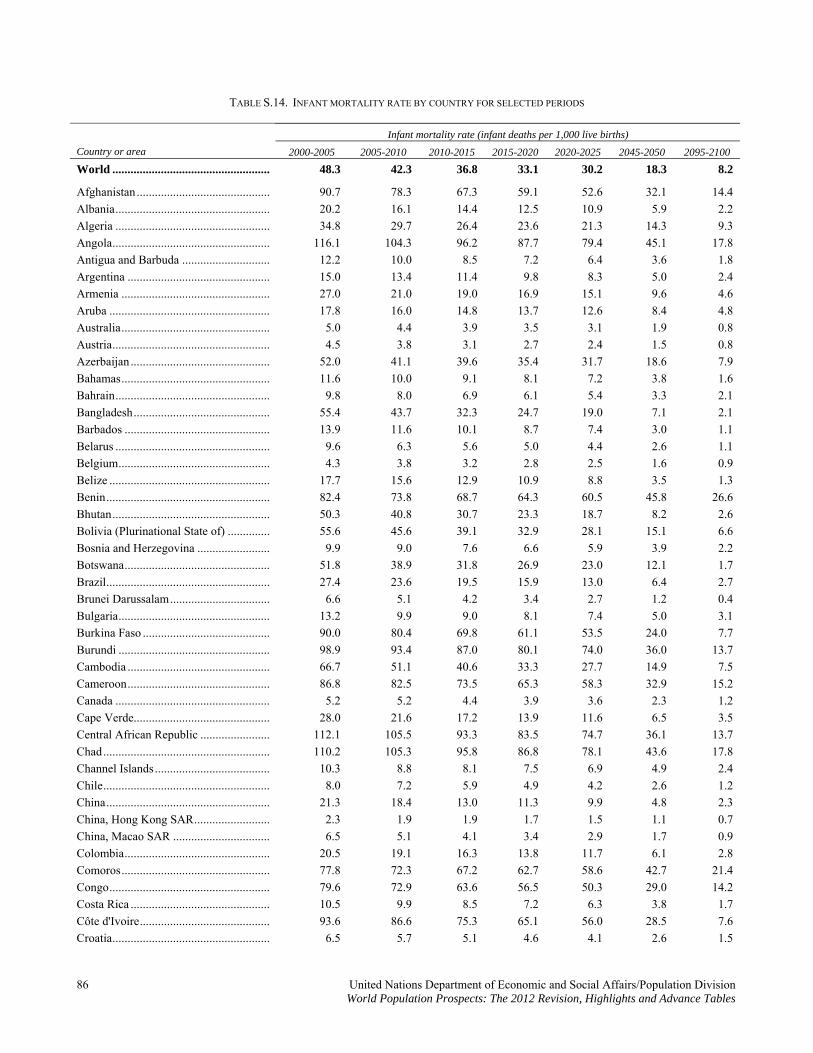
TABLE S.14. INFANT MORTALITY RATE BY COUNTRY FOR SELECTED PERIODS
Infant mortality rate (infant deaths per 1,000 live births)
Country or area 2000-2005 2005-2010 2010-2015 2015-2020 2020-2025 2045-2050 2095-2100
World .................................................... 48.3 42.3 36.8 33.1 30.2 18.3 8.2
Afghanistan ............................................ 90.7 78.3 67.3 59.1 52.6 32.1 14.4
Albania................................................... 20.2 16.1 14.4 12.5 10.9 5.9 2.2
Algeria ................................................... 34.8 29.7 26.4 23.6 21.3 14.3 9.3
Angola.................................................... 116.1 104.3 96.2 87.7 79.4 45.1 17.8
Antigua and Barbuda ............................. 12.2 10.0 8.5 7.2 6.4 3.6 1.8
Argentina ............................................... 15.0 13.4 11.4 9.8 8.3 5.0 2.4
Armenia ................................................. 27.0 21.0 19.0 16.9 15.1 9.6 4.6
Aruba ..................................................... 17.8 16.0 14.8 13.7 12.6 8.4 4.8
Australia................................................. 5.0 4.4 3.9 3.5 3.1 1.9 0.8
Austria.................................................... 4.5 3.8 3.1 2.7 2.4 1.5 0.8
Azerbaijan.............................................. 52.0 41.1 39.6 35.4 31.7 18.6 7.9
Bahamas................................................. 11.6 10.0 9.1 8.1 7.2 3.8 1.6
Bahrain................................................... 9.8 8.0 6.9 6.1 5.4 3.3 2.1
Bangladesh............................................. 55.4 43.7 32.3 24.7 19.0 7.1 2.1
Barbados ................................................ 13.9 11.6 10.1 8.7 7.4 3.0 1.1
Belarus ................................................... 9.6 6.3 5.6 5.0 4.4 2.6 1.1
Belgium.................................................. 4.3 3.8 3.2 2.8 2.5 1.6 0.9
Belize ..................................................... 17.7 15.6 12.9 10.9 8.8 3.5 1.3
Benin...................................................... 82.4 73.8 68.7 64.3 60.5 45.8 26.6
Bhutan.................................................... 50.3 40.8 30.7 23.3 18.7 8.2 2.6
Bolivia (Plurinational State of) .............. 55.6 45.6 39.1 32.9 28.1 15.1 6.6
Bosnia and Herzegovina ........................ 9.9 9.0 7.6 6.6 5.9 3.9 2.2
Botswana................................................ 51.8 38.9 31.8 26.9 23.0 12.1 1.7
Brazil...................................................... 27.4 23.6 19.5 15.9 13.0 6.4 2.7
Brunei Darussalam................................. 6.6 5.1 4.2 3.4 2.7 1.2 0.4
Bulgaria.................................................. 13.2 9.9 9.0 8.1 7.4 5.0 3.1
Burkina Faso .......................................... 90.0 80.4 69.8 61.1 53.5 24.0 7.7
Burundi .................................................. 98.9 93.4 87.0 80.1 74.0 36.0 13.7
Cambodia ............................................... 66.7 51.1 40.6 33.3 27.7 14.9 7.5
Cameroon............................................... 86.8 82.5 73.5 65.3 58.3 32.9 15.2
Canada ................................................... 5.2 5.2 4.4 3.9 3.6 2.3 1.2
Cape Verde............................................. 28.0 21.6 17.2 13.9 11.6 6.5 3.5
Central African Republic ....................... 112.1 105.5 93.3 83.5 74.7 36.1 13.7
Chad....................................................... 110.2 105.3 95.8 86.8 78.1 43.6 17.8
Channel Islands...................................... 10.3 8.8 8.1 7.5 6.9 4.9 2.4
Chile....................................................... 8.0 7.2 5.9 4.9 4.2 2.6 1.2
China...................................................... 21.3 18.4 13.0 11.3 9.9 4.8 2.3
China, Hong Kong SAR......................... 2.3 1.9 1.9 1.7 1.5 1.1 0.7
China, Macao SAR ................................ 6.5 5.1 4.1 3.4 2.9 1.7 0.9
Colombia................................................ 20.5 19.1 16.3 13.8 11.7 6.1 2.8
Comoros................................................. 77.8 72.3 67.2 62.7 58.6 42.7 21.4
Congo..................................................... 79.6 72.9 63.6 56.5 50.3 29.0 14.2
Costa Rica .............................................. 10.5 9.9 8.5 7.2 6.3 3.8 1.7
Côte d'Ivoire........................................... 93.6 86.6 75.3 65.1 56.0 28.5 7.6
Croatia.................................................... 6.5 5.7 5.1 4.6 4.1 2.6 1.5
86 United Nations Department of Economic and Social Affairs/Population Division World Population Prospects: The 2012 Revision, Highlights and Advance Tables
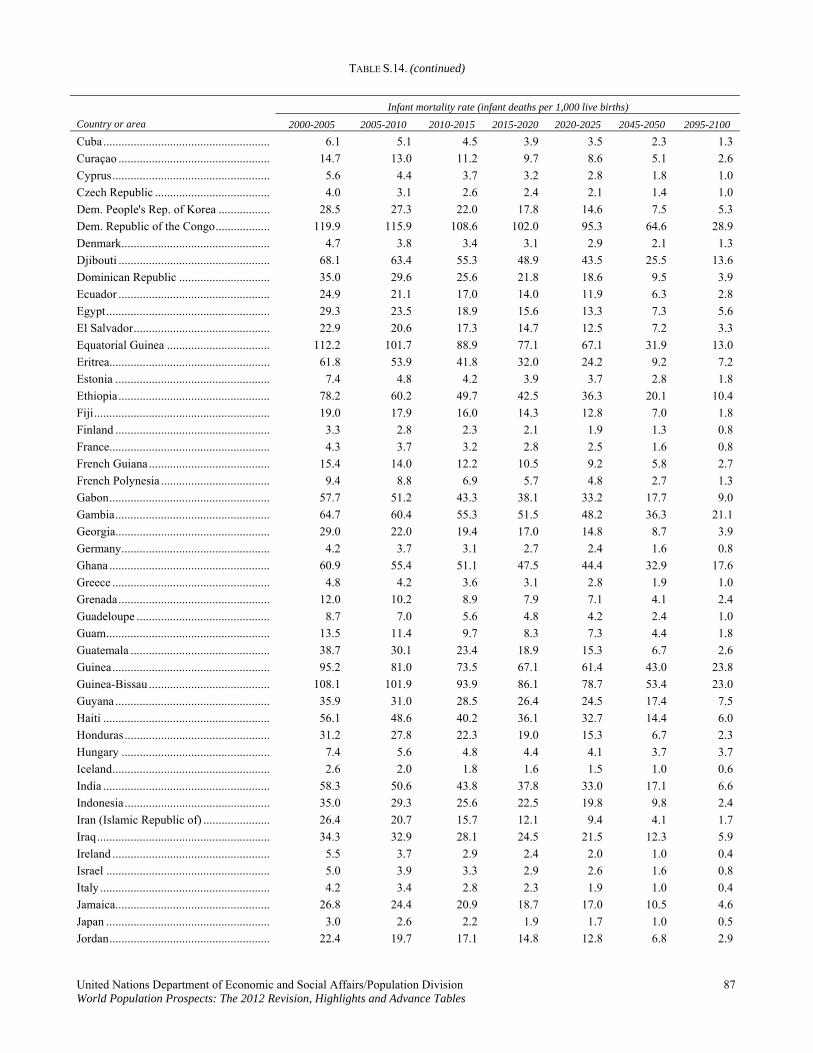
TABLE S.14. (continued)
Infant mortality rate (infant deaths per 1,000 live births)
Country or area 2000-2005 2005-2010 2010-2015 2015-2020 2020-2025 2045-2050 2095-2100
Cuba....................................................... 6.1 5.1 4.5 3.9 3.5 2.3 1.3
Curaçao .................................................. 14.7 13.0 11.2 9.7 8.6 5.1 2.6
Cyprus.................................................... 5.6 4.4 3.7 3.2 2.8 1.8 1.0
Czech Republic ...................................... 4.0 3.1 2.6 2.4 2.1 1.4 1.0
Dem. People's Rep. of Korea ................. 28.5 27.3 22.0 17.8 14.6 7.5 5.3
Dem. Republic of the Congo.................. 119.9 115.9 108.6 102.0 95.3 64.6 28.9
Denmark................................................. 4.7 3.8 3.4 3.1 2.9 2.1 1.3
Djibouti .................................................. 68.1 63.4 55.3 48.9 43.5 25.5 13.6
Dominican Republic .............................. 35.0 29.6 25.6 21.8 18.6 9.5 3.9
Ecuador .................................................. 24.9 21.1 17.0 14.0 11.9 6.3 2.8
Egypt...................................................... 29.3 23.5 18.9 15.6 13.3 7.3 5.6
El Salvador............................................. 22.9 20.6 17.3 14.7 12.5 7.2 3.3
Equatorial Guinea .................................. 112.2 101.7 88.9 77.1 67.1 31.9 13.0
Eritrea..................................................... 61.8 53.9 41.8 32.0 24.2 9.2 7.2
Estonia ................................................... 7.4 4.8 4.2 3.9 3.7 2.8 1.8
Ethiopia.................................................. 78.2 60.2 49.7 42.5 36.3 20.1 10.4
Fiji.......................................................... 19.0 17.9 16.0 14.3 12.8 7.0 1.8
Finland ................................................... 3.3 2.8 2.3 2.1 1.9 1.3 0.8
France..................................................... 4.3 3.7 3.2 2.8 2.5 1.6 0.8
French Guiana........................................ 15.4 14.0 12.2 10.5 9.2 5.8 2.7
French Polynesia .................................... 9.4 8.8 6.9 5.7 4.8 2.7 1.3
Gabon..................................................... 57.7 51.2 43.3 38.1 33.2 17.7 9.0
Gambia................................................... 64.7 60.4 55.3 51.5 48.2 36.3 21.1
Georgia................................................... 29.0 22.0 19.4 17.0 14.8 8.7 3.9
Germany................................................. 4.2 3.7 3.1 2.7 2.4 1.6 0.8
Ghana ..................................................... 60.9 55.4 51.1 47.5 44.4 32.9 17.6
Greece .................................................... 4.8 4.2 3.6 3.1 2.8 1.9 1.0
Grenada.................................................. 12.0 10.2 8.9 7.9 7.1 4.1 2.4
Guadeloupe ............................................ 8.7 7.0 5.6 4.8 4.2 2.4 1.0
Guam...................................................... 13.5 11.4 9.7 8.3 7.3 4.4 1.8
Guatemala .............................................. 38.7 30.1 23.4 18.9 15.3 6.7 2.6
Guinea.................................................... 95.2 81.0 73.5 67.1 61.4 43.0 23.8
Guinea-Bissau ........................................ 108.1 101.9 93.9 86.1 78.7 53.4 23.0
Guyana ................................................... 35.9 31.0 28.5 26.4 24.5 17.4 7.5
Haiti ....................................................... 56.1 48.6 40.2 36.1 32.7 14.4 6.0
Honduras................................................ 31.2 27.8 22.3 19.0 15.3 6.7 2.3
Hungary ................................................. 7.4 5.6 4.8 4.4 4.1 3.7 3.7
Iceland.................................................... 2.6 2.0 1.8 1.6 1.5 1.0 0.6
India ....................................................... 58.3 50.6 43.8 37.8 33.0 17.1 6.6
Indonesia................................................ 35.0 29.3 25.6 22.5 19.8 9.8 2.4
Iran (Islamic Republic of) ...................... 26.4 20.7 15.7 12.1 9.4 4.1 1.7
Iraq......................................................... 34.3 32.9 28.1 24.5 21.5 12.3 5.9
Ireland .................................................... 5.5 3.7 2.9 2.4 2.0 1.0 0.4
Israel ...................................................... 5.0 3.9 3.3 2.9 2.6 1.6 0.8
Italy ........................................................ 4.2 3.4 2.8 2.3 1.9 1.0 0.4
Jamaica................................................... 26.8 24.4 20.9 18.7 17.0 10.5 4.6
Japan ...................................................... 3.0 2.6 2.2 1.9 1.7 1.0 0.5
Jordan..................................................... 22.4 19.7 17.1 14.8 12.8 6.8 2.9
United Nations Department of Economic and Social Affairs/Population Division 87 World Population Prospects: The 2012 Revision, Highlights and Advance Tables
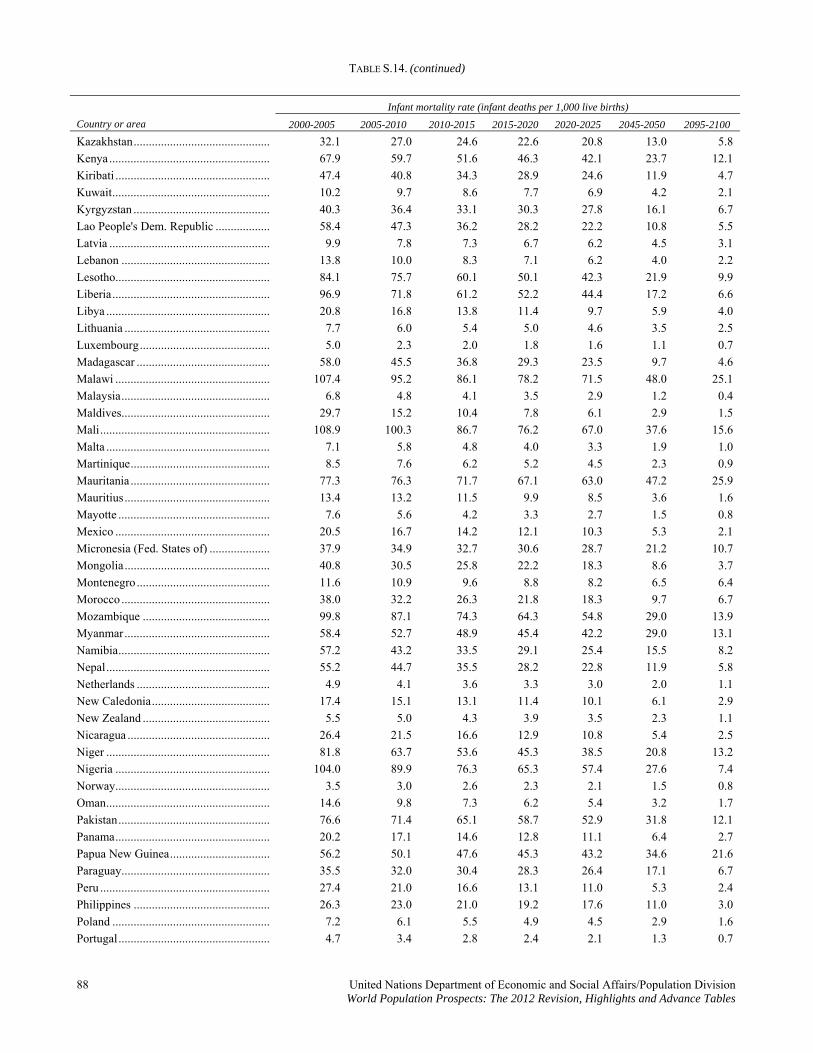
TABLE S.14. (continued)
Infant mortality rate (infant deaths per 1,000 live births)
Country or area 2000-2005 2005-2010 2010-2015 2015-2020 2020-2025 2045-2050 2095-2100
Kazakhstan............................................. 32.1 27.0 24.6 22.6 20.8 13.0 5.8
Kenya ..................................................... 67.9 59.7 51.6 46.3 42.1 23.7 12.1
Kiribati ................................................... 47.4 40.8 34.3 28.9 24.6 11.9 4.7
Kuwait.................................................... 10.2 9.7 8.6 7.7 6.9 4.2 2.1
Kyrgyzstan ............................................. 40.3 36.4 33.1 30.3 27.8 16.1 6.7
Lao People's Dem. Republic .................. 58.4 47.3 36.2 28.2 22.2 10.8 5.5
Latvia ..................................................... 9.9 7.8 7.3 6.7 6.2 4.5 3.1
Lebanon ................................................. 13.8 10.0 8.3 7.1 6.2 4.0 2.2
Lesotho................................................... 84.1 75.7 60.1 50.1 42.3 21.9 9.9
Liberia.................................................... 96.9 71.8 61.2 52.2 44.4 17.2 6.6
Libya ...................................................... 20.8 16.8 13.8 11.4 9.7 5.9 4.0
Lithuania ................................................ 7.7 6.0 5.4 5.0 4.6 3.5 2.5
Luxembourg........................................... 5.0 2.3 2.0 1.8 1.6 1.1 0.7
Madagascar ............................................ 58.0 45.5 36.8 29.3 23.5 9.7 4.6
Malawi ................................................... 107.4 95.2 86.1 78.2 71.5 48.0 25.1
Malaysia................................................. 6.8 4.8 4.1 3.5 2.9 1.2 0.4
Maldives................................................. 29.7 15.2 10.4 7.8 6.1 2.9 1.5
Mali........................................................ 108.9 100.3 86.7 76.2 67.0 37.6 15.6
Malta ...................................................... 7.1 5.8 4.8 4.0 3.3 1.9 1.0
Martinique.............................................. 8.5 7.6 6.2 5.2 4.5 2.3 0.9
Mauritania .............................................. 77.3 76.3 71.7 67.1 63.0 47.2 25.9
Mauritius................................................ 13.4 13.2 11.5 9.9 8.5 3.6 1.6
Mayotte .................................................. 7.6 5.6 4.2 3.3 2.7 1.5 0.8
Mexico ................................................... 20.5 16.7 14.2 12.1 10.3 5.3 2.1
Micronesia (Fed. States of) .................... 37.9 34.9 32.7 30.6 28.7 21.2 10.7
Mongolia................................................ 40.8 30.5 25.8 22.2 18.3 8.6 3.7
Montenegro ............................................ 11.6 10.9 9.6 8.8 8.2 6.5 6.4
Morocco ................................................. 38.0 32.2 26.3 21.8 18.3 9.7 6.7
Mozambique .......................................... 99.8 87.1 74.3 64.3 54.8 29.0 13.9
Myanmar................................................ 58.4 52.7 48.9 45.4 42.2 29.0 13.1
Namibia.................................................. 57.2 43.2 33.5 29.1 25.4 15.5 8.2
Nepal...................................................... 55.2 44.7 35.5 28.2 22.8 11.9 5.8
Netherlands ............................................ 4.9 4.1 3.6 3.3 3.0 2.0 1.1
New Caledonia....................................... 17.4 15.1 13.1 11.4 10.1 6.1 2.9
New Zealand .......................................... 5.5 5.0 4.3 3.9 3.5 2.3 1.1
Nicaragua ............................................... 26.4 21.5 16.6 12.9 10.8 5.4 2.5
Niger ...................................................... 81.8 63.7 53.6 45.3 38.5 20.8 13.2
Nigeria ................................................... 104.0 89.9 76.3 65.3 57.4 27.6 7.4
Norway................................................... 3.5 3.0 2.6 2.3 2.1 1.5 0.8
Oman...................................................... 14.6 9.8 7.3 6.2 5.4 3.2 1.7
Pakistan.................................................. 76.6 71.4 65.1 58.7 52.9 31.8 12.1
Panama................................................... 20.2 17.1 14.6 12.8 11.1 6.4 2.7
Papua New Guinea................................. 56.2 50.1 47.6 45.3 43.2 34.6 21.6
Paraguay................................................. 35.5 32.0 30.4 28.3 26.4 17.1 6.7
Peru ........................................................ 27.4 21.0 16.6 13.1 11.0 5.3 2.4
Philippines ............................................. 26.3 23.0 21.0 19.2 17.6 11.0 3.0
Poland .................................................... 7.2 6.1 5.5 4.9 4.5 2.9 1.6
Portugal.................................................. 4.7 3.4 2.8 2.4 2.1 1.3 0.7
88 United Nations Department of Economic and Social Affairs/Population Division World Population Prospects: The 2012 Revision, Highlights and Advance Tables
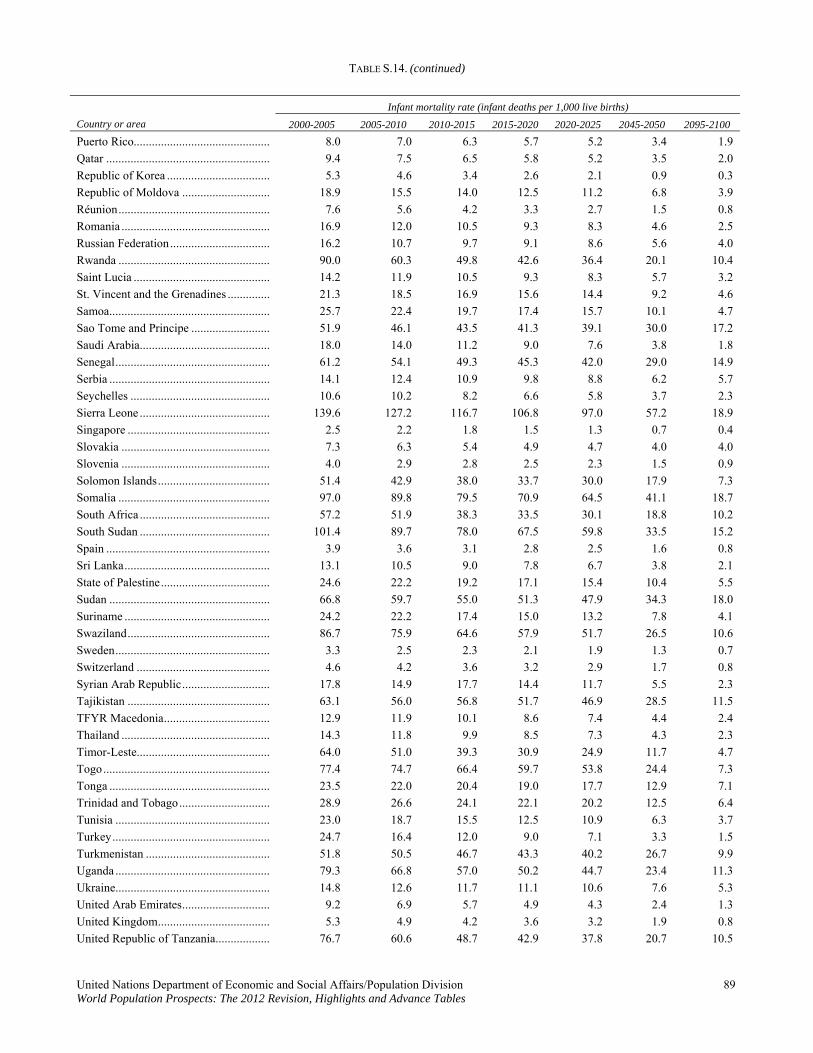
TABLE S.14. (continued)
Infant mortality rate (infant deaths per 1,000 live births)
Country or area 2000-2005 2005-2010 2010-2015 2020-2025 2045-2050 2095-2100 2015-2020
Puerto Rico............................................. 8.0 7.0 6.3 5.7 5.2 3.4 1.9
Qatar ...................................................... 9.4 7.5 6.5 5.8 5.2 3.5 2.0
Republic of Korea .................................. 5.3 4.6 3.4 2.6 2.1 0.9 0.3
Republic of Moldova ............................. 18.9 15.5 14.0 12.5 11.2 6.8 3.9
Réunion.................................................. 7.6 5.6 4.2 3.3 2.7 1.5 0.8
Romania ................................................. 16.9 12.0 10.5 9.3 8.3 4.6 2.5
Russian Federation................................. 16.2 10.7 9.7 9.1 8.6 5.6 4.0
Rwanda .................................................. 90.0 60.3 49.8 42.6 36.4 20.1 10.4
Saint Lucia ............................................. 14.2 11.9 10.5 9.3 8.3 5.7 3.2
St. Vincent and the Grenadines .............. 21.3 18.5 16.9 15.6 14.4 9.2 4.6
Samoa..................................................... 25.7 22.4 19.7 17.4 15.7 10.1 4.7
Sao Tome and Principe .......................... 51.9 46.1 43.5 41.3 39.1 30.0 17.2
Saudi Arabia........................................... 18.0 14.0 11.2 9.0 7.6 3.8 1.8
Senegal................................................... 61.2 54.1 49.3 45.3 42.0 29.0 14.9
Serbia ..................................................... 14.1 12.4 10.9 9.8 8.8 6.2 5.7
Seychelles .............................................. 10.6 10.2 8.2 6.6 5.8 3.7 2.3
Sierra Leone ........................................... 139.6 127.2 116.7 106.8 97.0 57.2 18.9
Singapore ............................................... 2.5 2.2 1.8 1.5 1.3 0.7 0.4
Slovakia ................................................. 7.3 6.3 5.4 4.9 4.7 4.0 4.0
Slovenia ................................................. 4.0 2.9 2.8 2.5 2.3 1.5 0.9
Solomon Islands..................................... 51.4 42.9 38.0 33.7 30.0 17.9 7.3
Somalia .................................................. 97.0 89.8 79.5 70.9 64.5 41.1 18.7
South Africa ........................................... 57.2 51.9 38.3 33.5 30.1 18.8 10.2
South Sudan ........................................... 101.4 89.7 78.0 67.5 59.8 33.5 15.2
Spain ...................................................... 3.9 3.6 3.1 2.8 2.5 1.6 0.8
Sri Lanka................................................ 13.1 10.5 9.0 7.8 6.7 3.8 2.1
State of Palestine.................................... 24.6 22.2 19.2 17.1 15.4 10.4 5.5
Sudan ..................................................... 66.8 59.7 55.0 51.3 47.9 34.3 18.0
Suriname ................................................ 24.2 22.2 17.4 15.0 13.2 7.8 4.1
Swaziland............................................... 86.7 75.9 64.6 57.9 51.7 26.5 10.6
Sweden................................................... 3.3 2.5 2.3 2.1 1.9 1.3 0.7
Switzerland ............................................ 4.6 4.2 3.6 3.2 2.9 1.7 0.8
Syrian Arab Republic............................. 17.8 14.9 17.7 14.4 11.7 5.5 2.3
Tajikistan ............................................... 63.1 56.0 56.8 51.7 46.9 28.5 11.5
TFYR Macedonia................................... 12.9 11.9 10.1 8.6 7.4 4.4 2.4
Thailand ................................................. 14.3 11.8 9.9 8.5 7.3 4.3 2.3
Timor-Leste............................................ 64.0 51.0 39.3 30.9 24.9 11.7 4.7
Togo....................................................... 77.4 74.7 66.4 59.7 53.8 24.4 7.3
Tonga ..................................................... 23.5 22.0 20.4 19.0 17.7 12.9 7.1
Trinidad and Tobago.............................. 28.9 26.6 24.1 22.1 20.2 12.5 6.4
Tunisia ................................................... 23.0 18.7 15.5 12.5 10.9 6.3 3.7
Turkey.................................................... 24.7 16.4 12.0 9.0 7.1 3.3 1.5
Turkmenistan ......................................... 51.8 50.5 46.7 43.3 40.2 26.7 9.9
Uganda ................................................... 79.3 66.8 57.0 50.2 44.7 23.4 11.3
Ukraine................................................... 14.8 12.6 11.7 11.1 10.6 7.6 5.3
United Arab Emirates............................. 9.2 6.9 5.7 4.9 4.3 2.4 1.3
United Kingdom..................................... 5.3 4.9 4.2 3.6 3.2 1.9 0.8
United Republic of Tanzania.................. 76.7 60.6 48.7 42.9 37.8 20.7 10.5
United Nations Department of Economic and Social Affairs/Population Division 89 World Population Prospects: The 2012 Revision, Highlights and Advance Tables
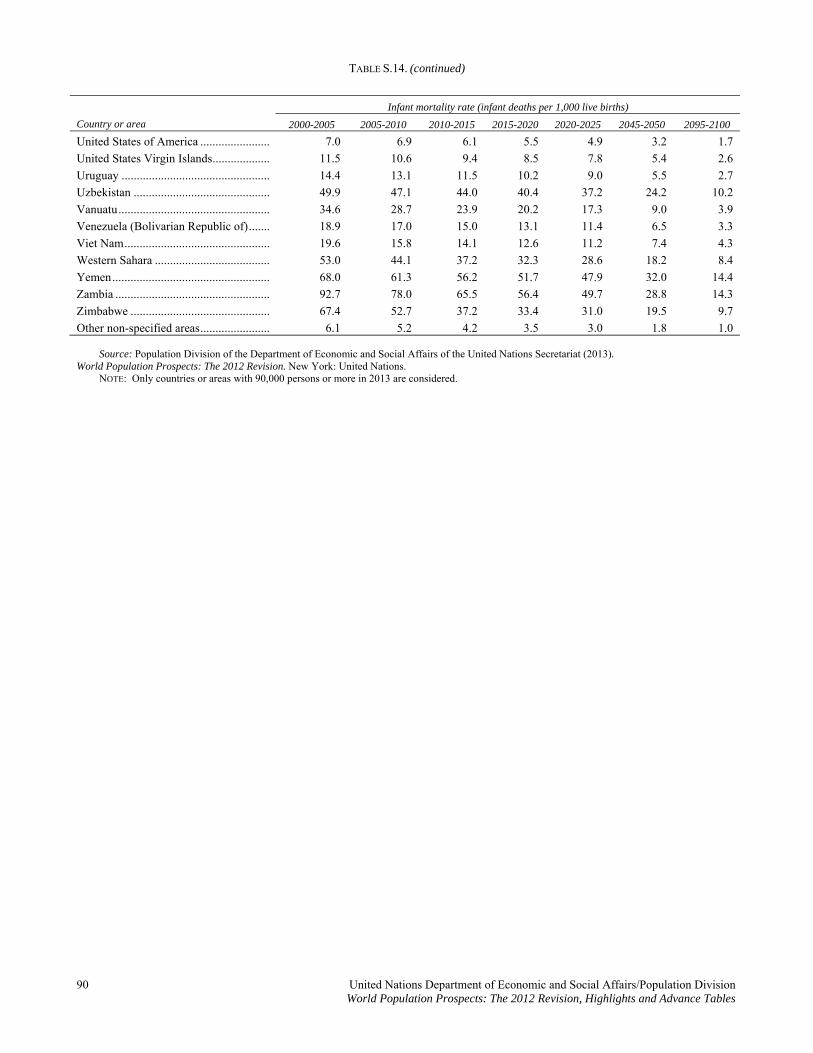
TABLE S.14. (continued)
90 United Nations Department of Economic and Social Affairs/Population Division World Population Prospects: The 2012 Revision, Highlights and Advance Tables
Infant mortality rate (infant deaths per 1,000 live births)
Country or area 2000-2005 2005-2010 2010-2015 2015-2020 2020-2025 2045-2050 2095-2100
United States of America ....................... 7.0 6.9 6.1 5.5 4.9 3.2 1.7
United States Virgin Islands................... 11.5 10.6 9.4 8.5 7.8 5.4 2.6
Uruguay ................................................. 14.4 13.1 11.5 10.2 9.0 5.5 2.7
Uzbekistan ............................................. 49.9 47.1 44.0 40.4 37.2 24.2 10.2
Vanuatu.................................................. 34.6 28.7 23.9 20.2 17.3 9.0 3.9
Venezuela (Bolivarian Republic of)....... 18.9 17.0 15.0 13.1 11.4 6.5 3.3
Viet Nam................................................ 19.6 15.8 14.1 12.6 11.2 7.4 4.3
Western Sahara ...................................... 53.0 44.1 37.2 32.3 28.6 18.2 8.4
Yemen.................................................... 68.0 61.3 56.2 51.7 47.9 32.0 14.4
Zambia ................................................... 92.7 78.0 65.5 56.4 49.7 28.8 14.3
Zimbabwe .............................................. 67.4 52.7 37.2 33.4 31.0 19.5 9.7
Other non-specified areas....................... 6.1 5.2 4.2 3.5 3.0 1.8 1.0 Source: Population Division of the Department of Economic and Social Affairs of the United Nations Secretariat (2013). World Population Prospects: The 2012 Revision. New York: United Nations. NOTE: Only countries or areas with 90,000 persons or more in 2013 are considered.
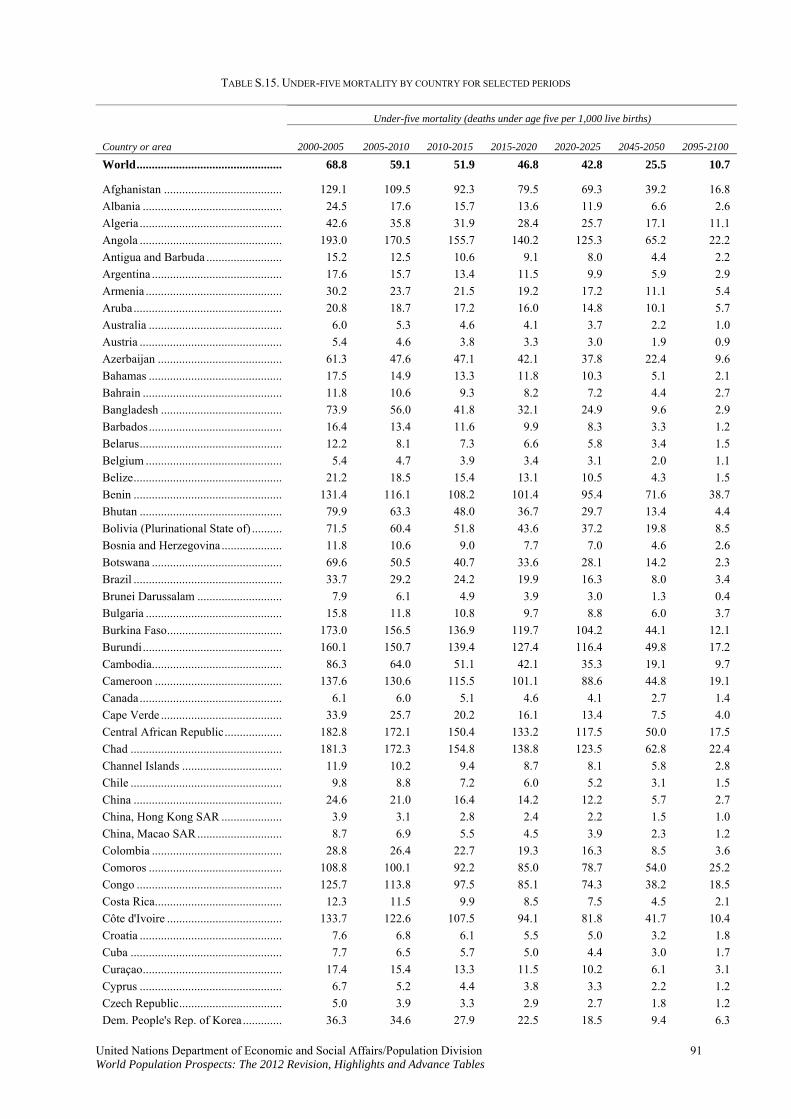
TABLE S.15. UNDER-FIVE MORTALITY BY COUNTRY FOR SELECTED PERIODS
Under-five mortality (deaths under age five per 1,000 live births)
Country or area 2000-2005 2005-2010 2010-2015 2015-2020 2020-2025 2045-2050 2095-2100
World................................................ 68.8 59.1 51.9 46.8 42.8 25.5 10.7
Afghanistan ....................................... 129.1 109.5 92.3 79.5 69.3 39.2 16.8
Albania .............................................. 24.5 17.6 15.7 13.6 11.9 6.6 2.6
Algeria ............................................... 42.6 35.8 31.9 28.4 25.7 17.1 11.1
Angola ............................................... 193.0 170.5 155.7 140.2 125.3 65.2 22.2
Antigua and Barbuda ......................... 15.2 12.5 10.6 9.1 8.0 4.4 2.2
Argentina ........................................... 17.6 15.7 13.4 11.5 9.9 5.9 2.9
Armenia ............................................. 30.2 23.7 21.5 19.2 17.2 11.1 5.4
Aruba................................................. 20.8 18.7 17.2 16.0 14.8 10.1 5.7
Australia ............................................ 6.0 5.3 4.6 4.1 3.7 2.2 1.0
Austria ............................................... 5.4 4.6 3.8 3.3 3.0 1.9 0.9
Azerbaijan ......................................... 61.3 47.6 47.1 42.1 37.8 22.4 9.6
Bahamas ............................................ 17.5 14.9 13.3 11.8 10.3 5.1 2.1
Bahrain .............................................. 11.8 10.6 9.3 8.2 7.2 4.4 2.7
Bangladesh ........................................ 73.9 56.0 41.8 32.1 24.9 9.6 2.9
Barbados............................................ 16.4 13.4 11.6 9.9 8.3 3.3 1.2
Belarus............................................... 12.2 8.1 7.3 6.6 5.8 3.4 1.5
Belgium ............................................. 5.4 4.7 3.9 3.4 3.1 2.0 1.1
Belize................................................. 21.2 18.5 15.4 13.1 10.5 4.3 1.5
Benin ................................................. 131.4 116.1 108.2 101.4 95.4 71.6 38.7
Bhutan ............................................... 79.9 63.3 48.0 36.7 29.7 13.4 4.4
Bolivia (Plurinational State of) .......... 71.5 60.4 51.8 43.6 37.2 19.8 8.5
Bosnia and Herzegovina .................... 11.8 10.6 9.0 7.7 7.0 4.6 2.6
Botswana ........................................... 69.6 50.5 40.7 33.6 28.1 14.2 2.3
Brazil ................................................. 33.7 29.2 24.2 19.9 16.3 8.0 3.4
Brunei Darussalam ............................ 7.9 6.1 4.9 3.9 3.0 1.3 0.4
Bulgaria ............................................. 15.8 11.8 10.8 9.7 8.8 6.0 3.7
Burkina Faso...................................... 173.0 156.5 136.9 119.7 104.2 44.1 12.1
Burundi.............................................. 160.1 150.7 139.4 127.4 116.4 49.8 17.2
Cambodia........................................... 86.3 64.0 51.1 42.1 35.3 19.1 9.7
Cameroon .......................................... 137.6 130.6 115.5 101.1 88.6 44.8 19.1
Canada............................................... 6.1 6.0 5.1 4.6 4.1 2.7 1.4
Cape Verde ........................................ 33.9 25.7 20.2 16.1 13.4 7.5 4.0
Central African Republic................... 182.8 172.1 150.4 133.2 117.5 50.0 17.5
Chad .................................................. 181.3 172.3 154.8 138.8 123.5 62.8 22.4
Channel Islands ................................. 11.9 10.2 9.4 8.7 8.1 5.8 2.8
Chile .................................................. 9.8 8.8 7.2 6.0 5.2 3.1 1.5
China ................................................. 24.6 21.0 16.4 14.2 12.2 5.7 2.7
China, Hong Kong SAR .................... 3.9 3.1 2.8 2.4 2.2 1.5 1.0
China, Macao SAR............................ 8.7 6.9 5.5 4.5 3.9 2.3 1.2
Colombia ........................................... 28.8 26.4 22.7 19.3 16.3 8.5 3.6
Comoros ............................................ 108.8 100.1 92.2 85.0 78.7 54.0 25.2
Congo ................................................ 125.7 113.8 97.5 85.1 74.3 38.2 18.5
Costa Rica.......................................... 12.3 11.5 9.9 8.5 7.5 4.5 2.1
Côte d'Ivoire ...................................... 133.7 122.6 107.5 94.1 81.8 41.7 10.4
Croatia ............................................... 7.6 6.8 6.1 5.5 5.0 3.2 1.8
Cuba .................................................. 7.7 6.5 5.7 5.0 4.4 3.0 1.7
Curaçao.............................................. 17.4 15.4 13.3 11.5 10.2 6.1 3.1
Cyprus ............................................... 6.7 5.2 4.4 3.8 3.3 2.2 1.2
Czech Republic.................................. 5.0 3.9 3.3 2.9 2.7 1.8 1.2
Dem. People's Rep. of Korea............. 36.3 34.6 27.9 22.5 18.5 9.4 6.3
United Nations Department of Economic and Social Affairs/Population Division 91 World Population Prospects: The 2012 Revision, Highlights and Advance Tables
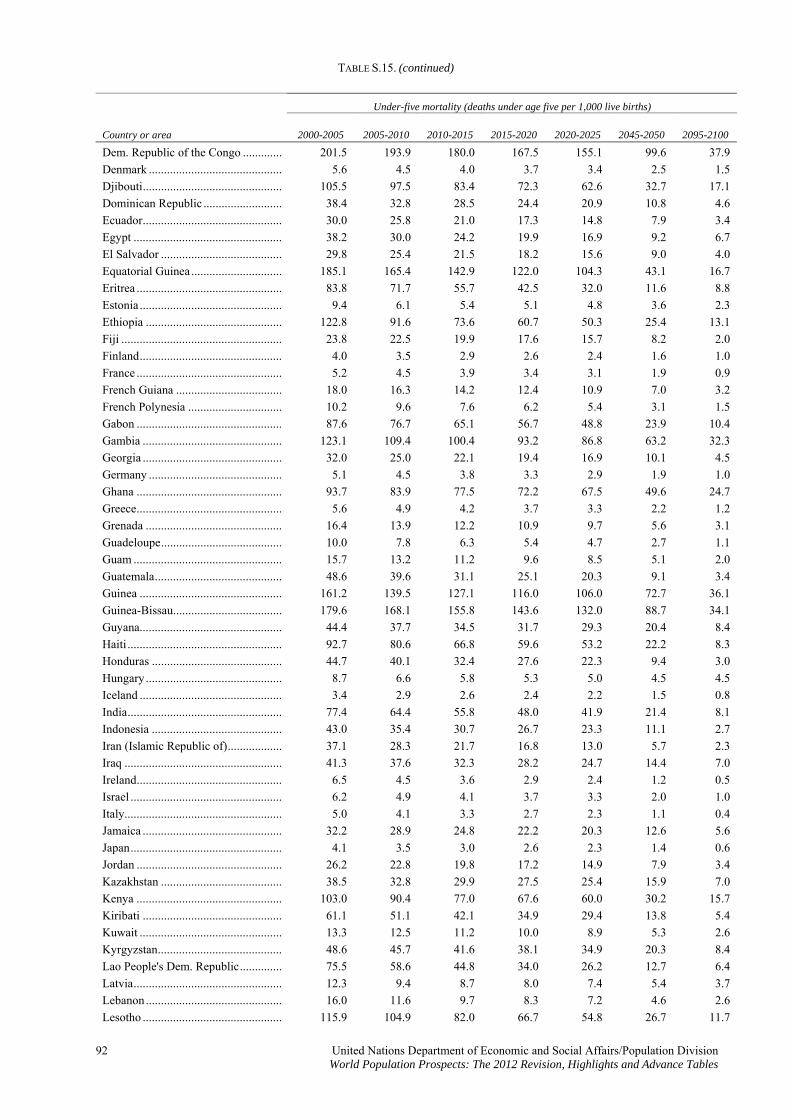
TABLE S.15. (continued)
Under-five mortality (deaths under age five per 1,000 live births)
Country or area 2000-2005 2005-2010 2010-2015 2015-2020 2020-2025 2045-2050 2095-2100
Dem. Republic of the Congo ............. 201.5 193.9 180.0 167.5 155.1 99.6 37.9
Denmark ............................................ 5.6 4.5 4.0 3.7 3.4 2.5 1.5
Djibouti.............................................. 105.5 97.5 83.4 72.3 62.6 32.7 17.1
Dominican Republic .......................... 38.4 32.8 28.5 24.4 20.9 10.8 4.6
Ecuador.............................................. 30.0 25.8 21.0 17.3 14.8 7.9 3.4
Egypt ................................................. 38.2 30.0 24.2 19.9 16.9 9.2 6.7
El Salvador ........................................ 29.8 25.4 21.5 18.2 15.6 9.0 4.0
Equatorial Guinea .............................. 185.1 165.4 142.9 122.0 104.3 43.1 16.7
Eritrea ................................................ 83.8 71.7 55.7 42.5 32.0 11.6 8.8
Estonia ............................................... 9.4 6.1 5.4 5.1 4.8 3.6 2.3
Ethiopia ............................................. 122.8 91.6 73.6 60.7 50.3 25.4 13.1
Fiji ..................................................... 23.8 22.5 19.9 17.6 15.7 8.2 2.0
Finland............................................... 4.0 3.5 2.9 2.6 2.4 1.6 1.0
France ................................................ 5.2 4.5 3.9 3.4 3.1 1.9 0.9
French Guiana ................................... 18.0 16.3 14.2 12.4 10.9 7.0 3.2
French Polynesia ............................... 10.2 9.6 7.6 6.2 5.4 3.1 1.5
Gabon ................................................ 87.6 76.7 65.1 56.7 48.8 23.9 10.4
Gambia .............................................. 123.1 109.4 100.4 93.2 86.8 63.2 32.3
Georgia .............................................. 32.0 25.0 22.1 19.4 16.9 10.1 4.5
Germany ............................................ 5.1 4.5 3.8 3.3 2.9 1.9 1.0
Ghana ................................................ 93.7 83.9 77.5 72.2 67.5 49.6 24.7
Greece................................................ 5.6 4.9 4.2 3.7 3.3 2.2 1.2
Grenada ............................................. 16.4 13.9 12.2 10.9 9.7 5.6 3.1
Guadeloupe........................................ 10.0 7.8 6.3 5.4 4.7 2.7 1.1
Guam ................................................. 15.7 13.2 11.2 9.6 8.5 5.1 2.0
Guatemala.......................................... 48.6 39.6 31.1 25.1 20.3 9.1 3.4
Guinea ............................................... 161.2 139.5 127.1 116.0 106.0 72.7 36.1
Guinea-Bissau.................................... 179.6 168.1 155.8 143.6 132.0 88.7 34.1
Guyana............................................... 44.4 37.7 34.5 31.7 29.3 20.4 8.4
Haiti ................................................... 92.7 80.6 66.8 59.6 53.2 22.2 8.3
Honduras ........................................... 44.7 40.1 32.4 27.6 22.3 9.4 3.0
Hungary ............................................. 8.7 6.6 5.8 5.3 5.0 4.5 4.5
Iceland ............................................... 3.4 2.9 2.6 2.4 2.2 1.5 0.8
India................................................... 77.4 64.4 55.8 48.0 41.9 21.4 8.1
Indonesia ........................................... 43.0 35.4 30.7 26.7 23.3 11.1 2.7
Iran (Islamic Republic of).................. 37.1 28.3 21.7 16.8 13.0 5.7 2.3
Iraq .................................................... 41.3 37.6 32.3 28.2 24.7 14.4 7.0
Ireland................................................ 6.5 4.5 3.6 2.9 2.4 1.2 0.5
Israel .................................................. 6.2 4.9 4.1 3.7 3.3 2.0 1.0
Italy.................................................... 5.0 4.1 3.3 2.7 2.3 1.1 0.4
Jamaica .............................................. 32.2 28.9 24.8 22.2 20.3 12.6 5.6
Japan.................................................. 4.1 3.5 3.0 2.6 2.3 1.4 0.6
Jordan ................................................ 26.2 22.8 19.8 17.2 14.9 7.9 3.4
Kazakhstan ........................................ 38.5 32.8 29.9 27.5 25.4 15.9 7.0
Kenya ................................................ 103.0 90.4 77.0 67.6 60.0 30.2 15.7
Kiribati .............................................. 61.1 51.1 42.1 34.9 29.4 13.8 5.4
Kuwait ............................................... 13.3 12.5 11.2 10.0 8.9 5.3 2.6
Kyrgyzstan......................................... 48.6 45.7 41.6 38.1 34.9 20.3 8.4
Lao People's Dem. Republic.............. 75.5 58.6 44.8 34.0 26.2 12.7 6.4
Latvia................................................. 12.3 9.4 8.7 8.0 7.4 5.4 3.7
Lebanon............................................. 16.0 11.6 9.7 8.3 7.2 4.6 2.6
Lesotho .............................................. 115.9 104.9 82.0 66.7 54.8 26.7 11.7
92 United Nations Department of Economic and Social Affairs/Population Division World Population Prospects: The 2012 Revision, Highlights and Advance Tables
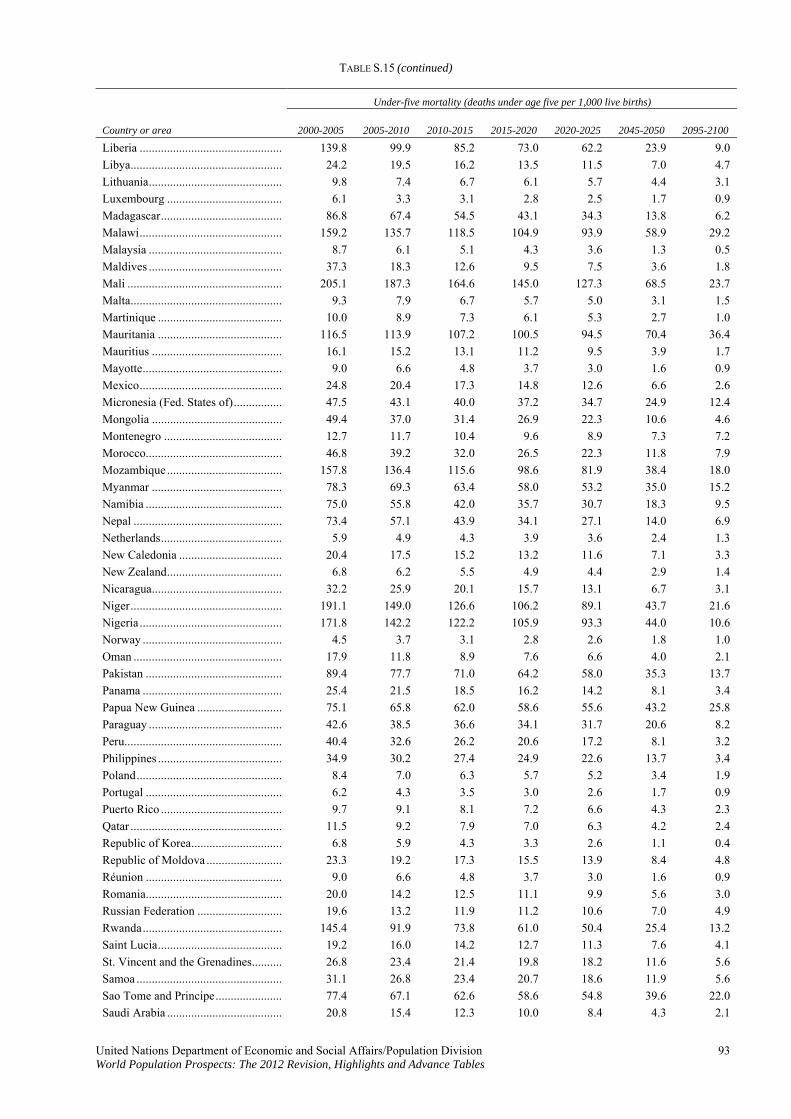
TABLE S.15 (continued)
Under-five mortality (deaths under age five per 1,000 live births)
Country or area 2000-2005 2005-2010 2010-2015 2015-2020 2020-2025 2045-2050 2095-2100
Liberia ............................................... 139.8 99.9 85.2 73.0 62.2 23.9 9.0
Libya.................................................. 24.2 19.5 16.2 13.5 11.5 7.0 4.7
Lithuania............................................ 9.8 7.4 6.7 6.1 5.7 4.4 3.1
Luxembourg ...................................... 6.1 3.3 3.1 2.8 2.5 1.7 0.9
Madagascar........................................ 86.8 67.4 54.5 43.1 34.3 13.8 6.2
Malawi............................................... 159.2 135.7 118.5 104.9 93.9 58.9 29.2
Malaysia ............................................ 8.7 6.1 5.1 4.3 3.6 1.3 0.5
Maldives ............................................ 37.3 18.3 12.6 9.5 7.5 3.6 1.8
Mali ................................................... 205.1 187.3 164.6 145.0 127.3 68.5 23.7
Malta.................................................. 9.3 7.9 6.7 5.7 5.0 3.1 1.5
Martinique ......................................... 10.0 8.9 7.3 6.1 5.3 2.7 1.0
Mauritania ......................................... 116.5 113.9 107.2 100.5 94.5 70.4 36.4
Mauritius ........................................... 16.1 15.2 13.1 11.2 9.5 3.9 1.7
Mayotte.............................................. 9.0 6.6 4.8 3.7 3.0 1.6 0.9
Mexico............................................... 24.8 20.4 17.3 14.8 12.6 6.6 2.6
Micronesia (Fed. States of)................ 47.5 43.1 40.0 37.2 34.7 24.9 12.4
Mongolia ........................................... 49.4 37.0 31.4 26.9 22.3 10.6 4.6
Montenegro ....................................... 12.7 11.7 10.4 9.6 8.9 7.3 7.2
Morocco............................................. 46.8 39.2 32.0 26.5 22.3 11.8 7.9
Mozambique ...................................... 157.8 136.4 115.6 98.6 81.9 38.4 18.0
Myanmar ........................................... 78.3 69.3 63.4 58.0 53.2 35.0 15.2
Namibia ............................................. 75.0 55.8 42.0 35.7 30.7 18.3 9.5
Nepal ................................................. 73.4 57.1 43.9 34.1 27.1 14.0 6.9
Netherlands........................................ 5.9 4.9 4.3 3.9 3.6 2.4 1.3
New Caledonia .................................. 20.4 17.5 15.2 13.2 11.6 7.1 3.3
New Zealand...................................... 6.8 6.2 5.5 4.9 4.4 2.9 1.4
Nicaragua........................................... 32.2 25.9 20.1 15.7 13.1 6.7 3.1
Niger.................................................. 191.1 149.0 126.6 106.2 89.1 43.7 21.6
Nigeria ............................................... 171.8 142.2 122.2 105.9 93.3 44.0 10.6
Norway .............................................. 4.5 3.7 3.1 2.8 2.6 1.8 1.0
Oman ................................................. 17.9 11.8 8.9 7.6 6.6 4.0 2.1
Pakistan ............................................. 89.4 77.7 71.0 64.2 58.0 35.3 13.7
Panama .............................................. 25.4 21.5 18.5 16.2 14.2 8.1 3.4
Papua New Guinea ............................ 75.1 65.8 62.0 58.6 55.6 43.2 25.8
Paraguay ............................................ 42.6 38.5 36.6 34.1 31.7 20.6 8.2
Peru.................................................... 40.4 32.6 26.2 20.6 17.2 8.1 3.2
Philippines ......................................... 34.9 30.2 27.4 24.9 22.6 13.7 3.4
Poland................................................ 8.4 7.0 6.3 5.7 5.2 3.4 1.9
Portugal ............................................. 6.2 4.3 3.5 3.0 2.6 1.7 0.9
Puerto Rico ........................................ 9.7 9.1 8.1 7.2 6.6 4.3 2.3
Qatar .................................................. 11.5 9.2 7.9 7.0 6.3 4.2 2.4
Republic of Korea.............................. 6.8 5.9 4.3 3.3 2.6 1.1 0.4
Republic of Moldova ......................... 23.3 19.2 17.3 15.5 13.9 8.4 4.8
Réunion ............................................. 9.0 6.6 4.8 3.7 3.0 1.6 0.9
Romania............................................. 20.0 14.2 12.5 11.1 9.9 5.6 3.0
Russian Federation ............................ 19.6 13.2 11.9 11.2 10.6 7.0 4.9
Rwanda.............................................. 145.4 91.9 73.8 61.0 50.4 25.4 13.2
Saint Lucia......................................... 19.2 16.0 14.2 12.7 11.3 7.6 4.1
St. Vincent and the Grenadines.......... 26.8 23.4 21.4 19.8 18.2 11.6 5.6
Samoa ................................................ 31.1 26.8 23.4 20.7 18.6 11.9 5.6
Sao Tome and Principe...................... 77.4 67.1 62.6 58.6 54.8 39.6 22.0
Saudi Arabia ...................................... 20.8 15.4 12.3 10.0 8.4 4.3 2.1
United Nations Department of Economic and Social Affairs/Population Division 93 World Population Prospects: The 2012 Revision, Highlights and Advance Tables

TABLE S.15. (continued)
94 United Nations Department of Economic and Social Affairs/Population Division World Population Prospects: The 2012 Revision, Highlights and Advance Tables
Under-five mortality (deaths under age five per 1,000 live births)
Country or area 2000-2005 2005-2010 2010-2015 2015-2020 2020-2025 2045-2050 2095-2100
Senegal .............................................. 114.1 82.1 74.9 68.9 63.7 43.5 20.7
Serbia................................................. 16.8 14.7 12.9 11.6 10.4 7.4 6.7
Seychelles.......................................... 13.4 12.7 10.2 8.4 7.3 4.7 2.8
Sierra Leone....................................... 227.7 201.8 186.6 172.3 158.0 95.8 28.5
Singapore........................................... 3.3 2.8 2.3 1.9 1.6 0.9 0.5
Slovakia ............................................. 8.9 7.6 6.6 6.0 5.7 4.9 4.8
Slovenia ............................................. 4.9 3.6 3.4 3.1 2.8 1.9 1.1
Solomon Islands ................................ 67.3 54.3 47.4 41.3 36.4 20.9 8.5
Somalia.............................................. 160.7 147.0 131.2 116.8 105.3 61.1 21.9
South Africa ...................................... 76.7 71.7 50.8 42.8 37.7 22.7 12.0
South Sudan....................................... 164.9 143.2 122.8 104.5 91.0 45.6 19.1
Spain.................................................. 5.2 4.8 4.1 3.6 3.3 2.0 1.0
Sri Lanka ........................................... 16.4 13.1 11.3 9.8 8.4 4.7 2.5
State of Palestine ............................... 28.9 25.8 23.0 20.5 18.4 12.5 6.6
Sudan................................................. 106.1 93.3 86.2 79.5 73.3 48.0 21.1
Suriname............................................ 31.9 29.5 23.2 20.2 17.6 10.3 5.2
Swaziland .......................................... 127.7 113.5 92.0 80.6 70.5 33.8 12.9
Sweden .............................................. 4.0 3.2 3.0 2.7 2.5 1.7 0.9
Switzerland........................................ 5.5 4.9 4.2 3.7 3.3 2.0 0.9
Syrian Arab Republic ........................ 20.8 17.4 20.6 16.8 13.7 6.5 2.7
Tajikistan ........................................... 82.4 72.5 73.0 66.3 60.1 36.2 14.4
TFYR Macedonia .............................. 13.6 12.5 10.7 9.1 7.8 4.8 2.7
Thailand............................................. 16.6 13.7 11.6 9.9 8.5 5.0 2.8
Timor-Leste ....................................... 87.2 66.7 49.1 37.5 29.6 13.6 5.5
Togo .................................................. 123.7 115.6 103.1 93.0 84.0 37.3 10.3
Tonga................................................. 28.2 26.3 24.4 22.6 21.0 15.3 8.4
Trinidad and Tobago ......................... 36.5 33.5 30.5 27.9 25.5 15.8 7.9
Tunisia ............................................... 25.6 20.4 17.0 13.9 12.1 7.2 4.4
Turkey ............................................... 34.1 23.0 17.6 13.3 10.6 4.8 2.0
Turkmenistan..................................... 65.9 64.3 59.5 55.2 51.2 33.8 12.3
Uganda............................................... 123.5 102.1 86.1 74.1 64.3 30.0 14.5
Ukraine .............................................. 18.1 15.1 13.9 13.2 12.7 9.2 6.3
United Arab Emirates ........................ 10.7 8.1 6.7 5.8 5.0 2.8 1.6
United Kingdom ................................ 6.3 5.7 4.9 4.2 3.7 2.2 1.0
United Republic of Tanzania ............. 118.8 91.6 72.0 61.5 52.7 26.4 13.5
United States of America................... 8.3 8.0 7.1 6.4 5.8 3.8 2.1
United States Virgin Islands .............. 13.4 12.3 10.9 9.9 9.1 6.2 3.0
Uruguay ............................................. 17.3 15.9 14.1 12.5 11.1 6.8 3.2
Uzbekistan ......................................... 60.0 57.0 53.3 49.0 45.1 29.4 12.3
Vanuatu ............................................. 42.5 34.6 28.4 23.7 20.2 10.5 4.5
Venezuela (Bolivarian Republic of) .. 24.3 21.9 19.4 16.9 14.7 8.5 4.2
Viet Nam ........................................... 25.0 22.8 20.4 18.3 16.3 10.6 5.8
Western Sahara.................................. 69.8 56.1 46.1 39.4 34.5 21.4 9.8
Yemen ............................................... 93.7 83.2 76.3 70.2 64.9 42.8 18.2
Zambia............................................... 143.6 121.6 101.8 85.0 73.6 38.0 18.1
Zimbabwe.......................................... 96.7 75.9 52.8 45.7 41.6 25.2 12.6
Other non-specified areas .................. 7.8 6.5 5.3 4.3 3.7 2.2 1.2
Source: Population Division of the Department of Economic and Social Affairs of the United Nations Secretariat (2013). World Population Prospects: The 2012 Revision. New York: United Nations NOTE: Only countries or areas with 90,000 persons or more in 2013 are considered.