Embed Size (px)
Citation preview
05 World Retail Banking Report

1 Preface
2 Summary of Major Findings
3 Pricing Indexes 2005
13 Increasing Share of Wallet from High-Potential Clients in Mature Markets
24 Appendix: Pricing Methodology
29 About Us
Contents
©2005 Capgemini. All rights reserved.
The global retail banking market changes constantly. Capgemini, ING, and the European Financial Management & Marketing Association (EFMA)
have for the second year studied this market—particularly its pricing structure—and produced this second annual World Retail Banking Report.
Its goal is to provide people in financial services around the world with a clearer view of the dynamics of today’s retail banking industry.
Each report presents a yearly index of prices of basic banking services across national markets, and highlights a major retail banking trend. The
international pricing indexes are restricted to day-to-day banking products and services, and do not represent an all-encompassing benchmark of
retail banking prices. Dashboards reviewing the national banking environment of each country surveyed are available online at www.efma.com.
We have expanded the scope of this year’s survey, increasing the number of countries from eleven to nineteen. We have also raised the number of
banks surveyed from seventy-four to a hundred thirty, to include not only Western Europe and North America, but also reach into Eastern Europe
and the Far East. For comparability purposes, we have maintained last year’s single global index. However, we have added a local profile that allows us
to examine prices through a more locally focused lens.
Both profiles consider a common set of products and services, but the new local profile improves our view of each market. The global profile applies
the same consumption pattern to all countries (e.g., an average consumer in any country is assumed to have one credit card). In contrast, the local
profile pricing index is based on a typical local customer’s use of products and services in each country (e.g., the actual number of credit cards per
customer is approximated).
Our spotlight this year focuses on a tough challenge retail banks face in mature banking markets: How can they increase their share of wallet from
high-potential, mass-affluent customers? Based on interviews with banking executives across our survey locations, we found that most institutions
are attempting to establish or refresh a relationship approach with these clients. Their objective is to meet customers’ needs more effectively and
increase the perceived value of the banks’ services and retail solutions.
However, we found that very few financial institutions have set up a fully structured approach to a client-advisor relationship, or attempted to align
the critical elements required to produce results, such as understanding and segmenting customers, product and service offerings, organization
structure, ways of working as advisors, IT and tools, and performance management. Several key success factors in a performing relationship
approach are highlighted in the spotlight section.
We are delighted to publish this second annual report, which we hope will stimulate discussion and help retail banks develop more effective growth
strategies and better serve their customers around the world.
Preface
Bertrand LavayssièreManaging Director
Global Financial Services
Capgemini
Hans VerkorenMember of the Executive Board of ING Group,
Global Head ING Direct and ING Cards
ING Group
Patrick DesmarèsSecretary General
European Financial Management
& Marketing Association
SUMMARY OF MAJOR FINDINGS
1 Based on this year’s local pricing index, the average price of basic banking services was €78,with prices between countries ranging from €25 to €137, a 1-to-5.5 range.
2 Like last year, global profile prices varied significantly between countries, ranging from €34 to€252, a 1-to-7.4 range, with an average price of €108.
3 Changes in global profile prices within countries ranged from -6% to +16%.
4 The average price in North America declined, with a 6% decrease in the United States and a1% decrease in Canada.
5 Within the five major Euro zone markets, the average price increased by 3% and moved slightlycloser to convergence. Initiatives such as the Single Euro Payments Area (SEPA) should moveEuro zone banks’ prices ever closer to one another in the medium term.
6 Banks charged fees for more products and services this year, due primarily to added countries;banks in developing and in transitioning economies (e.g., Eastern Europe and China) charge for more products and services than do banks in mature markets.
7 The local profile revealed that frequency-of-use patterns for particular products vary significantlyby country, most notably in means of payment (checks vs. cards vs. transfers).
8 To maximize efficiency, many banks are using pricing to convince consumers to use certainproducts and services and not use others.
9 In some countries, day-to-day banking is a promotional product aimed at client acquisition, with other products (such as lending, savings, or insurance) expected to generate profits.
10 Banking services cost more in less-mature banking markets, representing 2.1% of GDP inPoland and 3.3% in China, against only 0.2% to 0.6% in more mature markets. Banking services apparently follow the standard industrial development pattern in which relative prices go down with maturity.
Findings
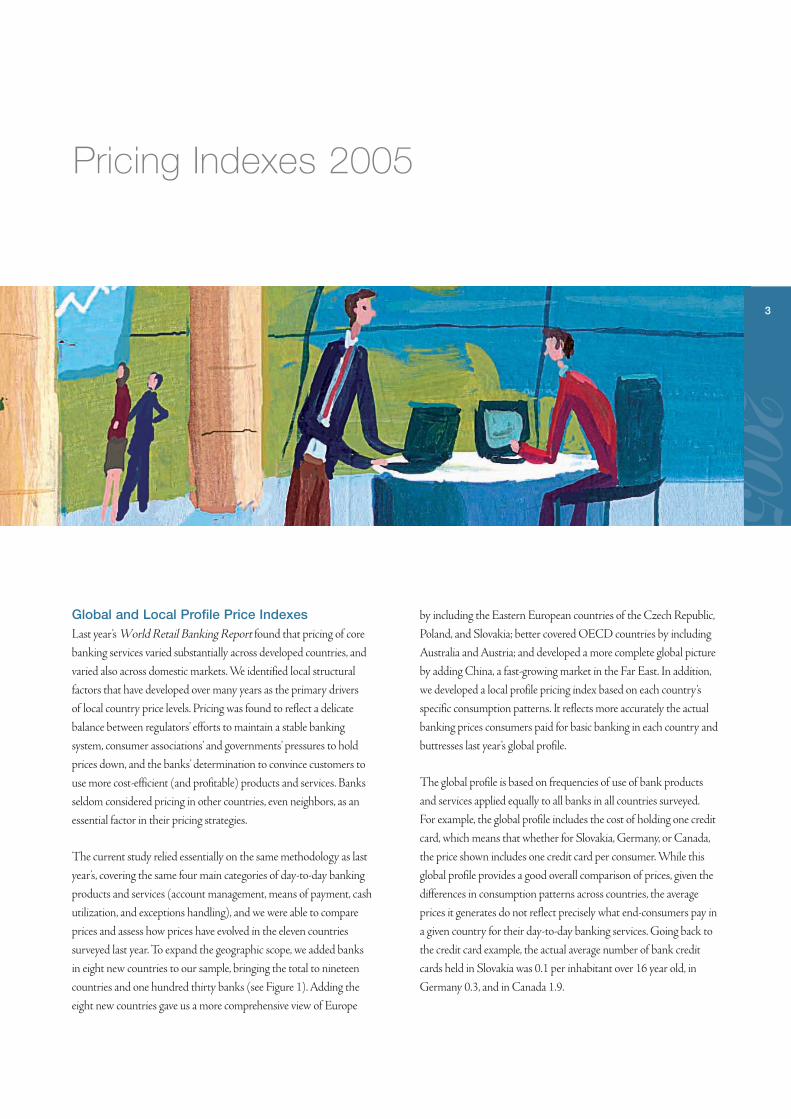
Global and Local Profile Price IndexesLast year’s World Retail Banking Report found that pricing of core
banking services varied substantially across developed countries, and
varied also across domestic markets. We identified local structural
factors that have developed over many years as the primary drivers
of local country price levels. Pricing was found to reflect a delicate
balance between regulators’ efforts to maintain a stable banking
system, consumer associations’ and governments’ pressures to hold
prices down, and the banks’ determination to convince customers to
use more cost-efficient (and profitable) products and services. Banks
seldom considered pricing in other countries, even neighbors, as an
essential factor in their pricing strategies.
The current study relied essentially on the same methodology as last
year’s, covering the same four main categories of day-to-day banking
products and services (account management, means of payment, cash
utilization, and exceptions handling), and we were able to compare
prices and assess how prices have evolved in the eleven countries
surveyed last year. To expand the geographic scope, we added banks
in eight new countries to our sample, bringing the total to nineteen
countries and one hundred thirty banks (see Figure 1). Adding the
eight new countries gave us a more comprehensive view of Europe
by including the Eastern European countries of the Czech Republic,
Poland, and Slovakia; better covered OECD countries by including
Australia and Austria; and developed a more complete global picture
by adding China, a fast-growing market in the Far East. In addition,
we developed a local profile pricing index based on each country’s
specific consumption patterns. It reflects more accurately the actual
banking prices consumers paid for basic banking in each country and
buttresses last year’s global profile.
The global profile is based on frequencies of use of bank products
and services applied equally to all banks in all countries surveyed.
For example, the global profile includes the cost of holding one credit
card, which means that whether for Slovakia, Germany, or Canada,
the price shown includes one credit card per consumer. While this
global profile provides a good overall comparison of prices, given the
differences in consumption patterns across countries, the average
prices it generates do not reflect precisely what end-consumers pay in
a given country for their day-to-day banking services. Going back to
the credit card example, the actual average number of bank credit
cards held in Slovakia was 0.1 per inhabitant over 16 year old, in
Germany 0.3, and in Canada 1.9.
Pricing Indexes 2005
2005
3
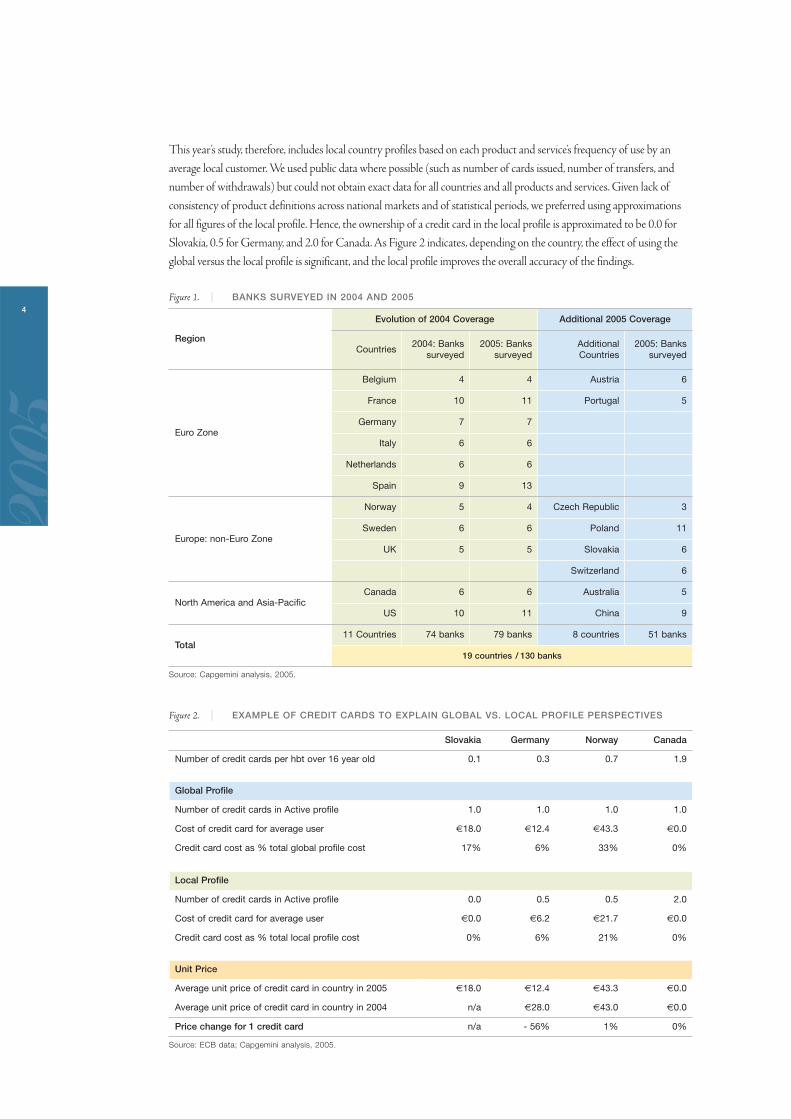
This year’s study, therefore, includes local country profiles based on each product and service’s frequency of use by an
average local customer. We used public data where possible (such as number of cards issued, number of transfers, and
number of withdrawals) but could not obtain exact data for all countries and all products and services. Given lack of
consistency of product definitions across national markets and of statistical periods, we preferred using approximations
for all figures of the local profile. Hence, the ownership of a credit card in the local profile is approximated to be 0.0 for
Slovakia, 0.5 for Germany, and 2.0 for Canada. As Figure 2 indicates, depending on the country, the effect of using the
global versus the local profile is significant, and the local profile improves the overall accuracy of the findings.
Figure 1. | BANKS SURVEYED IN 2004 AND 2005
Source: Capgemini analysis, 2005.
Figure 2. | EXAMPLE OF CREDIT CARDS TO EXPLAIN GLOBAL VS. LOCAL PROFILE PERSPECTIVES
Source: ECB data; Capgemini analysis, 2005.
Slovakia Germany Norway Canada
Number of credit cards per hbt over 16 year old 0.1 0.3 0.7 1.9
Global Profile
Number of credit cards in Active profile 1.0 1.0 1.0 1.0
Cost of credit card for average user €18.0 €12.4 €43.3 €0.0
Credit card cost as % total global profile cost 17% 6% 33% 0%
Local Profile
Number of credit cards in Active profile 0.0 0.5 0.5 2.0
Cost of credit card for average user €0.0 €6.2 €21.7 €0.0
Credit card cost as % total local profile cost 0% 6% 21% 0%
Unit Price
Average unit price of credit card in country in 2005 €18.0 €12.4 €43.3 €0.0
Average unit price of credit card in country in 2004 n/a €28.0 €43.0 €0.0
Price change for 1 credit card n/a - 56% 1% 0%
Region
Evolution of 2004 Coverage Additional 2005 Coverage
Countries2004: Banks
surveyed2005: Banks
surveyedAdditionalCountries
2005: Banks surveyed
Euro Zone
Belgium 4 4 Austria 6
France 10 11 Portugal 5
Germany 7 7
Italy 6 6
Netherlands 6 6
Spain 9 13
Europe: non-Euro Zone
Norway 5 4 Czech Republic 3
Sweden 6 6 Poland 11
UK 5 5 Slovakia 6
Switzerland 6
North America and Asia-PacificCanada 6 6 Australia 5
US 10 11 China 9
Total11 Countries 74 banks 79 banks 8 countries 51 banks
19 countries / 130 banks
2005
4
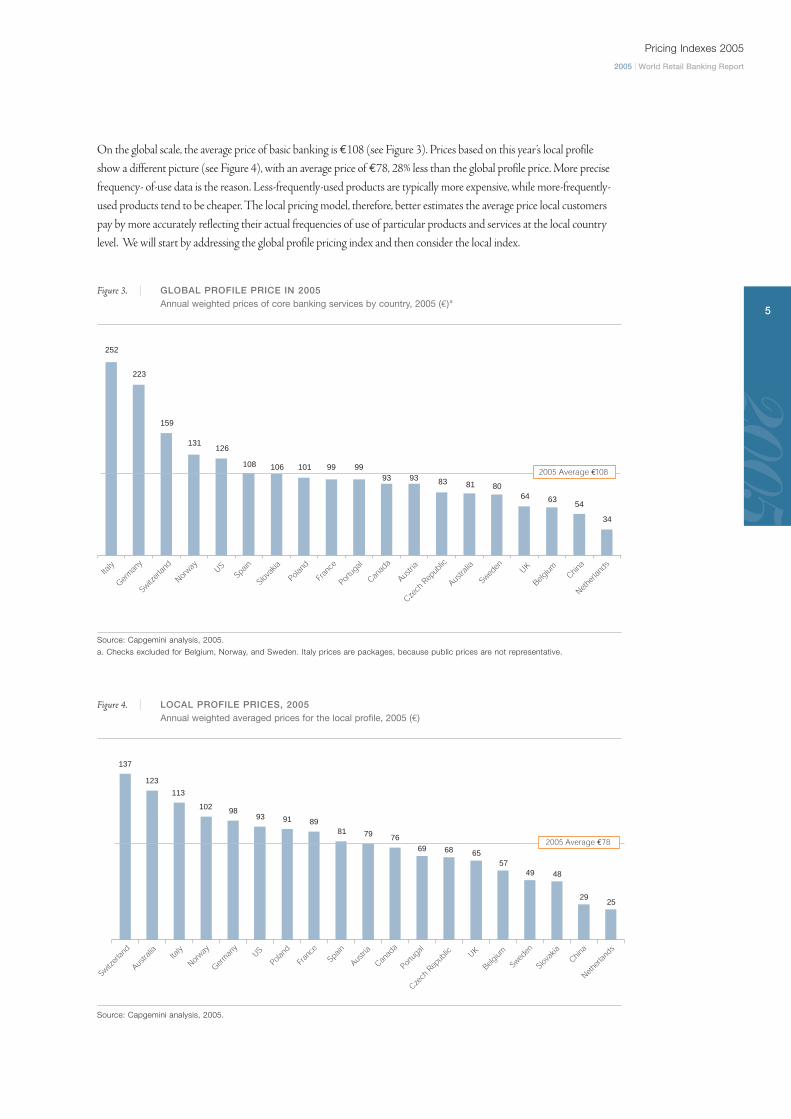
On the global scale, the average price of basic banking is €108 (see Figure 3). Prices based on this year’s local profile
show a different picture (see Figure 4), with an average price of €78, 28% less than the global profile price. More precise
frequency- of-use data is the reason. Less-frequently-used products are typically more expensive, while more-frequently-
used products tend to be cheaper. The local pricing model, therefore, better estimates the average price local customers
pay by more accurately reflecting their actual frequencies of use of particular products and services at the local country
level. We will start by addressing the global profile pricing index and then consider the local index.
Figure 3. | GLOBAL PROFILE PRICE IN 2005Annual weighted prices of core banking services by country, 2005 (€)a
Source: Capgemini analysis, 2005.
a. Checks excluded for Belgium, Norway, and Sweden. Italy prices are packages, because public prices are not representative.
Figure 4. | LOCAL PROFILE PRICES, 2005Annual weighted averaged prices for the local profile, 2005 (€)
Source: Capgemini analysis, 2005.
Italy
Norway
SwedenUS
Spain
Canad
a
Fran
ce
Czech
Rep
ublic
BelgiumUK
Nether
lands
German
y
Switzer
land
Slovak
ia
Portug
al
Austria
Poland
Austra
liaChin
a
2005 Average €78
137
123
113
102 9893 91 89
81 79 7669 68 65
5749 48
2925
Italy
Norway
SwedenUS
Spain
Canad
a
Fran
ce
Czech
Rep
ublic
BelgiumUK
Nether
lands
German
y
Switzer
land
Slovak
ia
Portug
al
Austria
Poland
Austra
liaChin
a
2005 Average €108
34
546364
80818393939999101106108
126131
159
223
252 2005
5
Pricing Indexes 2005
2005 | World Retail Banking Report
Global ProfileLike last year, average prices by country in the global profile (see Figure 3) varied significantly between countries, ranging
from €34 in the Netherlands to Italy’s €252. Most countries ranged from €80 to €159 if we omit the extreme ends of
the spectrum. At the high end, Italy and Germany’s prices were above €200, while on the lower end of the spectrum, the
UK, Belgium, China, and the Netherlands had prices of €64 and below.
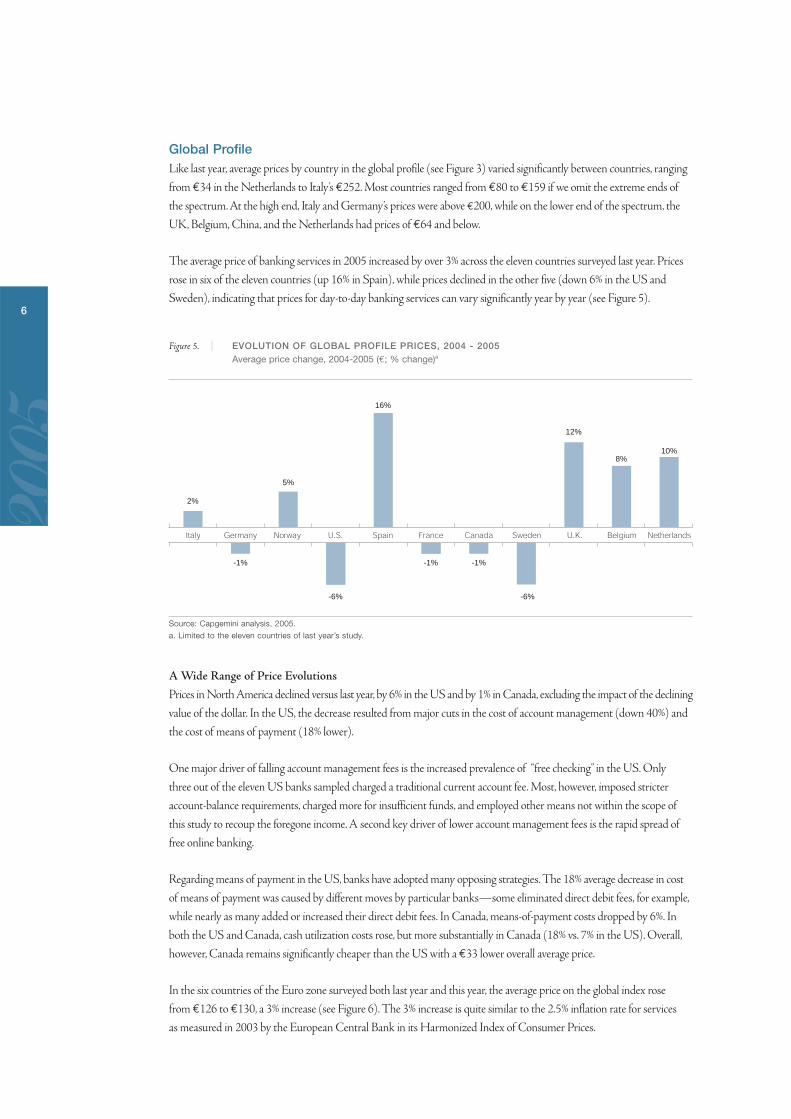
The average price of banking services in 2005 increased by over 3% across the eleven countries surveyed last year. Prices
rose in six of the eleven countries (up 16% in Spain), while prices declined in the other five (down 6% in the US and
Sweden), indicating that prices for day-to-day banking services can vary significantly year by year (see Figure 5).
Figure 5. | EVOLUTION OF GLOBAL PROFILE PRICES, 2004 - 2005Average price change, 2004-2005 (€; % change)a
Source: Capgemini analysis, 2005.
a. Limited to the eleven countries of last year’s study.
A Wide Range of Price Evolutions
Prices in North America declined versus last year, by 6% in the US and by 1% in Canada, excluding the impact of the declining
value of the dollar. In the US, the decrease resulted from major cuts in the cost of account management (down 40%) and
the cost of means of payment (18% lower).
One major driver of falling account management fees is the increased prevalence of “free checking” in the US. Only
three out of the eleven US banks sampled charged a traditional current account fee. Most, however, imposed stricter
account-balance requirements, charged more for insufficient funds, and employed other means not within the scope of
this study to recoup the foregone income. A second key driver of lower account management fees is the rapid spread of
free online banking.
Regarding means of payment in the US, banks have adopted many opposing strategies. The 18% average decrease in cost
of means of payment was caused by different moves by particular banks—some eliminated direct debit fees, for example,
while nearly as many added or increased their direct debit fees. In Canada, means-of-payment costs dropped by 6%. In
both the US and Canada, cash utilization costs rose, but more substantially in Canada (18% vs. 7% in the US). Overall,
however, Canada remains significantly cheaper than the US with a €33 lower overall average price.
In the six countries of the Euro zone surveyed both last year and this year, the average price on the global index rose
from €126 to €130, a 3% increase (see Figure 6). The 3% increase is quite similar to the 2.5% inflation rate for services
as measured in 2003 by the European Central Bank in its Harmonized Index of Consumer Prices.
Italy Germany Norway U.S. Spain France Canada Sweden U.K. Belgium Netherlands
-1%
2%
5%
16%
-1% -1%
-6%
8%10%
12%
-6%
2005
6
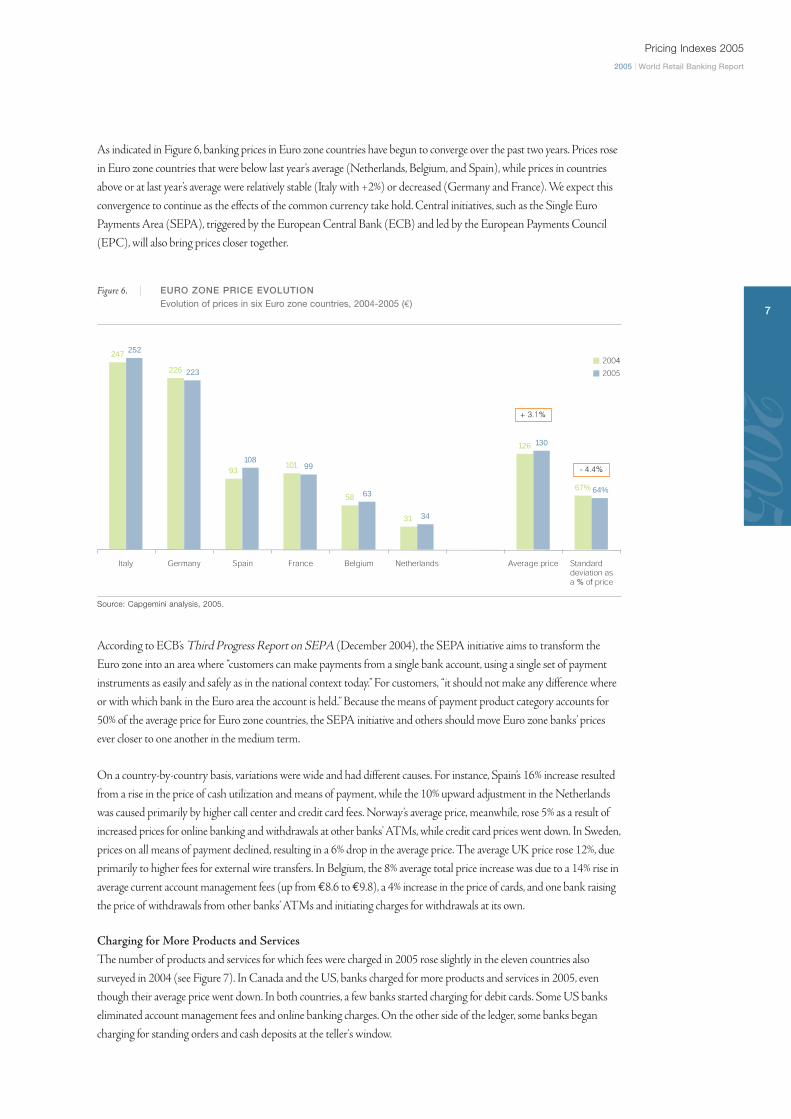
As indicated in Figure 6, banking prices in Euro zone countries have begun to converge over the past two years. Prices rose
in Euro zone countries that were below last year’s average (Netherlands, Belgium, and Spain), while prices in countries
above or at last year’s average were relatively stable (Italy with +2%) or decreased (Germany and France). We expect this
convergence to continue as the effects of the common currency take hold. Central initiatives, such as the Single Euro
Payments Area (SEPA), triggered by the European Central Bank (ECB) and led by the European Payments Council
(EPC), will also bring prices closer together.
Figure 6. | EURO ZONE PRICE EVOLUTIONEvolution of prices in six Euro zone countries, 2004-2005 (€)
Source: Capgemini analysis, 2005.
According to ECB’s Third Progress Report on SEPA (December 2004), the SEPA initiative aims to transform the
Euro zone into an area where “customers can make payments from a single bank account, using a single set of payment
instruments as easily and safely as in the national context today.” For customers, “it should not make any difference where
or with which bank in the Euro area the account is held.” Because the means of payment product category accounts for
50% of the average price for Euro zone countries, the SEPA initiative and others should move Euro zone banks’ prices
ever closer to one another in the medium term.
On a country-by-country basis, variations were wide and had different causes. For instance, Spain’s 16% increase resulted
from a rise in the price of cash utilization and means of payment, while the 10% upward adjustment in the Netherlands
was caused primarily by higher call center and credit card fees. Norway’s average price, meanwhile, rose 5% as a result of
increased prices for online banking and withdrawals at other banks’ ATMs, while credit card prices went down. In Sweden,
prices on all means of payment declined, resulting in a 6% drop in the average price. The average UK price rose 12%, due
primarily to higher fees for external wire transfers. In Belgium, the 8% average total price increase was due to a 14% rise in
average current account management fees (up from €8.6 to €9.8), a 4% increase in the price of cards, and one bank raising
the price of withdrawals from other banks’ ATMs and initiating charges for withdrawals at its own.
Charging for More Products and Services
The number of products and services for which fees were charged in 2005 rose slightly in the eleven countries also
surveyed in 2004 (see Figure 7). In Canada and the US, banks charged for more products and services in 2005, even
though their average price went down. In both countries, a few banks started charging for debit cards. Some US banks
eliminated account management fees and online banking charges. On the other side of the ledger, some banks began
charging for standing orders and cash deposits at the teller's window.
Italy Germany Spain France Belgium Netherlands Average price Standard deviation as a % of price
247
226
93101
58
31
126
252
223
10899
63
34
130
67% 64%
+ 3.1%
- 4.4%
� 2004
� 2005 2005
7
Pricing Indexes 2005
2005 | World Retail Banking Report
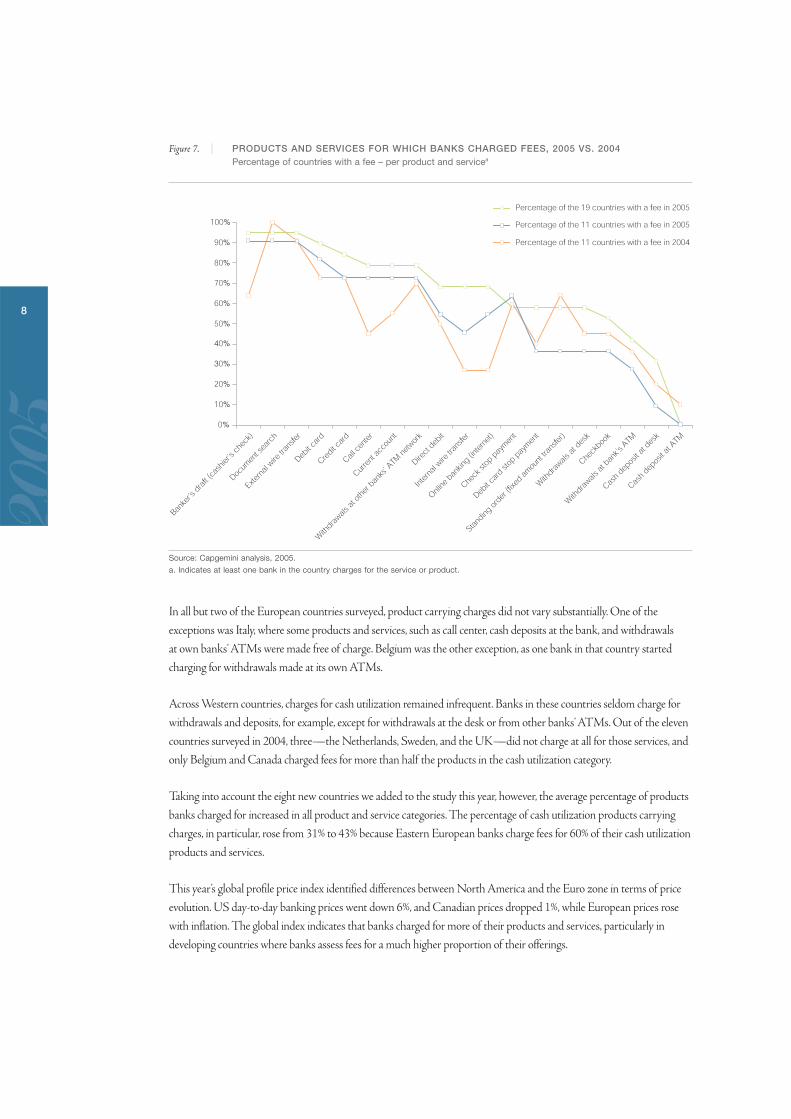
Figure 7. | PRODUCTS AND SERVICES FOR WHICH BANKS CHARGED FEES, 2005 VS. 2004Percentage of countries with a fee – per product and servicea
Source: Capgemini analysis, 2005.
a. Indicates at least one bank in the country charges for the service or product.
In all but two of the European countries surveyed, product carrying charges did not vary substantially. One of the
exceptions was Italy, where some products and services, such as call center, cash deposits at the bank, and withdrawals
at own banks’ ATMs were made free of charge. Belgium was the other exception, as one bank in that country started
charging for withdrawals made at its own ATMs.
Across Western countries, charges for cash utilization remained infrequent. Banks in these countries seldom charge for
withdrawals and deposits, for example, except for withdrawals at the desk or from other banks’ ATMs. Out of the eleven
countries surveyed in 2004, three—the Netherlands, Sweden, and the UK—did not charge at all for those services, and
only Belgium and Canada charged fees for more than half the products in the cash utilization category.
Taking into account the eight new countries we added to the study this year, however, the average percentage of products
banks charged for increased in all product and service categories. The percentage of cash utilization products carrying
charges, in particular, rose from 31% to 43% because Eastern European banks charge fees for 60% of their cash utilization
products and services.
This year’s global profile price index identified differences between North America and the Euro zone in terms of price
evolution. US day-to-day banking prices went down 6%, and Canadian prices dropped 1%, while European prices rose
with inflation. The global index indicates that banks charged for more of their products and services, particularly in
developing countries where banks assess fees for a much higher proportion of their offerings.
0%
10%
20%
30%
40%
50%
60%
70%
80%
90%
100%
Banke
r's d
raft (
cash
ier's
chec
k)
Debit c
ard
With
drawals
at d
esk
Credit c
ard
Call ce
nter
Online
ban
king (in
terne
t)
Direct
debit
Debit c
ard st
op p
aymen
t
With
drawals
at b
ank's
ATM
Check
book
Cash d
epos
it at d
esk
Docum
ent s
earc
h
Extern
al wire
tran
sfer
Curre
nt ac
coun
t
Inter
nal w
ire tr
ansfe
r
Check
stop
pay
ment
With
drawals
at ot
her b
anks
' ATM
netw
ork
Standing
order
(fixe
d amou
nt tra
nsfer
)
Cash d
epos
it at A
TM
Percentage of the 19 countries with a fee in 2005
Percentage of the 11 countries with a fee in 2005
Percentage of the 11 countries with a fee in 2004
2005
8
Local ProfileThe local profile we added this year to last year’s global view has several advantages. For each country surveyed, we estimated
local consumption patterns by establishing an average frequency of use for each product and service included in the
pricing index. The local index enables a more realistic view of what customers really pay banks for their day-to-day services.
Differences in usage and customs
Usage and customs vary substantially from one country to another. Usage patterns often result from historic factors and
are slow-moving trends, but over time similar products and services become popular around the globe. As a product gains
global acceptance, a country’s lower level of development can sometimes explain its lower frequency of use of that product,
a good example being credit and debit cards.
The US and Canada are the biggest consumers of cards, especially credit cards, with approximately 2 per inhabitant
over sixteen years old. Card usage in the Euro zone countries is lower than in the US; except for Italy, however, it is still
a widespread product there, with approximately 1 debit card and 0.5 credit cards per inhabitant over sixteen. In Italy,
possession of a card is half as frequent as elsewhere in the Euro zone. In the fast-developing countries of Eastern Europe
(Poland, Slovakia, and the Czech Republic), retail banking customers use half the number of debit cards and substantially
fewer credit cards—under 0.1 per inhabitant over 16, against the Euro zone’s 0.5.
Check usage is influenced by such local factors as legal obligations to use checks for certain transactions, local habits, the
cost of transfers as an alternative, and the investments that banks have sunk to reduce check-processing costs (which
lessen their incentive to push check usage down). We found a wide frequency-of-use range, from 70 checks per year per
US individual over sixteen years of age to less than 0.4 per year in the Netherlands, Belgium, Sweden, Norway, and the
less-mature markets studied. The main users of checks were customers in the US, Canada, Australia, the UK, France,
and Portugal. In other European countries surveyed, customers used fewer than ten checks per year.
In some countries, such as Germany, Switzerland, and Austria, consumers used credit transfers, direct debits, and standing
orders instead of checks. Consumers in Poland, Slovakia, and the Czech Republic took the same route, indicating the
influence of Germany and Austria on the Eastern European banking environment.
Self-service channels, such as online and call center banking, however, are being adopted in less-developed countries.
In Slovakia and the Czech Republic, for instance, consumers used more online banking than in most other European
countries. Banks in some less-developed countries were apparently adopting these new technologies, avoiding the cost
of infrastructure build-up, and “leap-frogging” more developed countries that have large branch networks. In China,
our research found that retail banking services are low-profit activities today, and banks there are trying to convince
their clients to use self-service channels from the start.
Pricing affects customer behavior
Banks use pricing to persuade their clients to select certain products and services rather than others. A good example
is check usage, which is broadly on the decline. European Central Bank statistics in the Euro zone countries indicate
that checks represented 22% of all transactions in 1998, and the number was down to 16% by 2002. That decline was
exceptionally strong in Belgium, where check use represented over 7% of all transactions in 1998 and had dropped to
below 1% by 2005. Continuous increases in price, along with the suppression of the Eurocheques warranty and the
promotion of alternatives, are responsible—in 2004 alone, the average price per check in Belgium went up by 60%.
Banks in many countries were encouraging consumers to use ATMs, particularly their own. To promote their ATM
systems, French banks have progressively charged more for transactions at the cashier’s window and for withdrawals
from other banks’ ATMs. Withdrawal frequency at other banks’ ATMs was higher in countries where no charges were
2005
9
Pricing Indexes 2005
2005 | World Retail Banking Report
applied—for example, in Austria, Sweden, and the UK. In France, Norway, and Spain, banks were attempting to
influence customer behavior by increasing charges for withdrawing money from other banks’ ATMs. Banks in
less-mature economies, such as Slovakia, the Czech Republic, Poland, and China, were adopting a similar strategy
by charging customers for making withdrawals from other banks’ ATMs.
Charging for products and services
The number of products and services banks charge for has little to do with the total price paid by customers. Austrian
banks, for instance, charged their clients for 18 out of the 19 products and services in our survey, while Italy charged for
only 13, yet Italy was 30% more expensive than Austria based on the local profile. Similarly, banks in China and Eastern
Europe (Poland, Slovakia, and the Czech Republic) typically charged for more products and services than other countries
did, yet the total price customers paid was often lower. In those lower income countries the total price paid by customers
was spread across all products, whereas in more mature markets, the price was concentrated on just a few. This reflects
both different regulatory histories and marketing strategies. In some Western countries, such as the UK and the US,
many banks promoted certain products (such as checking) as free in order to attract customers, but in less-developed
economies with faster growing markets, banks seldom used this strategy.
Local price comparison
When considering prices based on local consumption patterns, the average price was €78, 28% lower than the global
price. The price range was also smaller, from €25 a year for China to €137 for Switzerland, a ratio of 1-to-5.5 instead
of the global price index’s 1-to-7.4 (see figures 3 and 4).
The ranking between countries is also quite different. Whereas Italy and Germany were the two most expensive
countries in the global profile, in the local profile, Switzerland and Australia had higher prices than Italy for day-to-day
banking services. At the lower end of the spectrum, Belgium, the Netherlands, and China had the lowest local profile
prices, just as they did in the global profile.
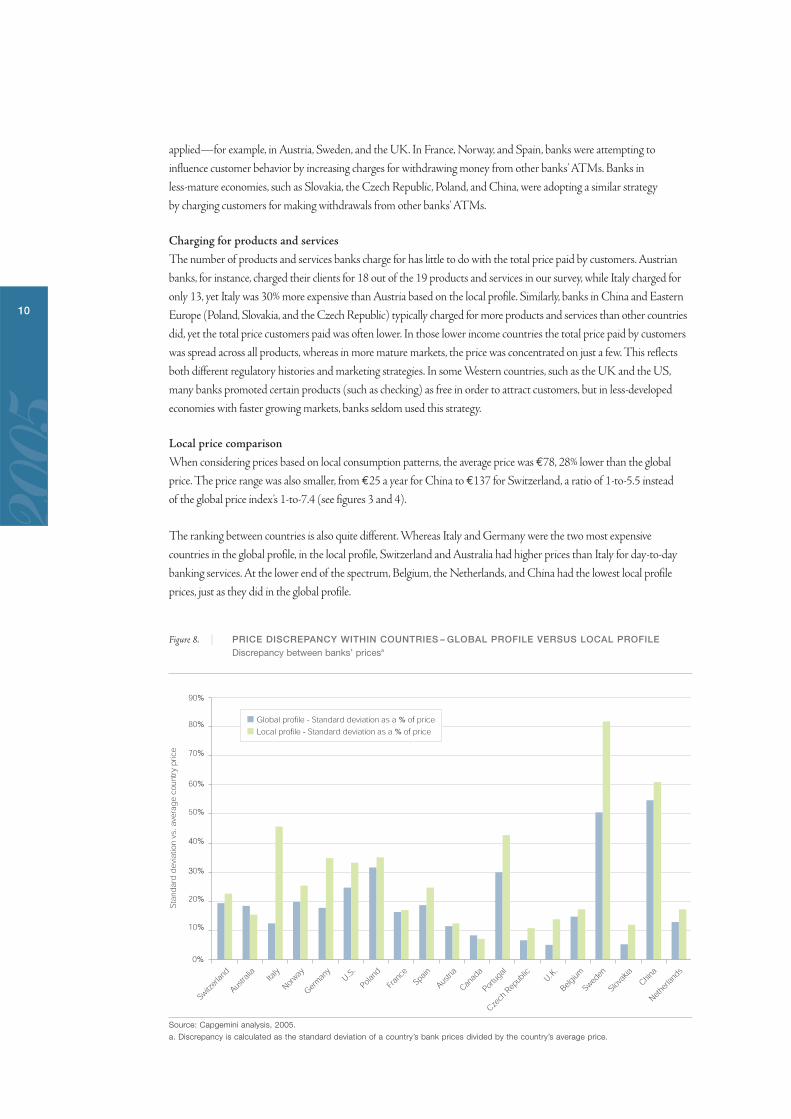
Figure 8. | PRICE DISCREPANCY WITHIN COUNTRIES – GLOBAL PROFILE VERSUS LOCAL PROFILEDiscrepancy between banks’ pricesa
Source: Capgemini analysis, 2005.
a. Discrepancy is calculated as the standard deviation of a country’s bank prices divided by the country’s average price.
0%
10%
20%
30%
40%
50%
60%
70%
80%
90%
Switzer
land
Norway
Belgium
German
yU.S
.
Canad
aSpain
Czech
Rep
ublic
Slovak
ia
Sweden
China
Austra
lia Italy
Poland
Austria
Portug
al
Fran
ce U.K.
Nether
lands
Sta
ndar
d d
evia
tion
vs. a
vera
ge
coun
try
pric
e
� Global profile - Standard deviation as a % of price
� Local profile - Standard deviation as a % of price
2005
10
Pricing depends on comparability
Discrepancy between banks’ prices within a country were significantly higher in the local profile, at 22%, versus 15% for the
global profile, which held true for all countries except Australia and Canada (see Figure 8). This indicates, counterintuitively,
that price differentiation between banks results from a wide range of fees charged for the most frequently used products
and services in a given country. Simple logic suggests that banks would try to compete more actively on those products
by matching competitors’ prices, but the data suggests the opposite is true.
Frequently used products and services come in two varieties: those that customers can easily compare on price and those
they cannot. For products that are difficult to compare, including those less advertised (such as account management or
cash utilization), customers are not aware of the actual price they pay. The discrepancy in pricing of these products
between banks is typically the highest.
For directly comparable products, or for which the price is more often advertised (such as debit or credit card charges),
prices tend to be closer. We found this to be the case for debit cards in twelve of the nineteen countries surveyed, and for
credit cards in fourteen of the nineteen. The obvious reason is that customers can readily make price comparisons, so
banks tend to react strongly to competitive pricing moves by other banks. In Portugal, for example, where the discrepancy
between prices for account management exceeded 86%, and a massive 260% for cash utilization, the discrepancy on debit
cards was 12%, and on credit cards, less than 40%.
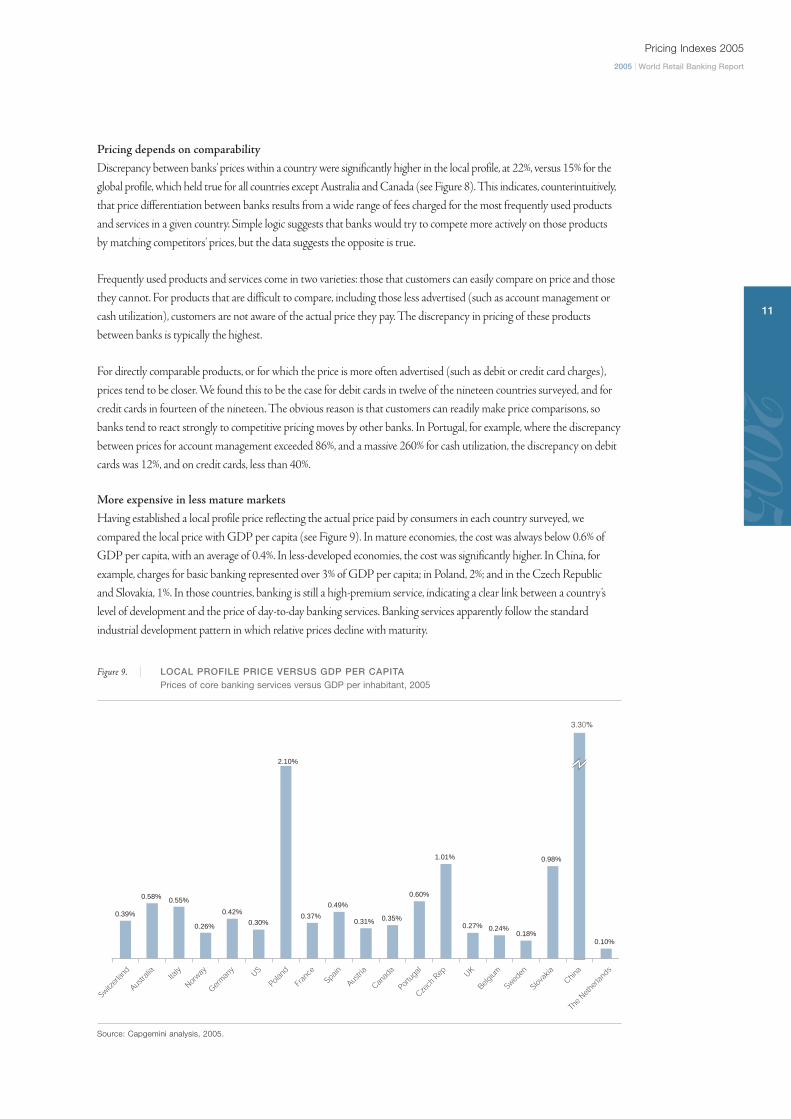
More expensive in less mature markets
Having established a local profile price reflecting the actual price paid by consumers in each country surveyed, we
compared the local price with GDP per capita (see Figure 9). In mature economies, the cost was always below 0.6% of
GDP per capita, with an average of 0.4%. In less-developed economies, the cost was significantly higher. In China, for
example, charges for basic banking represented over 3% of GDP per capita; in Poland, 2%; and in the Czech Republic
and Slovakia, 1%. In those countries, banking is still a high-premium service, indicating a clear link between a country’s
level of development and the price of day-to-day banking services. Banking services apparently follow the standard
industrial development pattern in which relative prices decline with maturity.
Figure 9. | LOCAL PROFILE PRICE VERSUS GDP PER CAPITAPrices of core banking services versus GDP per inhabitant, 2005
Source: Capgemini analysis, 2005.
Italy
Norway
SwedenUS
Spain
Canad
a
Fran
ce
Czech
Rep
BelgiumUK
The N
ether
lands
German
y
Switzer
land
Slovak
ia
Portug
al
Austria
Poland
Austra
liaChin
a
3.30%
2.10%
0.39%
0.58% 0.55%
0.26%
0.42%
0.30%0.37%
0.49%
0.31% 0.35%
0.60%
1.01%
0.27% 0.24%0.18%
0.98%
0.10%
2005
11
Pricing Indexes 2005
2005 | World Retail Banking Report
Conclusion
Based on how difficult it was for our extensive research teams to gather comparable bank pricing data in each country and
across countries, customers would have an even harder time comparing banks on the overall price of day-to-day banking
services. Instead, customers compare the prices of specific product and service categories, such as credit and debit card fees,
or for some of the more financially significant products, such as mortgage and savings rates. Price competition applies to
the more easily comparable products, and banks use these as strategic differentiators for client acquisition and retention.
Price variations on specific categories of highly visible products and services, such as ATMs, checks, and self-service
channels, have the strongest impact on client behavior. Because their customers are not provided with a holistic view
of bank prices, banks let their advisors use rebates as commercial gestures, which have more impact on their customers’
perceptions and represent the strongest tactical lever for banks.
2005
12
2005
13
After an early part of the decade focused on cost-cutting, retail banks
have reaped most of the easy wins and adapted their organizations to
a faster pace of change. Most banks now feel that while continuing to
monitor costs closely to avoid any slippage, they now need to concentrate
on growth. We interviewed twenty-three banks this year in mature
banking markets, as well as four Chinese banks. The four Chinese
institutions were predominantly focused on growing through client
acquisition. For the twenty-three other banks, revenue growth was
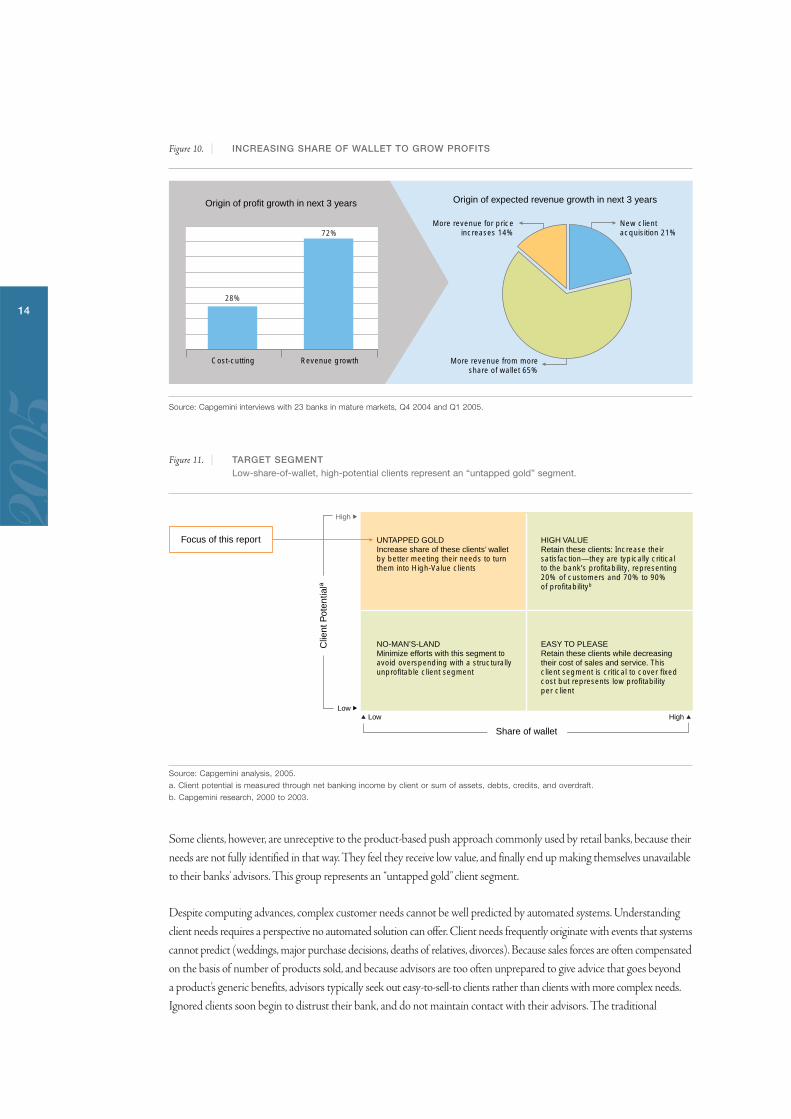
the focus: those institutions estimate that 72% of their profit growth
in the next three years will come from revenue growth, and only 28%
from cost-cutting (see Figure 10).
Within revenue growth, these banks will focus on extracting more value
from existing clients. In mature markets, excluding mergers, 80% of future
revenue is expected to come from existing clients, and only 20% from
new client acquisition. Banks can generate more value from existing
customers by raising prices, expanding product lines, or increasing share
of wallet. Interviewed banks in mature markets expect 65% of their
revenue growth will result from increasing share of wallet. In mature
markets, therefore, most well-established banks recognize that growing
share of wallet is their primary objective.
As a result of this finding, this year’s spotlight falls on how banks can
extract more value from existing customers by increasing share of wallet.
Taking advantage of Capgemini’s experience, combined with interviews
with bank executives and industry experts, we have concluded that a
relationship approach is critical to meeting this goal. Our interviews
with executives of the twenty-seven banks focused on their institutions’
experience with the relationship approach. This helped us determine
where banks stand in implementing such an approach, recognize the
difficulties they encounter in implementing it profitably, and identify
best practices and lessons learned from those experiences.
Beyond “Product Push”Conventional banking wisdom holds that a relationship strategy that
goes beyond a traditional product-push approach can capture untapped
client potential.
Banks have successfully leveraged push approaches to increase sales
effectiveness. As Figure 11 suggests, this push approach was successful
in capturing market share of high-value and easy-to-please customers.
These segments are currently either very or somewhat profitable to
the banks, so there is no reason to change approaches with them.
Increasing Share of Wallet from High-Potential Clients in Mature Markets
2005
14
Figure 10. | INCREASING SHARE OF WALLET TO GROW PROFITS
Source: Capgemini interviews with 23 banks in mature markets, Q4 2004 and Q1 2005.
Figure 11. | TARGET SEGMENTLow-share-of-wallet, high-potential clients represent an “untapped gold” segment.
Source: Capgemini analysis, 2005.
a. Client potential is measured through net banking income by client or sum of assets, debts, credits, and overdraft.
b. Capgemini research, 2000 to 2003.
Some clients, however, are unreceptive to the product-based push approach commonly used by retail banks, because their
needs are not fully identified in that way. They feel they receive low value, and finally end up making themselves unavailable
to their banks’ advisors. This group represents an “untapped gold” client segment.
Despite computing advances, complex customer needs cannot be well predicted by automated systems. Understanding
client needs requires a perspective no automated solution can offer. Client needs frequently originate with events that systems
cannot predict (weddings, major purchase decisions, deaths of relatives, divorces). Because sales forces are often compensated
on the basis of number of products sold, and because advisors are too often unprepared to give advice that goes beyond
a product’s generic benefits, advisors typically seek out easy-to-sell-to clients rather than clients with more complex needs.
Ignored clients soon begin to distrust their bank, and do not maintain contact with their advisors. The traditional
Share of wallet
UNTAPPED GOLDIncrease share of these clients’ wallet by better meeting their needs to turn them into High-Value clients
NO-MAN’S-LANDMinimize efforts with this segment to avoid overspending with a structurally unprofitable client segment
HIGH VALUERetain these clients: Increase their satisfaction —they are typically critical to the bank’s profitability, representing 20% of customers and 70% to 90% of profitabilityb
EASY TO PLEASERetain these clients while decreasing their cost of sales and service. This client segment is critical to cover fixed cost but represents low profitability per client
High
High LowLow
Clie
nt P
oten
tiala
Focus of this report
28%
Origin of profit growth in next 3 years Origin of expected revenue growth in next 3 years
Revenue growth
New client acquisition 21%
More revenue for price increases 14%
More revenue from more share of wallet 65%
Cost-cutting
72%
2005
15
Increasing Share of Wallet from High-Potential Clients in Mature Markets
2005 | World Retail Banking Report
product-push approach is ineffective with this group, because they often regard such efforts as “pushy,” and it is inadequate
in meeting their more complex needs.
A relationship-based approach for these high-potential clients—who may not yet qualify for private banking services—
could create a virtuous circle through a win-win relationship in which the customer’s perception of increased value generates
more share of wallet, which gives the bank a better view of the client’s needs, resulting in better advice, which increases
still further the customer’s perception of value. A Towergroup survey of June 2002 indicated that 70% of clients would
want to use a single institution if it were able to serve all their financial needs well, and a Capgemini survey in February
2004 found that 64% feel that having companies collect information on their individual interests and lifestyle in order
to better personalize services is a good thing.
A relationship approach, as described by Professor Arnoud W. Boot in “Relationship Banking: What Do We Know?”
Journal of Financial Intermediation (2000), is one where the bank “invests in obtaining customer-specific information,
often proprietary in nature, and evaluates the profitability of these investments through multiple interactions with the
same customer over time and/or across products.” The objective of a relationship approach is to understand client needs
and meet them, and to develop such strong trust that the client does not even consider moving to another provider.
Creating such a relationship is an iterative and progressive process, is long-term, is personalized, and requires the client
to share information with the advisor.
Banks that have focused on such an approach for their high-value/high-potential clients have obtained excellent results, as
demonstrated by a North American bank and a European financial institution in our survey. The North American bank
has focused on a client-centric, relationship approach toward its domestic clients, which has established it as the benchmark
in terms of service. Its approach has significantly increased the bank’s share of wallet of high-value clients and in average
profitability. The approach also enables the bank to position itself with a premium, as demonstrated by its consistently
superior net interest margin (20 to 60 basis points higher). These excellent results are reflected in the bank’s share price,
which outperformed the Dow Jones Index over the 5 years from February 2000 to February 2005 with a 250% increase
against a flat Dow.
Who wants a relationship? The alternative, a low-price position and self-service
“Not everyone wants a relationship,” according to Rick Spitler and Sherief Meleis in an article in the BAI newspaper
Banking Strategies (November/December 2004). “It does no good to position 95% of the brands and products as being
relationship-based when only 50% of the market is interested in that value proposition.” Evidence that not all clients value
relationships include:
Over 25% of the US commercial passenger air travel market is captured by discount carriers.
Discount US commercial banks grew deposits 50% faster than others between 1998 and 2003.
A banker Capgemini interviewed said: “We put in place a relationship approach for all high-value clients, but a significant number do not appreciate the extra attention.”
The reason is that clients fit into different buying categories:
Price-focused
Expert comparatists, who look at price but also at all other product characteristics
Loyal-to-a-brand
Followers, who will do whatever the majority, friends, neighbors, or family members do.
A relationship approach only matters to clients who are either expert comparatists or loyal-to-a-brand, and will recognize
the value of the bank’s efforts. The alternative to a relationship model for capturing the untapped potential is to satisfy
price-focused customers by adopting the lowest price position.
In banking, self-service is a good option for many people not wanting a relationship: their expectation is seamless
transactions that can be carried out at low cost. Capturing those clients requires a well-thought-out multichannel
customer experience, and robust and cost-efficient systems to meet service-level expectations at minimum cost.
2005
16
The European financial institution we identified as being a top performer in relationship management has also benefited
from its successful relationship approach toward its “A” clients, where a relationship manager “owns” the client relationship
and conducts one-to-one advisory meetings on the full spectrum of the client’s financial needs. The approach was derived
from the successful method used with small and medium size enterprises. The bank’s approach is driving up its market
share in banking and cross-sold products, notably insurance and mutual funds. The profit contribution from banking has
been multiplied by 5 over the past two years. These results are also reflected in stock price, which outperformed the Euro
Stoxx 50 from January 2003 to February 2005: its stock price doubled in that period (while the Euro Stoxx 50 increased
by only 20%), helping the bank move up the ranks in terms of market capitalization.
A Structured ApproachMany banks are attempting to implement relationship strategies, but few are adopting structured approaches covering the
full scope of retail banking. Of the twenty-seven banks we interviewed for this study, twenty-two had adopted or were
adopting a relationship approach. After developing a framework with the essential components of such a strategy, we
mapped the components in each bank’s approach, gained in the interviews, against our framework (see Figure 12).
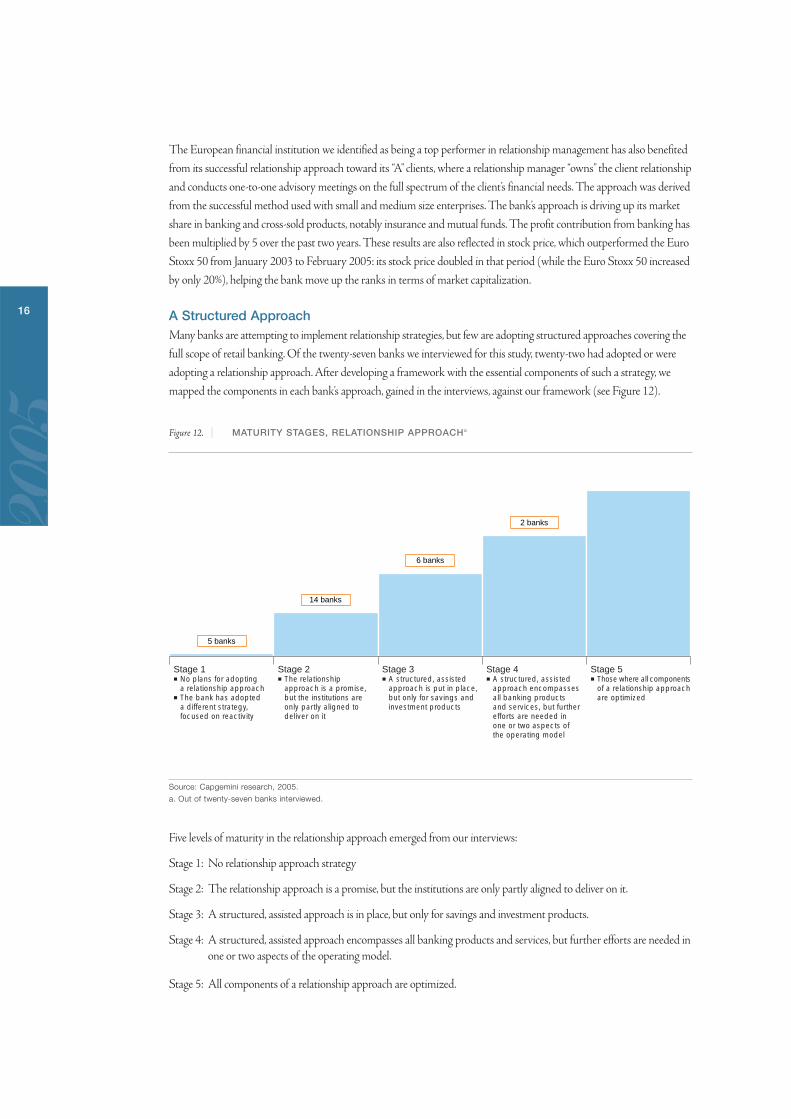
Figure 12. | MATURITY STAGES, RELATIONSHIP APPROACHa
Source: Capgemini research, 2005.
a. Out of twenty-seven banks interviewed.
Five levels of maturity in the relationship approach emerged from our interviews:
Stage 1: No relationship approach strategy
Stage 2: The relationship approach is a promise, but the institutions are only partly aligned to deliver on it.
Stage 3: A structured, assisted approach is in place, but only for savings and investment products.
Stage 4: A structured, assisted approach encompasses all banking products and services, but further efforts are needed inone or two aspects of the operating model.
Stage 5: All components of a relationship approach are optimized.
Stage 1 No plans for adopting
a relationship approach The bank has adopted
a different strategy, focused on reactivity
Stage 2 The relationship
approach is a promise, but the institutions are only partly aligned to deliver on it
Stage 3 A structured, assisted
approach is put in place, but only for savings and investment products
Stage 4 A structured, assisted
approach encompasses all banking products and services, but further efforts are needed in one or two aspects of the operating model
Stage 5 Those where all components
of a relationship approach are optimized
2 banks
6 banks
14 banks
5 banks
2005
17
Increasing Share of Wallet from High-Potential Clients in Mature Markets
2005 | World Retail Banking Report
Stage 1 banks
Five of the banks we surveyed, representing approximately 20% of the sample, did not have any component of a relationship
approach in place. Their perspective was different in that they were either targeting price-focused or transaction-oriented
clients, or did not feel the market situation required them to adopt such an approach yet. One bank said it did not believe
in a relationship approach and thought its success factor of the future was self-service and reactivity.
Stage 2 banks
Just over half of the banks we surveyed were in Stage 2, promising a relationship approach but only partly aligned to
deliver it. These banks have developed a relationship approach as a reaction to the trend of weakening relationships with
clients due to branch automation, deskilling of bank manager tasks, and quality issues arising from multiple channels.
These banks recognized that they needed to take better care of their most important clients, and launched relationship
programs, typically adapting the elements of segmentation, organization structure, some tools supporting the advisors,
and marketing planning, but too often neglecting changing ways of working, performance management, and processes.
Banks segmented their clients according to a mix of present and potential value and established levels of service, including
frequency of client contact, depending on client segment. For those clients identified as high-potential, they have assigned
specific advisors and reduced the number of clients per advisor to improve availability. In terms of tools, a few banks have
given their advisors an extended view of their clients, developed automated ways to identify product opportunities, and
created contextual scripts to help them present product benefits to clients. Marketing plans have been adapted by
segment, and multichannel customer solicitation has been developed to generate opportunities for advisor contact
with clients.
In the process, however, many banks have neglected key aspects necessary to move toward a more relationship-based
approach, especially in the ways their advisors work and are managed. Available tools have failed to provide holistic advice
or establish a diagnosis of each client’s situation and needs. As a consequence, retail advisors still often lack the ability to give
substance to their client relationships and lack good reasons to call clients. Without this necessary advice-product architecture,
advisors find it difficult to recognize client needs. And they are encouraged to stay product- and campaign-centered because
their performance is still measured by number of products sold. Having only partly aligned the organization to a relationship
approach, success remains out of reach.
Stage 3 banks
A smaller proportion of the banks we interviewed—approximately 20%—have developed a structured relationship
management approach, but only for their savings and investment products. These banks believe that cross-selling savings
and investment products to banking clients will generate significant profits. This is especially true in such countries as the
Netherlands and Sweden, where day-to-day banking is a loss-leader, with profit made on savings and lending products.
The European banks that have universal banking models have traditionally excelled in delivering savings products to
their clients. As customers became more sophisticated and the number of products expanded, a need for better advice
emerged that some banks chose to address with a structured advisory process, especially in Belgium, the Netherlands,
and Sweden.
Establishing a structured process for savings and investment products can deliver excellent results, as specialized institutions
in wealth management have shown. Yet the downside of having a structured approach limited to savings and investment
products (or other specific products) includes the inability to gain a complete understanding of a client’s overall needs and
financial situation. It can also cause client frustration if it involves a very professional but unstructured process, and can
translate into the client perceiving the bank as a partial solution provider. Our research indicates, therefore, that only a
structured relationship covering the complete set of retail banking products and services can generate a strong increase
in client satisfaction and a bank’s share of wallet.
2005
18
Stage 4 banks
Only two banks in our survey, one in North America and the other in Europe, representing less than 10% of the sample,
have implemented a robust relationship approach. Our interviews revealed that executives at both banks believe they have
not yet achieved Stage 5 status, and have further improvements in the pipeline. As noted previously, these banks have
already benefited from a very positive impact on their share price, having increased both revenue growth and profitability
by adopting a structured relationship approach.
Our interviews with executives in these top banks also identified several best practices involved in implementing and
growing a relationship approach that increases revenue and improves the profit margin. An underlying key factor is
time and commitment. These managers have repeatedly reaffirmed their commitment to a comprehensive relationship
approach, and have implemented it over time, progressively aligning its key components (see Figure 13).
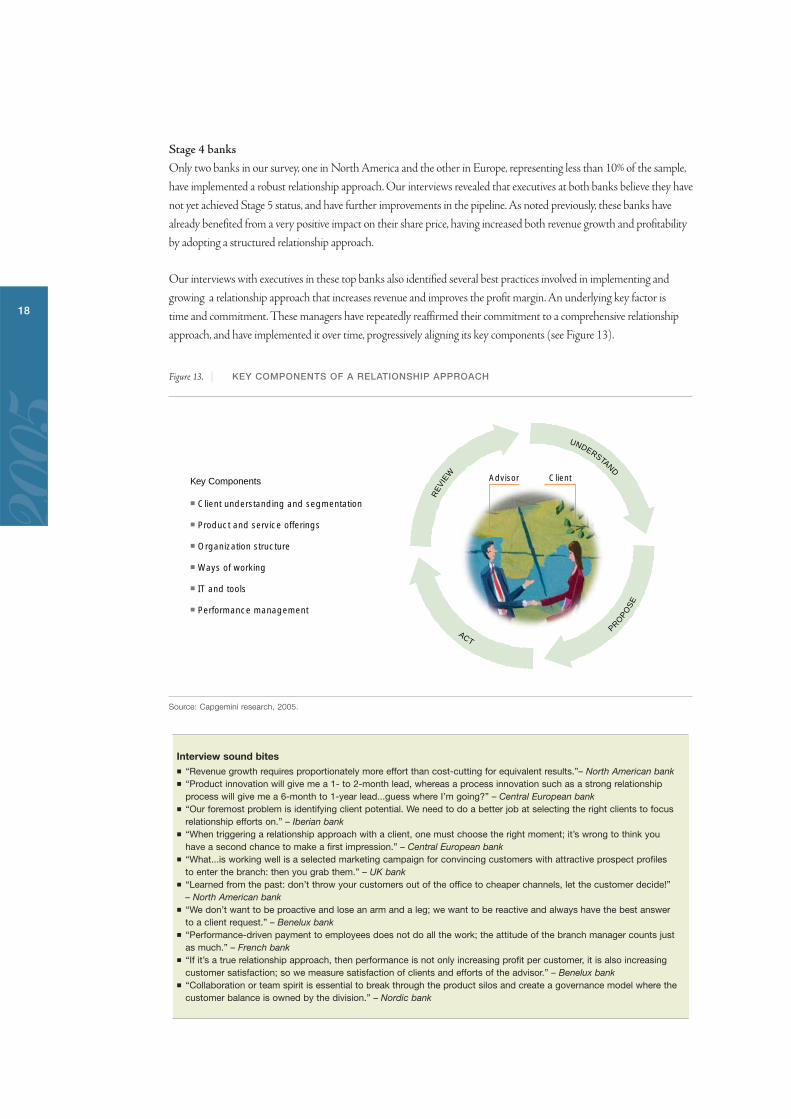
Figure 13. | KEY COMPONENTS OF A RELATIONSHIP APPROACH
Source: Capgemini research, 2005.
UNDERSTAND
PROPO
SE
ACT
RE
VIEW
Key Components
Client understanding and segmentation
Product and service offerings
Organization structure
Ways of working
IT and tools
Performance management
Advisor Client
Interview sound bites“Revenue growth requires proportionately more effort than cost-cutting for equivalent results.”– North American bank“Product innovation will give me a 1- to 2-month lead, whereas a process innovation such as a strong relationship process will give me a 6-month to 1-year lead...guess where I’m going?” – Central European bank“Our foremost problem is identifying client potential. We need to do a better job at selecting the right clients to focus relationship efforts on.” – Iberian bank“When triggering a relationship approach with a client, one must choose the right moment; it’s wrong to think you have a second chance to make a first impression.” – Central European bank“What...is working well is a selected marketing campaign for convincing customers with attractive prospect profiles to enter the branch: then you grab them.” – UK bank“Learned from the past: don’t throw your customers out of the office to cheaper channels, let the customer decide!”– North American bank“We don’t want to be proactive and lose an arm and a leg; we want to be reactive and always have the best answer to a client request.” – Benelux bank“Performance-driven payment to employees does not do all the work; the attitude of the branch manager counts just as much.” – French bank“If it’s a true relationship approach, then performance is not only increasing profit per customer, it is also increasing customer satisfaction; so we measure satisfaction of clients and efforts of the advisor.” – Benelux bank“Collaboration or team spirit is essential to break through the product silos and create a governance model where thecustomer balance is owned by the division.” – Nordic bank
2005
19
Increasing Share of Wallet from High-Potential Clients in Mature Markets
2005 | World Retail Banking Report
How to Implement a Structured Relationship ApproachAs indicated in Figure 13, implementing a relationship approach requires moving all components to a client perspective:
1. Client understanding and segmentation
2. Product and service offerings
3. Organization structure
4. Ways of working
5. IT and tools
6. Performance management
1. Client understanding and segmentationMeasuring client potentialPotential includes all assets and debts. Most banks have developed measures of potential, but many banks are not yetcomfortable that their measure is accurate enough. Methods used to assess potential include compiling data on averageassets of inhabitants of neighborhoods, employing statistical methods based on similar client profiles, and offeringsales force incentives to capture and update client potential. In Germany, more and more banks are using externalproviders to establish accurate figures of client potential. In France, one bank decided to provide a better base for analysis by paying its advisors a bonus based on their completing client data in the information system.
Understanding client trigger pointsThere are right and wrong moments to start a relationship with a client. And once the relationship is going, there arekey points in this relationship when the advisor—and the bank in supporting him or her—has to take special care toavoid client disappointment and seize a development opportunity.
One North American bank we surveyed has focused substantial energy on better meeting its clients’ needs by identifying“reasons for defection” and ensuring their advisors and the institution succeed in what that bank calls “the momentsof truth.” It has established a customer service blueprint to capture the emotional responses of clients to rationalexperiences with the bank. Advisors are trained to identify those moments of truth and react appropriately.
Building loyalty through trust Clients are looking for advisors they can trust, and banks should also be looking for their advisors to be trusted. Arecent Forrester study demonstrated that customer loyalty was most correlated to trusting one’s advisors, and thattrust resulted from clients feeling that their advisor was honest and open and an advocate of their interests. Goodrelationship advisors understand clients’ desire for these traits, and do everything they can to ensure they adopt them.
Advisor/client dialogueThe prerequisite for an effective advisor/client dialogue lies in the advisor’s ability to frame a holistic view of the client’ssituation. The client will soon be aware of whether the advisor has such a view, and will make critical relationshipdecisions based on this perception.
Clients know themselves better than strangers or systems do, especially when it comes to assets they hold outside thebank. Once an advisor wins the client’s trust, it becomes much easier to ask the key questions about the client’s currentsituation and understand his or her needs. It is also the most effective way to establish a client’s true potential.
Clients have expectations and preferences, which advisors should learn. There is no point in repeatedly telephoningsomeone who does not like to be called. However, that same client may be comfortable exchanging emails. The bestadvisors ask clients at the outset what their expectations and preferences are.
2. Product and Service OfferingsA needs-advice-product architectureA critical component of a relationship approach is the matching of client needs with advice and finally with products.To help ensure they fully capture client needs, advisors often develop and administer questionnaires. At one Europeanfinancial institution, advisors are trained to identify and work into predefined scenarios based on combinations ofclient needs, and to suggest solutions that bundle products to meet those needs. Another European bank has createdpackaged products to fit points in the client life cycle, so advisors can readily match their clients’ needs. Some bankshave experimented with a central support center to assist advisors in customizing their proposals.
2005
20
3. Organization structureSales force specialization and branch sizing A single bank employee cannot operate effectively in two different modes, applying a relationship approach to someclients and a push-based approach to others. Too many differences in terms of time allocated yearly to a client, performancemanagement, tools to be used, and so on, can make it a no-win situation.
In a Benelux financial institution, for example, two categories of customer are recognized, each with a specific approachand type of advisor. Mass consumers are offered an event-driven push approach. Affluent customers are offered afinancial advice approach managed by a financial advisor. Relationship managers usually handle from 100 to 300 clients,and this bank has merged some branches so each has over 100 affluent customers. This ensures that the presence ofa financial advisor is profitable.
4. Ways of working The people factor Ensuring that people change their ways of working and managing, and fully adhere to the relationship approach,is essential. Our interviews suggest that change involved in implementing a relationship approach faces some resistance at all levels, from central teams, to branch management, to the advisors themselves. Central teams sometimes resistchanging their management style from measuring performance based on campaigns and product sales objectives.Advisors might not believe the institution will provide an approach to help them better understand their clients,could worry about the amount of time and effort required to learn the new way, and are often very cautious about the impact on their compensation. Approaching the move to a relationship approach as a major change program is the most effective way to overcome this potential resistance.
At a large European financial institution, for example, the most critical success factor identified was “the attitude of thebranch manager.” During the change process, 25% of the branch management work force was progressively replacedto enable the necessary change in culture.
Other methods used by banks include identifying specific employee concerns and addressing them, rolling out a comprehensive communication plan to alleviate fears and align employees, identifying change agents at all levels whoare willing to endorse the change, lead by example, and conduct pilots to obtain positive results. Pilot programs canboth motivate others and help gain a better grasp on potential implementation issues, which can be mitigated whenthe program is rolled out later across the branch system.
Developing an entrepreneurial culture at the branch level can also generate positive results. Encouraging and rewardingemployees for teamwork and for going the extra mile to satisfy their clients’ needs is a proven way to change mindsets.Top banks use these incentives to motivate their branch managers, and make sure they recognize high-performingbranches that accept change and adopt a client-focused relationship approach.
A rigorous, iterative, standardized processThe structured process should be geared toward a recurring effort to match client needs and build a positive customerexperience. From the client perspective, as illustrated earlier in Figure 13, it can be a four-step process: (1) understand;(2) propose; (3) act; (4) review. This process begins with a dialogue between the client and the advisor to ensure theclient’s overall situation, needs, and preferences are understood. Second, the advisor develops a proposal and discussesit with the client to ensure the proposed solution addresses those needs. Third, the client lets the bank act on theagreed solution. Then, after some time, comes the review to ensure the solution is serving the client’s evolving needs.
A few banks interviewed in Europe are currently rolling out such advice-oriented processes. Their purpose is to ensureclients receive high-quality service and advice while the banks’ commercial efficiency improves. Such guidance andsupport brought to the advisor is key to maximizing the bank’s profitability.
Internal recruiting and competence managementThese new ways of working need to be learned. Most banks recruit their relationship managers from the existing salesforce based on their ability to listen, react, and have a broad perspective on customers’ financial needs. Even then, strongtraining efforts are a must. Both of the top-performing banks in our survey relied on excellent training programs toensure their personnel developed a complete understanding of the portfolio of products and services and the structuredadvisory process.
2005
21
Increasing Share of Wallet from High-Potential Clients in Mature Markets
2005 | World Retail Banking Report
5. IT and toolsAdapting tools to a relationship approach To provide effective advice, advisors need a complete, integrated view of the client’s situation, a good measure of clientpotential, and an accurate record of the client’s past interactions with the bank, including through other channels.
Advisors also need tools supporting the structured process to guide dialogue, enable rapid advice-generation, and developcustomized solutions. Questionnaires can help guide dialogue. For rapid advice, tools replicating the need-advice-productarchitecture are very helpful. To customize solutions, advisors should be able to group products and be guided throughthe pricing process so they can adjust the price based on the value perceived by the client, within acceptable boundariesof profitability for the bank.
Managers also need monitoring tools to help them know where to direct their efforts and whom to coach. The best toolsprovide an aggregated and detailed view of how advisors follow the structured process as well as the benefits obtained.
An adaptive IT architecture In a client-needs-driven relationship, flexibility and a holistic view are essential. Flexibility is necessary to enable customization of product bundling and pricing, and to allow for accessing products across all product lines based on identified client needs.
A holistic customer experience is a key concept. It refers to customers having access to online channels, which empowersthem to get advice and act on their own. This requires an adaptive architecture for synchronized data exchange. Advisorsalso need a readily accessible view of all the client’s interactions with the bank (including self-service). In this way theadvisor can ensure the client does not become frustrated with the bank’s service, and instead gives the client the feelingthat the advisor has a firm grip on his or her banking matters.
Developing customer insight and “institutional memory” is also critical. This includes records of processes executed forthe client, and a record of client preferences and past interactions through all channels. The prerequisite is an advice-offeringdatabase architecture that enables advisors to react to client needs quickly and effectively, and to conduct analyses thatproduce better targeted offerings.
A multichannel customer experience
A relationship is about the bank viewing the customer as an individual (and the customer perceiving it that way) with a
specific situation and needs, and how to meet those needs with a broad spectrum of offers--not by pushing products in
campaigns or boxing them into a segment category, even a small one. The bank can be represented by a human advisor
or a technology interface. In Nordic countries we found the concept of a relationship through technology interfaces more
advanced than elsewhere.
A multichannel focus can help considerably by:
1.Lowering the cost of providing a relationship approach, albeit through technological means, to satisfy lower segments of revenues.
2.Providing a multichannel relationship that enhances the customer experience to satisfy higher standards of more affluent client segments who either prefer self-service to people-based service or are very active users of all channels.
As a Nordic banker we interviewed put it, “This personalized approach can be achieved through people, or systems, or a
combination.” His bank has decided to drive up its share of wallet by lowering the cost of personal service. Its goal is to
provide relationship-based approaches to less-affluent segments, and offer its affluent clients a multichannel relationship
that includes self-service, not one restricted to the branch advisor. This approach recognizes that self-service is as much
a part of the relationship approach for affluent clients as it is for the less-affluent segments.
The bank’s key objective is that every customer be treated on an individual basis. All activities toward a customer, in
whatever segment, are generated on an event basis, so people in the branch have a stack of activities toward customers
every day, with individual assignments of bank employees for each customer. Events are logged in all channels. Records,
or institutional memory, are the key; systems can help organize it and leverage it through analysis for human-machine
interaction, or provide the information in an organized way for an advisor to be more effective.
However, this same leading Nordic bank recognizes its human advisors are still the critical success factor. Despite its
efforts with technology, it insists that clients with a contact person are distinctly more satisfied and more loyal; hence
clients have a named contact person they can reach out to when they want...and most of the time they do so by email
or chat.
2005
22
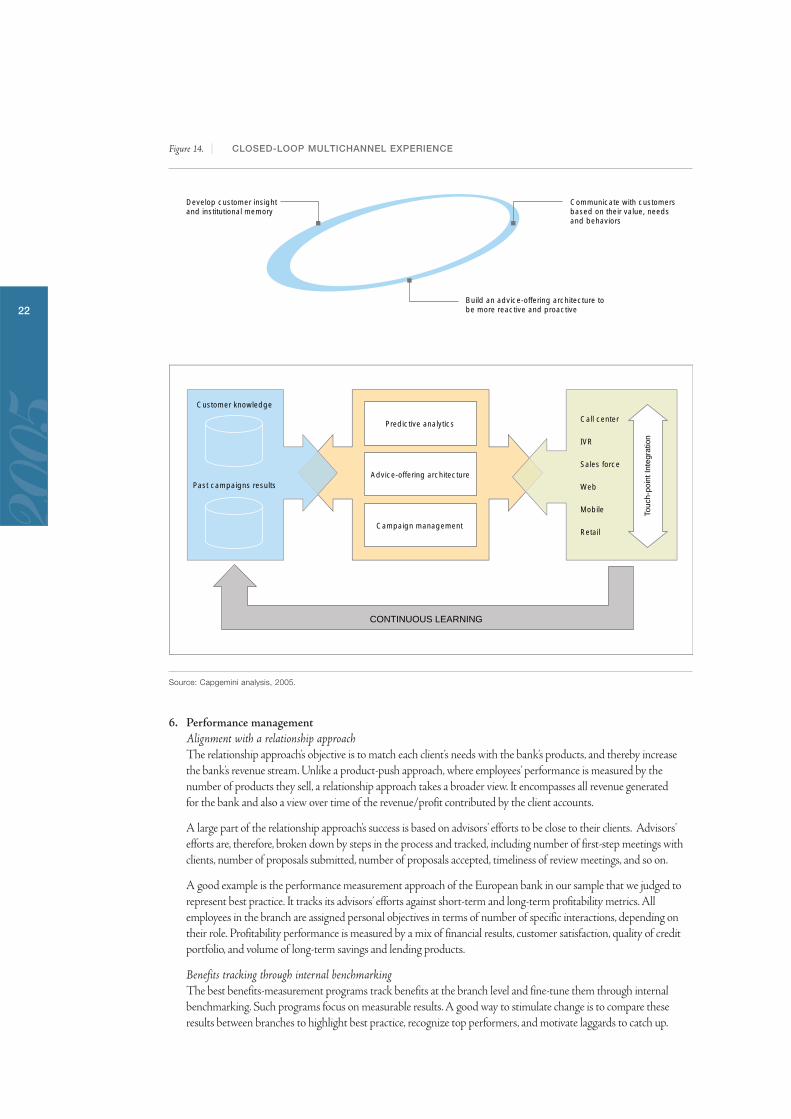
Figure 14. | CLOSED-LOOP MULTICHANNEL EXPERIENCE
Source: Capgemini analysis, 2005.
6. Performance managementAlignment with a relationship approachThe relationship approach’s objective is to match each client’s needs with the bank’s products, and thereby increasethe bank’s revenue stream. Unlike a product-push approach, where employees’ performance is measured by the number of products they sell, a relationship approach takes a broader view. It encompasses all revenue generated for the bank and also a view over time of the revenue/profit contributed by the client accounts.
A large part of the relationship approach’s success is based on advisors’ efforts to be close to their clients. Advisors’efforts are, therefore, broken down by steps in the process and tracked, including number of first-step meetings withclients, number of proposals submitted, number of proposals accepted, timeliness of review meetings, and so on.
A good example is the performance measurement approach of the European bank in our sample that we judged torepresent best practice. It tracks its advisors’ efforts against short-term and long-term profitability metrics. Allemployees in the branch are assigned personal objectives in terms of number of specific interactions, depending ontheir role. Profitability performance is measured by a mix of financial results, customer satisfaction, quality of creditportfolio, and volume of long-term savings and lending products.
Benefits tracking through internal benchmarkingThe best benefits-measurement programs track benefits at the branch level and fine-tune them through internalbenchmarking. Such programs focus on measurable results. A good way to stimulate change is to compare theseresults between branches to highlight best practice, recognize top performers, and motivate laggards to catch up.
Customer knowledge
Past campaigns results
Predictive analytics
Advice-offering architecture
Campaign management
Call center
IVR
Sales force
Web
Mobile
Retail
Touc
h-po
int I
nteg
ratio
n
CONTINUOUS LEARNING
Develop customer insight and institutional memory
Communicate with customers based on their value, needs and behaviors
Build an advice-offering architecture to be more reactive and proactive
2005
23
Increasing Share of Wallet from High-Potential Clients in Mature Markets
2005 | World Retail Banking Report
ConclusionFor the next three years especially, increasing share of wallet from high-value customers represents a significant challenge
for banks operating in mature markets. Most banks recognize that implementing a relationship approach for these
high-potential/low-share-of-wallet clients represents an effective way to grow revenue and profit. Through interviews
with bank executives, we identified the best practices detailed above.
In addition to providing excellent advisors, a bank that succeeds with relationship management will have a flexible IT
architecture aligned with the operating model, and user-friendly systems to help advisors meet their clients’ needs. People
throughout the institution will recognize that the relationship approach is a multichannel customer experience, and let
customers choose their channels. While advisors offer consistent solutions and service levels, the bank will also deliver
seamless data across channels. All client contacts, through whatever channel, will be captured and learned from so the
relationship will continuously grow and prosper.
Maximizing profit growth depends on the advisors’ effectiveness and efficiency. With the appropriate incentives, the
best of them will focus on the right clients, be guided in the relationship by a robust, standardized process, and be
supported with excellent technology in conducting analyses, providing advice, and managing the relationship. With all
the relationship management components in place, they will offer service levels that delight their clients and ensure the
bank’s long-term position as a marketplace leader.
Key learning points on the relationship approach
Measuring client potential accurately to focus the relationship effort and ensure its profitability.
Recognizing the client’s trigger points in his or her relationship to the bank in light of the multichannel customer
experience, so the advisor can provide informed support at those critical times.
Building customer loyalty through trust that the advisor is the client’s advocate and that the bank offers clear pricing
and excellent service.
A relationship is a two-way dialogue: listening to what customers have to say about themselves, their objectives, their
preferences, and their needs, and taking it truly into account when proposing a solution.
Developing a specialized sales force for the relationship approach through internal recruiting, appropriate training,
ongoing competence management, and a long-term effort to ensure people change and adhere to the new approach:
– Aligning performance measurement and incentives with the relationship approach.
– Establishing a rigorous, iterative, standardized relationship process—one supported with tools that develop
a holistic view of clients, while providing guidance in the diagnostic and solution phases of the relationship
(through an architecture encompassing situation, needs, and products).
– Establishing an IT architecture reflecting the business architecture of a closed-loop relationship approach.
Benchmarking speed of adoption of the new approach at the branch level.
2005
24
For this second annual World Retail Banking Report, nineteen
country teams completed the research in four stages over eight months.
Like last year, each country team scanned its entire domestic banking
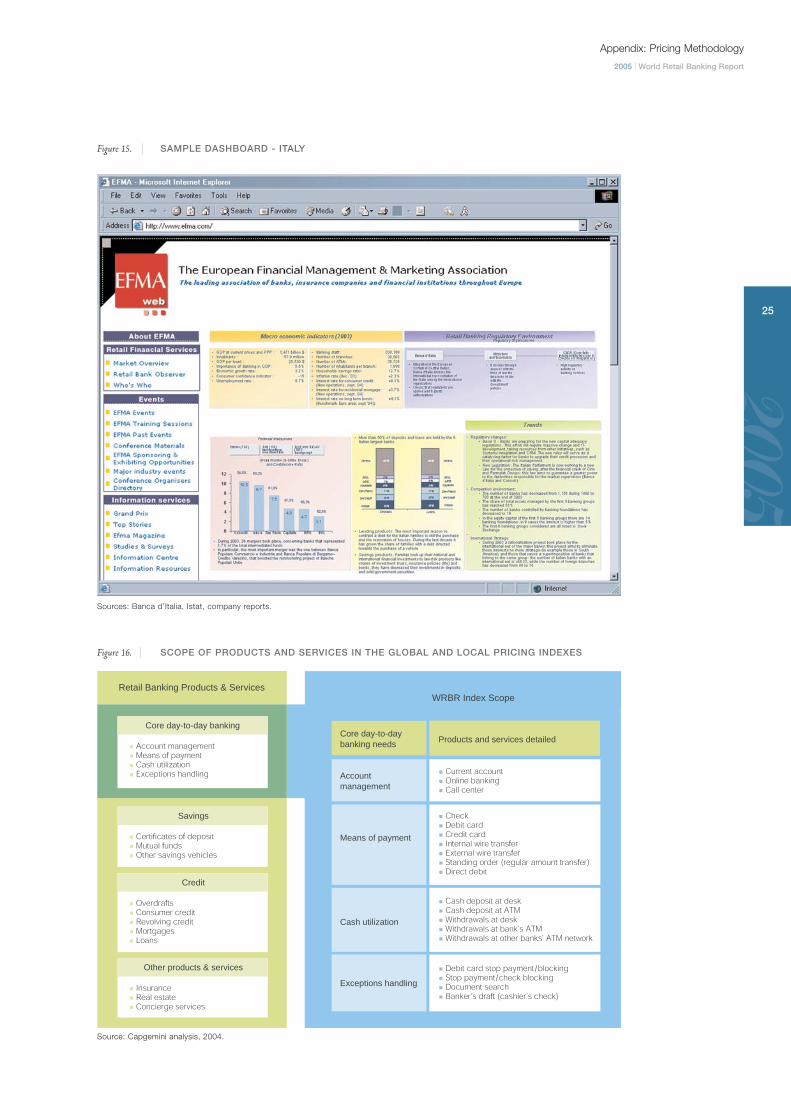
environment and mapped it in a detailed dashboard format (see Figure 15
for an example with a dashboard of Italy’s retail banking environment).
Based on this data, local banking experts in each country established
consumption frequencies for their particular country for the day-to-day
banking products and services covered in the report (see Figure 16).
This local profile is new this year, and will remain the standard for
subsequent annual editions. For comparison purposes, we also
measured for the global profile index we created last year.
We expanded the number and geographic range of countries from
last year’s eleven to this year’s nineteen, including fifteen European
and two North American countries, as well as Australia and China.
We analyzed the pricing schemes of one hundred thirty selected
retail banks across the survey countries (see Figure 17 for a complete
list) to calculate the average price of day-to-day banking services in
each country. This data became the basis for both the global and
local profile price indexes. We then ranked each country’s average
on the two pricing indexes so we could offer clear comparisons to
last year’s findings.
Subsequently, we conducted a series of forty interviews with
executives from twenty-seven banks out of the hundred thirty we
surveyed this year. This information forms the basis for the spotlight
section, which this year focuses on growing revenue in mature retail
banking markets.
An Evolving Approach This year’s report parallels last year’s proven approach, providing an
average price of basic banking services based on a pricing survey of
the top banking institutions in each of an expanded group of selected
countries. Because last year was a first, adjustments to some of last
year’s numbers were made to align interpretations of the methodology.
Also, given what we learned from last year’s analysis, we made a few
changes to the core methodology but covered the same products and
services. Most important, we created the local profile index, which
more accurately reflects the true cost of day-to-day banking services
for an average consumer in each country.
We have, therefore, taken two approaches to benchmarking the pricing
of day-to-day retail banking products and services across the nineteen
countries covered this year. The global profile index, like last year’s,
reflects the average annual price a country’s banks charge for a set of
products and services based on an identical consumption pattern
Appendix: Pricing Methodology
2005
25
Appendix: Pricing Methodology
2005 | World Retail Banking Report
Figure 15. | SAMPLE DASHBOARD - ITALY
Sources: Banca d’Italia, Istat, company reports.
Figure 16. | SCOPE OF PRODUCTS AND SERVICES IN THE GLOBAL AND LOCAL PRICING INDEXES
Source: Capgemini analysis, 2004.
Retail Banking Products & ServicesWRBR Index Scope
Core day-to-day banking
� Account management� Means of payment� Cash utilization� Exceptions handling
Savings
� Certificates of deposit� Mutual funds� Other savings vehicles
Credit
� Overdrafts� Consumer credit� Revolving credit� Mortgages� Loans
Other products & services
� Insurance� Real estate� Concierge services
� Current account� Online banking� Call center
� Check� Debit card� Credit card� Internal wire transfer� External wire transfer� Standing order (regular amount transfer)� Direct debit
� Cash deposit at desk� Cash deposit at ATM� Withdrawals at desk� Withdrawals at bank's ATM� Withdrawals at other banks' ATM network
� Debit card stop payment/blocking� Stop payment/check blocking� Document search� Banker's draft (cashier's check)
Core day-to-day banking needs
Account management
Means of payment
Cash utilization
Exceptions handling
Products and services detailed
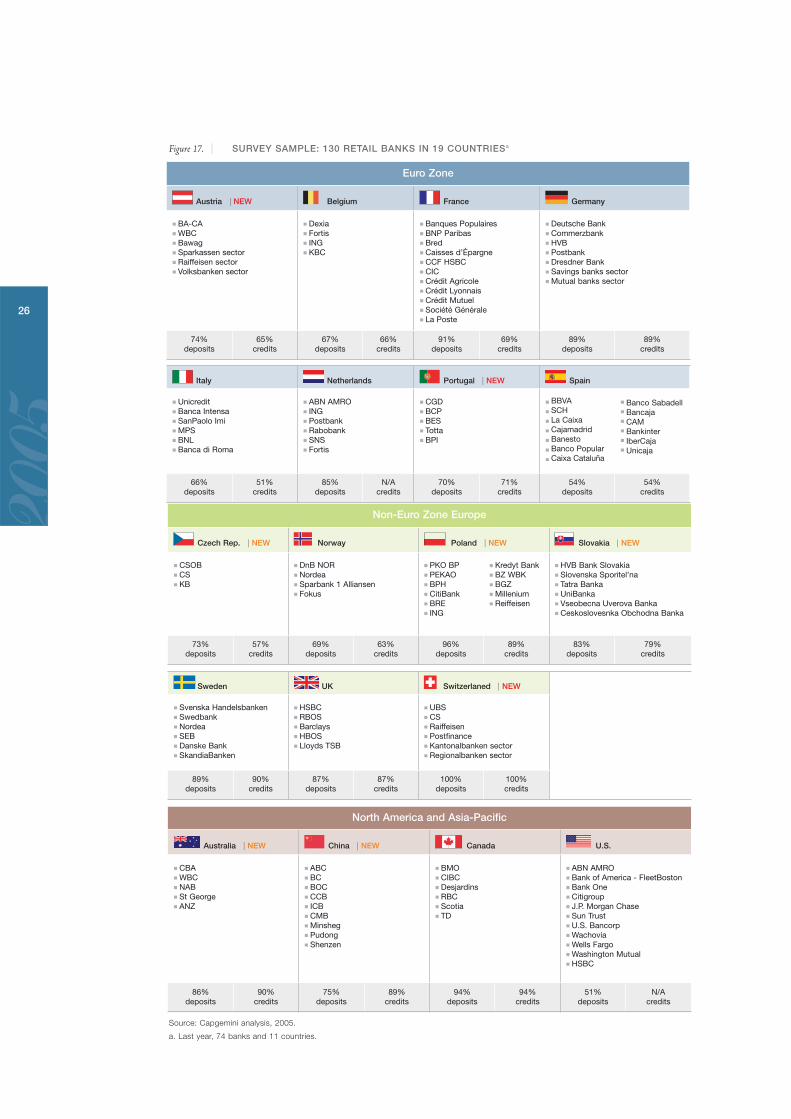
2005
26
Figure 17. | SURVEY SAMPLE: 130 RETAIL BANKS IN 19 COUNTRIESa
Non-Euro Zone Europe
Czech Rep. | NEW Norway Poland | NEW Slovakia | NEW
CSOBCSKB
DnB NORNordeaSparbank 1 AlliansenFokus
PKO BPPEKAOBPHCitiBankBREING
Kredyt BankBZ WBKBGZMilleniumReiffeisen
HVB Bank SlovakiaSlovenska Sporitel’naTatra BankaUniBankaVseobecna Uverova BankaCeskoslovesnka Obchodna Banka
73%deposits
57%credits
69%deposits
63%credits
96%deposits
89%credits
83%deposits
79%credits
Sweden UK Switzerlaned | NEW
Svenska HandelsbankenSwedbankNordeaSEBDanske BankSkandiaBanken
HSBCRBOSBarclaysHBOSLloyds TSB
UBSCSRaiffeisenPostfinanceKantonalbanken sectorRegionalbanken sector
89%deposits
90%credits
87%deposits
87%credits
100%deposits
100%credits
North America and Asia-Pacific
Australia | NEW China | NEW Canada U.S.
CBAWBCNABSt GeorgeANZ
ABCBCBOCCCBICBCMBMinshegPudongShenzen
BMOCIBCDesjardinsRBCScotiaTD
ABN AMROBank of America - FleetBostonBank OneCitigroupJ.P. Morgan ChaseSun TrustU.S. Bancorp WachoviaWells FargoWashington MutualHSBC
86%deposits
90%credits
75%deposits
89%credits
94%deposits
94%credits
51%deposits
N/Acredits
Euro Zone
Austria | NEW Belgium France Germany
BA-CAWBCBawagSparkassen sectorRaiffeisen sectorVolksbanken sector
DexiaFortisINGKBC
Banques PopulairesBNP ParibasBredCaisses d’ÉpargneCCF HSBCCICCrédit AgricoleCrédit LyonnaisCrédit MutuelSociété GénéraleLa Poste
Deutsche BankCommerzbankHVBPostbankDresdner BankSavings banks sectorMutual banks sector
74%deposits
65%credits
67%deposits
66%credits
91%deposits
69%credits
89%deposits
89%credits
Italy Netherlands Portugal | NEW Spain
UnicreditBanca IntensaSanPaolo ImiMPSBNLBanca di Roma
ABN AMROINGPostbankRabobankSNSFortis
CGDBCPBESTottaBPI
BBVASCHLa CaixaCajamadridBanestoBanco PopularCaixa Cataluña
Banco SabadellBancajaCAMBankinterIberCajaUnicaja
66%deposits
51%credits
85%deposits
N/Acredits
70%deposits
71%credits
54%deposits
54%credits
Source: Capgemini analysis, 2005.
a. Last year, 74 banks and 11 countries.
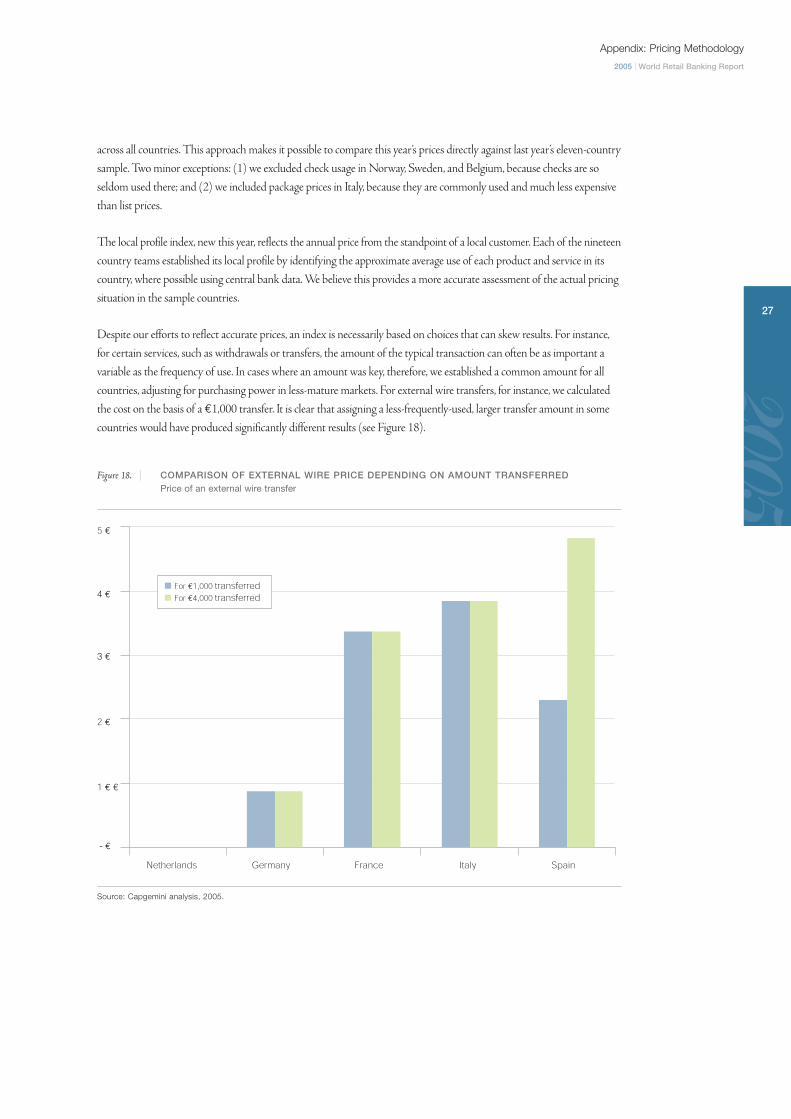
2005
across all countries. This approach makes it possible to compare this year’s prices directly against last year’s eleven-country
sample. Two minor exceptions: (1) we excluded check usage in Norway, Sweden, and Belgium, because checks are so
seldom used there; and (2) we included package prices in Italy, because they are commonly used and much less expensive
than list prices.
The local profile index, new this year, reflects the annual price from the standpoint of a local customer. Each of the nineteen
country teams established its local profile by identifying the approximate average use of each product and service in its
country, where possible using central bank data. We believe this provides a more accurate assessment of the actual pricing
situation in the sample countries.
Despite our efforts to reflect accurate prices, an index is necessarily based on choices that can skew results. For instance,
for certain services, such as withdrawals or transfers, the amount of the typical transaction can often be as important a
variable as the frequency of use. In cases where an amount was key, therefore, we established a common amount for all
countries, adjusting for purchasing power in less-mature markets. For external wire transfers, for instance, we calculated
the cost on the basis of a €1,000 transfer. It is clear that assigning a less-frequently-used, larger transfer amount in some
countries would have produced significantly different results (see Figure 18).
Figure 18. | COMPARISON OF EXTERNAL WIRE PRICE DEPENDING ON AMOUNT TRANSFERRED Price of an external wire transfer
Source: Capgemini analysis, 2005.
5 €
4 €
3 €
2 €
1 € €
- €
Netherlands Germany France Italy Spain
� For €1,000 transferred� For €4,000 transferred
2005
27
Appendix: Pricing Methodology
2005 | World Retail Banking Report
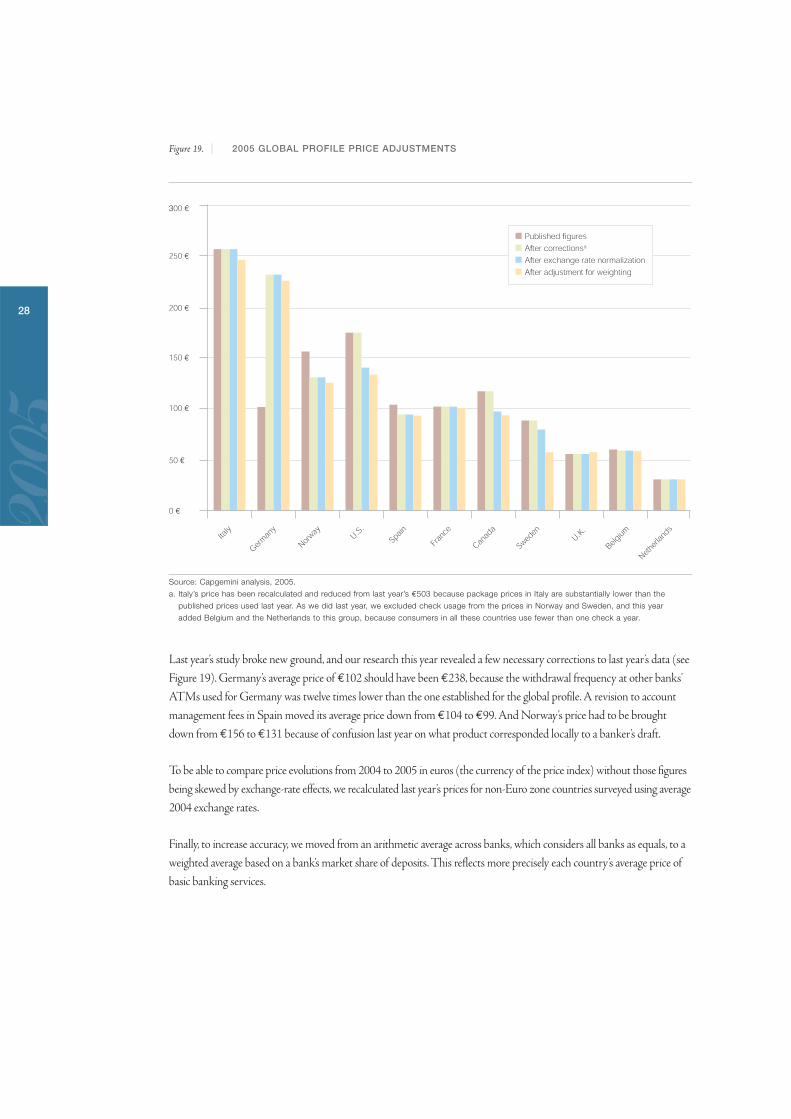
2005
28
Figure 19. | 2005 GLOBAL PROFILE PRICE ADJUSTMENTS
Source: Capgemini analysis, 2005.
a. Italy’s price has been recalculated and reduced from last year’s €503 because package prices in Italy are substantially lower than the
published prices used last year. As we did last year, we excluded check usage from the prices in Norway and Sweden, and this year
added Belgium and the Netherlands to this group, because consumers in all these countries use fewer than one check a year.
Last year’s study broke new ground, and our research this year revealed a few necessary corrections to last year’s data (see
Figure 19). Germany’s average price of €102 should have been €238, because the withdrawal frequency at other banks’
ATMs used for Germany was twelve times lower than the one established for the global profile. A revision to account
management fees in Spain moved its average price down from €104 to €99. And Norway’s price had to be brought
down from €156 to €131 because of confusion last year on what product corresponded locally to a banker’s draft.
To be able to compare price evolutions from 2004 to 2005 in euros (the currency of the price index) without those figures
being skewed by exchange-rate effects, we recalculated last year’s prices for non-Euro zone countries surveyed using average
2004 exchange rates.
Finally, to increase accuracy, we moved from an arithmetic average across banks, which considers all banks as equals, to a
weighted average based on a bank’s market share of deposits. This reflects more precisely each country’s average price of
basic banking services.
300 €
250 €
200 €
150 €
100 €
50 €
0 €
Italy
Norway U.S
.
Spain
Fran
ce
Canad
a
Sweden
U.K.
Belgium
Nether
lands
German
y
� Published figures
� After correctionsa
� After exchange rate normalization
� After adjustment for weighting
2005
29
About Us
2005 | World Retail Banking Report
ING: the difference in financial services ING was created in 1991 from the merger between the largest insurance company in the Netherlands, Nationale-Nederlanden, and one of the largest banks, NMB PostbankGroup, thus combining insurance, banking and asset management under one roof.
ING now serves some 60 million customers in more than 50 countries with around115,000 employees worldwide. In Europe, ING is one of the largest financial servicesproviders. The Group aims to serve each customer to the best of its abilities, whetherthe customer needs a savings account, life insurance, mutual fund, pension, starter’scredit or complex corporate finance. ING distributes its products and services throughbranches, the Internet, call centers or insurance intermediaries: it is up to the customerto choose.
In performing its activities, ING seeks the right balance between the interests of all itsstakeholders: customers, shareholders, employees and society at large. ING’s corporatevalues are entrepreneurship, integrity, professionalism and teamwork. The Group is alsocommitted to demonstrating its corporate social responsibility.
ING Group’s special skills are ING Direct, insurance in emerging markets and pensions.ING Direct sells simple savings products via the telephone and the Internet in eight largecountries. ING offers insurance in various emerging economies in Asia, Latin Americaand Central Europe. ING also provides pensions, thus responding to the needs of anaging population.
The European Financial Management & Marketing AssociationThe European Financial Management & Marketing Association is a not-for-profit association with a membership uniquely composed of banking and financial servicesorganizations in Europe.
EFMA seeks to promote innovation in the banking and financial communities by fostering debate and discussion in a setting removed from the pressures of commercialcompetition. Through meetings and an open exchange of information, EFMA facilitatesdialogue and collaboration among its members, creating a forum for the recognition andstudy of best practice.
EFMA is funded by membership fees and income earned from events and services. Thefees paid by members finance an array of services strictly reserved for members. Theincome earned from supporting activities enables the association to reduce these fees.This original arrangement maintains EFMA’s neutrality, protecting programs and activitiesfrom commercial pressures and ensuring a standard of program quality that is highlyvalued by members.
The loyalty of EFMA members, representing over three quarters of the largest banking organizations in Europe, is a testament to its effectiveness in performing this mission.
CapgeminiCapgemini is a world leader in consulting, technology and outsourcing services. We arededicated to helping our clients improve the economics of their business through cost-reduction and revenue-growth initiatives that offer an immediate return on investment.
The Group employs more than 60,000 people throughout Europe, North America, andthe Asia-Pacific region, and reported global revenues of approximately 6.3 billion eurosin 2004. We offer local and international clients in 35 countries a range of services,including consulting, technology, and outsourcing.
The Capgemini has developed extensive expertise in retail banking over 30 years. Our professionals cooperate in the firm’s global network, serving the world’s leadingfinancial services organizations. Through this highly skilled network, our consultantsshare knowledge, create leading-edge ideas, and establish industry-wide competenciesthat ensure our clients receive the best possible advice and assistance.
The Group’s Retail Banking practice helps clients develop leading innovative strategies.We work side-by-side with our clients to implement successful solutions, including customer relationship management; Internet-based, self-directed, and full-service offerings; front-and back-office systems; straight-through processing; project management; and outsourcing.
About Us

200www.ing.com
www.efma.com
www.capgemini.com