Embed Size (px)
Citation preview

Highlights of the Cashew Industrypresented by Red River Foods, Inc.
JULY 2012


Red River Foods, Inc. July 2012 1
Peru
Brazil
ThailandMalaysiaCambodia
Indonesia
0° 0°EQUATOR
PhilippinesVietnamIndia
Sri LankaKenya
Tanzania
Mozambique
Madagascar
major cashew kernel trade
from India & Vietnam
To Europe
To Middle East
To Europe
from India
to India & Vietnam
major raw cashew trade
A WORLD VIEW The cashew is native to northeastern Brazil. In the mid-to-late 1500s, Portuguese traders and explorers introduced the cashew
tree to India and to the east coast of Africa in an area that is now Mozambique. In Africa, the tree was spread along the east coast
(today, Kenya and Tanzania) and was later introduced to the continent’s west coast, where it presently grows from Senegal to
Nigeria. Portuguese and Spanish traders also introduced the cashew tree to Southeast Asia. The cashew tree now grows in tropical
climates of about thirty countries across the globe within a band approximately 25-30 degrees north and south latitude of the
equator. India is the largest single producer of cashew nuts while West Africa--principally Ivory Coast, Benin, and Guinea-Bissau—is
the largest regional producer. Vietnam, Brazil, and East Africa are the other major sources of production. Indonesia has become a
major producer and exporter in Southeast Asia.
The world map below identifi es countries with estimated raw cashew production of one or more million kgs in 2012. Countries which
are identifi ed in bold are major producers and are the most important exporters of either raw cashews and/or processed cashew
kernels. The cashew kernel trade and the raw cashew trade are highlighted, showing the major kernel export destinations from
India, Vietnam, and Brazil and the sources of Brazilian, Indian, and Vietnamese raw cashew imports. Within the past year, the raw
cashew trade has expanded from West Africa to Brazil as Brazilian processors, having weathered two short crops in recent years,
seek another supply source.
Raw Seed The Final Product: Roasted/Salted Cashew Nuts
SenegalGuinea-BissauIvory CoastGhanaBeninNigeriaMaliTogoGuineaBurkina FasoThe Gambia
2 Highlights of the cashew industry
INDUSTRY PERSPECTIVEThe international cashew market seems to have reversed course in one year’s time. At this point in 2011 a very volatile market
was still experiencing rising prices. At mid-year in 2012, the market is relatively calm after a moderation in prices and there is an
oversupply of product with wary buyers. As we publish this brochure, the industry is dealing with:
• A heightened focus on food quality/safety requirements, especially in the U.S., and greater demand for supply chain
visibility.
• Large, high-priced inventories held by some Vietnamese and Indian suppliers and their inability to move those inventories
because of price.
• Some Vietnamese suppliers having gone out of business because of their inability to sell their inventories...or having to
sell at sizable losses.
• Continuing concerns about product quality, primarily about Vietnamese product. Those packers still holding expensive
seed from Africa that is over a year old are faced with deteriorating quality; this becomes obvious when they blend old
and new crop to try to cut their losses.
• The false assumption of some suppliers that cashews will continually move, even at abnormally high prices, and their
failure to recognize that cashew consumption responds to the “law of supply and demand.” The demand for cashews is
price elastic; a change in price will noticeably affect the quantity demanded. Demand will most likely decline as prices
rise; conversely, demand will likely increase in tandem with moderating prices.
• The effects of the 2011 price spike, which resulted in “demand destruction.” Those effects are still reverberating in the
market as evidenced by lower demand, particularly in the U.S.; consumers and therefore buyers are proceeding with caution.
• Uncertainty about West African supplies. Civil unrest in the region seems to be an annual event: In 2011 civil disorder
delayed shipments from the Ivory Coast. In 2012 a coup in Guinnea-Bissau lowered supply expectations from that country.
Perhaps a good way to describe the international cashew market is to liken it to a kaleidoscope. The various colored pieces in a
kaleidoscope form an attractive geometric pattern, but a slight turn (as civil unrest in a major West African producer…to extend the
metaphor) of the kaleidoscope can result in a totally different geometric–market–pattern from one year to the next. Yet, that is what
makes our industry so very challenging and so very dynamic.
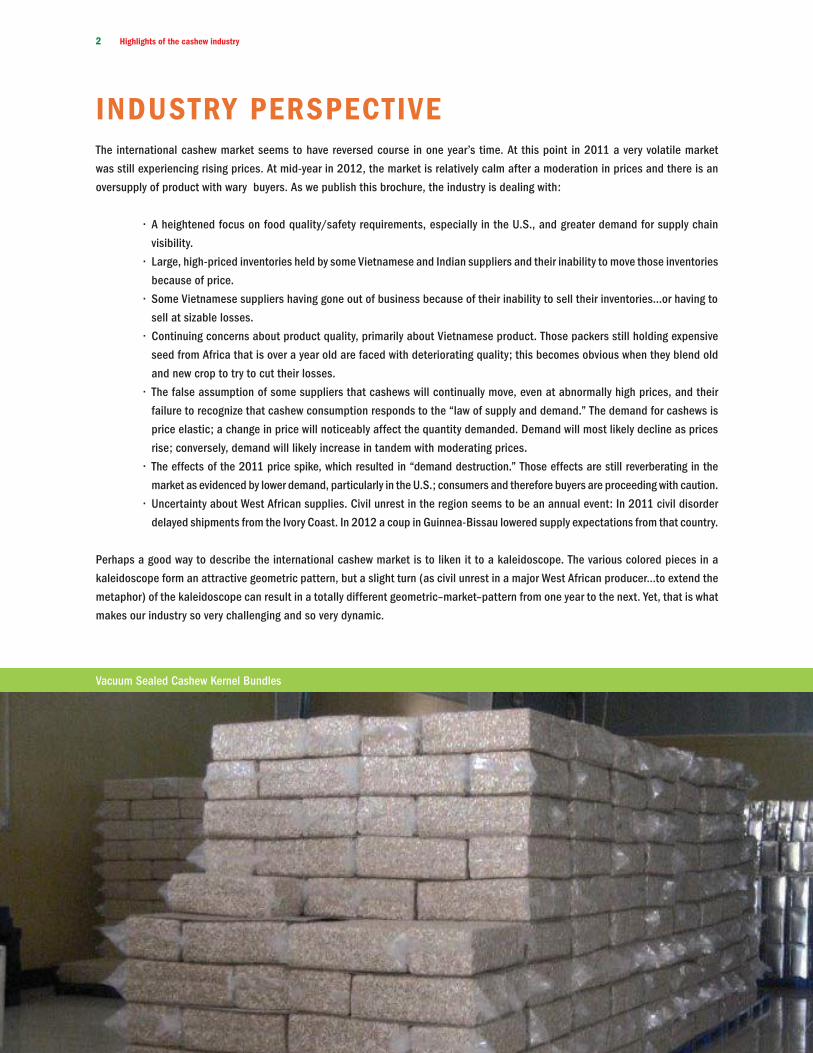
Vacuum Sealed Cashew Kernel Bundles
Red River Foods, Inc. July 2012 3
QUALITY & FOOD SAFETY FIRSTProduct quality and food safety are paramount in the U.S., underscored by the passage of the Food Safety and Modernization Act
(FSMA) by Congress in December 2010 and enacted into law in January 2011. The U.S. Food and Drug Administration (FDA) is the
administering agency. The Act is predicated on the principle of prevention of food safety problems, shifting the FDA’s attention away
from reaction and response. The FDA has been charged with establishing requirements for preventive controls, produce safety, and a
foreign supplier verifi cation program. Facilities will be required to implement controls consistent with the internationally recognized
principles of Hazard Analysis and Critical Control Points (HACCP). Growers of fresh produce must also establish preventive measures
for the safe production and harvesting of fruits and vegetables. Regarding imported foods, an offi cial of the FDA noted in April 2012
that “rather than placing primary reliance on FDA inspectors detecting and correcting problems at the port of entry, importers must
manage their supply chains to ensure the safety of imported foods. (Emphasis Added) FSMA makes importers accountable for
verifying, in a manner transparent to FDA, that the food they import has been produced in accordance with U.S. standards, or under
modern preventive controls that provide the same level of public health protection.” As of April of this year, the proposed rules for these
measures were in the fi nal review stage.
As of June 2012, the FDA’s website cited specifi c requirements applicable to importers:
• Importers must perform supplier verifi cation activities to ensure imported food is safe.
• The FDA can refuse admission to imported food if the foreign facility or country refuses to allow an FDA inspection.
• The FDA can require certifi cation, based on risk criteria, that the imported food is in compliance with food safety requirements.
• The FDA is directed to establish a voluntary program through which an importer may receive expedited review of his
shipments if the importer has taken certain measures to assure the safety of the food.
The key for importers in meeting the new FDA requirements is product traceability. Anticipating such requirements, Red River has
partnered with SourceAgent, an internet-based traceability system. SourceAgent allows a supplier and importer to establish an ID
number and barcode for complete supply chain visibility and traceability. Suppliers complete an on-line form to include such information
as Product Type, Production Date, Shipment Date and Details, and Packaging Data. Our supply chain partners have immediate access
to Microbiological Analysis, Certifi cates of Analysis and Quality, Bills of Lading, Non-GMO Statements, etc. Our suppliers also have the
ability to house important “supplier specifi c” documents including Product Specifi cations; Kosher, HACCP, ISO, BRC Certifi cations; and
Third Party Audits. Full details of the Red River/Source Agent system can be viewed at www.SourceAgent.com.

JA
N FE
B
MAR
APR
MAY
JUN
JULA
UG
S E P
O C T
NO
V
DEC
Brazil
East Africa
India
Vietnam/W. Africa
FLOWERING
FLOWERING
FLOW
ERIN
GFL
OWER
ING
HARVESTING
HARV
ESTIN
G
HARV
ESTI
NG
HARVESTINGHARVESTING
HARVESTINGHARVESTING
4 Highlights of the cashew industry
The world cashew trade is balanced on the annual cashew production cycle. Short or poor crops anywhere or abnormal weather
conditions distort the trade pattern, most importantly affecting prices. Vietnam produces the year’s fi rst crop, and shortly thereafter
India’s crop comes in. At approximately the same time, West African crops are being harvested. Harvest of the Brazilian, East African,
and Indonesian crops begins in August/September, tying the trade over until the new crops of Vietnam, India, and West Africa are
harvested early the following year.
Beyond the unpredictable effects weather might
have on production and ultimately the trade, other
factors affect the international market. Rising Indian
domestic consumption has drawn down the amount
of kernels available to the trade as Indian exports
decline. With only limited processing capabilities,
Africa exports the bulk of its raw seed to India and
Vietnam. Yet, when there is political instability in West
Africa, some disruption in the trade is assured. Like
the civil disorder in the Ivory Coast early in 2011, a
military coup in Guinea-Bissau in early 2012 cast
much doubt over the availability of a good portion of
West African raw seed. In Guinea-Bissau itself, bank
closures dried up the supply of money, halting the
movement of much of the crop.
THE PRODUCTION CYCLE
Maturing Cashews

Red River Foods, Inc. July 2012 5
HARVESTING SEASONSHarvesting seasons are generally similar in the producing countries, depending on their location relative to the equator. Countries
north of the equator, including India, Vietnam, and producers in West Africa, harvest from early in the calendar year to approximately
mid-year. Countries south of the equator, including Brazil and producers in East Africa, harvest from September or October to early in
the following calendar year.
Cashew Seed Spread for Drying in Vietnam
end of season
beginning of season Jan Feb Mar Apr May Jun Jul Aug Sep Oct Nov Dec
India
Vietnam
Benin
Guinea-Bissau
Ivory Coast
Nigeria
Togo
Mali
Ghana
Burkina Faso
Senegal
The Gambia
Brazil
Mozambique
Tanzania
Kenya
Indonesia

6 Highlights of the cashew industry
R A W P R O D U C T I O N T R E N D SThe edible cashew kernel is encased within a kidney-shaped seed or pod at the bottom of a cashew “apple” (The “apple” is actually a stem.) Cashews are not harvested in the conventional sense. Once the cashew apple falls to the ground, the cashew seed is removed from the apple. Cashew seeds are gathered and taken to various collection points. From there they are delivered to a processing facility. After drying, the cashew kernel is separated from the seed either mechanically or by hand. Where mechanical separation takes place, primarily in Brazil, there is a higher percentage of broken grades.
Cashew production is extremely diffi cult to estimate, and production estimates have to be offered with numerous caveats. Crop size estimates for any one producing country can vary widely because of the inherent diffi culties in accounting for output. Crops are harvested from trees growing in their natural habitat, as there are few plantations in most countries. Cross-border activity, particularly in West Africa, prohibit accurate counting by country in that region. Further, there is little processing in West African countries, hence there are few factory sources from which reasonable estimates can be made. Cashew seeds are not weighed during any of the collecting, buying, or transfer stages. After being gathered and brought to a series of collection points, the cashews are delivered to processors. The crop size is frequently estimated after the raw cashews have been processed and some indication of average kernel weight has been ascertained. Thus, raw cashew estimates are often extrapolations from processing outcomes…as well as the “best guesses” of those active in the industry.
0
500
1,000
1,500
2,000
2,500
3,000
1990 1995 2000 2005 2010 2008 2009 2010 2011 2012E
Millio
n K
gs
Year
Asia East Africa West Africa Cent/So Amer
source: Red River, Industry, FAO
Estimated World Raw Cashew Production by Major Region
Cashew Apples

Red River Foods, Inc. July 2012 7
Estimated World Raw Cashew Production by Major Origins and Regions
0
500
1,000
1,500
2,000
2,500
3,000
2000 2001 2002 2003 2004 2005 2006 2007 2008 2009 2010 2011 2012P
Mill
ion
K
gs
Calendar Year
source: Red River; Industry, FAO
source: Red River; Industry, FAO
India Vietnam Brazil East Afr West Afr Other
World raw cashew production is estimated at 2,334 million kgs for 2012, essentially the same as the 2011 estimate of 2,353 million
kgs. It is of note that the 2011 and 2012 levels are about 900 million kgs above output just ten years ago when 2002 production
was estimated at 1,447 million kgs. In 2011, West Africa produced an estimated 767 million kgs on the strength of a very large 385
million kg crop in the Ivory Coast. Crop estimates have varied for West Africa this year, but at the time of this writing, the region is
expected to produce 800 million kgs, 30+ million kgs above 2011 production. Sizable declines in production for 2012 are expected
in India, Vietnam, Indonesia, and Tanzania. These should be somewhat offset by increases in Brazil, Guinea-Bissau, and Ghana. For
2012, the fi ve major producers (India, Ivory Coast, Vietnam, Brazil, and Guinea-Bissau) are expected to account for over 70 percent of
all production. West Africa by itself would represent one-third of the world total.
R A W P R O D U C T I O N T R E N D S CONTINUED
Other210
Ivory Coast380
India554Vietnam
280
Mozambique70
Brazil265
Indonesia125
Guinea-Bissau160
Benin85
Tanzania120
Nigeria85
Est World Raw Cashew Production 2012Selected Countries, Million Kgs
2,334 Million Kgs

8 Highlights of the cashew industry
CASHEW PROCESSINGThe method of cashew processing varies by country and often by factory within the producing origins. The accompanying chart depicts the general sequence of the raw seed/kernel processing. Once at the factory, the raw nuts are spread out so they may be sun-dried. Here the movement of the cashew faces a major hurdle: wet weather or cloudy weather will damage the nut and/or at least delay processing. Inside the factory, the nuts are hydrated and heated to soften the shell in preparation for the actual shelling. Common methods of heating include steam, drum, and hot oil heating. Shelling is performed mechanically or by hand. Most shelling in Brazil is done mechanically, which produces proportionately more broken grades. Most shelling in Vietnam, India, and Africa is done manually, hence outturn in those countries has a higher proportion of whole grades.
N.B.: Cashew processing varies by country of origin and by factory. This chart is intended to display a general overview of how cashews are processed prior to shipment.
* This is often referred to as “moisturizing”** Industry sources sometimes refer to this step as “roasting.” Actual roasting prior to sales for consumption
is done at roasting operations in the U.S. and other consuming countries.
IN-SHELL
PRODUCT
SHELLED
PRODUCT
HARVESTING
COLLECTING
SUN DRYING AT FACTORY
HYDRATING*
HUMIDIFICATION
HEATING**
DRUM
SHELLING
PEELING
GRADING
CLEANING
PACKAGING
SHIPPING
MANUAL
OPEN PAN HOT OIL
MECHANICAL
CLEANING

Red River Foods, Inc. July 2012 9
CASHEW GRADING Cashews are graded into three general categories, based on size and condition: (1) White Wholes, (2) White Pieces, and (3) Scorched. White Wholes are graded according to size while White Pieces are sorted according to the way in which the kernels were broken. Scorched cashews are sorted according to the coloration or blemishing of the whole kernel or kernel piece. The accompanying chart summarizes the grading of kernels for export. (There are other whole grades, e.g., w360, w380, that “fi t” between these major grades.)
CASHEW GRADES GENERAL CATEGORIES
w180w210w240w280w320w450
Super large ; between 140 and 180 kernels per lbBetween 190-210 kernels per lbBetween 230-240 kernels per lbBetween 270-280 kernels per lbBetween 300-320 kernels per lbBetween 400-450 kernels per lb
WHITE WHOLE GRADES
PiecesSmall PiecesBitsButtsSplits
Kernel broken across the section of the nutKernel broken across the section of the nut, but smallerVer y small piecesKernel broken cleanly at the tip of the nutKernel broken lengthwise
WHITE BROKEN GRADES
WholesButtsSplitsPieces
Whole kernels slightly scorchedButt pieces scorchedSplit pieces scorchedPieces, excepting ver y small pieces, scorched
SCORCHED GRADES
Estimated Amount of Export-Quality Kernelsproduced by major processors/exporters
per metric ton of raw cashew nuts
Senegal
Nigeria, Kenya
Mozambique
Guinea Bissau, Togo
Processing Country Country of Origin kgs
India (Kerala State) 250
India (Country) 230
India Indonesia 240
240
230
230
220
200
Brazil Brazil 210
Vietnam Vietnam 230
Ivory Coast, Benin
source: Industry
The adjacent table displays the estimated average amounts (in kgs) of exportable grade kernels produced per metric ton from the three major exporting countries. These percentages may vary from year to year and even during the same season because of weather conditions, the quality of the seed, the time of the season when the crop is being processed, and the capabilities of the processor.
In India, for example, each metric ton of raw cashew seed produced and processed in that country yields, on average, about 230 kgs (23 percent) of exportable grade kernels. Thus, if an Indian crop were 600,000 metric tons of raw cashew nuts, and we applied the percentage yield for the country as a whole, the approximate outturn would be about 138 million kgs of exportable grade wholes and pieces.

Generally, cashew kernel yields range from about 20 to 24 percent. Thus, one metric ton of raw cashews can yield between 200 and 240 kgs of edible kernel wholes and pieces after processing, depending on country of origin. A crop that yields 1 million kgs of cashew kernels, for example, might be estimated to have been 4.2 to 5.0 million kgs of raw seed production.
Because processing methods differ between Brazil on the one hand and India and Vietnam on the other, the percentage of whole/broken grades between Brazil and the other two major origins vary widely. (These percentages result after peeling losses and rejects are discounted.) The high percentage of broken grades in Brazil is the result of mechanical processing. Because most processing in India and Vietnam is done by hand, processing in those countries yields a higher percentage of whole grades.
10 Highlights of the cashew industry
U.S. IMPORTS FOR CONSUMPTIONCashews remain by far the single largest segment of U.S.
shelled tree nut imports for consumption. As displayed in
the table which follows, cashews consistently represent
about two-thirds of all U.S. shelled tree nut imports for
consumption. In 2011, cashew imports were about 105
million kgs, the lowest import total since 102 million
kgs arrived in the U.S. in 2003. U.S. cashew imports for
consumption in 2011, displayed in the accompanying
pie chart, are representative of various nut import
shares since the mid-1990s. (N.B.: The pie chart does
not include tree nuts imported and shelled in the U.S.,
primarily pecans, or brazil nuts.) For the fi rst fi ve months
of 2012, cashew imports were 41.6 million kgs vs. 43.5
million kgs during the same period in 2011. If the pace of
imports during 2012 mirrors that of 2011, total imports
for the year could be about 100 million kgs, considerably
below the pace of the years 2004 through 2010.
U.S. Tree Nut Imports 2011Shelled weight in million kgs
Filberts3.0
Brazils7.4
Macs 7.4Chesnuts 3.8
Pine Nuts0.7
Pecans20.4
Other7.1
Cashews104.8
source: U.S. Department of Agriculture154.6 Million Kgs
Estimated Percentage of Whole and Broken Gradesproduced by major processors/exporters
per metric ton of export kernels
73%
53%
75%
27%
47%
25%
Vietnam
Brazil
India
Whole Brokensource: Industry

Red River Foods, Inc. July 2012 11
In the early 1990s, the U.S. imported 50-60 million kgs
of cashews annually, all from India and Brazil. In the
ten years from 1990 through 1999, total U.S. cashew
imports from all origins were just under 600 million kgs,
an annual average of 60 million kgs. However, in the
eleven years from 2000 to 2011, total imports soared
to 1,301 million kgs, an average of 118 million kgs
annually. During those eleven years, Vietnam accounted
for 525 million kgs of the 1,301 million kg total, or
40 percent. India, earlier the principal source of U.S.
cashews, accounted for 434 million kgs total or one-third
of all imports over the same time period.
The graph below displays the trend of U.S. cashew
imports from the major origins since 1990. Imports
from Brazil have remained relatively steady, ranging
from 19 to 32 million kgs, while imports from India
and Vietnam have trended in opposite directions since
2007. India commanded over 50 percent of the U.S.
import market until 2002, but that percentage slipped
as Vietnamese exports increased. India’s share fell to
just under 40 percent in 2006 and was about 26 percent
in 2009 and 2010. India’s share did rebound in 2011
to 35 percent. Vietnam has been the main source of
U.S. cashew imports since 2007, even though imports
from Vietnam fell from 58.3 to 47.5 million kgs between
2010 and 2011.
U.S. Cashew Imports for Consumptionfrom India, Vietnam, and Brazil
Calendar Year
0
20
40
60
80
100
120
140
1991 1992 1993 1994 1995 1996 1997 1998 1999 2000 2001 2002 2003 2004 2005 2006 2007 2008 2009 2010 2011
Millio
n K
gs
India Vietnam Brazil Othersource: U.S. Department of Agriculture
Source: U.S. Department of Agriculture
N.B.: 1. “Other” includes Almonds, Pistachios, Walnuts, and “Not Elsewhere Specifi ed (NES)”
2. Pine Nuts appear to be underreported for both 2010 and 2011
125.5 112.3 117.0 119.1 104.8 71% 65% 68 % 70 % 68 % 18.7 26.5 22.6 17.3 20.4 11% 15% 13 % 10 % 13 % 10.9 8 .5 9.6 11.4 7.4 6 % 5% 6 % 7% 5% 6.7 6.8 6.9 7.3 7.4 4% 4% 4% 4% 5% 4.1 4.1 4.9 4.9 3.8 2% 2% 3 % 3 % 2% 3.7 4.6 2.2 3.3 3.0 2 % 3 % 1% 2 % 2 % 4.3 5.2 3.1 1.2 0.7 2 % 3 % 2 % 1% 0 % 3.8 6.0 6.2 6.0 7.1 2% 3 % 4% 4% 5% 177.7 174.0 172.5 170.5 154.6
Cashews
Pecans
Brazils
Macadamias
Chestnuts
Filberts
Pinenuts
Other
Total
2007 2008 2009 2010 2011
U.S. Shelled Tree Nut ImportsMillion Kgs and Percent of Total

12 Highlights of the cashew industry
U.S. IMPORTS CONTINUED
$0.00
$1.00
$2.00
$3.00
$4.00
$5.00
$6.00
$7.00
$8.00
$9.00
$10.00
0
10
20
30
40
50
60
70
1991 1992 1993 1994 1995 1996 1997 1998 1999 2000 2001 2002 2003 2004 2005 2006 2007 2008 2009 2010 2011
Av
g C
IF V
al P
er
Kg
Millio
n K
gs
India Vietnam Brazil India Vietnam Brazil
U.S. Cashew Imports for Consumption & Avg CIF Values Per Kgfrom India, Vietnam, and Brazil
Source: U.S. Department of Agriculture
The graph below depicts annual import volumes from each of the three major origins--Brazil, India, and Vietnam--and the average annual
CIF values of those imports. Average CIF values from all three origins trended upward from 2003 to reach their peak values in 2011.
2010 2011 2012
Year / Month
$0.00
$1.00
$2.00
$3.00
$4.00
$5.00
$6.00
$7.00
$8.00
$9.00
$10.00
0
2
4
6
8
10
12
14
16
Jun Jul Aug Sep Oct Nov Dec Jan Feb Mar Apr May Jun Jul Aug Sep Oct Nov Dec Jan Feb Mar Apr May
Av
g C
IF V
al P
er
Kg
Me
tric
To
ns
U.S. Monthly Cashew Imports for Consumptionmetric tons & avg CIF values per kg
Source: U.S. Department of AgricultureMT Avg CIF Val/Kg
The high prices of 2011, which included a peak total monthly average CIF import value of $9.41 during September, have eased during the past few months. The lower prices at origin are refl ected in the March, April, and May 2012 average CIF import values, which ranged from $7.41 to $7.49 per kg.

Raw seed imports into India have been on the increase over the past decade as domestic demand has been rising. This has been fueled by higher per capita and disposable incomes among a growing middle class. The result has been expanded use of cashews as ingredients in confectioneries, bakery products, and cuisines. Some estimates put the annual rate of increase in domestic consumption at more than 10 percent. Higher domestic consumption has been accompanied by a general decline in exports in the past few years. Imports fi rst surpassed exports during 2003-2004 and with only two exceptions, 2004-2005 and 2011-2012, have done so in all years since then.
The manner in which the Indian cashew situation is evolving is affecting the entire international market. With less product available from India for export, the industry must look to additional sources of raw product, and Africa is garnering much attention as that other source.
Red River Foods, Inc. July 2012 13
India Raw Cashew Imports, Production, and Exports
0
100
200
300
400
500
600
700
800
900
01-02 02-03 03-04 04-05 05-06 06-07 07-08 08-09 09-10 10-11 11-12
Millio
n K
gs
Indian Financial Year 1 Apr - 31 Mar
Imports Production Exports
Source: Indian Ministry of Agriculture, IndustryN.B.: 1. All data are in RCN 2. Exports estimated under assumption that raw to kernel yield is 0.23 3. Export data represent exports from all ports
INDIA
A sample of Indian cashew imports...They may not arrive in a bag labeled “cashews”!Sun drying raw seed in India

14 Highlights of the cashew industry
BRAZIL Brazilian production levels have been unstable for the last eight to nine years, reaching 300 or more million kgs in some years (2005,
2007, and 2009) and then falling off 50 to 100 million kgs in subsequent years. Two successive short crops occurred in 2010 and 2011,
reaching a low of 155 million kgs last year. The uncertainty surrounding production levels has led Brazilian processors to seek additional
supplies in West Africa. Because of the extremely short Brazilian 2010/2011 crop, exports declined dramatically last year, registering
only 26 million kgs, the lowest total since 24 million kgs were exported in 1999. The 2011 export total represented a 38 percent drop
from the 42 million kgs exported in 2010. Exports to the U.S. were down nearly 8 million kgs and exports to the European Union were
off by 3 million kgs. Yet, the U.S. and EU continued to account for roughly 60 and 20 percent of all Brazilian exports, respectively.
Brazil Cashew Kernel Exports in million kgs
Calendar Year
0
5
10
15
20
25
30
35
40
2000 2001 2002 2003 2004 2005 2006 2007 2008 2009 2010 2011
Millio
n K
gs
USA Canada EU 15/25/27 OtherSource: Brazilian IndustryN.B.: 1. The EU consisted of 15 countries thru 2003; in 2004 membership increased
to 25 countries; in 2007 membership increased to 27 countries.
Sorting Cashews in Brazil
Red River Foods, Inc. July 2012 15
Vietnamese Cashew Exportsby region/country
N.B.: Middle East includes TurkeySource: Industry
Source: Industry
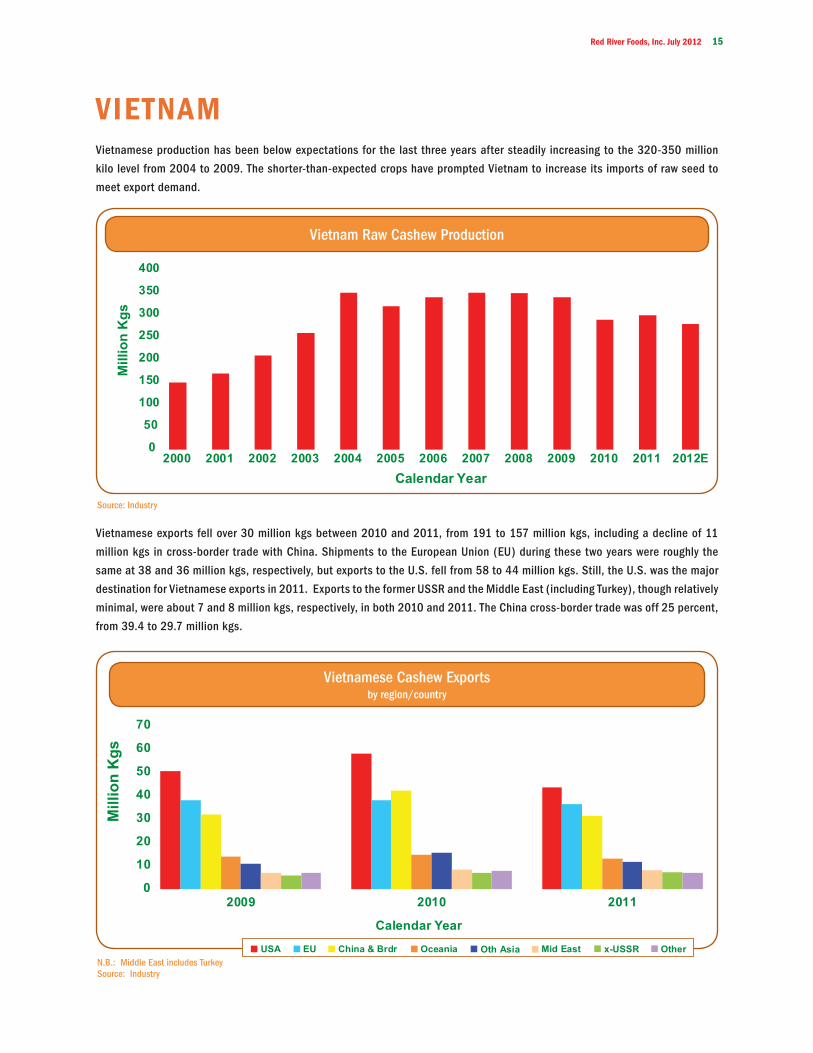
VIETNAMVietnamese production has been below expectations for the last three years after steadily increasing to the 320-350 million
kilo level from 2004 to 2009. The shorter-than-expected crops have prompted Vietnam to increase its imports of raw seed to
meet export demand.
Vietnam Raw Cashew Production
0
50
100
150
200
250
300
350
400
2000 2001 2002 2003 2004 2005 2006 2007 2008 2009 2010 2011 2012E
Millio
n K
gs
Calendar Year
USA EU China & Brdr Oceania Oth Asia Mid East x-USSR Other
Vietnamese exports fell over 30 million kgs between 2010 and 2011, from 191 to 157 million kgs, including a decline of 11
million kgs in cross-border trade with China. Shipments to the European Union (EU) during these two years were roughly the
same at 38 and 36 million kgs, respectively, but exports to the U.S. fell from 58 to 44 million kgs. Still, the U.S. was the major
destination for Vietnamese exports in 2011. Exports to the former USSR and the Middle East (including Turkey), though relatively
minimal, were about 7 and 8 million kgs, respectively, in both 2010 and 2011. The China cross-border trade was off 25 percent,
from 39.4 to 29.7 million kgs.
0
10
20
30
40
50
60
70
2009 2010 2011
Millio
n K
gs
Calendar Year

16 Highlights of the cashew industry
VIETNAM CONTINUED
Vietnamese export grades continue to consist of
70+ percent wholes and about 27 percent pieces.
Excluding the cross-border trade with China,
white wholes accounted for about 70 percent
of Vietnamese exports in 2011; within this
category 320s, 240s, and 450s represented 48,
17, and 5 percent, respectively, of all exports.
Lightly blemished, scorched, and dessert wholes
combined accounted for only 3 percent of total
exports, down from 10 percent in 2009 and 6
percent in 2010. Large pieces were 9 percent
and splits 13 percent. Exports of 320s as a
percentage of total exports rose from 41 percent
in 2009 to 44 percent in 2010 before reaching
48 percent in 2011.
Vietnam Cashew Exports by GradeMillion Kgs & Percent Total
96.1 71% 110.3 73 % 93.0 73 % 37.8 28 % 39.6 26 % 33.9 26 % 1.0 1% 1.2 1% 0.6 1%134.9 151.1 127.5
WholesPiecesOtherTotal
Mn Kgs % Mn Kgs % Mn Kgs %
2009 2010 2011
Source: Vietnamese IndustryN.B.: 1. “Pieces” includes Splits and Butts. 2. Excludes Cross-Border trade with China: 28.6 mn kgs in 2009, 39.4 mn kgs in 2010,
and 29.7 mn kgs in 2011.
Vietnamese Exports by Grade 2011Million Kgs
LBW, SW, DWs4.4
320s60.8
Pieces, Butts17.3
Other0.5
Splits16.6
450s5.9
240s21.5
Oth Ws0.5
N.B.: Excludes China Cross-Border trade of 29.7 million kgs127.5 Million Kgs
Hand cracking cashew seed in Vietnamese factory Peeling and grading in Vietnamese factory
Red River Foods, Inc. July 2012 17
AFRICAAFRICAN CASHEW ALLIANCEMEMBERS
WestBenin
Burkina FasoGhanaGuinea
Guinea-BissauIvory Coast
MaliNigeriaSenegal
The GambiaTogo
EastKenya
MozambiqueTanzania
Benin
Kenya
Burkina Faso
Madagascar
Ghana
Mozambique
Guinea
Tanzania
Guinea-Bissau
Ivory Coast
Mali
Nigeria
Senegal
The GambiaTogo
Cashew seedlings, an African investment in Africa’s Cashew future
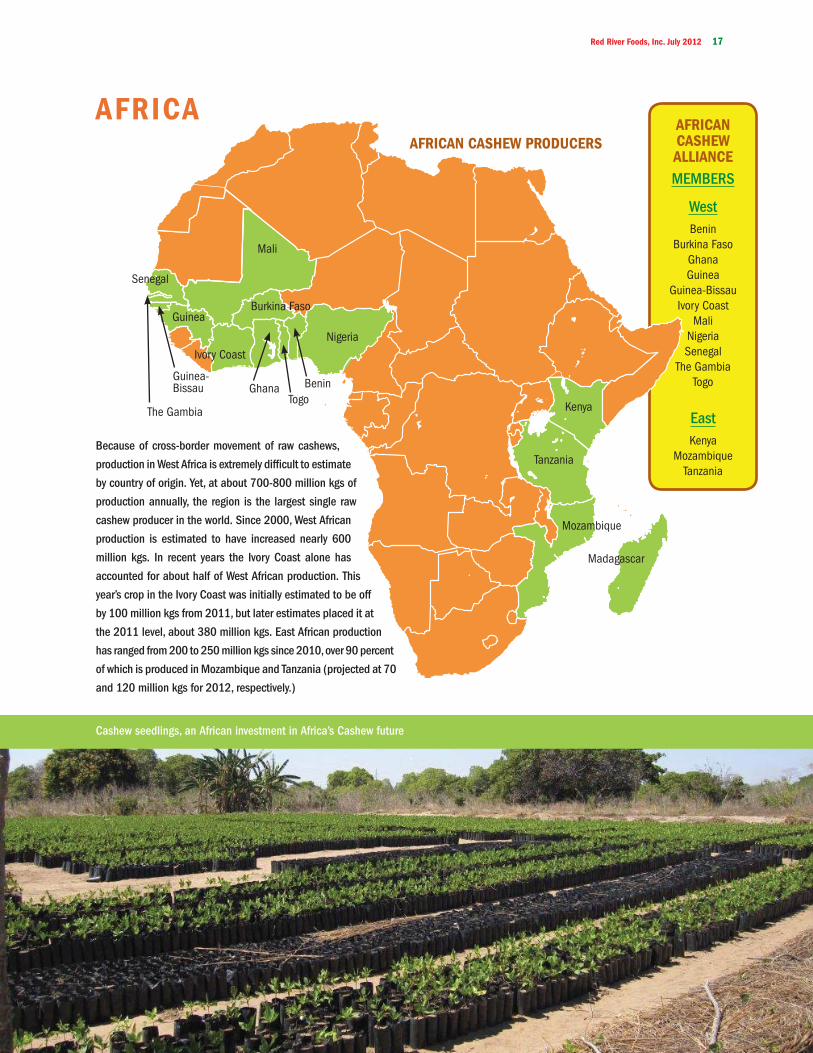
Because of cross-border movement of raw cashews,
production in West Africa is extremely diffi cult to estimate
by country of origin. Yet, at about 700-800 million kgs of
production annually, the region is the largest single raw
cashew producer in the world. Since 2000, West African
production is estimated to have increased nearly 600
million kgs. In recent years the Ivory Coast alone has
accounted for about half of West African production. This
year’s crop in the Ivory Coast was initially estimated to be off
by 100 million kgs from 2011, but later estimates placed it at
the 2011 level, about 380 million kgs. East African production
has ranged from 200 to 250 million kgs since 2010, over 90 percent
of which is produced in Mozambique and Tanzania (projected at 70
and 120 million kgs for 2012, respectively.)
AFRICAN CASHEW PRODUCERS
18 Highlights of the cashew industry
AFRICA CONTINUED
The African cashew industry is not yet “on the verge” of rapid expansion, but the industry’s accelerating interest—and investment--in
both West and East Africa, portends growth in all sectors of the African cashew market, from production to processing to export. Growing
domestic consumption in Asia (primarily India and China) and the annual uncertainties of crop sizes/quality in major origins caused
by weather variations have led the industry to seek additional sources of supply—and Africa is the logical source of new supplies.
The African industry requires long-term investment in value-added infrastructure, from growing and harvesting to processing and
marketing. For at least the next few years, the lack of processing capacity will remain the single biggest hurdle that must be overcome
in the African industry. The bulk of African production is processed in India and Vietnam. Only about 10 percent of the production
in West Africa is now processed in that region. For the 200-250 million kgs produced in East Africa, processing capacity is variously
estimated at 35 to 50 million kgs, with most of that in Mozambique.
Numerous parties are working to build the African cashew industry. The African Cashew Alliance (ACA) is the focal point for individual
companies; non-profi ts; and various government agencies, including the U.S. Peace Corps. The ACA was organized in 2005 and is
headquartered in Accra, Ghana. The general goal of the ACA is to promote the African cashew industry, with a particular focus on
expanding the processing sector and improving quality. The Alliance’s objectives are: (1) to Increase the processing of cashews in
Africa, (2) to improve competitiveness and sustainability of the African cashew industry, and (3) to facilitate public-private cooperation
for the cashew sector.
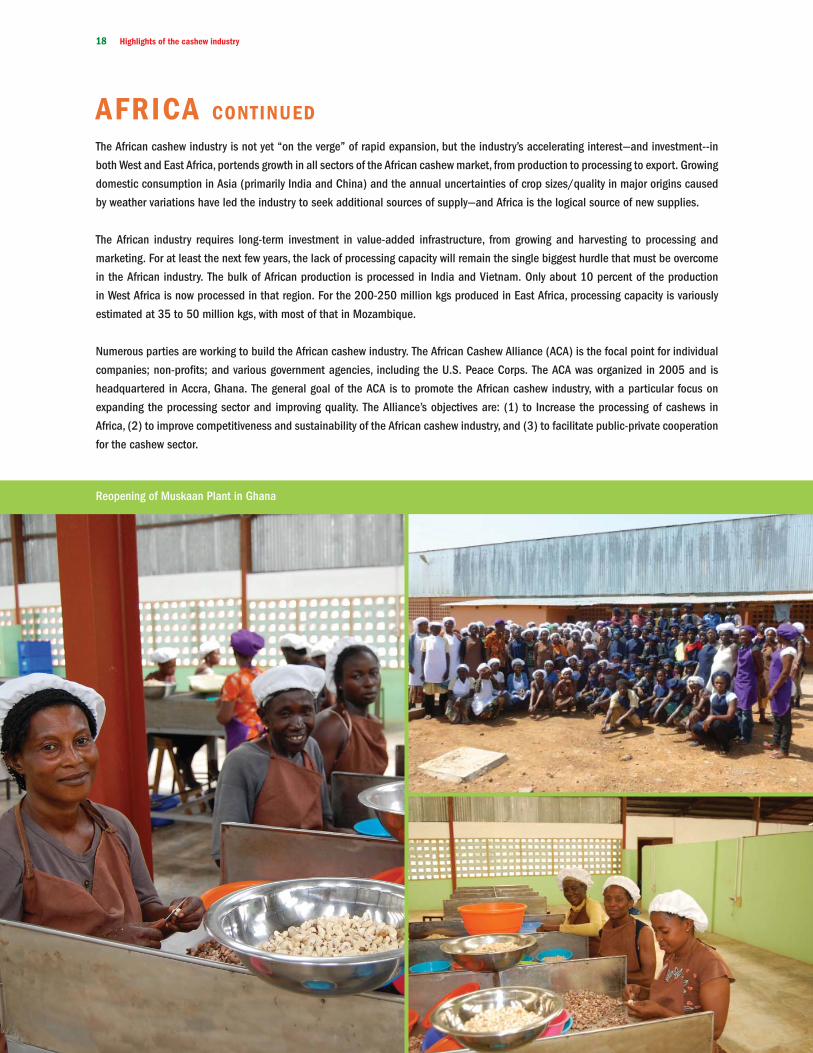
Reopening of Muskaan Plant in Ghana

Red River Foods, Inc. July 2012 19
Drying Yard in Africa
African Landscape
In 2009 the ACA helped steer a $25 million grant from the Gates Foundation to Benin, Burkina Faso, Ivory Coast, Ghana, and Mozambique
for development of their respective industries. Later that year the Alliance received a grant from USAID/West Africa to assist cashew
entrepreneurs in the region obtain access to fi nancing. In March 2012 the ACA, the US Agency for International Development Trade
Hub, and the African Investors Management Services Ltd on the one hand and the Nigerian Export Import Bank and Ecobank (a regional
commercial bank) on the other reached an agreement to obtain access to fi nancing for three Nigerian processing fi rms. In all of these
instances the ACA has been a convenient and effective facilitator, helping to move the African cashew industry forward.
RED RIVER regards Africa to be of rapidly growing importance as a source of raw cashew product. Red River is a recent entrant
into the developing African cashew industry, having established business operations in West Africa. Red River has employed an
individual particularly experienced in Ghana’s cashew operations, from horticultural to port activities. With an offi ce in Sunyani,
Ghana, he represents Red River’s growing interests in the entire West African region. As another measure of interest in playing a role
in the African sector of the industry, Red River has joined the Advisory Board of the African Cashew Alliance. (The Advisory Board
provides strategic advice to the Alliance’s Executive Committee and Secretariat). Red River is excited about participating in these
new developments in the world’s single largest cashew producing region.

20 Highlights of the cashew industry
USD/Kg
$10.00 $9.77
$9.50
$9.00
$8.50$8.20
$8.00$8.02
$8.07
$7.50 $7.41
$7.00 $7.10
$6.50 $6.35$6.11
$6.00
$5.62 $5.67 $5.82$5.51$5.50
$5.00$4.92$4.63$4.78 $4.54
$4.50 $4.67$4.32$4.25
$4.43$4.30 $4.25$4.00 $4.19
$3.86$3.73
$3.50 $3.66Janthru
Jun2000 2001 2002 2003 2004 2005 2006 2007 2008 2009 2010 2011 2012
Estimated Avg Monthly FOB Price Ranges—Cashews W320s in USD/kg
source: Industry
PRICE RANGES/VOLATILITY The one constant feature of the international cashew market in the past few years has been price volatility. This is illustrated not only by high prices but also by the varying price ranges between the monthly average low and high FOB export prices each year. In the six years from 2000 through 2006, the average FOB monthly low-high price range for W320s was estimated at $.89 per kg. In the fi ve years from 2007 through 2011, the estimated monthly average low-high price range was an estimated $1.86 per kg.
After shifting upward in 2004 and 2005, average monthly FOB export prices fell back in 2006 as supplies increased. However, prices began to increase again in mid-2007 as Vietnamese and Indian shippers delayed and then defaulted on their contracts. By year’s end, the average monthly FOB export price had risen to nearly $5.70 per kg. By mid-2008, prices had surged to $7.40 per kg. The causes were numerous: a short crop in Brazil; new and inexperienced processors in Vietnam; and Vietnamese/Indian defaults, demands for renegotiated contracts, and shipping delays. However, monthly average prices did fall back to just under $5.00 per kg by the fi nal months of 2008. Prices began another upward swing in mid-2009 and continued through 2011. By December 2011, the average monthly FOB export price for W320s was nearly $9.80 per kg, a record high, making the price range for the year $1.70. The average monthly low-high price range for the January to March 2012 period was only $0.15 per kg ($7.10-$7.25), but jumped to $1.10 per kg ($7.10-$8.20) for the January to June 2012 period because of higher prices during May.

Red River Foods, Inc. July 2012 21
The accompanying graph displays the estimated quarterly average FOB export price movement of W320 cashews since 1998. The price spike in 1999—which now seems to have been minor when compared with the price spike in 2011--was caused by crop shortfalls and processors contracting in advance for more product than they were able to deliver. Many processors defaulted on their commitments, leaving importers with an eleventh hour need to fulfi ll their own obligations. The result was extremely strong demand which led to intense upward pressure on prices. The price plunge in 2000 refl ected higher worldwide supplies. The estimated average quarterly prices fell to about $4.40 per kg by 2001, and remained at historic lows, between $3.75 and $4.20 per kg, through 2003. Thus, the market was relatively stable for these three years. Cashew prices began increasing in early 2004 in part because Indian packers sought higher prices. The Indian example was followed by Vietnamese packers. The price increase was also a refl ection of the higher prices being paid for all nut products. By the end of 2004 and early 2005 the estimated average FOB quarterly price was $5.30 per kg. Prices began to decline in late 2005 and from then until mid-2007 the estimated monthly price ranged from about $4.30 to $4.60 per kg. This relatively low price in the fi rst two quarters of 2007 was attributed in part to the sale of large quantities of India’s 2006 crop to make way for the even bigger 2007 crop of 620 million kgs.
Prices rose sharply beginning in mid-2007, reached a quarterly high of more than $6.90 per kg in the second quarter of 2008, matching the 1999 price peak, and then began to abate. The jump in prices originated with Vietnamese shippers. Faced with higher than expected raw cashew prices, some delayed and then defaulted on shipments, forcing buyers to bid up prices. Yet, what goes up must come down, and by the last quarter of 2008, the average quarterly FOB price had declined to just above $5.00 per kg. Prices began increasing again in mid-2009, exceeding $6.00 per kg by the end of that year, accelerated to $7.60 during the last quarter of 2010, and surged to an estimated quarterly average of $9.75 per kg in the third quarter of 2011.
The causes of the unprecedented increases in 2011 were many: shortfalls in both the Vietnamese and Brazilian crops, rising Indian domestic consumption, higher African raw seed prices, and continued strong world demand. Beyond these pressures, however, has been the recurring problem of Vietnamese and Indian suppliers defaulting on and delaying shipments to obtain higher prices as markets have risen. This effort to extract higher than agreed-upon prices has backfi red on some suppliers because they have not been able to move the high-priced inventories they have accumulated, and some have gone out of business as a result. The abnormally high prices in 2011 have resulted in a decline in U.S. consumption, readily apparent in the lower U.S. import totals in 2012. Yet, this is to be expected, for U.S. demand responds to price changes. In turn, this led to a decline in prices in late 2011 and generally continued into 2012. Some Indian and Vietnamese suppliers still have not fully understood this relationship between their high prices and U.S. demand.
PRICE TRENDS
$0.00$1.00$2.00$3.00$4.00$5.00$6.00$7.00$8.00$9.00
$10.00$11.00
1 2 3 4 1 2 3 4 1 2 3 4 1 2 3 4 1 2 3 4 1 2 3 4 1 2 3 4 1 2 3 4 1 2 3 4 1 2 3 4 1 2 3 4 1 2 3 4 1 2 3 4 1 2 3 4 1 2 3 498 99 00 01 02 03 04 05 06 07 08 09 10 11 12
Est A
vg F
OB E
xp P
rice
/ Kg
Year / Quarter
w320s—Estimated Quarterly Average Export Prices FOB Origin in USD/kg
source: Industry

22 Highlights of the cashew industry
CASHEW INDUSTRY TIMELINE
Vie
tnam
ese,
Indi
an
pric
es b
egin
pric
es ri
se s
harp
ly;
FOB
Braz
ilian
proc
esso
rs b
egin
crop
s
Avg
FO
B ex
port
pric
es d
eclin
eA
vg F
OB
expo
rtex
port
peak
Jun
08
Est C
ash
Rese
arch
Ctr
Ann
ual in
crea
ses
of c
ashe
w im
ports
into
the
U.S.
USA
ID g
rant
sBr
azil c
rop
very
Moz
ambi
que
Gat
es F
dn
$146
m to
Afr
Vie
tnam
ese
raw
cas
hew
impo
rts in
crea
se d
ram
atic
ally
;
Vie
tnam
ese,
Indi
an d
efau
ltsan
d sh
ippi
ng
Moz
ambi
que
cash
see
dlin
gs,
to g
row
3 m
n +
Vie
tnam
proc
essi
ng fi
rms
pric
e se
ed a
reho
ldin
g hi
gh
forc
ed o
ut o
f
Larg
e un
sold
Vie
tnam
redu
ces
impo
rtta
x on
raw
Indi
a ex
ports
dec
line
20
11
rem
ain
in
Afr
ica,
Vie
tnam
Ivor
y Co
ast
civi
l war
fare
inve
ntor
ies
thre
aten
s, d
elay
s
Afr
ican
Gui
nea-
Biss
auha
rves
t del
ayed
by c
oup
d'et
at
for e
xpan
sion
3 Ni
geria
npr
oces
sing
firm
sob
tain
fina
ncin
g
belo
w g
ov s
et p
rice
leve
ls;
inve
ntor
ies
build
qual
ity o
f Ind
ian,
Vie
tnam
ese
U.S
. im
ports
fluc
tuat
e: d
eclin
e 13
% in
200
5, fl
at in
200
6 at
114
m k
gs, r
ise
to 1
25 m
n kg
s in
200
7, fa
ll to
115
mn
kgs
in 2
008,
incr
ease
to 1
17 a
nd 1
19 m
n kg
s in
200
9 an
d 20
10; f
all t
o 10
4 m
n kg
s in
201
1; a
bout
100
mn
kgs
fore
cast
for 2
012
20
12
U.S.
Foo
d Sa
fety
incr
easi
ngca
paci
ties
Tanz
raw
see
d pr
ices
fall
& M
od'z
'n A
ct
to a
id in
d ac
cess
to fi
nanc
ing
hit r
ecor
d hi
ghs
expo
rt pr
ices
crop
exp
orts
;le
ads
to h
igh
raw
see
d pr
ices
shor
t at 1
55 m
n
Rain
y w
eath
erth
reat
ens
size
,pr
ice
incr
ease
sA
vg F
OB
dela
y; c
ause
sha
rpsh
ippe
rs d
efau
lt,
Var
ious
eff
orts
by
inte
rnat
iona
l gov
ernm
ent o
rgan
izat
ions
and
NG
Os
to in
stitu
te c
ashe
w s
uppl
y ch
ain
orga
niza
tion
and
cash
ew p
roce
ssin
g in
Afr
ican
pro
duce
rs.
20-2
5 m
n kg
sA
fric
an c
ashe
win
dust
rypr
ocur
ing
seed
from
Wes
t Afr
ica
estim
ated
at
Vie
tnam
bec
omes
2nd
larg
est k
erne
lexporter,
sur
pass
ed
in V
ietn
am
Early
200
7
20
08
expo
rts to
U.S
.or
gani
zing
cas
hew
inte
rest
s in
20
01
certa
in n
uts
stoc
ks in
Indi
a,
impo
rts ri
se fm
70
mn
kgs
in 2
005
to 4
04 m
n kg
s in
201
0
U.S.
FDA
Vie
tnam
expo
rts a
t new
reco
rd le
vel:
Man
u, b
uyer
s in
crea
se e
mph
asis
on
qual
ity
Shar
p FO
B
FOB
expo
rt
Peak
yea
r for
Afr
ican
191
mn
kgs
20
05
USA
ID
spon
sors
hip
20
06
prod
uctio
n A
fric
an C
ashe
w A
llianc
e be
gins
crop
, exp
orts
do
wn
35%
;
20
07
proc
essi
ng b
egin
sfa
ll as
mkt
Vie
t rec
over
s;
Braz
il
year
for B
razi
lto
hel
p de
velo
pPe
ak e
xpor
tpr
oces
sing
cap
unce
rtain
ties
fm C
ambo
dia
for
in 2
006
and
first
hal
f 200
7
cash
ew p
rod
mid
-200
5; re
mai
n re
lativ
ely
flat
lead
to s
urpl
us
Indi
a ra
w im
ports
incr
ease
fm 3
94 m
n kg
s in
200
2 to
reco
rd 7
28 m
n kg
s in
200
9; a
t 644
mn
kgs
in 2
010
and
leve
l
Allia
nce
reco
rd le
vels
by y
ear e
nd
incr
ease
s; a
tM
ajor
qua
lity
form
ed u
nder
coun
tries
to in
crea
se
proc
essi
ng, a
dd p
rodu
ct v
alue
2009
; ris
e, fa
ll,flu
ctua
te e
arly
proc
essi
ng;
labo
r iss
ues
slow
Vie
t
expo
rt pr
ices
Avg
FO
B
auth
oriz
es
heal
th b
enef
itcl
aim
s fo
r
20
04
20
03
dela
ys
drop
sha
rply
Vie
tnam
ese
fm 4
00 m
n kg
s
Cash
ew
crop
redu
ced
20
10
rebo
und
FOB
pric
es
Braz
ilby
hea
t; es
tlo
wer
ed to
300
20
09
larg
est c
ashe
wpr
oduc
er
cash
ew n
uts
pric
es re
ach
Ivor
y Co
ast
beco
mes
2nd
Som
e V
ietn
ames
e pr
oces
sors
busi
ness
new
reco
rd le
vels
prob
lem
s em
erge
385
mn
kgs
reco
rd le
vel
Vie
tnam
cro
pV
ietn
am
expo
rts a
t ex
port
pric
e be
low
sta
ndar
d
to in
crea
se s
harp
ly
Indi
a ra
w c
ashe
w
seco
nd la
rges
t
incr
easi
ng
122
mn
kgs
expo
rt pr
ices
reco
rded
cash
ew producer,
U.S.
impo
rts:
131
milli
on k
gs
kern
el im
ports
beg
in
Avg
FO
B ex
port
pric
es d
eclin
edr
amat
ical
ly fr
om p
eak
1999
leve
ls
to re
boun
d
Vie
tnam
bec
omes
surp
asse
d on
ly b
yPe
ak e
xpor
t ye
ar fo
r Ind
ia:
20
00
20
02
Moz
ambi
que
Obj
ectiv
e is
to e
stab
lish
cash
ew e
nter
pris
es s
o lo
cal p
opul
atio
ns m
ay re
aliz
e fin
anci
al b
enef
its fr
om a
ddin
g va
lue
to th
e ca
shew
rath
er th
an s
impl
y ex
porti
ng th
e ra
w m
ater
ial.
only
by
Indi
a
Incr
ease
s Fe
dera
l ove
rsig
ht
of fo
od im
ports
Moz
ambi
que
Indi
a
Hist
oric
ally
low
avg
FO
B or
igin
ACA
hel
ps6,
000
hect
ares
fact
ory
reco
rd e
xpor
ts
ACA
Qua
lity &
Sust
aina
bility
Se
al to
Ben
in
proc
essi
ng
Vie
tnam
leas
eses
t at 3
5 m
n kg
s
Cash
Allia
nce
gran
ts $
25 m
n

PRODUCTION ESTIMATES in mill ion kgsR
eg
ion
/
Co
un
try
2000
2001
2002
2003
2004
2005
2006
2007
2008
2009
2010
2011
2012E
Asia
C
am
bo
dia
10
.02
0.0
25
.03
0.0
35
.04
0.0
45
.05
0.0
50
.05
0.0
60
.06
0.0
60
.0
In
dia
52
0.0
45
0.0
47
0.0
50
0.0
53
5.0
54
4.0
57
3.0
62
0.0
66
5.0
69
5.0
61
3.0
65
3.0
55
4.0
In
do
ne
sia
69
.99
1.6
11
0.2
10
6.9
13
1.0
13
5.1
14
9.2
15
4.8
15
7.4
15
5.0
14
5.0
14
2.0
12
5.0
P
hilip
pin
es
10
.11
0.0
10
.01
0.1
10
.01
0.0
10
.01
1.3
11
.21
1.2
13
.51
3.5
13
.5
S
ri L
an
ka
4.7
6.2
6.4
6.5
6.5
6.2
6.0
6.0
6.0
6.0
6.0
6.0
6.0
T
ha
ila
nd
4.8
4.7
4.7
4.7
4.6
4.7
4.7
4.7
5.0
5.0
5.0
5.0
5.0
V
ietn
am
15
0.0
17
0.0
21
0.0
26
0.0
35
0.0
32
0.0
34
0.0
35
0.0
34
9.0
34
0.0
29
0.0
30
0.0
28
0.0
O
the
r1
2.0
12
.01
2.1
11
.91
2.0
12
.01
2.1
12
.01
2.1
12
.01
2.0
12
.01
2.0
Sub-
Tota
l, A
sia
781.
576
4.5
848.
493
0.1
1,08
4.1
1,07
2.0
1,14
0.0
1,20
8.8
1,25
5.7
1,27
4.2
1,14
4.5
1,19
1.5
1,05
5.5
Afr
ica
We
st
B
en
in3
0.0
35
.04
3.1
40
.04
3.0
43
.03
7.5
37
.54
5.0
10
0.0
70
.09
0.0
85
.0
G
ha
na
5.5
5.0
5.2
5.2
10
.01
0.0
10
.01
2.5
12
.51
2.5
12
.01
2.0
27
.0
G
uin
ea
-Bis
sa
u7
2.7
70
.07
0.0
75
.09
2.0
10
0.8
10
0.0
10
0.0
10
0.0
13
6.0
15
0.0
13
0.0
16
0.0
Ivo
ry C
oa
st
60
.01
00
.01
04
.81
20
.01
50
.02
00
.02
50
.02
90
.03
20
.03
50
.03
35
.03
85
.03
80
.0
N
ige
ria
30
.03
0.0
40
.05
0.0
50
.06
0.0
75
.08
0.0
81
.01
00
.07
0.0
85
.08
5.0
S
en
eg
al
6.8
3.2
4.0
6.0
8.5
12
.01
5.0
17
.52
0.0
20
.03
5.0
35
.03
0.0
O
the
r8
.18
.79
.21
1.5
14
.01
9.5
21
.82
2.0
23
.52
9.5
28
.02
9.5
37
.0
Sub-
Tota
l, A
fr W
213.
125
1.9
276.
330
7.7
367.
544
5.3
509.
355
9.5
602.
074
8.0
700.
076
6.5
804.
0
Afr
ica
Ea
st
K
en
ya
5.1
10
.14
.15
.25
.25
.21
.05
.05
.08
.51
1.0
8.0
9.0
M
ad
ag
as
ca
r4
.04
.04
.04
.04
.04
.04
.04
.04
.04
.04
.04
.04
.0
M
oza
mb
iqu
e5
2.6
52
.15
0.2
63
.84
2.3
10
4.4
62
.87
4.4
64
.29
5.0
11
3.0
64
.07
0.0
T
an
za
nia
12
1.2
12
2.3
67
.49
2.2
78
.67
1.9
77
.49
2.6
99
.17
5.0
12
0.0
15
7.0
12
0.0
Sub-
Tota
l, A
fr E
182.
918
8.5
125.
716
5.2
130.
118
5.5
145.
217
6.0
172.
318
2.5
248.
023
3.0
203.
0
La
tin
Am
eri
ca
B
razil
21
0.0
20
0.0
19
0.0
23
0.0
26
0.0
30
0.0
26
5.0
32
0.0
24
0.0
32
0.0
20
0.0
15
5.0
26
5.0
P
eru
2.7
2.5
2.1
2.2
2.4
2.2
2.2
2.3
2.3
2.3
2.1
2.3
2.0
O
the
r4
.24
.24
.64
.54
.34
.24
.34
.44
.54
.64
.64
.64
.6
Sub-
Tota
l, Lat
Am
216.
920
6.7
196.
723
6.7
266.
730
6.4
271.
532
6.7
246.
832
6.9
206.
716
1.9
271.
6
Wor
ld T
otal
1,39
4.4
1,41
1.6
1,44
7.1
1,63
9.7
1,84
8.4
2,00
9.2
2,06
6.0
2,27
1.0
2,27
6.7
2,53
1.6
2,29
9.2
2,35
2.9
2,33
4.1
N.B.
: Pr
oduc
tion
estim
ates
for a
ny o
ne c
ount
ry c
an a
nd o
ften
do v
ary
grea
tly.
Thus
, man
y es
timat
es h
ere
are
deriv
ed b
y ex
trapo
latio
n, in
terp
olat
ion,
and
“be
st g
uess
es,”
while
oth
er e
stim
ates
der
ived
from
kno
wn a
nd
relia
ble
sour
ces
are
reas
onab
ly a
ccur
ate.
Unt
il th
ere
is a
will
ingn
ess
on th
e pa
rt o
f res
pons
ible
indu
stry
and
gov
ernm
ent p
artie
s at
orig
in to
ven
ture
thei
r bes
t est
imat
es, t
he in
dust
ry w
ill b
e ha
mpe
red
in a
sses
sing
av
aila
ble
supp
lies.
Red River Foods, Inc. July 2012 23

24 Highlights of the cashew industry
NOTES:
Red River Foods is pleased to provide information about the world cashew trade. The information and data herein represent estimates from
a variety of sources as well as our own estimates. We wish to extend our grateful appreciation to the many individuals who helped make
this brochure possible by contributing to our research. The company makes no warranty about the accuracy of these data and assumes no
duty to update any materials contained in this report. Within the industry it is generally accepted that production, export, and other data
can be understated, overestimated, or even unreported.
Red River wishes to emphasize that unforeseen events caused by political, legal, economic, or other circumstances, as well as weather
conditions, could affect current expectations for any one market or for the world situation generally. Readers should not unduly rely on any
estimates, forward-looking statements, or data cited herein to reach conclusions or make decisions about the various markets or market prices.

Red River Foods , Inc .9020 Stony Po int Parkway
Sui te 380Richmond, V i rg in ia 23235
USA
te l— 804.320.1800 fax—804.320.1896 email—[email protected]