Embed Size (px)
Citation preview
JOSEPH P. SKURA
WORLDWIDE ANOMALOUS REFRACTION AND ITS EFFECTS ON ELECTROMAGNETIC WAVE PROPAGATION
Anomalous atmospheric refraction can cause serious problems with electromagnetic wave transmission. The term "anomalous" should not be understood to mean infrequent, especially at some locations where anomalous refraction is typical and standard refraction is abnormal. By studying meteorological data taken at a specific location, one can predict the types of anomalous propagation that will be present at that location.
INTRODUCTION
The term "anomalous" is often taken to mean abnormal, rare, deviant, or inconsistent with normal expectation. Anomalous microwave electromagnetic propagation is propagation that deviates from a defmed standard mode of propagation. In some global locations, however, anomalous propagation may be the normal condition because it is present most of the time, in which case the absence of anomalous propagation is abnormal.
At the earth's surface, the refractive index, n, of the atmosphere at radio wave frequencies ranges from 1.00024 to 1.00040. A more convenient unit is radio refractivity, N, which can be calculated from n by
N = (n - 1) X 106 • (1)
Radio refractivity is a function of atmospheric parameters calculated by
N = (77.6 / n x (P + 4810e/n , (2)
where P is the atmospheric pressure in millibars (1 mb = 100 Pa), T is the ambient temperature in kelvins, and e is the water vapor partial pressure in millibars.
In the "standard" atmosphere, temperature and humidity both decrease with altitude so that N decreases at a rate between 0 and 79 km - 1. This decrease in refractivity with altitude translates into an increase in the velocity of propagation with altitude, resulting in bending of electromagnetic waves toward the earth's surface, along curves with radii less than the radius of the earth.
If ambient temperature or humidity varies abnormally with altitude, N may decrease with height faster than would normally be expected or it may even increase with height. Depending on how rapidly N varies, such circumstances can cause anomalous propagation conditions. If N increases with height, subrefraction occurs and the rays will bend upward. If N decreases at a rate between
418
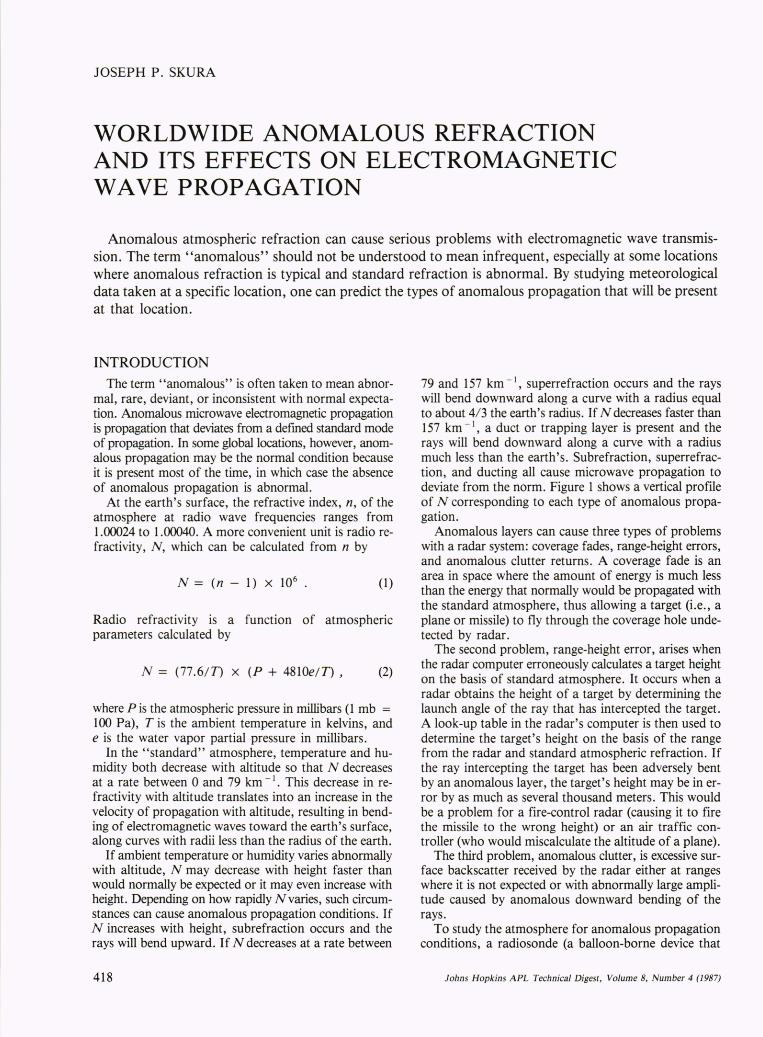
79 and 157 km - 1, superrefraction occurs and the rays will bend downward along a curve with a radius equal to about 4/ 3 the earth's radius. If N decreases faster than 157 km - 1, a duct or trapping layer is present and the rays will bend downward along a curve with a radius much less than the earth's. Subrefraction, superrefraction, and ducting all cause microwave propagation to deviate from the norm. Figure 1 shows a vertical profile of N corresponding to each type of anomalous propagation.
Anomalous layers can cause three types of problems with a radar system: coverage fades, range-height errors, and anomalous clutter returns. A coverage fade is an area in space where the amount of energy is much less than the energy that normally would be propagated with the standard atmosphere, thus allowing a target (i.e., a plane or missile) to fly through the coverage hole undetected by radar.
The second problem, range-height error, arises when the radar computer erroneously calculates a target height on the basis of standard atmosphere. It occurs when a radar obtains the height of a target by determining the launch angle of the ray that has intercepted the target. A look-up table in the radar's computer is then used to determine the target's height on the basis of the range from the radar and standard atmospheric refraction. If the ray intercepting the target has been adversely bent by an anomalous layer, the target's height may be in error by as much as several thousand meters. This would be a problem for a fire-control radar (causing it to fire the missile to the wrong height) or an air traffic controller (who would miscalculate the altitude of a plane).
The third problem, anomalous clutter, is excessive surface backscatter received by the radar either at ranges where it is not expected or with abnormally large amplitude caused by anomalous downward bending of the rays.
To study the atmosphere for anomalous propagation conditions, a radiosonde (a balloon-borne device that
fohn s Hopkins APL Technical Digest, Volume 8, Number 4 (1987)
1.0 ,---,---,---.-----.-------,.-------.
l1N = 0 km-1
0.8 -39 km-1 l Subrefractive
0.6
E ~ .... .!: Cl ·w
I 0.4
0.2
O~~~~_~_~_-L~A~ 260 280 300 320
Radio refractivity, N
Figure 1-A vertical profile of radio refractivity, N, showing the range of profile slopes that classify the three basic types of anomalous propagation.
records pressure, temperature, and humidity as functions of altitude) may be used to obtain the necessary data. In a program coordinated by the World Meteorological Organization (WMO), nations launch radiosondes from stations worldwide at least twice a day. From the resulting data, problems with propagation may be identified by calculating the N profile.
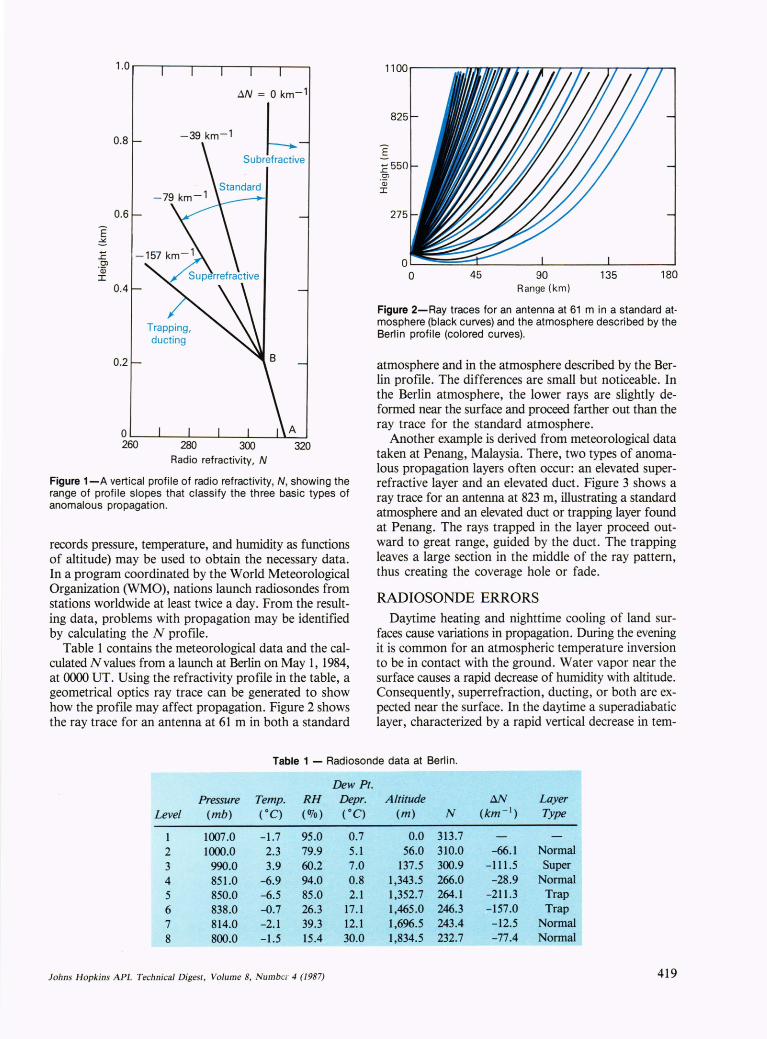
Table 1 contains the meteorological data and the calculated N values from a launch at Berlin on May 1, 1984, at 0000 UT. Using the refractivity profile in the table, a geometrical optics ray trace can be generated to show how the profile may affect propagation. Figure 2 shows the ray trace for an antenna at 61 m in both a standard
825
E 1: 550 Cl . iii
I
275
O~~~~~ __ ~ ______ L-____ ~ o 45 90 135 180
Range (km)
Figure 2-Ray traces for an antenna at 61 m in a standard at· mosphere (black curves) and the atmosphere described by the Berlin profile (colored curves).
atmosphere and in the atmosphere described by the Berlin profile. The differences are small but noticeable. In the Berlin atmosphere, the lower rays are slightly deformed near the surface and proceed farther out than the ray trace for the standard atmosphere.
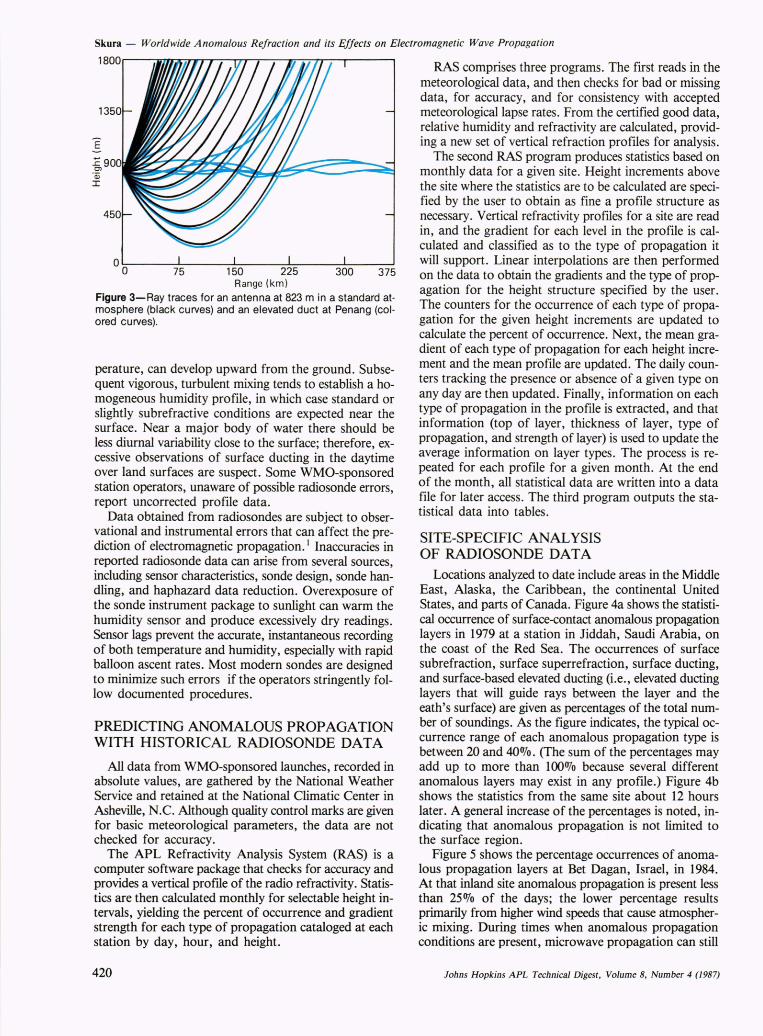
Another example is derived from meteorological data taken at Penang, Malaysia. There, two types of anomalous propagation layers often occur: an elevated superrefractive layer and an elevated duct. Figure 3 shows a ray trace for an antenna at 823 m, illustrating a standard atmosphere and an elevated duct or trapping layer found at Penang. The rays trapped in the layer proceed outward to great range, guided by the duct. The trapping leaves a large section in the middle of the ray pattern, thus creating the coverage hole or fade.
RADIOSONDE ERRORS Daytime heating and nighttime cooling of land sur
faces cause variations in propagation. During the evening it is common for an atmospheric temperature inversion to be in contact with the ground. Water vapor near the surface causes a rapid decrease of humidity with altitude. Consequently, superrefraction, ducting, or both are expected near the surface. In the daytime a superadiabatic layer, characterized by a rapid vertical decrease in tem-
Table 1 - Radiosonde data at Berlin.
Dew Pt. Pressure Temp. RH Depr. Altitude !IN Layer
Level (mb) ( °C) (%) ( °C) (m) N (km - I ) Type
1007.0 -1.7 95.0 0.7 0.0 313.7 2 1000.0 2.3 79.9 5.1 56.0 310.0 -66.1 Normal 3 990.0 3.9 60.2 7.0 137.5 300.9 -111.5 Super 4 851.0 -6.9 94.0 0.8 1,343.5 266.0 -28.9 Normal 5 850.0 -6.5 85.0 2.1 1,352.7 264.1 -211 .3 Trap 6 838.0 -0.7 26.3 17.1 1,465.0 246.3 -157.0 Trap 7 814.0 -2.1 39.3 12.1 1,696.5 243.4 -12.5 Normal 8 800.0 -1.5 15.4 30.0 1,834.5 232.7 -77.4 Normal
Johns Hopkins APL Technical Digest, Volume 8, Number 4 (1987) 419
Skura - Worldwide Anomalous Refraction and its Effects on Electromagnetic Wave Propagation
o~o------~------~----~------~----~ 75 150 225 300 375
Range (km)
Figure 3-Ray traces for an antenna at 823 m in a standard atmosphere (black curves) and an elevated duct at Penang (colored curves).
perature, can develop upward from the ground. Subsequent vigorous, turbulent mixing tends to establish a homogeneous humidity profile, in which case standard or slightly subrefractive conditions are expected near the surface. Near a major body of water there should be less diurnal variability close to the surface; therefore, excessive observations of surface ducting in the daytime over land surfaces are suspect. Some WMO-sponsored station operators, unaware of possible radiosonde errors, report uncorrected profile data.
Data obtained from radiosondes are subject to observational and instrumental errors that can affect the prediction of electromagnetic propagation. I Inaccuracies in reported radiosonde data can arise from several sources, including sensor characteristics, sonde design, sonde handling, and haphazard data reduction. Overexposure of the sonde instrument package to sunlight can warm the humidity sensor and produce excessively dry readings. Sensor lags prevent the accurate, instantaneous recording of both temperature and humidity, especially with rapid balloon ascent rates. Most modern sondes are designed to minimize such errors if the operators stringently follow documented procedures.
PREDICTING ANOMALOUS PROPAGATION WITH HISTORICAL RADIOSONDE DATA
All data from WMO-sponsored launches, recorded in absolute values, are gathered by the National Weather Service and retained at the National Climatic Center in Asheville, N.C. Although quality control marks are given for basic meteorological parameters, the data are not checked for accuracy.
The APL Refractivity Analysis System (RAS) is a computer software package that checks for accuracy and provides a vertical proflle of the radio refractivity. Statistics are then calculated monthly for selectable height intervals, yielding the percent of occurrence and gradient strength for each type of propagation cataloged at each station by day, hour, and height.
420
RAS comprises three programs. The first reads in the meteorological data, and then checks for bad or missing data, for accuracy, and for consistency with accepted meteorological lapse rates. From the certified good data, relative humidity and refractivity are calculated, providing a new set of vertical refraction profiles for analysis.
The second RAS program produces statistics based on monthly data for a given site. Height increments above the site where the statistics are to be calculated are specified by the user to obtain as fine a profile structure as necessary. Vertical refractivity proflles for a site are read in, and the gradient for each level in the profile is calculated and classified as to the type of propagation it will support. Linear interpolations are then performed on the data to obtain the gradients and the type of propagation for the height structure specified by the user. The counters for the occurrence of each type of propagation for the given height increments are updated to calculate the percent of occurrence. Next, the mean gradient of each type of propagation for each height increment and the mean profile are updated. The daily counters tracking the presence or absence of a given type on any day are then updated. Finally, information on each type of propagation in the profile is extracted, and that information (top of layer, thickness of layer, type of propagation, and strength of layer) is used to update the average information on layer types. The process is repeated for each profile for a given month. At the end of the month, all statistical data are written into a data file for later access. The third program outputs the statistical data into tables.
SITE-SPECIFI CANAL YSIS OF RADIOSONDE DATA
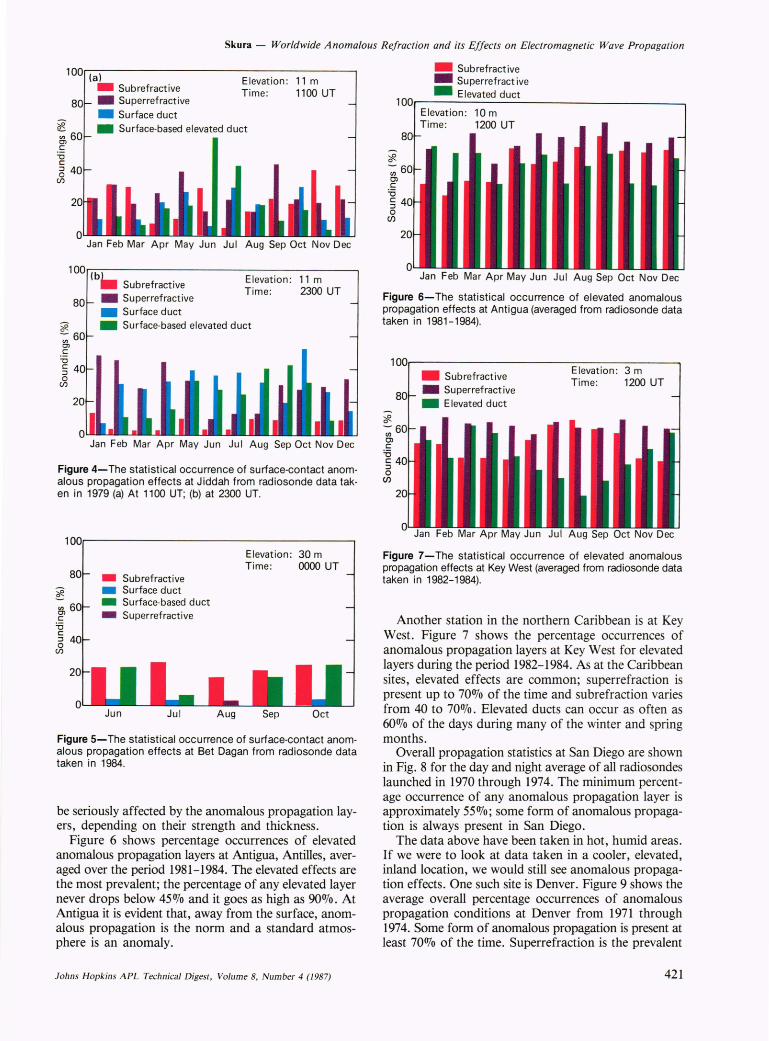
Locations analyzed to date include areas in the Middle East, Alaska, the Caribbean, the continental United States, and parts of Canada. Figure 4a shows the statistical occurrence of surface-contact anomalous propagation layers in 1979 at a station in Jiddah, Saudi Arabia, on the coast of the Red Sea. The occurrences of surface subrefraction, surface superrefraction, surface ducting, and surface-based elevated ducting (i.e., elevated ducting layers that will guide rays between the layer and the eath's surface) are given as percentages of the total number of soundings. As the figure indicates, the typical occurrence range of each anomalous propagation type is between 20 and 400/0 . (The sum of the percentages may add up to more than 100% because several different anomalous layers may exist in any profile.) Figure 4b shows the statistics from the same site about 12 hours later. A general increase of the percentages is noted, indicating that anomalous propagation is not limited to the surface region.
Figure 5 shows the percentage occurrences of anomalous propagation layers at Bet Dagan, Israel, in 1984. At that inland site anomalous propagation is present less than 25% of the days; the lower percentage results primarily from higher wind speeds that cause atmospheric mixing. During times when anomalous propagation conditions are present, microwave propagation can still
Johns Hopkins APL Technical Digest, Volume 8, Number 4 (1987)
Skura - Worldwide Anomalous Refraction and its Effects on Electromagnetic Wave Propagation
100 (al Elevation: 11 m _ Sub refractive
80 - Superrefractive Time : 1100 UT
o
80
~ :: 60 OJ C
l:J C ::l o
C/)
o
_ Surface duct
_ Surface-based elevated duct
Jan Feb Mar Apr May Jun Jul Aug Sep Oct Nov Dec
(bL _ Subrefractive _ Superrefractive _ Surface duct
Elevation: 11 m Time: 2300 UT
_ Surface-based elevated duct
Jan Feb Mar Apr May Jun Jul Aug Sep Oct Nov Dec
Figure 4-The statistical occurrence of surface-contact anomalous propagation effects at Jiddah from radiosonde data taken in 1979 (a) At 1100 UT; (b) at 2300 UT.
- Sub refractive _ Surface duct _ Surface-based duct
- Superrefractive
Jun Jul
Elevation: 30 m Time: 0000 UT
Aug Sep Oct
Figure 5-The statistical occurrence of surface-contact anomalous propagation effects at Bet Dagan from radiosonde data taken in 1984.
be seriously affected by the anomalous propagation layers, depending on their strength and thickness.
Figure 6 shows percentage occurrences of elevated anomalous propagation layers at Antigua, Antilles, averaged over the period 1981-1984. The elevated effects are the most prevalent; the percentage of any elevated layer never drops below 45070 and it goes as high as 90%. At Antigua it is evident that, away from the surface, anomalous propagation is the norm and a standard atmosphere is an anomaly.
fohn s Hopkins APL Technical Digest, Volume 8, Number 4 (1987)
- Subrefractive - Superrefractive - Elevated duct
10 m 1200 UT
Jan Feb Mar Apr May Jun Jul Aug Sep Oct Nov Dec
Figure 6-The statistical occurrence of elevated anomalous propagation effects at Antigua (averaged from radiosonde data taken in 1981-1984).
:::R. o
en 0> c :0 c ::l o en
_ Sub refractive _ Superrefractive _ Elevated duct
Elevation: 3 m Time: 1200 UT
Figure 7-The statistical occurrence of elevated anomalous propagation effects at Key West (averaged from radiosonde data taken in 1982-1984).
Another station in the northern Caribbean is at Key West. Figure 7 shows the percentage occurrences of anomalous propagation layers at Key West for elevated layers during the period 1982-1984. As at the Caribbean sites, elevated effects are common; superrefraction is present up to 70% of the time and subrefraction varies from 40 to 70%. Elevated ducts can occur as often as 60% of the days during many of the winter and spring months.
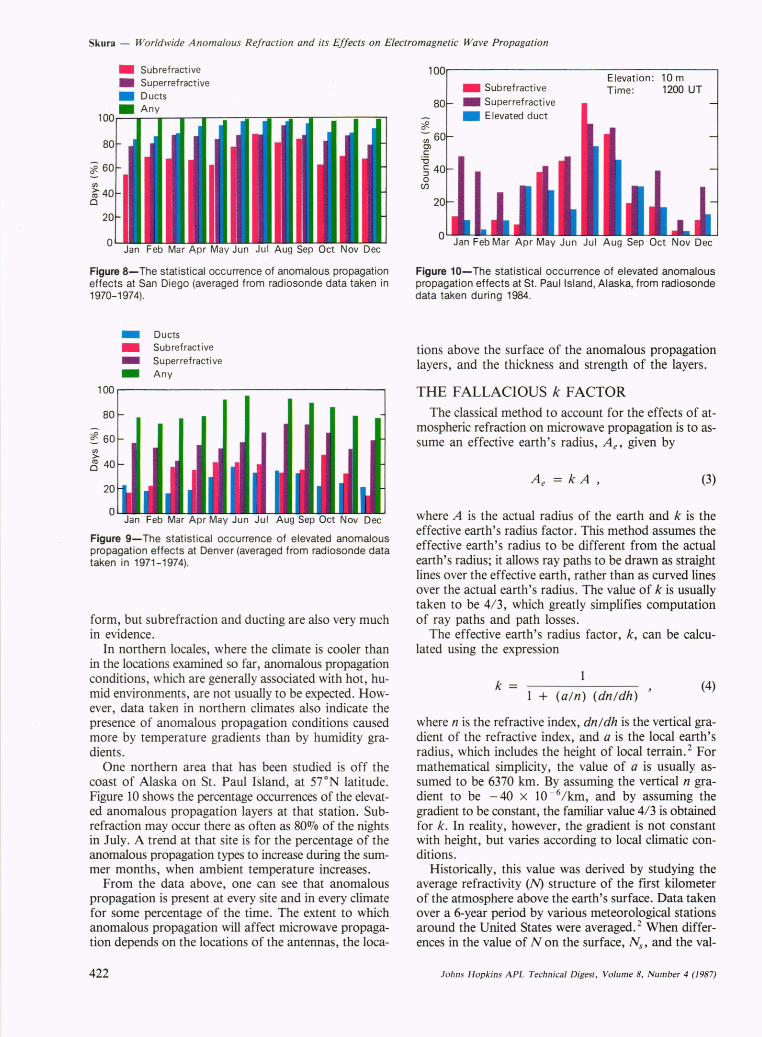
Overall propagation statistics at San Diego are shown in Fig. 8 for the day and night average of all radiosondes launched in 1970 through 1974. The minimum percentage occurrence of any anomalous propagation layer is approximately 55%; some form of anomalous propagation is always present in San Diego.
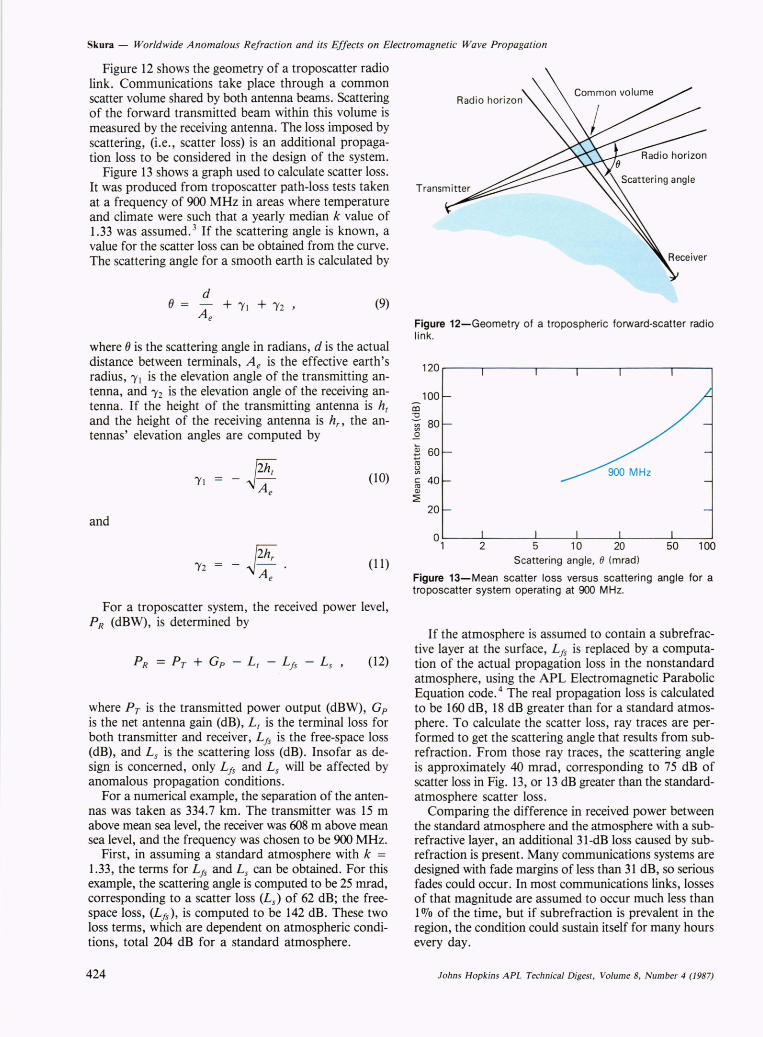
The data above have been taken in hot, humid areas. If we were to look at data taken in a cooler, elevated, inland location, we would still see anomalous propagation effects. One such site is Denver. Figure 9 shows the average overall percentage occurrences of anomalous propagation conditions at Denver from 1971 through 1974. Some form of anomalous propagation is present at least 70% of the time. Superrefraction is the prevalent
421
Skura - Worldwide Anomalous Refraction and its Effects on Electromagnetic Wave Propagation
_ Subrefractive _ Superrefractive _ Ducts
• Any 100~----------~~--.. -..-~-..-----~~~
(/)
~40 o
20
o Jan Feb Mar Apr May Jun Ju l Aug Sep Oct Nov Dec
Figure 8-The statistical occurrence of anomalous propagation effects at San Diego (averaged from radiosonde data taken in 1970-1974).
_ Ducts _ Sub refractive _ Superrefractive _ Any
100~----------------------------------~
80
~ 60 (/)
>-o 40
20
o
Figure 9-The statistical occurrence of elevated anomalous propagation effects at Denver (averaged from radiosonde data taken in 1971-1974).
form, but subrefraction and ducting are also very much in evidence.
In northern locales, where the climate is cooler than in the locations examined so far, anomalous propagation conditions, which are generally associated with hot, humid environments, are not usually to be expected. However, data taken in northern climates also indicate the presence of anomalous propagation conditions caused more by temperature gradients than by humidity gradients.
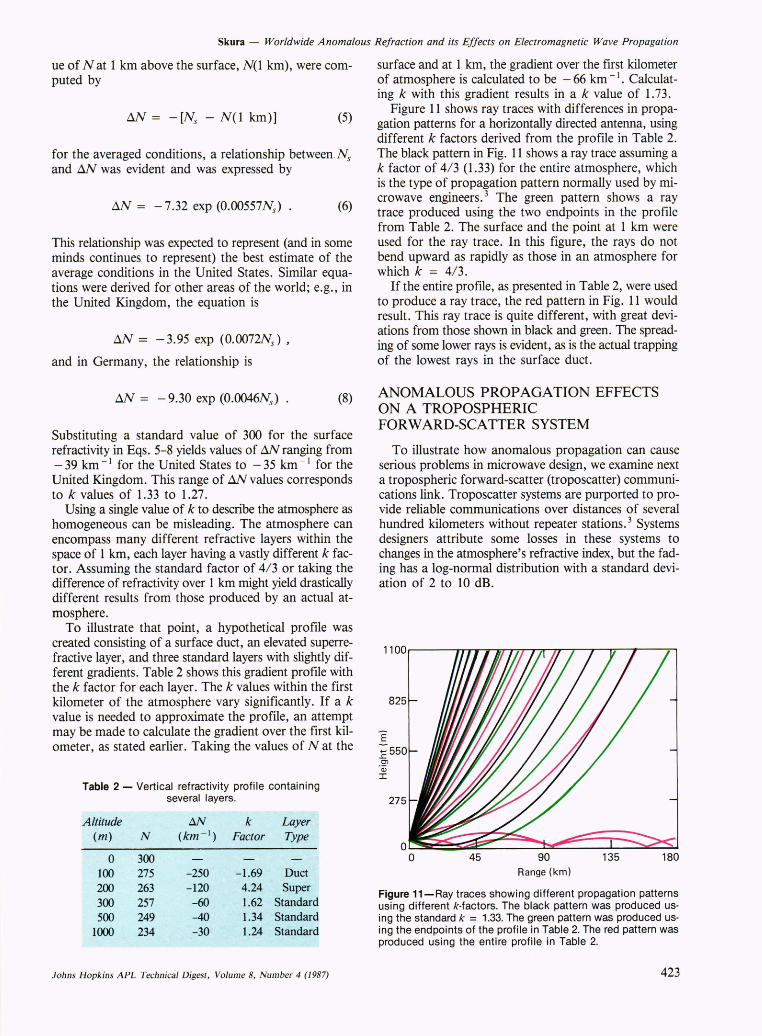
One northern area that has been studied is off the coast of Alaska on St. Paul Island, at 57 ON latitude. Figure 10 shows the percentage occurrences of the elevated anomalous propagation layers at that station. Subrefraction may occur there as often as 80% of the nights in July. A trend at that site is for the percentage of the anomalous propagation types to increase during the summer months, when ambient temperature increases.
From the data above, one can see that anomalous propagation is present at every site and in every climate for some percentage of the time. The extent to which anomalous propagation will affect microwave propagation depends on the locations of the antennas, the loca-
422
_ Sub refract ive _ Superrefract ive _ Elevated duct
Elevation: 10m Time: 1200 UT
Jan Feb Mar Apr May Jun Jul Aug Sep Oct Nov Dec
Figure 10-The statistical occurrence of elevated anomalous propagation effects at St. Paul Island, Alaska, from radiosonde data taken during 1984.
tions above the surface of the anomalous propagation layers, and the thickness and strength of the layers.
THE FALLACIOUS k FACTOR The classical method to account for the effects of at
mospheric refraction on microwave propagation is to assume an effective earth's radius, A e , given by
Ae = k A , (3)
where A is the actual radius of the earth and k is the effective earth's radius factor. This method assumes the effective earth's radius to be different from the actual earth's radius; it allows ray paths to be drawn as straight lines over the effective earth, rather than as curved lines over the actual earth's radius. The value of k is usually taken to be 4/3, which greatly simplifies computation of ray paths and path losses.
The effective earth's radius factor, k, can be calculated using the expression
1 k = 1 + (a/n) (dn/dh) , (4)
where n is the refractive index, dn/ dh is the vertical gradient of the refractive index, and a is the local earth's radius, which includes the height of local terrain. 2 For mathematical simplicity, the value of a is usually assumed to be 6370 km. By assuming the vertical n gradient to be - 40 x 10 - 6/km, and by assuming the gradient to be constant, the familiar value 4/3 is obtained for k. In reality, however, the gradient is not constant with height, but varies according to local climatic conditions.
Historically, this value was derived by studying the average refractivity (N) structure of the first kilometer of the atmosphere above the earth's surface. Data taken over a 6-year period by various meteorological stations around the United States were averaged. 2 When differences in the value of N on the surface, N s ' and the val-
Johns Hopkins APL Technical Digest, Volume 8, Number 4 (1987)
Skura - Worldwide Anomalous Refraction and its Effects on Electromagnetic Wave Propagation
ue of N at 1 km above the surface, N(1 km), were computed by
MY = - [Ns - NO km)] (5)
for the averaged conditions, a relationship between. N s and MY was evident and was expressed by
MY = - 7.32 exp (0.00557 NJ . (6)
This relationship was expected to represent (and in some minds continues to represent) the best estimate of the average conditions in the United States. Similar equations were derived for other areas of the world; e.g., in the United Kingdom, the equation is
MY = - 3.95 exp (0.OO72Ns ) ,
and in Germany, the relationship is
MY = - 9.30 exp (O.OO46Ns ) (8)
Substituting a standard value of 300 for the surface refractivity in Eqs. 5-8 yields values of MY ranging from - 39 km - 1 for the United States to - 35 km - 1 for the United Kingdom. This range of MY values corresponds to k values of 1.33 to 1.27.
Using a single value of k to describe the atmosphere as homogeneous can be misleading. The atmosphere can encompass many different refractive layers within the space of 1 km, each layer having a vastly different k factor. Assuming the standard factor of 4/3 or taking the difference of refractivity over 1 km might yield drastically different results from those produced by an actual atmosphere.
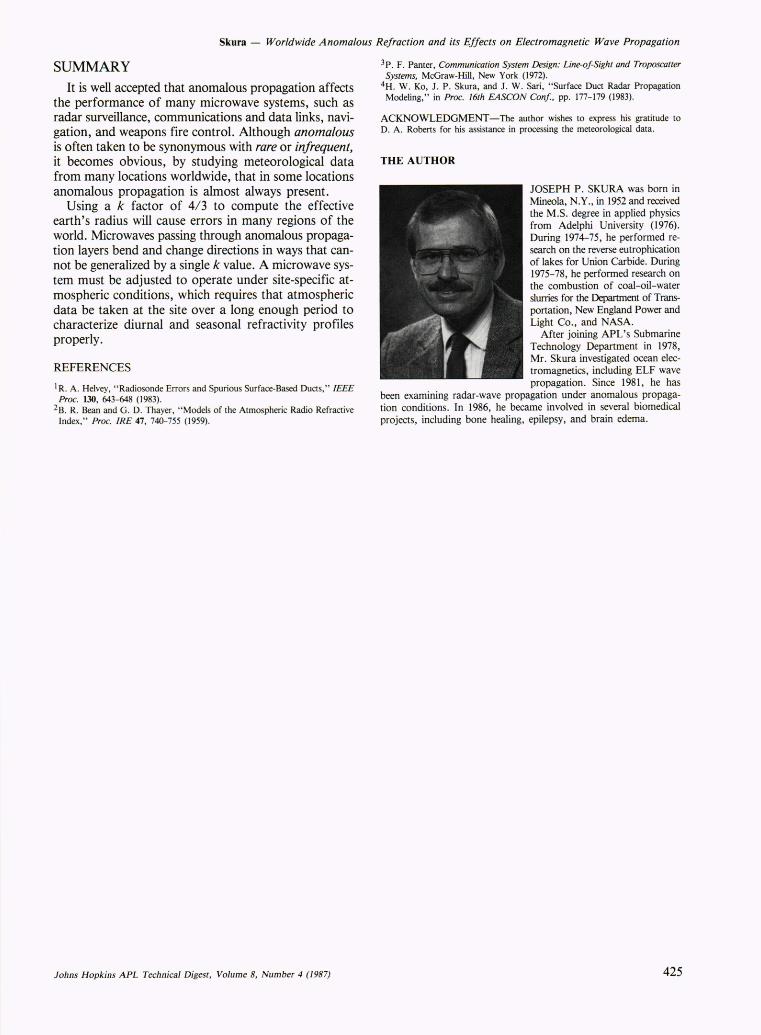
To illustrate that point, a hypothetical profile was created consisting of a surface duct, an elevated superrefractive layer, and three standard layers with slightly different gradients . Table 2 shows this gradient profIle with the k factor for each layer. The k values within the first kilometer of the atmosphere vary significantly. If a k value is needed to approximate the profile, an attempt may be made to calculate the gradient over the first kilometer, as stated earlier. Taking the values of N at the
Table 2 - Vertical refractivity profile containing several layers.
Altitude MY k Layer (m) N (km - l ) Factor Type
0 300 100 275 - 250 -1.69 Duct 200 263 - 120 4.24 Super 300 257 -60 1.62 Standard 500 249 -40 1.34 Standard
1000 234 -30 1.24 Standard
fohn s Hopkins APL Technical Digest, Volume 8, Number 4 (1987)
surface and at 1 km, the gradient over the flrst kilometer of atmosphere is calculated to be - 66 km - 1. Calculating k with this gradient results in a k value of 1.73.
Figure 11 shows ray traces with differences in propagation patterns for a horizontally directed antenna, using different k factors derived from the profile in Table 2. The black pattern in Fig. 11 shows a ray trace assuming a k factor of 4/3 (1.33) for the entire atmosphere, which is the type of propagation pattern normally used by microwave engineers. 3 The green pattern shows a ray trace produced using the two endpoints in the profile from Table 2. The surface and the point at 1 km were used for the ray trace. In this figure, the rays do not bend upward as rapidly as those in an atmosphere for which k = 4/ 3.
If the entire profIle, as presented in Table 2, were used to produce a ray trace, the red pattern in Fig. 11 would result. This ray trace is quite different, with great deviations from those shown in black and green. The spreading of some lower rays is evident, as is the actual trapping of the lowest rays in the surface duct.
ANOMALOUS PROPAGATION EFFECTS ON A TROPOSPHERIC FORWARD-SCATTER SYSTEM
To illustrate how anomalous propagation can cause serious problems in microwave design, we examine next a tropospheric forward-scatter (troposcatter) communications link. Troposcatter systems are purported to provide reliable communications over distances of several hundred kilometers without repeater stations. 3 Systems designers attribute some losses in these systems to changes in the atmosphere's refractive index, but the fading has a log-normal distribution with a standard deviation of 2 to 10 dB.
45 90 135 180 Range (km)
Figure 11-Ray traces showing different propagation patterns using different k·factors. The black pattern was produced usi ng the standard k = 1.33. The green pattern was produced using the endpoints of the profile in Table 2. The red pattern was produced using the entire profile in Table 2.
423
Skura - Worldwide Anomalous Refraction and its Effects on Electromagnetic Wave Propagation
Figure 12 shows the geometry of a troposcatter radio link. Communications take place through a common scatter volume shared by both antenna beams. Scattering of the forward transmitted beam within this volume is measured by the receiving antenna. The loss imposed by scattering, (i.e., scatter loss) is an additional propagation loss to be considered in the design of the system.
Figure 13 shows a graph used to calculate scatter loss. It was produced from troposcatter path-loss tests taken at a frequency of 900 MHz in areas where temperature and climate were such that a yearly median k value of 1.33 was assumed. 3 If the scattering angle is known, a value for the scatter loss can be obtained from the curve. The scattering angle for a smooth earth is calculated by
d () (9)
where () is the scattering angle in radians, d is the actual distance between terminals, A e is the effective earth's radius, 1'1 is the elevation angle of the transmitting antenna, and 1'2 is the elevation angle of the receiving antenna. If the height of the transmitting antenna is h( and the height of the receiving antenna is hr' the antennas' elevation angles are computed by
(10)
and
(11)
For a troposcatter system, the received power level, PR (dBW), is determined by
where PT is the transmitted power output (dBW), Gp
is the net antenna gain (dB), L( is the terminal loss for both transmitter and receiver, Lis is the free-space loss (dB), and L s is the scattering loss (dB). Insofar as design is concerned, only Lis and L s will be affected by anomalous propagation conditions.
For a numerical example, the separation of the antennas was taken as 334.7 km. The transmitter was 15 m above mean sea level, the receiver was 608 m above mean sea level, and the frequency was chosen to be 900 MHz.
First, in assuming a standard atmosphere with k = 1.33, the terms for Lis and Ls can be obtained. For this example, the scattering angle is computed to be 25 rnrad, corresponding to a scatter loss (Ls) of 62 dB; the freespace loss, (Lis )' is computed to be 142 dB. These two loss terms, which are dependent on atmospheric conditions, total 204 dB for a standard atmosphere.
424
Figure 12-Geometry of a tropospheric forward-scatter radio link.
120
100 co :£
80 '" '" ~ .... ~ 60 co ~ c 40 co Cll
~
20
0 1 2 5 10 20 50 100
Scattering angle, () (mrad )
Figure 13-Mean scatter loss versus scattering angle for a troposcatter system operating at 900 MHz.
If the atmosphere is assumed to contain a subrefractive layer at the surface, Lis is replaced by a computation of the actual propagation loss in the nonstandard atmosphere, using the APL Electromagnetic Parabolic Equation code. 4 The real propagation loss is calculated to be 160 dB, 18 dB greater than for a standard atmosphere. To calculate the scatter loss, ray traces are performed to get the scattering angle that results from subrefraction. From those ray traces, the scattering angle is approximately 40 mrad, corresponding to 75 dB of scatter loss in Fig. 13, or 13 dB greater than the standardatmosphere scatter loss.
Comparing the difference in received power between the standard atmosphere and the atmosphere with a subrefractive layer, an additional 31-dB loss caused by subrefraction is present. Many communications systems are designed with fade margins of less than 31 dB, so serious fades could occur. In most communications links, losses of that magnitude are assumed to occur much less than 1 % of the time, but if subrefraction is prevalent in the region, the condition could sustain itself for many hours every day.
fohn s Hopkins APL Technical Digest, Volume 8, Number 4 (1987)
Skura - Worldwide Anomalous Refraction and its Effects on Electromagnetic Wave Propagation
SUMMARY
It is well accepted that anomalous propagation affects the performance of many microwave systems, such as radar surveillance, communications and data links, navigation, and weapons fire control. Although anomalous is often taken to be synonymous with rare or infrequent, it becomes obvious, by studying meteorological data from many locations worldwide, that in some locations anomalous propagation is almost always present.
Using a k factor of 4/3 to compute the effective earth's radius will cause errors in many regions of the world. Microwaves passing through anomalous propagation layers bend and change directions in ways that cannot be generalized by a single k value. A microwave system must be adjusted to operate under site-specific atmospheric conditions, which requires that atmospheric data be taken at the site over a long enough period to characterize diurnal and seasonal refractivity profiles properly.
REFERENCES
1 R. A. Helvey, "Radiosonde Errors and Spurious Surface-Based Ducts," IEEE Proc. 130, 643-648 (1983).
2B. R. Bean and G . D. Thayer, " Models of the Atmospheric Radio Refractive Index," Proc. IRE 47, 740-755 (1959) .
fohns Hopkins APL Technical Digest, Volume 8, Number 4 (1987)
3p. F. Panter, Communication System Design: Line-oj-Sight and Troposcatter Systems, McGraw-Hill, New York (1972).
4H . w. Ko, 1. P. Skura, and 1. w. Sari, "Surface Duct Radar Propagation Modeling," in Proc. 16th EASCON Conj, pp. 177-179 (1983).
ACKNOWLEDGMENT-The author wishes to express his gratitude to D. A. Roberts for his assistance in processing the meteorological data.
THE AUTHOR
JOSEPH P. SKURA was born in Mineola, N.Y., in 1952 and received the M.S. degree in applied physics from Adelphi University (1976). During 1974-75, he performed research on the reverse eutrophication of lakes for Union Carbide. During 1975-78, he performed research on the combustion of coal-oil-water slurries for the Department of Transportation, New England Power and Light Co., and NASA.
After joining APL's Submarine Technology Department in 1978, Mr. Skura investigated ocean electromagnetics, including ELF wave propagation. Since 1981, he has
been examining radar-wave propagation under anomalous propagation conditions. In 1986, he became involved in several biomedical projects, including bone healing, epilepsy, and brain edema.
425