Embed Size (px)
Citation preview

SWP-603Worldwide Investment Analysis
The Case of Aluminum
Martin BrownAlfredo Dammert
Alexander MeerausArdy Stoutjesdijk
WORLD BANK STAFF WORKING PAPERSNumber 603
Pub
lic D
iscl
osur
e A
utho
rized
Pub
lic D
iscl
osur
e A
utho
rized
Pub
lic D
iscl
osur
e A
utho
rized
Pub
lic D
iscl
osur
e A
utho
rized
Pub
lic D
iscl
osur
e A
utho
rized
Pub
lic D
iscl
osur
e A
utho
rized
Pub
lic D
iscl
osur
e A
utho
rized
Pub
lic D
iscl
osur
e A
utho
rized


WORLD BANK STAFF WORKING PAPERSNumber 603
Worldwide Investment AnalysisThe Case of Aluminum
Martin BrownAlfredo Dammert
Alexander MeerausArdy Stoutjesdijk
The World BankWashington, D.C., U.S.A.

Copyright (© 1983
The Intemational Bank for Reconstructionand Development/THE WORLD BANK
1818 H Street, N.W.Washington, D.C. 20433, U.S.A.
All rights reservedManufactured in the United States of AmericaFirst printing July 1983Second printing January 1985
This is a working document published informally by the World Bank. To present theresults of research with the least possible delay, the typescript has not been preparedin accordance with the procedures appropriate to formal printed texts, and the WorldBank accepts no responsibility for errors. The publication is supplied at a token chargeto defray part of the cost of manufacture and distribution.
The World Bank does not accept responsibility for the views expressed herein, whichare those of the authors and should not be attributed to the World Bank or to itsaffiliated organizations. The findings, interpretations, and conclusions are the resultsof research supported by the Bank; they do not necessarily represent official policy ofthe Bank. The designations employed, the presentation of material, and any maps usedin this document are solely for the convenience of the reader and do not imply theexpression of any opinion whatsoever on the part of the World Bank or its affiliatesconcerning the legal status of any country, territory, city, area, or of its authorities, orconcerning the delimitation of its boundaries, or national affiliation.
The full range of World Bank publications, both free and for sale, is described in theCatalog of Publications; the continuing research program is outlined in Abstracts ofCurrent Studies. Both booklets are updated annually; the most recent edition of each isavailable without charge from the Publications Sales Unit, Department T, The WorldBank, 1818 H Street, N.W, Washington, D.C. 20433, U.S.A., or from the EuropeanOffice of the Bank, 66 avenue d'I6na, 75116 Paris, France.
When this paper was first published Martin Brown was an economist with theOrganisation for Economic Cooperation and Development; Alfredo Dammert was aneconomist in the Economic Analysis and Projections Department of the World Bank;Alexander Meeraus was chief of the Analytic Support Unit in, and Ardy Stoutjesdijkdirector of, the Bank's Development Research Department.
Library of Congress Cataloging in Publication Data
Worldwide investment analysis.
(World Bank staff working papers ; no. 603)Bibliography: p.Includes index.1. Aluminum industry and trade. 2. Metals as an
investment. I. Brown, Martin S. II. World Bank.III. Series.ED9539.A6W68 1983 338.2'3 83-101T2ISBN 0-8213-0212-8

Abstract
This study focuses on the likely long-term trends in investment,production and trade patterns in the world aluminum industry. It firstintroduces the non-specialist reader to the technical characteristics ofbauxite mining and the production of alumina and aluminum. Special emphasisis placed on the critical importance of energy requirements. Next, a verbaldescription of the method of analysis is presented. A detailed technicalstatement of the mathematical programming model, and the associated data inputare provided in two annexes to the study.
The results obtained are mostly of a normative nature rather thanpredictions. Therefore, tariffs and levies are not considered in mostscenarios. Extensive sensitivity analysis is carried out, focusing on analternative demand forecast, higher capital costs, varying cost andavailability of electricity, and different trade strategies. In that context,an attempt is made to determine the impact of tariffs and levies.
The main conclusion drawn from the analysis is that the emergingpattern of investment, production and trade is very robust in the light of thechanges that were made in the main parameters, particularly for bauxite andaluminum. The abundance of relatively accessible bauxite and low-costelectricity from hydrosources and natural gas in many developing countriesappears to have caused a noticeable shift in comparative advantage, in thesense that most of the required additional productive capacity for bauxite,alumina and aluminum would be located there in the future. However, Australiais under certain circumstances an attractive location for bauxite productionand processing activities while Canada, due to its abundant hydroelectricresources, shows potential for additional aluminum smelter capacity.Furthermore, considering the expected long-term conditions, already installedplants in OECD countries could remain competitive, as long as they are able tosurvive through the current depressed situation of the industry.
Most alumina and aluminum plants in OECD countries will continueoperating for two main reasons. First, capital expenditures have already beenmade, thus representing a sunk cost, and additional investment requirements tomodernize and increase efficiency of these plants are low compared to the costof establishing new plants. By contrast, new investments in developingcountries require not only expenditures for plant and equipment but also forinfrastructure development. Second, although electricity costs for newprojects may be significantly lower in the developing countries with cheapenergy sources, they are significantly higher than before. Moreover, long-term contracts on low-cost electricity supplies for existing smelters and thepossibility of generating medium-cost electricity from coal and nuclear powershould moderate the difference in electricity costs among regions. Therefore,although new aluminum projects implemented in the regions with low costelectricity may result in energy cost savings over some existing smelters,these savings may not compensate for the capital costs which would be incurredin developing the new projects and building the required infrastructure.


Contents
Page
Preface
1. Introduction ......... ............................... 1
1.1 Approach and Aims of the Analysis .... ......... 11.2 Organization of the Study ..................... 2
2. The Aluminum Sector ................................. 3
2.1 General Overview ...... ........................ 32.2 Bauxite Deposits and Characteristics . . 62.3 Alumina Refining .............................. 112.4 Aluminum Smelting ............................. 13
3. Data and Assumptions ................................ 16
3.1 Forecasting the Demand for Aluminum .... ....... 163.2 Investment and Operating Costs for Bauxite .... 203.3 Investment and Operating Costs for Alumina .... 253.4 Investment and Operating Costs for Aluminum,
Including Energy Costs ...................... 323.5 Transport Costs ............................... 413.6 Taxation Policies of Bauxite Producing
Countries ........ . . .......................... 483.7 Import Tariffs on Bauxite, Alumina
and Aluminum ................................ 51
4. Framework of Analysis ............................... 57
4.1 Problem Formulation ........................... 574.2 A Model of the Aluminum Sector .... ............ 584.3 Uses and Limitations .. ........................ 59
5. Results .................. ........................... 61
5.1 The Base Case: Low Demand ..... ............... 615.2 Sensitivity Analysis .......................... 745.3 The Impact of Tariffs & Levies .... ............ 84
6. Conclusions ......... ................................ 91
Annex 1 Computer Printout for the World Aluminum Model .93
Annex 2 A Mathematical Statement of the World AluminumModel .. 148
Bibliography .166

Text Tables
1. Characteristics of Bauxite Deposits .... ............. 9
2. Consumption of Aluminum by End Uses, 1980 ........... 15
3. Estimates of Aluminum Consumption - High Case ....... 17
4. Estimates of Aluminum Consumption - Low Case ........ 18
5. Regional Breakdown for Aluminum Consumption ......... 19
6. Estimates of Bauxite Production for Non-MetalUses, 1980 .21
7. Estimate of Alumina Production for Non-MetalUses, 1980 ........ ............................... 21
8. Capital Cost for Mines .............................. 22
9. Location Factors for Mine Capital Costs .... ......... 23
10. Operating Costs for Bauxite Mining, Year 2000 ....... 24
11. Total Costs of Bauxite Production, Year 2000 ........ 26
12. Capital Cost for Alumina Refineries .... ............. 27
13. Location Factors for Capital Costs forRefineries (IFR) and Smelters (IFS) .28
14. Alumina Refineries: Processing and InputRequirements for Selected Bauxites .29
15. Prices of Inputs for Alumina Refining,1980, Excluding Labor ................... ........ 30
16. Labor Costs at Alumina Refineries ... ................ 30
17. Production Costs for Alumina, Selected Sites,Year 2000 . .......................................... 31
18. Capital Cost for Smelters ........................... 33
19. Inputs for Aluminum Smelters ........................ 34
20. Prices of Other Inputs at Aluminum Smelters ......... 36
21. Cost of Electric Power for Aluminum Smelters(Costed at Generating Sites) ..... ................ 37
22. Undeveloped Energy Resources ........................ 22

23. Electricity Supplies Available for AluminumSmelting .......... ............................... 39
24. Aluminum Production Costs at Selected Sites,Year 2000 (New Plants) .............................. 40
25. Estimated Average Distances from BauxiteMines to Ports and Local Refineries.. . 42
26. Railroad, Truck and River Transport Costs . . .43
27. Ocean Transport Costs . . 45
28. Maximum Vessel Size at Each Port .. .46
29. Taxation Systems in the Bauxite Sector .. .49
30. Income Tax Calculations for New Projects . . .52
31. Levy Calculations - Bauxite. 53
32. Levy Calculations - Bauxite and AluminaIntegrated Operation .53
33. Tariffs on Bauxite and Alumina Imports .. .54
34. Tariffs on Aluminum Imports .. .55
35. Effect of Import Duties on Aluminum:Cost of Delivered Aluminum from New Plants,Year 2000 ......... ............................... 56
36. Existing and New Capacity, 2000, Bauxite Mining,Alumina Refining, and Aluminum Smelting .......... 62
37. Nominal Capacity and Production, Low Demand,2000, Bauxite, Alumina, Aluminum ................. 63
38. Production and Destination of Bauxite, Aluminaand Aluminum, 2000 (Low Demand); ExcludingNon-Metal Uses ................................... 64
39. Bauxite Mining: Base Case Production andCapacity Expansion, 2000 ...... ................... 67
40. Alumina Base Case Production, CapacityExpansion and Consumption in 2000 .............. .. 68
41. Aluminum Base Case Consumption, Productionand Capacity .... 69
42. Bauxite: Base Case Trade Flows in 2000 .70
.,~~~~~~~~~~~~~~~~~~~~~~~~~~~~~~~~~~~~~

43. Alumina Base Case: Trade Flows in 2000 .... .......... 71
44. Aluminum: Trade Flows in the Base Case, 2000 ....... 72
45. Cost Elements for the Base Case - Low Demand,No Levies or Tariffs .............................. 73
46. The Base Case and Ten Variants ....................... 75
47. Production Levels: The Base Case andTen Variants, 2000 ................................ 76
48. Costs: Ten Variants of the Base Case .... ............ 79
49. Bauxite Mining: Capacity Expansion Summary .... ...... 80
50. Alumina: Capacity Expansion Summary .... ............. 81
51. Aluminum: Capacity Expansion Summary .... ............ 82
52. Capacity Expansion with and WithoutTariffs and Levies 1980-2000 .85
53. Bauxite Capacity Expansion 1980-2000,Variant with Tariffs and Levies .86
54. Alumina Capacity Expansion 1980-2000,Variant with Tariffs and Levies .87
55. Aluminum Capacity Expansion 1980-2000,Variant with Tariff and Levies .88
56. Costs of the Base Case, With andWithout Tariffs and Levies .90
Text Figures
1. Plants and Products of the Aluminum Industry 4

Preface
This is a study that the World Bank and the OECD have conductedfocusing on possible shifts in comparative advantage in the aluminum sector.While emphasizing the preliminary nature of our results, we gratefullyacknowledge the advice and assistance that we have received from industryspecialists. Mr. Richard C. Roberts, consultant, has provided us withconstant advice throughout the study, and has, in particular, helped usunderstand the technical and economic characteristics of the aluminumindustry, based upon a lifetime of practical experience.
We are also grateful to OECD for the opportunity to present anearlier version of this study to the Group of Delegates on the AluminumIndustry in Paris, November 1981. We received many important suggestions andcomments from industry representatives at that meeting and are especiallygrateful to ALCAN Aluminum Ltd. for subsequent detailed comments andcriticism.
One of the authors visited the International Bauxite Association inKingston, Jamaica several times during the study; we gratefully acknowledgethe help of the IBA staff, and would like to mention specifically Messrs. RobRobson, Paul Frame, Luke Baumgardner, Aldo Barsotti and Gary Peterson of theU.S. Bureau of Mines, who were very helpful. Professor Ebbe Yndgaard of theUniversity of Aarhus, Denmark, provided useful suggestions on the study.
Within the World Bank, we benefited from the assistance and commentsof several colleagues, in particular, Mrs. Marianne Haug, Messrs. KenjiTakeuchi, James Fish, Edwin Moore and John Strongman. We are grateful tothem. We are deeply indebted to Messrs. Piet Bleyendaal and Sethu Palaniappanfor their meticulous assistance in the numerical analysis.

I

1. Introduction
1.1 Approach and Aims of the Analysis
International discussions on the future structure of world industry,and concomitant trading patterns, have often not been based on systematicanalysis of comparative advantage. This is regrettable, as it may be assumedthat most of the important decisions with regard to future investment,production and trade patterns will continue to be heavily influenced by costconsiderations which are amenable to such analysis, rather than by target-setting by international agencies, or by arguments based upon some perceptionof equity as often expressed on behalf of the developing countries as a group.
At the same time, it should be recognized that the systematicanalysis of an industry, even if confined to a single industrial sub-sector,on a world-wide basis, is fraught with difficulties. First, and foremost, theestablishment of a good data base is a major undertaking. It is one thing toreach a certain degree of agreement on information that describes thetechnological characteristics of a given industrial activity, such as thespecification of input-output relationships. It is quite another thing toarrive at a consensus with regard to data that require a certain amount ofjudgment, such as the availability and quality of factors of production,future market requirements, investment costs, and so on. Finally, there arefactors which are difficult to quantify, or that can be quantified by proxyonly, mostly related to risk and uncertainty. Opinions may not only differwith regard to the nature of such factors and the weight to be attached tothem, but also to the appropriate manner of treatment.
In addition to severe data problems, difficulties arise with regardto the appropriate method of analysis. Some of us have described in detailthe complexities associated with sector-wide industrial investment analysis,even in a single country, and in particular, for industrial activities thatexhibit economies of scale. 1/ In fact, it is now commonly acknowledged thatone is dependent upon computerized manipulation of the data and assumptions ifone wishes to carry out systematic investment analysis that explicitly takesinto account interdependencies among decisions on timing, location, scale,technology and product mix of new productive investment. Clearly, if suchanalysis is difficult for a single country, it must cause serious problems inthe case of a world-wide analysis.
To assess the feasibility of a systematic analysis of an industry ona worldwide basis and achieve results that are meaningful from a policy pointof view, we have selected the world aluminum industry as the subject of a casestudy. From the start, we should emphasize that the objective of this studyis not to present a blueprint for the world-wide development of thisparticular industry, but that it is considerably more modest in its aims.
1/ See, for example, David Kendrick and Ardy Stoutjesdijk, The Planning ofIndustrial Investment Programs, Vol. 1 in: Alex Meeraus and Ardy
Stoutjesdijk (Eds.) The Planning of Investment Programs, 1978.

-2-
First, we have made an attempt to put together a data base for the industry.We were in a relatively favorable position to do so. Both the OECD and theWorld Bank have direct access to primary information on the industry andinternational trade in its product§, the former by virtue of its coordinatingfunction vis-a-vis OECD member countries, the latter through its projectlending activities, and the extensive commodity analysis that feeds into itsproject appraisal. Moreover, in the course of the study, we have benefittedfrom the detailed advice of several of the large aluminum companies, theInternational Bauxite Association, and individual consultants with specialexpertise in this field. Finally, we have been able to survey systematicallythe available published information on the industry from a wide variety ofsources, including World Bank project documents.
Nevertheless, we recognize--and emphasize--that the data basepresented in this study, and underlying the analysis, is no more than a firstattempt at assembling one and leaves considerable room for improvement. Tothe extent deficiencies lie in the technical quality of the data used,subsequent efforts at verification or improvement are needed. When theyrelate to judgmental data, however, it is important to establish close linksto potential users of this type of analysis in order to ascertain their viewson appropriate magnitudes. Most of the data, assumptions and projections usedin our analysis fall into the latter category, and it should therefore not besurprising that we make no attempt to present the study as a definitive one inany way. The emphasis will be on the type of results that can be attainedwith the analytic approach we have selected, in the hope that this willprovide an incentive to some of our diverse audiences to assist us in acontinuing process of improvement of data, assumptions and projections.
The second objective of our study is to demonstrate that it ispossible to design a framework of analysis that incorporates the maincharacteristics of the industry's structure, and employ it efficiently toaddress a number of pertinent questions regarding its future development. Indescribing this framework, we shall emphasize the multitude of uses to whichit can be put, recognizing that different audiences may have diverse needs.
1.2 Organization of the Study
In the next section, we shall give a brief description of theindustry. This is followed by Section 3 in which we present most of the data,assumptions and projections used in the analysis. In Section 4, some of themain economic questions to be addressed in a worldwide study of the industryand the method of analysis will be presented, and, in annexes to that section,a complete statement of the model and its numerical information, in GAMSlanguage, is given. 1/ In Section 5 the types of results that can be obtainedwith this model are described, including a certain amount of sensitivityanalysis. Section 6 contains the main conclusions.
1/ GAMS is a computer-readable language to describe a model and associateddata that places minimal demands upon non-specialists for understandingthe model's structure.

-3-
2. The Aluminum Sector
In this section, we shall provide a brief technological descriptionof the industry, primarily addressed to those that are not familiar with thecharacteristics of products and processes that are important to the sector.Readers that are familiar with the technical aspects of the aluminum sectorcan skip this section without loss of continuity.
2.1 General Overview
Bauxite, a rock consisting chiefly of hydrated alumina and hydroxideminerals is the principal raw material for aluminum. Most of the bauxiteproduced in the world is processed into alumina at refineries, and the latterproduct is converted into aluminum in electrolytic smelters. Additionally,there are also smelters that process new and used aluminum scrap intosecondary aluminum. Minor amounts of bauxite and alumina, both hydrated andcalcined, are consumed by the refractory, abrasive and chemical industries.(Figure 1 presents a flow chart of the sector, for reference throughout thissection).
Aluminum has varied applications: its strength, low density andpleasant appearance have made it useful in motor vehicles, in machinery andequipment and in construction; due to its low density and high electricalconductivity, aluminum has displaced copper in a series of electrical uses;because of its resistance to corrosion it has partially replaced tin and steelin the packaging industries.
The aluminum industry is vertically and horizontally integrated.Over sixty percent of the world's productive capacity for bauxite and aluminaand over half of the world's aluminum capacity (excluding Centrally PlannedEconomies) is owned and operated by six corporations: ALCOA, ALCAN, Pechiney(PUK), Reynolds, Alusuisse and Kaiser. Because of trading patterns, highinvestment requirements, economies of scale, as well as proprietarytechnology, these multinational companies have tended to be associated withmany new projects in the sector. However, more or less independent producersare emerging, particularly in developing countries, which may have importantlong-run consequences for the international structure of the industry.
Prices of bauxite, alumina and aluminum reflect the high degree ofconcentration of the industry. There are no market price quotations forbauxite or alumina, prices being set mainly by companies for their internalaccounting and/or to comply with host government regulations. In the case ofaluminum, producer prices of the major producers set the price patterns (about80 percent of primary aluminum production is transferred from the primaryproducer/smelters to subsidiary operations producing semifabricates); dealeror free market prices are also quoted; and since 1977 aluminum has been quotedin the London Metal Exchange. 1/
1/ See: World Bank, "Bauxite and Aluminum Handbook," Washington, D.C.,February 1981.

- 4 -
Figure 1: PLANTS AND PRODUCTS OF THE ALUMINUM INDUSTRY
Bauxite
Scrap LeCnryCalcination Chemical
Collectors Plants Industry
Calcined
New Alumina Bauxiteanew (Refractory
Scrap Nscerwap S > or Abrasive}Scrap Scrap Specialty
Aluminas
Secondary Primary Refractory
Smelter Smelter andAbrasiveIndustries
AluminumJ, Aluminum
New L Mills and FoundriScrap.
Bar, Sheet, Rod,Plate, Wire, Tube,Powder, etc.
New Manufacturing PlantsScrap
Old Buildings, Houses, Automobiles,
Scrap Transmission Lines, Machinery,
Cans, etc.
Source: World Bank, Economic Analysis and Projections Department,Commodities and Export Projections Division, February 1981.

5-
Until the decade of the forties, bauxite, alumina and aluminum wereproduced mainly in Europe, the Soviet Union, the United States and to a lesserextent in the Guianas (only bauxite). Thus, during this period, the entireproduction cycle remained principally concentrated in the industrial nationsnear to the major metal markets. Cost considerations drove the aluminumcompanies to seek new supplies of bauxite after World War II which wasreflected in the rise of Guyana and Suriname as the main producers of bauxite,supplying mainly North America. The bauxite/aluminum industry followed apattern of increased internationalization with the appearance of new importantproducers: Jamaica in the early fifties and Australia and Guinea in thesixties. This distinction between producing and consuming countries wasemphasized in 1974 by the creation of the International Bauxite Associationwhich was composed solely of bauxite producing nations.
Since the period of the early 1960-s the geographical distribution ofalumina production has followed partially that of bauxite. By locatingalumina refineries near to the mines, transport costs as well as someprocessing costs are reduced (per ton of aluminum content); but in lessdeveloped areas investment costs may be higher; and in some cases some privatesector companies have concern about the security of their large investments.In 1979, developing countries produced 51% of world bauxite production,centrally planned economies 13%, and industrial nations produced 36% (includesAustralia at 31%); alumina production in this same period was 20%, 17% and 63%respectively. 1/
Primary aluminum production is energy intensive, approximately 13,500kwh of electricity being needed to produce one metric ton of aluminum, withtoday's technology. Thus, the availability of sufficient supplies of low costenergy is one of the critical factors determining the location of smelters. Alarge number of smelters built before the 1973 energy crisis, are located inindustrial countries which previously had access to relatively inexpensiveoil, natural gas, or hydroelectric power. Some of these smelters are nowbeing forced to close down, due to rising energy costs, since their fuelsources have alternative markets. Japan has been the most striking case,where aluminum smelting capacity is being reduced by one-third. Some smeltersin the U.S., mainly those which depend on natural gas, are also closingdown. Meanwhile, some plants have their own captive sources of energy orpossess long term contracts for the supply of power permitting longer-termadjustment to changed relative prices.
These trends point toward a shift in aluminum industry patterns: newsmelters will be located in regions with untapped energy sources which havelittle or no alternative uses, as may be the case of hydropower, flared gasand low quality coal. Since these relatively low cost sources of energy aremostly located in developing countries and in Australia, consuming countriesare likely to become more dependent on imported aluminum. This is reflectedin the fact that while primary aluminum output from developing countries was3.2 percent of world output in 1960, it increased to 13.7 percent in 1979. Atthe same time, developed countries in 1960 produced 77 percent of world
1/ Ibid.

-6-
primary aluminum and consumed 74 percent, while by 1979 they produced 65percent and consumed 67 percent of world aluminum.
One source of uncertainty for these trends relates to the future ofnuclear energy. The large scale development of nuclear power could reversethe trend and improve the competitive position of the industrial countries inenergy-intensive industries.
2.2 Bauxite Deposits and Characteristics
Aluminum is the most abundant metal in nature, representing about 8.2percent of the earth's crust. Unlike many other metals it is not found in theearth in metallic form, but it is a common constituent of many minerals, whereit is normally present in combination with silicon and oxygen, with hydroxylgroups, with iron, titanium, calcium and to a lesser extent, with fluorine,phosphorus and boron. 1/
The bauxite ores, gibbsite, boehmite and diaspore, which arecurrently the main sources of aluminum, account for only a small part of thealuminum found in the world. Other potential sources of aluminum may beclassified as follows:
a. Igneous rocks, the most important being anorthosite,nepheline syenite and phonolite. Of these, nephelinesyenite has the highest commercial importance occurringin sufficient quantity for commerical development inCanada, the USSR, Norway and the United States.
b. Sedimentary rocks, such as clays and shales. Althoughthe high-alumina clays constitute a potential source ofalumina, these have high commercial value due to theirapplications in the ceramics, refractories, chemicaland paper industries. Shales have low alumina content;therefore, alumina from shales is economically feasibleonly as a byproduct.
c. Metamorphic and metasomatized rocks, of which alunite isthe most promising. The main problem with alunite as asource of alumina, is that the larger deposits containnumerous impurities which interfere with the extractionprocess, and that the sale of various commercial byproductsis necessary for the economic viability of the process.
In summary, aluminum is technically obtainable from non-bauxite sources, andtherefore, these could be developed for strategic considerations, but atpresent the Bayer bauxite process has significantly lower costs than those of
1/ Bliss, Neil, "Non Bauxite Sources of Alumina with Particular Reference toALCAN's Recent Investigations," in: The Journal of the Geological Societyof Jamaica--Proceedings of Bauxite Symposium IV, Kingston, Jamaica, June1980.
A

-7-
alternative processes. Therefore, since it is unlikely that any of these non-bauxite sources of alumina will become important for the aluminum industryduring the twentieth century, the remainder of this section focuses on thedistribution and characteristics of the world's bauxite resources. 1/
Bauxite deposits may be divided into two classes: karstic andlateritic. 2/ Karstic bauxites are associated with limestones, are usuallyfiner than lateritic bauxites and tend to have a higher iron content.Lateritic bauxites are found with aluminosilicate rocks and are much coarsergrained. The structure of the deposits and the impurities found are differentfor these two classes of deposits.
From the point of view of bauxite processing conditions at aluminarefineries, the most important classification distinguishes bauxites accordingto the aluminum oxyhydroxide minerals present, which influence mainly thetemperature and pressure required for refining: 3/
a. Trihydrate type, A1203 . 3H20, with gibbsite as the main mineral andboehmite content of less than 3 percent.
b. Monohydrate boehmite type, A1203 . H2 0, including monohydratebauxite with low amounts of diaspore.
c. Mixed types, which contain gibbsite as the predominant aluminummineral but with boehmite content over 5 percent of the aluminumore.
d. Monohydrate mixed bauxite, where boehmite is the predominantaluminum mineral but diaspore content exceeds 5 percent.
Of these types of bauxite, trihydrates are the cheapest to process, due tolower temperature and pressure requirements, and monohydrates the mostexpensive; while the processing costs for mixed tri-monohydrates are somewherein between. Among the monohydrates, diaspore is the most difficult to treat.
Apart from the bauxite types, some other factors are important indetermining the alumina plant design and processing conditions, consequentlyaffecting refining costs. The bauxite to alumina ratio ranges from 2:1 to3.4:1, and therefore establishes the amount of bauxite necessary to produceone ton of alumina and also provides an indication of the amount of impuritiespresent in the ore (a pure gibbsite would show a bauxite-alumina ratio of1.53). However, the type of impurities in the bauxite are as important as the
1/ Bliss (op. cit.) p. 223.
2/ Hill, V.G., "The Rational Development of Bauxite Resources in The Journalof the Geological Society of Jamaica, Proceedings of Bauxite Symposium IV,Kingston, Jamaica, June 1980.
31 The description of bauxite types was obtained from the InternationalBauxite Association.

-8-
bauxite-alumina ratio. The most objectionable impurity is reactive silica,which is chemically combined in clay mineral silicates; in many cases non-reactive silica is not particularly important and occurs as quartz, sand,chalcedony, etc. 1/ Some of the main impurities such as iron and titania areessentially insoluble, their main effect being that they require sufficientadditional equipment to separate them mechanicaly from the bauxite afterdigestion. The most prevalent of the insoluble impurities are iron, calcium,magnesium, titanium and manganese. Among other impurities worth mentioningare the highly soluble ones, which affect processing conditions but do notaffect alumina purity, such as organic carbon, carbonates, chlorides andsulfates. For a technical description of how impurities influence processingconditions and output quality, see Teas and Kotte. 2/
Besides the type and quality of the bauxite, mining costs must betaken into consideration in evaluating bauxite deposits. Infrastructurerequirements, dimension of the deposits, thickness of the overburden andtransportation needs, are factors which affect significantly the cost ofbauxite production. Another important set of issues affecting investmentdecisions in bauxite mines consists of government policies regarding taxation,mining laws, security of investment and other related aspects (see Section 3for taxation policies).
Table 1 presents the characteristics of main bauxite depositsthroughout the world. This table presents a summarized view on the locationof the deposits, estimates of economic reserves, amount of overburden asreflected in the strip ratio, type and quality of the bauxite and processrequirements, and average distances to ports or refineries. The data onreserves has been obtained from various sources (U.S. Geological Survey, U.S.Bureau of Mines, International Bauxite Association) and includes thosedeposits considered exploitable within the next two decades. The otherinformation, appearing in the table has also been obtained from a variety ofsources, including the use of a consultant with ample experience in theindustry. 3/
The total economic reserves shown in Table 1, amount to over 22.8billion metric tons, enough to supply the world's requirements for over onehundred years. It may be appreciated that the countries with the largestknown reserves, in order of importance include: Guinea, Australia, Brazil andJamaica, representing 70 percent of the world total. This table shows also,that most Western and Eastern European bauxites are expensive to mine becauseof the overburden and are also costly to process due to their diasporecontent. In The United States, because of low quality bauxite, a soda-sinterprocess is required for refining local bauxite into alumina. China uses a
1/ Reimers, "Pre-investment Data for the Aluminum Industry," Centre forIndustrial Development, United Nations, New York, 1966.
2/ Teas, E. Bruce and Jan J. Kotte, "The Effect of Impurities on ProcessEfficiency and Methods for Impurity Control and Removal," in The Journalof the Geological Society of Jamaica--Proceedings of Bauxite Symposium IV,Kingston, Jamaica, June 1980.
3/ Mr. Richard C. Roberts.

Table 1: CHARACTERISTICS OF BAUXITE DEPOSITS
Economic Bauxite Type ofReserves Strip Alumina Distance to Processing
Country/Region Location (million mt) Type of Bauxite Ratio Ratio a/ Port/Refinery Required Coments
United States Arkansas 40 /b Trihydrate, 7.5-15 3-1 2.2 /c Average 400 miles Soda Sinter Process At present aluminapercent silica river to New Orleans beesuss of high silica (not bauxite) is'(mostly 15%) content shipped from Arkansas
Jamaica Various sites 1,050 Trihydrate, 1-3.5 0-1 2.4 /c Average 12 miles to American Bayer Additional 200 millionpercent silica port (Port Rhoades, at of lower quality
Port Kaiser, Ocho Rios) reserves
542 Mixed, 1-3.5 percent 0-1 2.7 /c Modified Americansilica Bayer
Baiti/Dominican Various sites 50 /d Mixed, 2.5 percent 0-1 2.7 /e Average 15 miles to Modified AmericanRepublic silica Hiragoane or other Bayer
port
Guyana Linden, Ewakani 700 /b Trihydrate, 3-4.5 2-1 2.0 /e 140 miles by river American Bayermnd Ituni percent silica barge fron Kwakwani;
60 miles by railroadfrom Ituni; to Everton
Suriname Moeago and 390 /b /f Trihydrate, 3.9-8 1-1 2.1 /e American BayerParanam percent silica
Bathuis 1OO /b /f Trihydrate, 3.5 0-1 2.5 /g 50 miles railroad American Bayerpercent silica from W. Suriname to
Apurs plus 200 milesriver barge to Paranama
Brazil Trombetas 4,070 Id Trihydrate, 3-5 2-1 2.1 /c 20 miles railroad plus American Bayer '°Paragominas percent silica 690 miles river to
Belem
Venezuela Los Pijiguajos 500 /d Trihydrate, 4 1-1 2.1 /c 20 miles railroad to American Bayerpercent silica Las Ventanas plus
250 miles riverbarge to Puerto Ordaz
Western Europe Greece 700 Moonohydrate (with 3-1 2.5 /c 20 miles truck to European Bayer The European BayerYugoslavia 460 diaspore), 6.5 2.5-1 2.4 7W /h 110 miles railroad process may beFrance 40 percent silica to Dubrovoic include partial
treatment of disapore
Eastern Europe Hungary 300 /d /i Monohydrate with 3-1 2.5 /c Average of 300 miles European Bayer 1. In Hungary whendiaspore) to Leningrad diaspore content is
high, they use a limesinter process.
USSR 300 /d /i Monohydrate (with 3-1 2.5 /c 2. Russia treats alsodiaspore) alunite and nephelinesyenite.
Australia Gove, Weips Gove 300 /b /f Mixed, 2-6.5 percent 0-1 2.2 /e 30 miles railroad to Modified AmericanWeipa 3,100 T7 7 silica Weipa Bayer
Western Australia 1,200 /b /f Trihydrate, 1.5 0-1 3.4 /4 90 miles railroad to American Bayer(Darling Ranges) percent silica Bunbury (port) 20 miles
to Wagerup (refinery)
India Panch Pat Mal 600 It /1 Tribydrate 0-1 2.4 /c 100 miles railroad to American Bayerdeposits in to VishakhapatnamOrissa (mainly) (S. East India)
(continued)
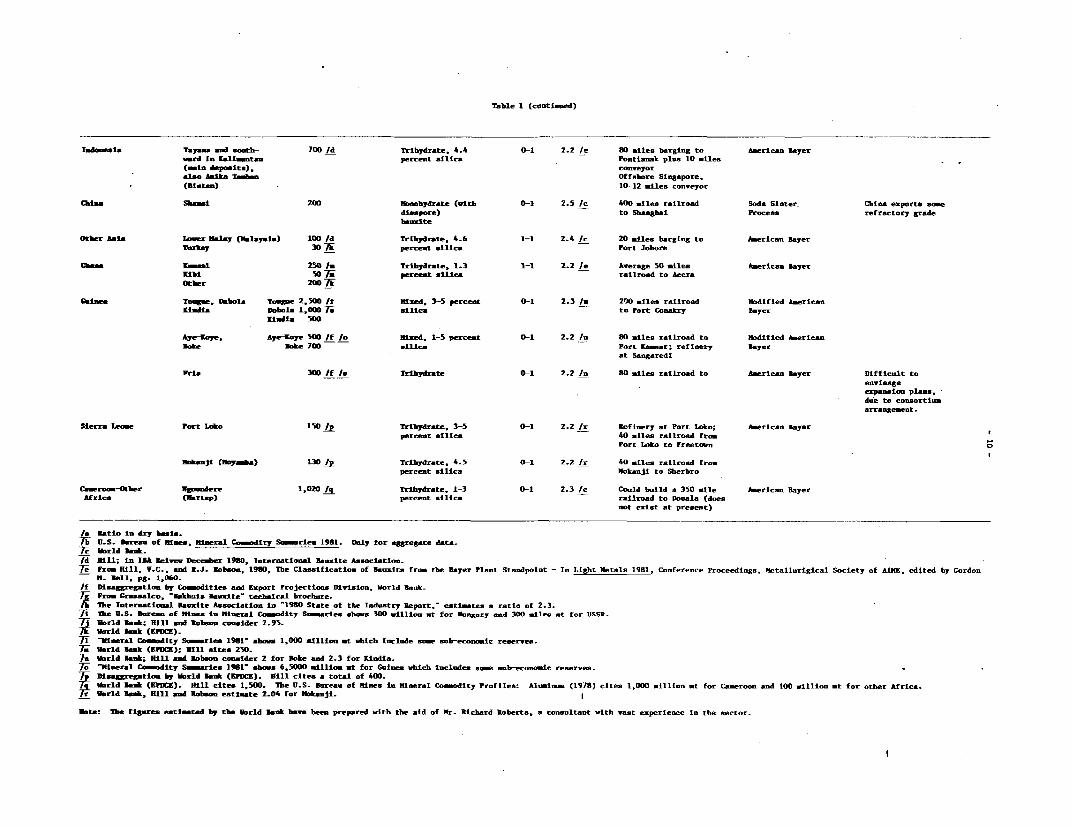
Table 1 (continned)
Indo*esia Tayana nd sooth- 700 /d Trihydrate, 4.4 0-1 2.2 / 80 siles barging to American Sayerward in Kalimanta percent silica Pontianas pI"s 10 miles(main depI its), conveyor*15o A-ibS TISSam Offshore Singapore.
(01-tan) 10-12 miles conveyor
Chia Sb, i 200 Moonbydrate (with 0-1 2.5 /c 400 miles railroad Soda Sinter China exports somedis pore) to Shanghai Process refractory gradebauxite
Otber Asia Iower "ata (Malaysia) 100 /d Trihydrare, 4.6 1-1 2.4 Ic 20 miles barging to American Bayer
Tnrke 30 7W percet sltica Port Jobore
Ga' a' 250 /I Trihdrate. 1.3 1-1 2.2 le Averge 50 miles American layerKibi 50 percent silUca railroad to AceraOtber 200 7W
Gansa Toge. Dnbola Tong8e 2,500 If nMed, 3-5 percent 0-1 2.3 In 200 iles railroad Nodified AmericanKildia Dobola 1,oao To silica tn Port Cnnakry layer
Kila 500
Aye-Ko, Aye-Koye 500 /f /n Mixed, 1-5 Percent 0-1 2.2 /n SO siles railroad to Modified Americanlobe Bok. 700 *ilica Port ar r; refinery layer
at Sangaredi
Fria 300 /f /o Trihydrate 0-1 2.2 n S0 miles railroad to American layer Difficult toenvisageexpansion plans,due to consortiumarrangement.
Sierra leone Part Labo 150 /P Tribdrate, 3-5 0-1 2.2 /r leinery at Port ioko; American layerpercent llica 40 miles railroad frm
Port Loko to Freetown
Janji (Moy_a) 130 /p Triydrate., 4.5 0-1 2.2 /r 40 miles railroad frempercent silics - obanji to Sherbro
Cameroo_-Otber Ugndere 1,020 /q Trihydrate, 1-3 0-1 2.3 /c Could build a 350 mile American layerAfrica (Martap) percent silica railroad tn Do-nla (does
not exist at present)
/a latin io dry bais.7i1 U.S. Brean of nis, Mineral Comdity S ries 1981. Only for aggregate data.7A World Rusa.Td Hill; in INA Reive, December 1980, International Blsoite Association.e P.ro Mill, V.C., and R.J. Robson, 1980, The Classification of lansits from tbe layer Plnt Standpoint - In Light Metals 1981, Conference Proceedings, netallurigical Society of ADMN, edited by Cordon
n. sell, Pg. 1,060.If Diisaggregaton by Comodities and Export Projections Dlviaion, World Bank.
From Grassalco, l-sbhni Bsoite techitcal brochure.i Tbe Internation laste Association in -l9l0 State of the Indnstry Report, estimates a ratio of 2.3.71 The U.S. Barean of Miein Mineral Conodity Sws-ies sh. 300 million t for Hungary end 300 silas t for USSR.
World lask; MUl and Robaon consider 2.95.WDlorld mk (KD().
717 i-mrat Comndity Sn_ries 1981 shows 1,000 million at shich inclde some nob-nomlc reserves.7A World lak (1POCK); Mill sites 250.To Vorld Bank; MilL and Robson conider 2 for loke nd 2.3 for Kindia.To Mineral Co_ndity S_ries 1981 shows 6,5000 million t for Ginmes .hich includes some b-economic reserves.A Disaggregatiom by World Sank (KFUM). Hill cites a total of 400.7. World lank (HPMCg). tlu cites 1,500. The U.S. Blrean of nems in Mineral Coiodity Profiles: Aloninom (1976) cite 1,000 million at for Cameroon and 100 million at for other AfricA.7ir World lank, Hill ad Robson estimate 2.04 for Monji. I
Sote: The fisres estimated by the Yorld Bank have been prepared vith the aid of Mr. Richard Roberts, a consultant tith vASt experience in the sector.
- 11 -
sinter process to recover alumina from diaspore. Among the deposits shown,those in Venezuela, Cameroon, Ghana, Kalimantan in Indonesia, andTougue/Dabola/Kindia in Guinea, are undeveloped, requiring heavy expendituresfor their exploitation and infrastructure development.
Most of the bauxite produced in the world is mined by open-pitmethods. In France, Greece, Turkey and Hungary, bauxite is also produced atunderground mines. Bauxite mining consists basically of three stages:extraction, crushing and drying; some bauxites also require beneficiation.Extraction involves removal of the overburden by bulldozers, drag-lines andlarge-wheel excavators, with the use of explosives for hard terrains. Then,the bauxite is removed by similar methods, and the overburden is replaced torestore the surface of the mines for re-use as forest or agricultural land.Where beneficiation processes are used, they generally consist of wetprocesses to increase the alumina content and to reduce silica and ironcontent.
Most bauxites require crttshiig for ease of processing. Caribbeanbauxite (Jamaica, Haiti, Dominican Rcpublic) is so fine-grained that it needslittle or no crushing.
The third stage is drying, which may be done at the mine site or atthe refinery. If the bauxite is to be shipped great distances, it is usuallydried at the mine in order to reduce transport costs. Drying is carried outin rotating kilns at moderate temperatures to remove the free moisture withoutaffecting the alumina hydrate. In this process, moisture is reduced by about5 percent arriving at moisture contents of 10 percent for Caribbean bauxitesand of 5 percent for other types. The fine grain of Caribbean bauxite makesit impractical to reduce humidity by more, since it would cause handlingdifficulties. If the alumina plant is near the mine, the bauxite is dried atthe former, where the use of heat recovered from the refining process cutsdrying costs by about fifty percent. Mines in the Dominican Republic andNorthern Australia (Gove, Weipa) use solar drying and therefore do not requiredrying fuel. Several of the Australian mines use a beneficiation process toreduce silica content.
2.3 Alumina Refining
Bauxite is refined into alumina almost exclusively by the Bayerprocess. Alternative technologies are available for obtaining alumina fromnon-bauxite sources, but as mentioned previously in this section, processingcosts are significantly higher. Such is the case of the leaching andsintering method employed in the Soviet Union to treat nepheline syenite andalunite ores. Because of high costs, neither the USSR nor other countrieshave any current plans for building new plants of this type. Since the Bayertechnology is likely to remain the most important for alumina refining in theforeseeable future, this section focuses on its main technical aspects.
Bayer alumina plants consist of two facilities operating in series:a hydrate plant and a calcination plant. The hydrate plant transforms bauxiteinto alumina hydrate in a process involving four major operations:
- 12 -
i. Grinding and slurrying where the crushed ore is fed toball or rod mills and caustic soda, lime, hot water andspent liquor are added to it, forming a slurry that goesinto the digestors. The consumption of caustic sodadepends principally on the reactive silica content andmud washing losses, with an average of 1.4 kilograms ofsoda (as NaOH) per kilogram or reactive silica. 1/ Limeis used to reduce carbonates, regenerate caustic soda andcontrol phosphates. About 0.1 metric tons of lime permetric ton of alutmina are assumed normal for a plantusing caustic soda and for a bauxite having minimumphosphorus.
ii. Digestion of the slurry containing bauxite and causticsoda at elevated temperatures and pressure. At thisstage, bauxite is dissolved, forming a solution of sodiumaluminate (NaAlO2), while the reactive silica combineswith alumina forming a insoluble sodium aluminum silicateand consuming caustic soda and alumina in the process.Other insolubles include non-reactive silica, iron oxideand titanium. The simplest digestors correspond to theAmerican Bayer process, characterized by a low temperaturedigest (about 2900F) which is designed to extract easilysoluble gibbsite (Guyana, Brazil, Suriname, West Australia,etc.), and which uses a relatively low caustic sodaconcentration (up to about 130 grams per liter of Na2 O).At the other extreme is the European technology forbauxites containing more difficult soluble boehmite(monohydrate) which requires temperatures up to 490°F andmuch higher caustic concentrations (up to 240 grams perliter of Na2O). This group of bauxites includes thoseof southern Europe and Eastern Europe. Between theextremes of these conditions, another technology existsknown as Modified American Bayer which is designed formixed bauxites containing principally gibbsite withminor amounts of boehmite, as in North Australia, Guineaand some deposits in Jamaica; for which process conditions areset for temperatures from 3500 to 470°F and causticconcentration up to about 150 grams per liter of Na2Q.Operating conditions of the American Bayer process willcause the solution of silica occurring only as a clayimpurity, while those of the European Bayer method willalso dissolve the silica contained in quartz.
1/ If, for example, a bauxite contains 2 percent reactive silica, to process1 metric ton of bauxite will require 1.4 Kg Soda x 20 Kg Silica
Kg Silica ton bauxite= 28 Kg of NaOH. If the bauxite alumina ratio is 2.2 : 1, the sodarequirement per ton of alumina is 2.2 x 28 = 61.6 Kg.

- 13 -
iii. Filtration and settling of the insoluble impurities(called red mud) separating them from the sodium aluminatesolution which in turn, is pumped into precipitators. Thered mud is usually discarded to disposal areas known as redmud lakes.
iv. Precipitation of the sodium aluminate which is seeded withaluminum hydrate crystals, causing about 50-60 percent ofthe alumina hydrate to dissociate from the soda andprecipitate out as crystals. The mixture is pumped to atleast 3 stages of thickeners which separate the crystalsfrom the caustic solution. The coarsest product is sentto the calcination department; the product of the last 2stages is recycled to the precipitators for seed to controlparticle size. The caustic solution is recycled for furtheruse while the alumina hydrate is sent to the calciners.
The calcination of alumina hydrate (A1203 e 3H20 or A1203 . H20) toalumina (A1203) involves the removal of moisture and of the chemically bondedhydroxide by roasting the hydrate at 1,150 to 1,2500C. Before the 1950srotary kilns were used, but afterwards the industry has tended to employ fluidbed calciners, which use 33 percent less fuel, are cheaper to install andrequire less maintenance. In some of these calciners, final calcinationoccurs in an updraft furnace into which both partially calcined hydrate andfuel are injected; followed by a fluidized holding vessel where alumina can beheld for the required time at the desired calcination temperature. Theresulting alumina is then cooled in a fluid bed cooler and stockpiled untilshipped to aluminum smelters.
2.4 Aluminum Smelting
Aluminum metal is produced by the Hall-Heroult process which consistsof the electrolysis of alumina (A1203) to separate aluminum from oxygen. Twotypes of reduction plants are currently in use: the prebaked anode plants andthe Soderberg anode plants. Given the importance of electricity as a majorinput for these processes, and under the pressure of rising energy costs,other routes are being tried, such as the ALCOA smelting process whichconsists of the chlorination of alumina and the subsequent electrolysis ofaluminum chloride. This process could reduce energy consumption by about 20percent with respect to the Hall-Heroult process, but it brings othercomplications such as the need to maintain the purity of aluminum chloride athigh levels. I1 If these and other difficulties are solved, this route foraluminum production may be applied commercially by the end of the century.
An aluminum reduction plant consists of electrolytic cells arrangedin series (known as potlines), holding furnaces for the molten aluminum, andcasting machines for the production of ingots of different shapes. The cells
1/ Grjotheim, Kai and Barry Welch, "Impact of Alternative Processes forAluminum Production on Energy Requirements," in Gordon M. Bell (ed.) LightMetals 1981, The Metallurigical Society of AIME, Pennsylvania, 1980.

- 14 -
consist of an outer iron shell with inner carbon lining which serves ascathode. The prebaked type anodes are blocks individually suspended by ironrods hanging above the electrolytic cells. The Soderberg system uses greencarbon paste as anode material which is fed into the top of the anodecasing. 1/
In the Hall-Heroult process, the alumina is dissolved in moltencryolite, which is a double fluoride of sodium and aluminum (Na3AlF6). Byelectrolysis, at about 1000°C, aluminum is deposited at the cathode in theform of a molten metal layer underneath the cryolite, while the oxygencombines with the carbon at the anode forming a mixture of carbon dioxide andcarbon monoxide. The metallic aluminum is periodically tapped off andtransported to the holding furnaces which feed the casting machines.Currently, with environmental concerns a major issue, special attention mustbe paid to pollution problems at aluminum smelters. Significant expendituresare required to control the fluorides resulting from the cell bath as well asthe alumina dust. Because of these problems, the use of Soderberg type anodesis being discontinued, as they produce more abundant fluoride compounds andtarry components.
Aluminum ingots of various shapes are shipped from the smelter tosemifabricating plants for further processing by a wide range of industries.The special characteristics and relative low cost of aluminum account for itsvaried applications. Some aluminum alloys combine lightness with greatstrength. Aluminum does not corrode easily and is unaffected by many chemicalreactions. Although its conductivity is only 60 percent of that of copper,due to its low density, an electric transmission line made of aluminum weighsonly 48 percent of an equivalent copper line. Due to these properties,aluminum has replaced steel, copper, lead, zinc and tin in a wide range ofuses. Nevertheless, manufacturers of the competing metals and of otherproducts such as plastics, are constantly developing new alloys and compositematerials which halt and reverse substitution of aluminum in many fields. 2/
A breakdown of aluminum consumption by main uses is shown in Table2. It should be noted that there may be definitional problems in breakingdown aluminum use, particularly in Western Europe. About one-fourth ofaluminum production is used for the transportation industry in motorcomponents, vehicle parts, electrical applications and paints. Near to 6percent of aluminum metal is for machinery and equipment (mechanicalengineering). The electrical engineering and communications sector accountsfor one-tenth of aluminum consumption. About one-fourth of aluminum consumedis used in building and construction, for doors and windows, heating and airconditioning, structures and other uses. Resistance to corrosion haspermitted the replacement of steel and other materials by aluminum inpackaging and canning. Almost 7 percent of aluminum is employed for theproduction of consumer durables, such as refrigerators, air conditioners,washing machines and other appliances.
1/ Reimers, "Pre-investment Data for the Aluminum Industry, Department ofEconomic and Social Affairs, United Nations, New York, 1966.
2/ Peach, W.N. and James A. Constantin, "Zimmermann's World Resources andIndustries (Third Edition)," Harper and Row, New York, 1972.

- 15 -
Table 2: CONSUMPTION OF ALUMINUM BY END USES, 1980
Western WorldEurope /a Japan U.S. Average
… __________________(%)…_ _-_____
Transport 27.9 26.1 19.3 22.8
Mechanical Engineering 6.8 4.8 5.4 5.6
Electrical Engineering 10.4 10.1 11.1 10.6
Building and Construction 18.3 32.9 21.4 22.9
Packaging 9.7 6.0 27.8 18.3
Domestic & Office Appliances 8.5 5.5 6.3 6.6
Metal Industries andMiscellaneous 18.4 14.6 8.7 13.2
100.0 100.0 100.0 100.0
/a Germany, France, United Kingdom, Italy.
Source: Metallgesellschaft, "Metal Statistics 1971-1981" 69th Edition,Frankfurt Am Main, 1982.

- 16 -
3. Data and Assumptions
In this section we shall describe the data and assumptions used inthe analysis. Following a section on demand, we discuss investment andoperating costs for mines, alumina refineries, and aluminum smelters. Giventheir importance, energy costs are given special attention. Finally, theavailable information on international transport costs, levies, taxes andimport duties is presented.
It should be emphasized once more that the information in thissection represents a first attempt at establishing a data base for worldwideinvestment analysis. Although the present data incorporate numerousrecommendations for improvement, further qualitative improvements arecertainly desirable. Moreover, given the limited degree of disaggregationthat the analytic framework allows, many data categories are no more than"stylized facts," fairly representative for groups of relatively comparablecountries, but in need of refinement for more detailed subsequent analysis.
3.1 Forecasting the Demand for Aluminum
The next two tables (3 and 4) provide a high and a low forecast ofthe demand for aluminum, for eighteen regions in which we have divided theworld. The countries included in each region are given in Table 5.Basically, the forecast was made on the basis of demand equations that relatethe demand for aluminum to either industrial production or Gross DomesticProduct, and the price of aluminum deflated by a price index. More detailedinformation on the forecasting methodology is available from the WorldBank. 1/
For the high case, primary aluminum consumption is expected to growby 4.8 percent per annum between 1980 and 2000, whereas in t1* low case thegrowth rate is reduced to 3.7 percent. The overall results -re consistentwith estimates from other studies. Thus, "Aluminum Annual Review" 2/ expectsan annual growth rate of primary aluminum consumption (excluding CentrallyPlanned Economies) of 3.6 percent for the period 1980 to 1988. Resources forthe Future, in "World Mineral Trends and U.S. Supply Problems," 3/ considersWorld Consumption of Refined Aluminum (including secondary ingot) to be 46.2million metric tons by the year 2000, compared with the projections shown herefor total consumption (primary and secondary aluminum) of 52.8 million metrictons for the high case and 43.6 million metric tons for the low case.
1/ Specifically the Commodity and Export Projections Division of the WorldBank.
2/ Anthony Bird Associates, op. cit.
3/ Fischman, op. cit.
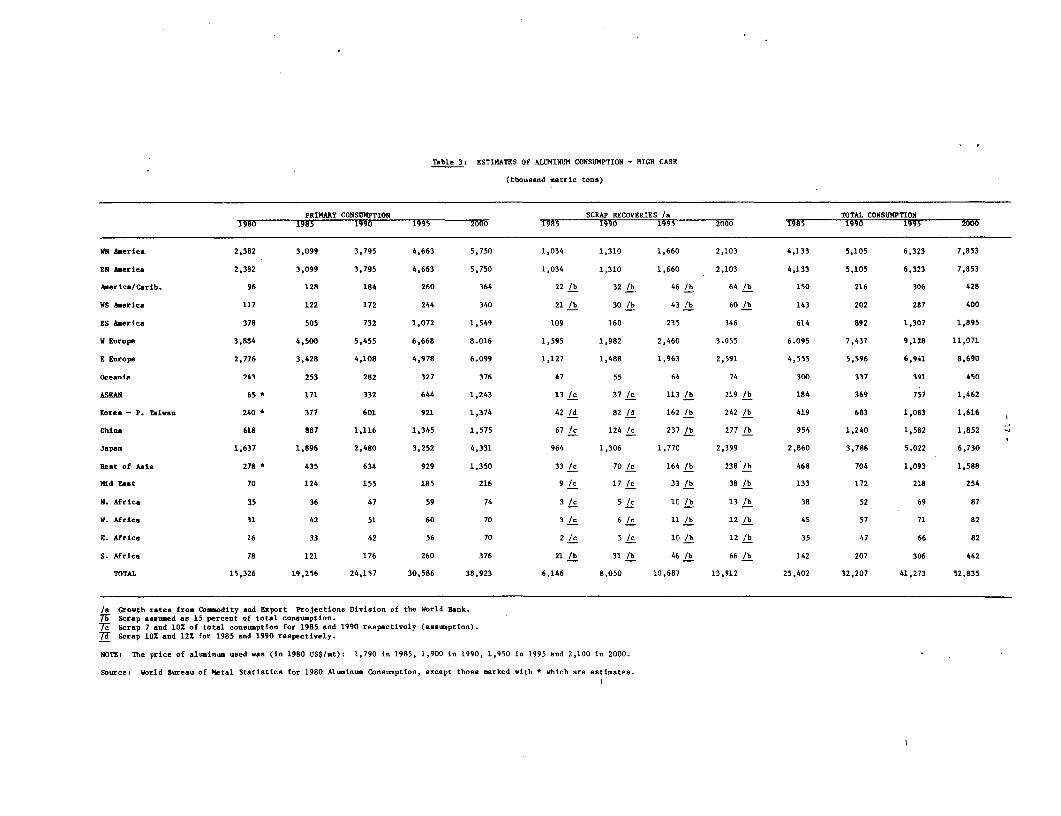
Table 3: ESTIMATES OF ALUMINUM CONSUMPTION - HIGH CASE
(tbousand metric tons)
PRIKARY CONSUMPTION SCRAP RECOVERIES /a TOTAL CONSUMPTION1980 1985 1990 1995 2000 1985 1990 1995 2000 1985 1990 1995 2000
WM Aaerica 2,382 3,099 3,795 4,663 5,750 1,034 1,310 1,660 2,103 4,133 5,105 6,323 7,853
EN America 2,382 3,099 3,795 4,663 5,750 1,034 1,310 1,660 2,103 4,133 5,105 6,323 7,853
Asertca/Carib. 96 128 184 260 364 22 /b 32 /b 46 /b 64 /b 150 216 306 428
WS Amer1ca 117 122 172 244 340 21 /b 30 lb 43 /b 60 /b 143 202 287 400
ES America 378 505 732 1,072 1,549 109 160 235 346 614 892 1,307 1,895
W Europe 3,884 4,500 5,455 6,668 8.016 1,595 1,982 2,460 3.055 6.095 7,437 9,128 11,071
E Europe 2,776 3,428 4,108 4,978 6.099 1,127 1,488 1,963 2,591 4,555 5,596 6,941 8,690
Oceania 243 253 282 327 376 47 55 64 74 300 337 391 450
ASEAN 65 * 171 332 644 1,243 13 /c 37 /c 113 lb 219 /b 184 369 757 1,462
Korea - P. Taiwan 240 * 377 601 921 1,374 42 /d 82 /d 162 lb 242 /b 419 683 1,083 1,616
China 618 887 1,116 1,345 1,575 67 /c 124 /c 237 /b 277 /b 954 1,240 1,582 1,852 s
Japan 1,637 1,896 2,480 3,252 4,331 964 1,306 1,770 2,399 2,860 3,786 5.022 6,730
Rest of Aaia 278 a 435 634 929 1,350 33 /c 70 /c 164 /b 238 /b 468 704 1,093 1,588
Mid East 70 124 155 185 216 9 /c 17 /c 33 /b 38 lb 133 172 218 254
N. Africa 15 36 47 59 74 3 /c 5 /c 10 /b 13 /b 38 52 69 87
W. Africa 31 42 51 60 70 3 /c 6 /c 11 /b 12 /b 45 57 71 82
E. Africa 16 33 42 56 70 2 /c 5 /c 10 /b 12 /b 35 47 66 82
S. Africa 78 121 176 260 376 21 /b 31 /b 46 /b 66 /b 142 207 306 442
TOTAL 15,326 19,256 24,157 30,586 38,923 6,146 8,050 10,687 13,912 25,402 32,207 41,273 52,835
Ia Grovth rates from Commodity and Export Projections Division of the World Rank.7- scrap assumed as 15 percent of total consumption.7T Scrap 7 and 10X of total consumption for 1985 and 1990 respectively (assumption).7T Scrap 102 and 12X for 1985 and 1990 respectively.
NOTE: The price of aluminum used was (in 1980 US$/mt): 1,790 in 1985, 1,900 in 1990, 1,950 in 1995 Rnd 2,100 in 2000.
Source: World Bureau of Metal Statistics for 1980 Aluminum Consumption, except those marked with * which are estimates.

Table 4: ESTIMATES OF ALUMINUM CONSUMPTION - LOW CASE
(thousand metric tons)
PRIMARY CONSUMPTION SCRAP RECOVERIES /a TOTAL CONSUMPTION1980 1985 1990 1995 2000 1985 1990 1995 20600 1985 1990 1995 2000
UN America 2,382 3,011 3,418 4,004 4,489 989 1,196 1,446 1,748 4,000 4,614 5,450 6,237
EN Americo 2,382 3,011 3,418 4,404 4,489 989 1,196 1,446 1,748 4,000 4,614 5,450 6,237
C. Ameriea/Carib. 96 121 162 210 281 21 lb 28 lb 37 lb 49 lb 142 190 247 330
US America 117 116 151 200 263 20 lb 27 lb 35 lb 46 lb 136 178 235 309
ES America 378 489 693 989 1,407 106 153 220 315 595 846 1,209 1,722
U. Europe 3,884 4,240 4,847 5,583 6,398 1,542 1,859 2,240 2,699 5,782 6,706 7,823 9,097
E. Europe 2,776 3,244 3,696 4,242 4,884 7,094 1,389 1,765 2,241 4,338 5,085 6,007 7,125
Oceania 243 249 266 295 328 47 54 61 70 296 320 356 398
ASEAN 65 * 162 284 502 886 12 Ic 32 Ic 88 lb 156 lb 174 316 590 1,042 ,
Korea - P. Taiwan 240 * 362 542 788 1,120 40 Id 74 Id 139 lb 197 lb 402 616 927 1,317
China 618 887 1,116 1,345 1,575 67 Ic 124 Ic 237 lb 277 lb 954 1,240 1,582Z 1,852
Japan 1,637 1,891 2,360 2,999 3,762 934 1,221 1,596 2,086 2,823 3,581 4,595 5,848
Rest of Asia 278 * 403 546 735 987 30 Ic 61 Ic 130 lb 174 lb 433 607 865 1,161
Mid East 70 124 155 185 216 9 IC 17 Ic 33 lb 38 lb 133 172 218 254
S. Africa 35 35 44 55 70 3/c 5 Ic 10Ib 12 /b 38 49 65 82
W. Africa 31 42 51 60 70 3 /C 61 /ClI b 12 /b 45 57 71 82
E. Africa 16 25 30 37 46 2 /c 3 /c 7 /b 8 /b 27 33 44 54
S. Africa 78 118 171 248 361 21 lb 30 lb 44 lb 64 lb 139 201 292 425
TOTAL 15,326 18,530 21,950 25,781 31,632 5,929 7,475 9,545 11,940 24,459 29,425 36,026 43,572
/a Annual growth rate of scrap recoveries reduced with respect to the high case in pr~,portion to total consumption growth, i.e.,* US 3.9%, Canada 2.8%, ES America 7.5%, W. Europe 3.8% E. Europe 4.9%,Oceards 2.7Z, Japan 5.5%.
lb Scrap assumed as 15 percent of total consumption.7-c Scrap assumed as 7 and 10 percent of total consumption for 1985 and 1990.7d Scrap 10% and 12% for 1985 and 1990, respectively.
NOTE: The price of aluminum used was (in 1980 US$/at): 1,790 in 1985, 1,900 in 1990, 1,950 in 1995 and 2,000 in 2000.
Source: World Bureau of Metal Statistics for 1980 Aluminum Cons.umption, except those marked with * which are estimates.

- 19 -
Table 5: REGIONAL BREAKDOWN FOR ALUMINUM CONSUMPTION
Demand Region Countries Included /a
Western North America Western United States, West Canada
Eastern North America Eastern United States, East Canada
Central America & Caribbean Mexico
Western South America Colombia, Peru, Venezuela, Other SouthAmerica
Eastern South America Argentina, Brazil
Western Europe All Western European Countries includingYugoslavia
Eastern Europe USSR and all other Eastern EuropeanCountries
Oceania Australia, New Zealand
ASEAN Indonesia, Malaysia, Philippines, Thailand
Korea - P. Taiwan Korea, P. Taiwan, Hong Kong
China China, Other Eastern Asia
Japan Japan
Rest of Asia India, Turkey, Other Asia (excludingEastern Asia)
Middle East Bahrain, Iran, Israel, Lebanon
North Africa Egypt
West Africa Cameroon
East Africa Other Africa
South Africa Republic of South Africa
/a Correspond to data published in Metallgesellschaft, "Metal Statistics,"Frankfurt Am Main, various years. The countries specified on the righthand side are the only ones for which specific consumption figures aregiven in this source.

- 20 -
The reader should be aware of the fact that both bauxite and aluminahave uses outside the aluminum sector. According to King and Perlman 1/ about3 million metric tons of bauxite are allocated to non-aluminum uses. the mainproducing countries of non-metal grade bauxite-mainly clacined bauxite--areGuyana, Suriname, Australia and the United States. A breakdown of productionby country is shown in Table 6. The estimated growth rate of bauxite for non-metal uses, derived from this same source is 5.1 percent per year.
About 12.6 percent of aluminum consumption in the Western World isused for purposes other than aluminum production. 2/ This would amount toabout 2.3 million metric tons of non-metal alumina in 1980. Table 7 presentsan estimated production breakdown per region. Alumina for these other uses isexpected to grow at 3.5 percent per annum. 3/
3.2 Investment and Operating Costs for Bauxite
Investment costs for bauxite mines depend on the size of the mine,the strip ratio, locational factors and infrastructure requirements. Table 8presents a formula to estimate capital costs for mines as a function of thesefactors. Table 9 shows an estimate of location factors for various regions,taking into account variations in equipment and construction costs as well asphysical infrastructure. With the data from Tables 1, 8 and 9, we mayestimate that to open a mine of 4 million tons per year in Brazil, would costabout US$70/metric ton of bauxite 4/ per year while a mine in Guinea with thesame capacity would cost only US$51/metric ton of bauxite per year due to thelack of over-burden.
Mines in remote undeveloped locations require very heavy investmentsin infrastructure which need to be spread out by developing large projects.Thus, in the case of locations such as Los Pijiguajos in Venezuela, Cameroon,Kalimantan in Indonesia, and Tougue/Dabola/Kindia in Guinea, a minimum minesize of about 3 million metric tons per year would be required for a projectto be economical.
Estimates of operating costs for mines are given in Table 10.Besides the factors mentioned above, these costs consider the type of deposit,labor requirements and costs, and drying expenditures. Costs are given in1980 US dollars per metric ton of bauxite excluding moisture content, and theyinclude drying. Australian mines do not consume fuel for drying., since asmentioned before, they use solar drying. If bauxite is to be refined locally,drying costs shown in the table should be reduced by 50 percent.
1/ King, James and Louis Perlman, "Trends and Prospects in the Bauxite andAlumina Markets," Commodities Research Unit, Ltd. In: The Journal of theGeological Study of Jamaica, Proceedings of Bauxite Symposium IV, June1980.
2/ King and Perlman, op. cit.
3/ Derived from data in King and Perlman, op. cit.
4/ All values shown in 1980 US$ unless otherwise stated.

- 21 -
Table 6: ESTIMATES OF BAUXITE PRODUCTION FOR NON-METAL USES, 1980
(thousand metric tons of bauxite)
Bauxite Production of UsesOther than Alumina /a
United States 272Guyana 1,765Suriname 493Australia (Weipa) 230China 200
TOTAL 2,960
/a United States: Baumgardner, Luke and Ruth Hough, "Bauxite and Alumina"Reprint for the 1978-79 Bureau of Mines Mineral Yearbook, Bureau of Mines,United States Department of the Interior. 1980 estimates based on 1979data, assuming 5.1% annual growth. Suriname and Australia: World Bankestimates. Guyana: IBA data; 1980 estimate assuming 5.1% annualgrowth. Australia: Australian Government Publishing Service, "AustralianAluminum Industry Supply Potential," Canberra, 1980. China: World Bankdata.
Table 7: ESTIMATE OF ALUMINA PRODUCTION FOR NON-METAL USES, 1980
(thousand metric tons of alumina)
Alumina for Non-Metal Uses
United States 833Western Europe 808Japan 549India 36Guyana 51 /aBrazil 46 7W-
TOTAL 2,323
/a Aluminous cement.7Fb Estimate
Source: Estimated from International Primary Aluminum Institute, "StatisticalSummary," United Kingdom, 1980.

- 22 -
Table 8: CAPITAL COST FOR MINES
(US$ 1980)
Total capital cost including infrastructure, strip ratio and location factorsbut excluding railroads.
Mine Size Capital Cost
(Million tons per year) (Mill. US $)
0 - 1.6 sf x lf x (30 + 27.5 x size)1.6 - n x 1.6 sf x lf x ( 46.25 x size)n x 1.6 - sf x lf x ( 55.5 x size)
where sf: strip ratio factor
Strip Ratio Strip Ratio Factor
0:1 1.01:1 1.222:1 1.373:1 1.50
lf: location factor from Table 9
n: diseconomy of scale factor, between 2 and 4 depending on location.
Sources: Economies of scale factor, estimated from Bennett H., "AnEconomic Appraisal of the Supply o_ Copper from PrimaryDomestic Sources," U.S. Bureau of Mines, 1973.
World Bank consultant.

- 23 -
Table 9: LOCATION FACTORS FOR MINE CAPITAL COSTS
Country/Region Factor
United States 1.00
Western Europe (Greece, Yugoslavia, France) 1.00
Eastern Europe 1.00
China 1.00
Jamaica 1.10
Haiti/Dominican Republic 1.10
Guyana 1.10
Suriname 1.10
Brazil 1.10
Venezuela 1.10
Australia 1.10
India 1.10
Indonesia 1.10
Other Asia 1.10
Ghana 1.10
Guinea 1.10 - 1.25
Sierra Leone 1.15
Cameroon - Other Africa 1.25
Source: World Bank estimates.

Table 10: OPERATING COSTS FOR BAUXITE MINING, YEAR 2000
(1980 US$/mt bauxite)
CharacteriAtics of DepositStripRatio Fuel
Type /a (as Labor Drying Motor MaterialsRelative Slze of mined Mining and Wage Fuel for Fuel Fuel and andThickness Ore Bodies Basis) Maintenance Stripping Drying Rate /c Drying /d Costs /e Lubricant /f Services /g Total /h
(m-hr/mt) (m-hr/mt) (n-hr/nt) ($/m-hr) (Gal/mt) ……---------($/Mt)------------------------…
United States Thick/Large 3.5:1 .3 .32 .1 11 2.40 - 1.20 3.50 15.4Jamaica Medium/Small-Medis 0:1 .4 .10 .2 4 2.40 2.00 1.20 3.50 11.0daiti Thin/Small-Mediu 0:1 .4 .10 .2 2 2.40 2.00 1.20 3.50 11.0
Guyana Thick/Large 4:1 .4 .57 .2 4 2.40 2.00 1.20 3.50 12.6Suriname (bakhuis) Medium/Large 0:1 .4 .11 .2 6 2.40 2.00 1.20 3.50 11.0Brazil Thick/Large 2:1 .4 .23 .2 6 2.40 2.00 1.20 3.50 12.6Venezuela Thick/Large 1:1 .4 .13 .2 6 2.40 2.00 1.20 3.50 11.8Western Europe tedius/nediu- 3:1 .3 .40 .1 11 2.40 2.00 1.20 3.50 15.4(Greece principally)Eastern Europe Medium/Medium 3:1 .3 .32 .1 4 2.40 2.00 1.20 3.50 9.8Australia Thick/Large 0:1 .3 .15 .1 11 2.40 - 1.20 3.50 10.2(Gove/Weipa)
Australia (West) Medium/Medium 0:1 .3 .10 .1 11 2.40 2.00 1.20 3.50 10.2India Medium/Medium 1:1 .4 .14 .2 2 2.40 2.00 1.20 3.50 8.1Indonesia Medium/Large 1:1 .4 .14 .2 2 2.40 2.00 1.20 3.50 8.1China Medium/Large 1:1 .4 .14 .2 2 2.40 2.00 1.20 3.50 8.1Other Asia (Kalaysia) Medium/Medium 1:1 .4 .14 .2 2 2.40 2.00 1.20 3.50 8.4Ghana Medium/Medium 1:1 .4 .14 .2 5 2.40 2.00 1.20 3.50 10.9Guinea Thick/Large 1:1 .4 .12 .2 5 2.40 2.00 1.20 3.50 10.3Sierra Leone Medium/Medium 1:1 .4 .12 .2 4 2.40 2.00 1.20 3.50 10.3Cameroon Thick/Large 1:1 .4 .14 .2 4 2.40 2.00 1.20 3.50 10.3
/a Characteristics of Deposit:
Average Size of Ore Pocket:Thickness; Thick 15-40 ft Large 2-5 - tons each
Medium 10-20 ft Medium: 1-2 - tons eachThin 2-10 ft Small: 200-500 a tons each.
/b Mining Labor and Maintenance Labor (includes supervisors)For Industrialized Natiotns 0.28 a-hr/mtFor Developing Countries 0.43 -hr/mt
Drying LaborFor Industrialized Nations 0.14 -hr/mtFor Developing Countries 0.21 m-hr/nt
Stripping LaborFor each increment of strip ratio 0.33X of mining labor is added.
/c The wage rates were estimated from the International Labor Organization Statistics Yearbook and fron industry sources. Wages and salaries include payments in kind, contributions of employers tosocial security and other benefits.
/d Fuel for drying corresponds to 2.4 gallons of bunker fuel oil/mt bauxite in order to reduce moisture content by 5%. Jamaican and laitian bauxites are dried from an average of 15% to 10%moisture. All other bauxites are dried from 10% to 5% moisture. Dominican Republic and Northern Australia (Gove/Weipa) use solar drying and therefore do not use drying fuel. Note that ifbauxite is processed at a local refinery it is not dried at the mine but the moisture is evaporated at the refinery at about 50% savings.
/e Fuel costs at US$35/US Bbl or US$0.83/US Gal.
/f Motor fuels average about US$0.80/mt, lubricants about US$0.10/mt.
/g Include parts, supplies and miscellaneous.
/h Total costs include mine haul of up to six miles to local alumina plants or port facilities. Except for the U.S. and Western Australia all figures are for bauxite for exports (drying by 5%moisture using fuel or solar drying).
Note; The above represent an estimated average for each location. In sane nations there are multiple deposits which may vary both in character And analysis. Figures sho-n are all calculated on theaa e basis for comparative purposes one with another.
Source: World Bank and Mr. Richard Roberts (consultant).

- 25 -
The data from Tables 8 to 10, together with transportation costs andbauxite levies (the last two are detailed in sub-sections 3.5 and 3.6), areused to estimate total production costs for bauxite, which are presented inTable 11. This table shows that capital costs and levies are as important asoperating costs. Inland transportation costs are also significant in a numberof countries. Since Jamaica, Haiti, the Dominican Republic and Surinamecredit the levy against income taxes, its impact is greatly reduced if bauxiteis processed locally. This effect is shown in the last row of Table 11.
The figures on bauxite production costs from Table 11 must be usedtogether with information on bauxite quality and ocean transport costs to therefineries in order to make comparisons on the convenience of using aparticular bauxite. This comparison is made in the sub-section on aluminarefining for selected bauxites and locations.
3.3 Investment and Operating Costs for Alumina
Capital costs for alumina refineries vary according to the type ofprocess required, to the location and to the plant dimensions. Table 12 showsa formula to determine approximate investment costs taking these factors intoaccount. Thus, an American Bayer type refinery of one million metric tons peryear capacity, located in the United States, would cost US$1,050 per ton ofalumina; while if capacity doubles it would cost US$890 per ton. A ModifiedAmerican Bayer type refinery in Jamaica would cost US$1,220 per ton for a 1million ton capacity, and US$1,030 per ton for a plant twice that size.Differences in capital costs between regions and processes may go as high asUS$340 per metric ton (not considering the soda-sinter process) equivalent toabout US$40 in annualized terms.
The main inputs for alumina refining are, as pointed out previously,bauxite, caustic soda (NaOH), lime (CaO), energy, labor, and other inputs(including filter aid, floculants and chemicals). These inputs have beenquantified in Table 14 for different bauxites according to the refiningprocess required, as well as to the quality of the bauxite. For simplicity,representative averages for bauxite/alumina ratios and silica content havebeen taken over groups of countries. These averages represent only in anapproximate way specific bauxite deposits in each country, as may be comparedwith original data shown in Table 1. Besides differences in bauxiterequirements and caustic soda consumption, energy consumption also varies,being somewhat higher for the Modified American Bayer and European Bayerprocesses. The soda sinter process which includes a Bayer plant plusadditional sintering stages consumes considerable energy. Labor inputs arealso somewhat higher for the Modified American and European Bayer processes,and significantly higher for the soda-sinter process.
The prices of inputs for alumina refining excluding labor are shownin Table 15. Estimates of labor costs for various countries are given inTable 16. Tables 14 to 16, together with the capital cost estimates, and withdata on bauxite costs from the previous section permit us to compute somerepresentative alumina refining costs for new plants which are shown in Table17. It may be appreciated that alumina refining is capital intensive withcapital charges representing about 33 percent of alumina costs. Because of

Table 11: TOTAL COSTS OF BAUXITE PRODUCTION, YEAR 2000
(US$/metric ton dry bauxite)
Western
United Suriname Europe EasternStates Jamaica Haiti Guyana (Bakhuis) Brazil Venezuela (Greece) Europe
Operating Cost 15.40 11.00 11.00 12.60 11.00 12.60 11.80 15.40 9.80
Capital Charges 5.70 4.20 4.20 5.80 4.20 5.80 5.10 5.80 5.80
Inland Transportation 1.00 0.2 0.50 2.80 5.70 4.80 5.20 8.00 1.30
Levy - 10.00 /a 22.80 - 21.20 - - - -
Total for Export 22.10 25.40 38.50 21.20 42.10 23.20 22.10 29.20 16.90
Less (for Local Processing):
Savings in Income Tax - 9.50 10.30 - 10.30 - - - -
Savings in Drying - 1.50 1.50 1.60 1.60 1.60 1.60 1.60 1.60
Total for Local Processing 22.10 14.40 26.70 19.60 30.20 21.60 20.50 27.60 15.30
a,i
Australia Australia Other Sierra
(Gove,Weipa) (West) India Indonesia China Asia Ghana Guinea Leone Cameroon
Operating Cost 10.20 10.20 8.10 8.10 8.10 8.40 10.90 10.30 10.30 10.30
Capital Charges 4.20 4.20 4.20 4.20 3.80 5.10 5.10 4.20 4.40 4.80
Inland Transportation 1.20 0.90 4.90 4.00 8.70 0.30 2.50 3.70 1.90 18.00
Levy - - - 1.40 - - 2.50 9.90 - -
Total for Export 15.60 15.30 17.20 17.70 20.60 13.80 21.00 28.10 16.60 33.10
Less (For Local Processing)Savings in Income Tax - - - - - - - - - -
Savings in Drying - 1.30 1.60 1.60 1.60 1.60 1.60 1.60 1.60 1.60
Total for Local Processing 15.60 14.00 15.60 16.10 19.00 12.20 19.40 26.50 15.00 31.50
/a Corresponds to levies applied to additional production.
Source: Computed from Tables 8 and 10. Data on levies from Section III.

- 27 -
Table 12: CAPITAL COST FOR ALUMINA REFINERIES
(US$ 1980)
Total capital cost including infrastructure and location factors.
Refinery Size Capital Cost
(Million tons per year) (Million US$)
0 - 2.0 pf x lf x (330 + 720 x size)2.0 - n x 2.0 pf x lf x( 885 x size)n x 2.0 - pf x lf x ( 1,062 x size)
where pf: process factor
Process Process Factor
American Bayer 1.0Modified A. Bayer 1.06European Bayer 1.12Soda-Sinter 1.30
lf: location factors from Table 13.
n: diseconomy of scale factor, between 2 and 5 depending on location.
Sources: Woods, D. "Financial Decision Making in the Process Industry,"Prentice Hall, New Jersey, 1975.
World Bank consultant.

- 28 -
Table 13: LOCATION FACTORS FOR CAPITAL COSTS FOR REFINERIES (IFR)AND SMELTERS
Country/Region Factors IFR and IFS
Western United States 1.00Eastern United States 1.00Western Canada 1.00Eastern Canada 1.00Western Europe 1.00Japan 1.10Eastern Europe 1.10Jamaica 1.10Oceania 1.10Central America (mainly Mexico) 1.10Suriname 1.10Brazil 1.10Argentina 1.10Venezuela 1.10Korea - Prov. of Taiwan 1.10India 1.10Rest of Asia 1.10South Africa 1.10Guyana 1.10ASEAN 1.10China 1.10North Africa 1.25Asian USSR 1.25Middle East 1.25Ghana 1.25Guinea 1.25Zaire 1.25Cameroon - Rest of Africa 1.25
Source: World Bank Consultant and Industry estimates.

- 29 -
Table 14: ALUMINA REFINERIES: PROCESSING AND INPUT REQUIREMENTS FOR SELECTED BAUXITES
(Per metric ton of alumina)
American Bayer
B. Suriname (Moengo,Paranam), Brazil,Venezuela, Indonesia,Ghana, Guinea (Fria), C. Suriname (Bakhuis) D. Western Australia
A. Guyana Sierra Leone Jamaica (Main Plateau) (Darling Range)
Bauxite, mt. (Dry Basis) 0.2 2.2 2.4 3.4
Caustic soda, mt. 0.11 (4% Si02) 0.9 (3% Sic2) 0.10 (3% SiO2) 0.07 (1.5% Sic2)(silica X)
Lime, mt. 0.1
Energy, million Btu 13.1
Total Labor and 1.8Supervision, man-hours
Other (other materials 30.0plus admin. andselling expenses)1980 US$
Modified American Bayer
B. Australia: Weipa, GoveGuinea: Tougue, Dabola,
A. Jamaica, Haiti, Dominican Republic Kindia, Aye Koye, Boke
Bauxite, mt. (Dry Basis) 2.7 2.2
Caustic soda, mt. 0.09 (2.5% SiO2) 0.12 (4% Sic2)
Lime, mt. 0.1
Energy, million Btu 14.1
Total Labor and 2.0Supervision, man-hours
Other (other materialsplus admin. and selling 30.0expenses) 1980 US$
European Bayer Soda Sinter Process
Western Europe United StatesEastern Europe China
Bauxite, mt. 2.5 Bauxite, mt. 2.3
Caustic soda, mt. 0.15 (4.3% Sic2) Caustic soda, mt. (silica %) 0.05 (15% SiO2)
Lime, mt. 0.1 Limestone, mt. 1.75
Energy, million Btu 14.7 Energy, million Btu 43.0
Total Labor and Supervision, man-hours 2.0 Total Labor and Supervision, man-hours 4.0
Other (other material, plus admin 30.0 Other (other materials, plus admin. 60.0and selling expenses) 1980 US$ and selling expenses) 1980 US$
Source: From Table l,and World Bank estimates.

- 30 -
Table 15: PRICES OF INPUTS FOR ALUMINA REFINING, 1980, EXCLUDING LABOR
Caustic soda $170/mt
Lime $40/mt
Fuel US$4.45/million Btu
Source: Industry and World Bank.
Table 16: LABOR COSTS AT ALUMINA REFINERIES
Wages and Salaries per Man-Hour in 1980 US$
Western US 11Eastern US 11Western Canada 11Eastern Canada 11Argentina 11Western Europe 11Oceania 11Japan 11Middle East 11Jamaica 5Central America/Caribbean (Mexico) 5Guyana 5Suriname 5Brazil 5Venezuela 5Eastern Europe 5Asian USSR 5Ghana 5Guinea 5Zaire 5Rest of Africa 5South Africa 5ASEAN 3Korea - Prov. of Taiwan 3
India 3China 3Rest of Asia 3North Africa (Egypt) 3

Table 17: PRODUCTION COSTS FOR ALUMINA, SELECTED SITES, YEAR 2000
US$ (1980)/aetric ton
United States - East Coast Western Europe Australia Jamaica Brazil Guinea SurinmeJamaican Jaaican Bracilin Guine-n Greek Guine-n Australian I Local *I - I laceBauxite Bauxite Bauxite Bauxite Bauxite Bauxite Bauxite Bauxite Bauxite Baxite Bauxite Bauxite(Mixed) (Trihydrate) (Tribydrate) (Mixed) ()4onohydrate) (Mixed) (Mixed) (Trihydrate) (Mixed) (Trihydrate) (Mixed) (Tribydrate)
Bauxite 42 37 51 40 73 40 34 52 42 51 40 50Mgt LATY 45(27) /b 40(27) /b - 22 - 22 - -- 19(0) /b - 22 17
Trasport cost for bauxite 17 15 24 32 31 24 65 - - - - -Custic soda 15 17 15 20 25 20 20 12 15 15 20 17LiM 44 4 4 4 4 4 4 4Energ 63 59 59 64 66 64 64 59 63 59 64 59Labor 22 20 20 22 22 22 22 20 10 9 10 9Otbhr 30 30 30 30 30 30 30 30 30 30 30 30Capital charges /a 119 113 113 119 127 119 119 124 131 124 149 124
Total. f.o.b. 357(339) 335(321) 316 353 378 345 358 301 314(295) 292 339 310PlUe tramaport cost to:
United Stats-East Cost - - - - - - -- 34 6 17 20 17
Wastern Europe - - - -- - - 43 - - 14 -
Total delivered alumina at:United States-East Cost 357(339) /b 335(321) lb 316 353 - -- - 335 320(301) /b 309 359 327
Western luropa - - - - 378 345 358 344 - - 353 -
/a For a two million metric ton per year plant.7ii Data in parenthesis corresponds to levies applied to additional production.
Source: Computed from Tables 11, 12, 13, 14, 15 and 16, and fro- data in subsections 3.5 and 3.6.

- 32 -
this, and given the existence of significant economies of scale in aluminarefining , considerable attention is paid by aluminum companies to the size ofthe plant. This may be illustrated by the fact that operating a one millionton per year plant would cost, because of higher capital charges, about 6percent more per ton of alumina, than operating a two million ton plant.
Bauxite constitutes another major component of alumina costs, ofwhich it accounts for 26 to 28 percent. The cost of delivered bauxiteincludes ocean transport costs and the bauxite levy. Thus, ocean transportcosts as a percentage of bauxite delivered at the East Coast of the UnitedStates, represents 20 percent for Jamaican bauxite, 32 percent for Brazilianbauxite and 34 percent for Guinean bauxite. For bauxite delivered in WesternEurope these figures are 30 percent for Greek bauxite, 28 percent for Guineanbauxite and 65 percent for Australian bauxite. Some conclusions may bederived from these figures. First, the cost of the levy for bauxite comingfrom countries such as Jamaica and Guinea may be somewhat compensated withlower shipment costs of these bauxites to main industrial countries. Second,if alumina is processed locally in the bauxite producing countries,significant savings in transportation may arise, thus making producers whichare far from the main markets more competitive, as in the case of Australia.
Among the other inputs for alumina refining, energy, caustic soda andlabor are important. Energy represents about 18 percent of costs, whilecaustic soda and labor account each for 3-6 percent of the cost of producingalumina.
3.4 Investment and Operating Costs for Aluminum, Including Energy Costs.
As with any industrial plant, unit capital costs for aluminumsmelters diminish with increasing plant size. However, savings due toeconomies of scale are relatively small since large plants differ from smallerones mainly in the number of potlines arranged in series. Table 18 showsestimates of capital costs of smelters, where economies of scale are achievedonly up to 200 thousand metric tons per year of aluminum. From this table wecan calculate that in an industrial country a one hundred thousand metric tonsper year smelter would cost US$3,400/metric ton, while a 200 thousand tons peryear smelter would cost US$2,900/metric ton. Similarly, for a remote locationin a developing country, these figures would be about US$4,100/metric ton fora 100 thousand ton per year plant and US$3,600/metric ton for a plant twicethat size. Infrastructure factors for smelters are shown in Table 13.
Main inputs for aluminum smelting, besides capital charges, consistof alumina, power, coke and pitch (anodes), labor and fluorides. Table 19shows a quantification of these inputs. Electricity inputs are taken at13,500 kwh per metric ton of aluminum for new plants in 1980 with productivity

- 33 -
Table 18: CAPITAL COST FOR SMELTERS
(US$t1980)
Total Cost including infrastructure.
Smelter Size Capital Cost
(million tons per year) (million US$)
O - .2 lf x (100 + 2,400 x size).2 - n x .2 lf x ( 2,900 x size)n x .2 - lf x ( 3,480 x size)
where: lf = location factors from Table 13.
n = diseconomy of scale factor, between 2 and 10 dependingon location.
Source: Same as Table 12.

- 34 -
Table 19: INPUTS FOR ALUMINUM SMELTERS
(Per metric ton of aluminum)
Prebaked System
Alumina, metric tons 1.93
Power, Kwh /a 13,500 - 14,300 (1980)13,160 (1985)12,800 (1990)12,600 (1995-2000)
Labor, man-hours 8.6
Thermal energy - million Btu 4.4
Coke, metric tons 0.375
Fluorides, /b kilograms 30
Pitch, metric tons 0.10
Other costs (maintenance, overhead) 220US$ 1980
/a We assume, as Anthony Bird Associates, an improvement on electrical energyproductivity of 0.5% a year.
/b Cryolite and aluminum fluoride.
Sources: Woods, Douglas and James C. Burrows, "The World Aluminum-BauxiteMarket," Praeger, 1980.
Company data.Anthony Bird Associates, Aluminum Annual Review, February 1981.World Bank consultant.
- 35 -
improvements of 0.5 percent per year until a lower limit of 12,600 kwh/mt isreached. 1/ The other inputs have been obtained from various sources, mostofwhich are in agreement with each other. Input costs excluding wages andelectricity are shown in Table 20. The prices of petroleum coke and thermalenergy are estimated to increase by 3.2 percent per year in real terms, i.e.,at the same rate estimated by the World Bank for oil prices. With respect towage rates, the same data as for alumina refining may be used (see Table17). Estimates of electric power costs per region are shown in Table 21.Power costs for new projects vary from figures as low as 6 mils/kwh forspecific projects to 20 mils/kwh for high head hydropower or flared gas and to30 mils/kwh for low head hydropower. 2/ Coal and nuclear energy areconsidered at a higher cost, i.e., 50 mils/kwh, except for Australia whichprocesses coal deposits near the power generating plants.
Since aluminum is highly intensive in electrical energy, aluminumproducers require low cost sources for power. As shown above, hydroelectricpower and flared gas offer the best possibilities for cheap powergeneration. Table 22 shows the world's undeveloped energy resources of hydro-power and flared gas together with estimates and coal reserves forAustralia. Part of these resources could be used as the sources ofelectricity for new aluminum smelters. As an illustration of the amount oflow cost power that could be made available for new smelters, Table 23 showspotential electricity supplies for aluminum smelting if 10 percent ofhydropower and 25 percent of flared gas are destined for this purpose. Sincecoal is an exhaustible resource, in the case of Australia (Oceania) only15,000 gigawatt hours per year generated from coal are considered forsmelting. Table 23 also presents, in the first column, the quantity ofcurrent low cost electricity currently used for aluminum smelting.
With the above data, estimates for aluminum production costs atselected locations have been prepared, and are shown in Table 24. Aluminumcosts from new projects range from a low US$0.79/pound for Australia toUS$0.98/pound for the United States. Alumina, electric power and capitalcosts are the most important cost elements in aluminum smelting. Aluminaaccounts for 30 percent of aluminum costs, electricity varies from 16 to 30percent of costs, and capital charges represent from 16 to 35 percent.Differences in these three cost items are significant among regions but thoseof power costs are by far the most variable. As it may be appreciated fromTable 24, low cost electric power is therefore the main determinant for theeconomic viability of an aluminum smelter.
1/ See Anthony Bird Associates, "Aluminum Annual Review, February 1981" forproductivity estimates. The lower limit of 12,600 kwh/mt has been quotedby experts in the field. The estimate is based upon continued marginalimprovements in the efficiency of the basic process, and does not assume amajor technological breakthrough.
2/ Averages estimated by the Energy Department of the World Bank.

- 36 -
Table 20: PRICES OF OTHER INPUTS AT ALUMINUM SMELTERS
(1980 US dollars)
Thermal energy US$4/million Btu (3.2% per year increase inreal terms for 1980-2000)
Coke US$360/metric ton (3.2% per year increase inreal terms for 1980-2000)
Fluorides US$0.70/kilogram
Pitch US$250/metric ton
Source: World Bank estimates.

- 37 -
Table 21: COST OF ELECTRIC POWER FOR ALUMINUM SMELTERS(COSTED AT GENERATING SITES)
(US$ 1980 kilowatt hour)
PossibleLow Cost Higher Cost
Existing For New ElectricityLow Cost Smelters (coal or nuclear) /a
United States West .02 /b - .05United States East .024 - .05Canada West .004 .03 .05Canada East .004 .03 .05Jamaica - - .05Central America/Caribbean - .02 .05Guyana - .02 /c .05Suriname .0045 /d .03 .05Brazil .02 .02 .05Argentina .008 .03 .05Venezuela .026 /e .03 .05Western Europe .020 - .05Eastern Europe .02 - .05Asian USSR .02 .02 .05Oceana .012 .02 .05ASEAN - .02 .05Korea/P. Taiwan - .02 .05China .02 .02 .05Japan .02 - .05India .02 .03 .05Rest of Asia .02 .03 .05Middle East .003 .02 .05Northern Africa .02 .02 .05Ghana/Other West Africa .0048 /g .02 .05Guinea - .02 .05Zaire .006 /h .05Rest of East Africa - - .05South Africa .02 - .05
/a See: World Bank, "Energy in the Developing Countries," August 1980, p.43; also see Murray Lester, "The Outlook for Power in the AluminumIndustry," Light Metal Age, June 1980, p. 26. The capital cost of a coalpower plant is about US$1600/kw; considering a real rate of return of 10-15% and dividing by 7000 kwh/kw the capital cost component of coalgenerated power would be in the range of US$0.02/kwh to US$0.03/kwh. Ifwe add the cost of coal we obtain a total cost range of US$0.03/kwh -0.06/kwh depending on coal mining costs, quality and transport cost.
/b Bureau of Mines, U.S. Department of the Interior, "Minerals and Materials--a Monthly Survey," July 1981, Washington, D.C., page 2.
/c IRA Review, September 1977, p. g, cites from 5-6 to 10 mils/kwh.
/d According to the Brokopondo Agreement between the Suriname Government andSuralco.
/e Metal Bulletin, February 17, 1981, p. 15.
/f Metal Weeks, January 19, 1981, mentions that power from the Asahan Riverwill cost US$0.012/kwh.
/g Ghana US$0.0048/kwh, Cameroon US$0.01/kwh.
/h Project which would use electricity from the existing power plant.
Source: See footnotes above. Electricity generated with flared gasconsidered at US$0.02/kwh, hydroelectricity priced at US$0.02/kwhfor high head rivers and at US$0.03/kwh for low head rivers.

38 -
Table 22: UNDEVELOPED ENERGY RESOURCES
(Gigawatt hours/year)
Hydropower Flared Gas Coal
United States West - - -
United States East -Canada West 131,400 /aCanada East - 7 _Jamaica - -
Central American/Caribbean 50,620 /b 18,200 /cGuyana 17,400 - -
Suriname 4,400 - -Argentina/Chile/Peru 267,800 /d - -
Brazil 261,640 - -
Venezuela 50,560 34,900 -
Western Europe - - -Eastern Europe - - -
Asian USSR 48,000 /e - -Oceania 145,610 7 - 160 million total /g /hASEAN 120,340 14,700 /i -
Korea/P. Taiwan -
China 17,300 /jJapan -India 161,540Rest of Asia 42,410 /k - -
Middle East - 315,600 /1 -
Northern Africa - 39,500 7;; -Ghana - Rest of W. Africa 153,000 /n 97,400 7; -Guinea 56, 064 7] - -
Zaire 109,000 -
Rest of East Africa - -
Southern Africa
/a Brubaker, Sterling, in Trends in the World Aluminum Industry mentions that mostpotential in East Canada would be employed for other uses, but that there is potentialin West Canada. Nevertheless, 3,000 gigawatt hours per year are considered availablefor new smelters in East Canada.
/b Mexico - 15,080; Costa Rica - 35,540.
/c Mexico.
/d Argentina - 181,000; Chile - 55,760; Peru - 31,040.
/e Siberia, from Brubaker (o2. cit.).
/f Papua New Guinea.
La. See OECD, "The Australian Primary Aluminum Industry: Situation and Prospects," June1980. The article considers 60,000 million tonnes. From "Coal Development Potentialand Prospects," (World Bank) we obtain a conversion factor of 0.65 from tce to tons ofoil equivalent (toe) and use 4,200 Kwh/toe.
/h We estimate 0.8 million gigawatt hours per year of energy consumption in Australia for1973 and about 5 - 6 million gigawatt hours by the end of the 21st Century. Sincecoal is an exhaustible resource, a reasonable figure of coal for new smelters would bethe equivalent of not more than 15,000 gigawatt hours per year.
/i Indonesia.
/ P From World Bank, "Energy Options and Policy Issues in Developing Countries," StaffWorking Paper No. 350, August 1979.
/k Pakistan.
/1 Iran 98,500; Iraq 16,900; Kuwait 21,700; Saudi Arabia 124,600; United Arab Emirates53,900.
/m Egypt 3,600; Algeria 35,900. The figures on flared gas for Algeria was obtained fromEditiona Technip, "The Gas Industry in the World," Paris, 1977. Data on flared gasfor Egypt was obtained from World Bank, "Egypt - Economic Management in a Period ofTransition," Johns Hopkins, Baltimore, 1980.
/n Angola 64,070; Cameroon 31,040; Congo 19,400; Gabon 38,800.
/o Nigeria.
/p From World Bank, "Energy in the Developing Countries," Washington, D.C., August 1980.
/q World Bank estimate.
/r All potential hydroelectric energy is high cost.
Source: Bullock, R. Andrew and Christopher M. Niemczewski: 'Energy Considerations in theProduction of Aluminum in the Developing Countries," paper presented to theInternational Materials Congress, Reston, Virginia, March 26-29, 1979. Whenother sources were used they are specified in the footnotes.

- 39 -
Table 23: ELECTRICITY SUPPLIES AVAILABLE FOR ALUMINUM SMELTING
(Gigawatt hours per year)
Currrent /a New /bLow Cost Low Cost
United States West 23,500United States East 21,300 -Canada West 3,700 13,100Canada East 11,700 3,000 /eJamaica - -Central America/Caribbean 300 9,600Guyana - 1,700Suriname 890 440Brazil 3,800 26,200Argentina 1,900 26,800Venezuela 5,500 13,800West Europe 37,900 _East Europe 32,700 -Asian USSR 14,700 4,800Oceania 7,200 29,600ASEAN - 15,700Korea - Taiwan -China 5,531 1,730Japan 3,900India 2,850 16,200Rest of Asia 850 /c 4,200Middle East 4,100 78,900North Africa 1,800 9,900Ghana - Rest of West Africa 3,600 39,600Guinea - 5,600Zaire 2,400 /dRest of East Africa - -
South Africa 1,100
/a Estimated from Bureau of Mines, U.S. Department of the Interior, "PrimaryAluminum Plants, Worldwide," Washington, D.C., 1981. Such report givesthe sources of electric power for each aluminum plant. The low cost poweris considered only as that generated by hydroelectric sources, coal andnatural gas for oil exporting countries. The electric power available wasestimated as Plant Capacity (thousand mt) x 0.95 (capacity utilizationrate) x 14.3 gigawatt hours/thousand mt.
/b The figures shown here correspond to 10% of new hydropower potential 25Xof flared gas plus 15,000 gigawatt hours considered for Australian coal(see Table 4).
/c Turkey.
/d Only currently available power.
/e Power considered available for smelters.
Sources: see footnote /a

Table 24: ALUMINUM PRODUCTION COSTS AT SELECTED SITES, YEAR 2000 (New Plants)
(US$1980/metric ton)
United Western MiddleStates Canada Brazil Europe Australia East Japan
Alumina 620 620 575 670 560 580 600
Power 630 400 270 630 270 270 630
Labor 95 95 50 95 95 95 95
Thermal Energy 33 33 33 33 33 33 33
Coke 252 252 252 252 252 252 252
Fluorides 25 25 25 25 25 25 25
Pitch 25 25 25 25 25 25 25
Other 220 220 220 220 220 220 220
Capitalcharges /a 360 360 410 360 390 440 390
Total in US$/mt 2,260 2,030 1,860 2,310 1,870 1,940 2,270
in US/4b. 1.02 0.92 0.84 1.05 0.85 0.88 1.03
/a For a 200,000 ton per year smelter.
Source: Computed from Tables 18 to 23; Alumina costs from Table 17.

- 41 -
3.5 Transport Costs
Although mine and plant costs are an important component of totalcosts of producing aluminum, there are also other significant factors. Theseother factors are related to location both in a geographical sense as well aswith respect to the policies of each country being considered. We shalldiscuss transport costs first.
Transport costs for bauxite associated with any given mining site mayconstitute an important factor in investment decisions. If a deposit islocated far from a refinery/smelter complex, the delivered cost of bauxite oralumina may be too high with respect to alternative sources. Since landtransportation costs for short routes may be as costly as ocean transportationfor distances one hundred times as great, this component needs to be takeninto consideration when estimating shipment costs. Therefore, this sectionconsiders both inland transport costs as well as ocean shipment costs.
Bauxite deposits are frequently located inland, in isolated areas,requiring long hauls to refineries and/or to ports. When their location isremote and there are little or no facilities in the area, there will usuallybe a preference to build the alumina refinery adjacent to a port or a city,even if these are far away from the deposits. This permits the companies toattract and maintain qualified personnel and to reduce social infrastructureexpenditures. Therefore, in many cases bauxite and not alumina is transportedfrom inland locations to seaports for its shipment overseas, or for itsprocessing into alumina to a refinery located near the port.
For inland transportation, shipments by river are preferred if thegeographic conditions are adequate and the rivers are navigable. Railroadtransportation is used for long hauls if rivers are not available, while beltconveyors are economic over short to medium distances. When shipments aresmall, deposits are scattered and distances involved are relatively short,road transportation is used. In Table 25, the means of inland transportationcurrently used from bauxite mines to refineries and ports as well as averagedistances, are reported. This table, together with Table 26, which presentsestimated unit transport costs, permits the computation of inlandtransportation costs. An analysis of these data shows that for countries suchas Jamaica or Northern Australia, inland transport costs are only about US$1per ton of bauxite whereas for countries such as Brazil and Guinea, where thedeposits are away from the coast, these figures may be as high as US$5 per tonof bauxite. An extreme case is Cameroon, where if its bauxite deposits weredeveloped, it would require about US$17 to transport one ton of bauxite to thecoast.
In analyzing ocean shipment costs, one must consider that bauxite andalumina are traded internationally in much higher volumes than aluminum,although in recent years, an increasing number of smelters have been builtoutside the main consuming countries. Exports of bauxite in 1978 amounted toabout 36 million tons, of which 27 million tons originated in developingcountries. Meanwhile, alumina exports, for the same year, were 12 milliontons, with about fifty percent coming from developing countries. Participationof developing countries in aluminum exports was less significant with 0.5million tons from these countries out of a world total of 4 million tons.

- 42 -
Table 25: ESTIMATED AVERAGE DISTANCES FROM BAUXITE MINES TO PORTS AND LOCAL REFINERIES
(scale miles)
Production Region From - To Distance Mode of Transportation
United States Arkansas /a 400 miles (alumina) /b Mainly ship
Jamaica Various points Average 12 miles Railroad
Haiti/Dominican Republic Various points Average 15 miles Truck
Guyana 1. Kwakwani to Georgetown 140 miles River barges2. Ituni to Georgetown 60 miles Railroad
Suriname West Suriname - Apura 50 miles RailroadApura - Paranam 200 miles River barge
Brazil Trombetas - Belem 20 miles plus Railroad690 miles Ship
Venezuela Los Pijiguajos - Las Ventanas 25 miles plus RailroadLas Ventanas - Puerto Ordaz 250 miles River barge
Western Europe Deposit (Greece) - Itea 20 miles Truck
Eastern Europe Various points Average 30 miles Railroad
Australia Deposits to Weipa 30 miles RailroadDeposits to Bunbury (port) 90 miles Railroador to Wagerup (refinery) 43 miles /c Conveyor
India Panch Pat Mal Depositsto Vishakapatnam 100 miles Railroad
Indonesia Tayan (Kalimantan) to Pontianak 80 miles River barge
China Shansi to Shanghai 400 miles (alumina) /d Railroad
Malaysia - Other Asia Lower Malay to Port Johore 20 miles River barge
Ghana Kumasi and Kibi to Accra Average 50 miles Railroad
Guinea 1. Aye Koye and Sangaredito Kamsar (port) Average 80 miles Railroad
Aye Koye to Sangaredito Sangaredi (refinery) Average 36 miles /e Railroad
2. Fria to Port Conakry 80 miles Railroad
3. Tougue, Dabola, Kindiato Port Conakry Average 200 miles Railroad
Sierra Leone Port Loko to Freetown Average 40 miles RailroadMokanji to Sherbro
Cameroon Ngoundere to Douala 350 miles Railroad /f
/a Arkansas bauxite is transported by truck to nearby alumina plants.
/b Equivalent to transporting bauxite 174 miles.
/c The distance to Wagerup is only 20 miles. We added 23 miles to obtain the equilvalent cost of shipping alumina fromWagerup to Bunbury.
/d Equivalent to transporting bauxite 174 miles.
/e This distance corresponds to the equivalent cost of transporting alumina from Sangaredi to Kamsar (equal to 80 miles- bauxite/alumina ratio).
/f Only for comparison. At present no railroad exists.
Sources: U.S. Bureau of Mines, Industry and World Bank files.
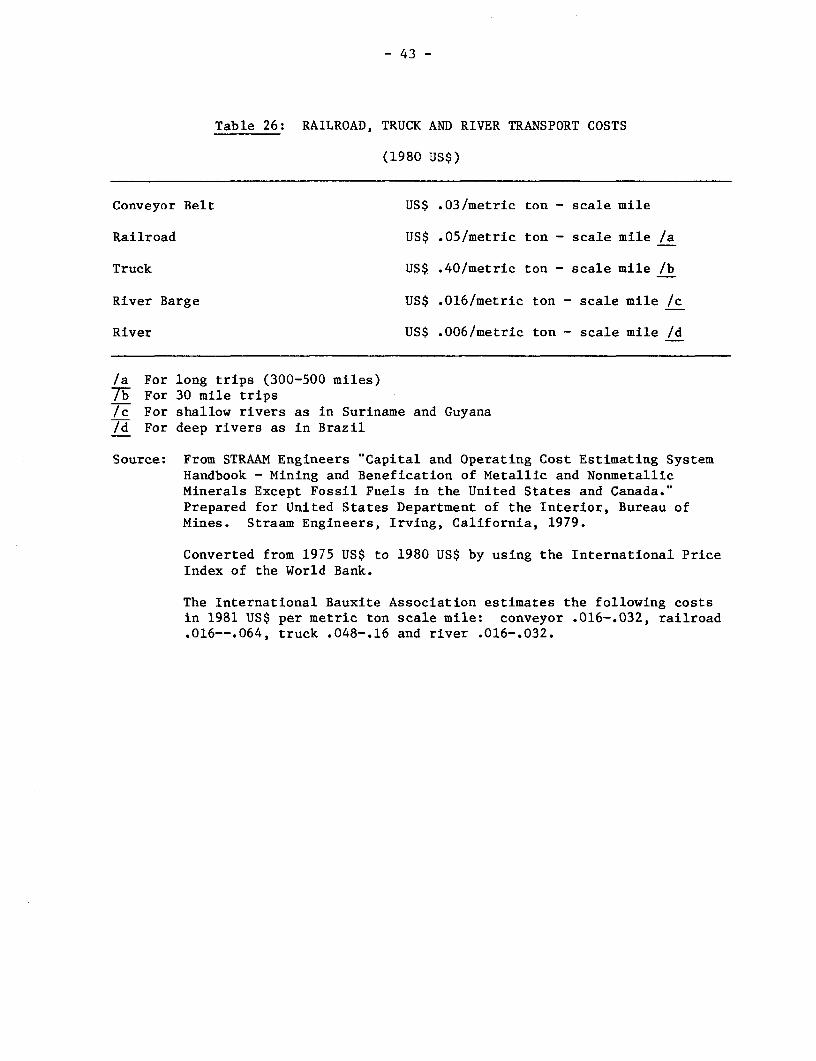
- 43 -
Table 26: RAILROAD, TRUCK AND RIVER TRANSPORT COSTS
(1980 US$)
Conveyor Belt US$ .03/metric ton - scale mile
Railroad US$ .05/metric ton - scale mile /a
Truck US$ .40/metric ton - scale mile /b
River Barge US$ .016/metric ton - scale mile /c
River US$ .006/metric ton - scale mile /d
/a For long trips (300-500 miles)7T For 30 mile trips/c For shallow rivers as in Suriname and Guyana/d For deep rivers as in Brazil
Source: From STRAAM Engineers "Capital and Operating Cost Estimating SystemHandbook - Mining and Benefication of Metallic and NonmetallicMinerals Except Fossil Fuels in the United States and Canada."Prepared for United States Department of the Interior, Bureau ofMines. Straam Engineers, Irving, California, 1979.
Converted from 1975 US$ to 1980 US$ by using the International PriceIndex of the World Bank.
The International Bauxite Association estimates the following costsin 1981 US$ per metric ton scale mile: conveyor .016-.032, railroad.016--.064, truck .048-.16 and river .016-.032.

- 44 -
Thus, these figures suggest not only a lower volume of exports for the moreprocessed products but also a declining participation of developing countriesas the value added to these products' increases. Whether this tendency may bereversed depends, at least in part, on economic considerations as will beanalyzed later in this study.
Ocean transport costs, as mentioned before, are an important elementaffecting bauxite and alumina prices as well as those of aluminum. Apart frommarket factors, the level of freight charges depends on shipment distances,vessel size, and the type of transport arrangements.
The size of the vessel exerts considerable influence on shippingcosts. Operating costs per unit for a 110 thousand tonnes bulk carrier areabout 39 percent of unit costs for a 15 thousand tonnes carrier and about 53percent of those for a 25 thousand tonnes carrier. 1/ Therefore,international trade of bauxite and alumina generally takes place in as largevessels as possible in order to minimize freight rates.
Bauxite carriers are medium sized ships of 20,000-40,000 DWT (DeadWeight Tonnes) employed in cross Caribbean routes and where port capacity is alimitation. OBO (bulk) carriers, which range from 40,000-80,000 DWT, areemployed on longer routes, as from Australia to Europe or to the U.S., subjectto port capacity. Table 27 shows representative freight rates, based onoperating costs, of shipping bauxite in a bauxite carrier of 25,000 DWT ascompared to an OBO carrier of 60,000 DWT. Annex 1 shows distances betweenports which may be used together with Table 27 to estimate freight rates forparticular routes. As shown in Table 17 of the previous sub-section, totransport one ton of bauxite from Australia (Weipa) to Western Europe(Rotterdam) in an OBO carrier would cost US$29 per metric ton, while totransport it in a bauxite carrier would cost US$42 per metric ton, thus makingAustralian bauxite much more expensive. By contrast, to transport Jamaicanbauxite to the East Cost of the United States would cost US$7.50/metric ton ina bauxite carrier and US$6/metric ton in an OBO carrier.
Bulk materials, such as bauxite and alumina can be handled morecheaply than aluminum and its fabricated products. Table 27 shows typicalfreight rates for aluminum, which are 3 to 4 times as high as those forbauxite/alumina. This has to do not only with handling but also with therelatively small volume shipped and because of this, to the type of shippingarrangements.
Since, as mentioned, the dimensions of the vessel affect the cost ofshipping bauxite and alumina, it is important to consider port capabilities asthese determine the maximum vessel size allowed. This is shown in Table 28,which gives the maximum size of ships permitted at main ports employed bymines, refineries and smelters throughout the world.
1/ H.P. Drewry (Shipping Consultants Ltd.), "The Operation of Dry BulkShipping: Present and Prospective Trading Costs in the Context of Currentand Future Market Trends," London, January 1979.

- 45 -
Table 27: OCEAN TRANSPORT COSTS
(1980 US$)
Bauxite and Alumina
Fixed Charge (loading and unloading) US$3.50/metric ton _a
Freight Rates
Type of Vessel Freight Rate
(US$/mt per nautical mile)
Bauxite lb Alumina /a
Bauxite carriers (25,000 DWT) 0.0036 0.0043OBO carriers (60,000 DWT) 0.0024 0.0028
Aluminum
Fixed Charge US$4.00/metric ton /a
Freight Rate US$.Ol/mt per nautical mile
/a Industry sources.lb From IBA estimates and industry sources.
DWT: Dead Weight Tonnes.

- 46 -
Table 28: MAXIMUM VESSEL SIZE AT EACH PORT
(Mines)
Maximum Size ShipRegion/Country Port DWT
USA Mobile 40,000 - 55,000
Jamaica Port Rhoades 35,000 - 60,000
Haiti-Dominican Republic Miragoane 30,000 - 45,000
Guyana Linden 15,000 - 25,000
Suriname Paramaribo 25,000
Brazil Belem 50,000
Venezuela Ciudad Guayana 40,000
W. Europe Itea (Greece) 25,000
E. Europe Leningrad Over 40,000 /a
Australia Weipa (Gove-Weipa) 55,000Bunbury (W. Australia) 55,000
India Vishkapatnam (S.E. India) 25,000
Indonesia Pontianak 40,000
China Shanghai 40,000
Malaysia - 0. Asia Tedok Ramunia 25,000
Ghana Takoradi 40,000
Guinea Conakry (Tougue, Dabola 40,000Kindia, Fria)
Port Kamsar (Aye Koye, 50,000Sangaredi)
-Sierra Leone Sherbro 25,000Freetown
Cameroon - 0. Africa Douala 15,000 - 25,000
Western U.S. Portland 40,000
Eastern U.S. Mobile 55,000
Western Canada Vancouver 40,000
Eastern Canada Port Alfred 50,000
Jamaica Port Rhoades, Port 35,000 - 60,000Kaiser, Ocho Rios

- 47 -
Table 28: MAXIMUM VESSEL SIZE AT EACH PORT (Continued)
REFINERIES AND SMELTERS
Maximum Size ShipRegion/Country Port DWT
Central America/ Veracruz Over 40,000 /aCaribbean
Guyana Linden 15,000 - 25,000
Suriname Paramaribo 25,000
Brazil Belem 50,000
Argentina Puerto Madryn Over 40,000 /a
Venezuela Cuidad Guayana 40,000
Western Europe Rotterdam 40,000 - 80,000
Eastern Europe Leningrad Over 40,000 /a
Asian USSR Vladivostok Over 40,000 /a
Oceania Weipa (North) 55,000Bunbury (West) 55,000
ASEAN Belawan (Sumatra) 40,000
Korea - P. Taiwan, China Kaohsiung Over 40,000 /a
China Shanghai Over 40,000 /a
Japan Tokyo 40,000
India Vishkapatnam 25,000
Other Asia (Turkey) Antalya Over 40,000 /a
Middle East Al Bahrayn (Bahrain) Over 40,000 /a
Northern Africa Alexandria Over 40,000 /a
Ghana - Rest of W. Africa Takoradi 40,000
Guinea Conakry 40,000Kamsar 50,000
Zaire Banana (Muanda) 35,000 - 50,000
East Africa Beira, Narala or Over 40,000 /aMaputo (Mozambique)
Southern Africa Richards Bay 100,000
/a Maximum capacity known to exceed 40,000 DWT.
Sources: H.P. Drewry (Shipping Consultants) Ltd., London, "The Structure ofBauxite/Alumina - Trade and Trends in Ocean Transportation," London,August 1980.
International Bauxite Association.
World Bank.

- 48 -
3.6 Taxation Policies of Bauxite Producing Countries
Many bauxite producing countries rely heavily on their aluminumindustry as a source of government income. This can be illustrated byanalyzing government revenues from the bauxite sector as a percentage of totalgovernment income. This percentage varies across countries from more than 35percent for Suriname and Guinea, to between 10 and 35 percent for Jamaica,Guyana and Haiti, and to less than 10 percent for Australia, Yugoslavia,Dominican Republic, Ghana, Indonesia and Sierra Leone. The taxation systemamong these countries varies widely. Taxes imposed on bauxite producers canbe classified into five categories: production levies, export taxes,corporate income taxes, royalties and equity participation. This diversity oftaxation systems is summarized in Table 29 for major bauxite producingcountries..
Production levies were initiated by Jamaica in 1974 as a means ofincreasing government revenues in foreign currency at a time when its economywas hit hard by the energy crisis. Other Caribbean bauxite producers followedthis move--Suriname, Haiti and the Dominican Republic. Encouraged by thisaction, Guinea chose to impose a levy on bauxite and alumina exports. InJamaica, the immediate effect of the levy was to increase government revenuesfrom this sector from 40 million US dollars in 1973 (8 percent of governmentrevenues) to about 130 million US dollars in 1976 (37 percent of governmentrevenues). A negative effect of the levy and other measures taken at the timewas to discourage bauxite production, which decreased from 13.6 million tonsin 1973 to 10.3 million tons in 1976. In order to reverse this trend, thelevy which had been initially set at 7.5 percent of the aluminum price (perton of aluminum content), was reduced in July 1979 to a levy which for currentproduction ranges from 6.8 percent to below 6 percent, varying with the priceof aluminum, and which for additional production drops below 3 percent.
It is convenient to convert the production levy from a percentage ofthe aluminum price to a dollar value per ton of bauxite; for this thefollowing formula may be used:
Levy (US$/mt) B- itey /Alue i%)/u tio x Aluminum Price (US$/mt)
So, for example, for a levy rate of 5.5 percent, a bauxite/aluminum ratio of4.8, and an aluminum price of US$1,670/metric ton, the levy would be:
54.5/8° x 1,670 = US$19/mt bauxite

- 49 -
Table 29: TAXATION SYSTEMS IN THE BAUXITE SECTOR
Country Income Tax Production or Export Tax (Levy) Royalty Comments
Jamaica 45% 5.8% of aluminum price per ton US$0.60/mt Levy to bealuminui content for current deducted fromproduction income tax
2.9% of aluminum price per tonaluminum content for additionalproduction /a
Haiti 40% 7.5% of aluminum price per ton US$0.55/mt Levy to be deductedaluminum content from income tax
Douinican Republic 40% 7.5% of aluminum price per ton US$0.55/mt Levy to be deductedaluminum content from income tax
Guyana 45% Government-ownedoperations
Surinaie 35-40% 5.1% of aluminum price per ton US$0.56/mt Levy to be deductedaluminum content from income tax
Brazil Tax holiday US$/mtfor 10 years
Australia 46% US$0.17-1.50/mt
India 49% governmentequity
Indonesia 35% 10% of export value FOB US$0.50/mt
Ghana 55% 15% of realized bauxite price /b
Guinea 65% of net Percentage of aluminum price perat of bauxite exported
0.5% of 45% of less aluminacontent
0.55% for 46-50% aluminacontent
0.65% for 51-55% aluminacontent
0.75% for 56% or higheralumina content
If alumina is exported the taxper mt of alumina varies between0.2 - 1% of aluminum price
Sierra Leone 60% US$0.17/mt
Yugoslavia Government equity
/a Depends on the aluminum price. The average levy shown corresponds to a price of 70e/lb. (IBA Review, December 1979 - March1980).
/b Sum of 10% levy on production and 6% on realized market value.
Sources: 4oHent S., "Long-term Associates of Developing Countries with Consumers of Bauxite, Alumina and Aluminum, paper presented atthe United Nations Industrial Development Organization Seminar, Hungary, May 1978.
IBA RevieW, June 1980.

- 50 -
The Caribbean countries (Jamaica, Suriname, Haiti and the DominicanRepublic) allow the companies to subtract income taxes from the levy. Thetheoretical levy--before substracting income tax--is called "gross levy." Theactual paid levy--after deducting income tax--is called "net levy." Thisscheme, as opposed to one where only a gross levy and no income tax were to bepaid, permits foreign firms to credit income tax paid in the host countryagainst income tax to be paid in its home country, thus reducing the real costof the levy.
Guinea, which imposes an export levy on bauxite and alumina, does notcredit income tax against the levy, therefore the total levy represents anadditional cost for the producer. The levy applied by Guinea is alsoestimated as a function of the aluminum price but is paid per ton ofbauxite. To allow for different aluminum contents of the bauxite, this levyvaries according to the bauxite-alumina ratio (see Table 29).
Another tax applied to the bauxite sector takes the form of aroyalty. This is similar to the levy, except that it is viewed as a paymentfor the privilege of exploiting the mineral resources of a country. Royaltiesare usually not a very significant component of bauxite costs, amounting inmost cases to less than US$1 per ton of bauxite.
Corporate income taxes are applied by most countries on thebauxite/aluminum industry, although as mentioned above, Caribbean countriesallow the companies to credit them against the levy. Among the main bauxiteproducing countries, Brazil and Australia rely basically on this fiscalinstrument for generating government revenues. The main attraction forcompanies with respect to this system is that during the first years of aproject, they generate little or no profits and therefore they do not have topay income tax. By the same token, host countries which are highly pressedfor revenues may consider this is a drawback.
Another method of generating government revenues is through equityparticipation. In many cases this participation arises in recognition ofexpenditures made by the government in building needed infrastructure. Adifferent situation occurs in countries as Guyana, wich have expropriated thebauxite sector.
An attempt is made in the remainder of this section to compare thecost of the levy after subtracting income tax credits. In order to accomplishthis, some assumptions need to be made. First, every year must be considereda normal year with average profits. Second, it must be assumed that if acompany is only subject to income tax it would report a normal transactionprice (including normal profits). Third, it is considered that the companyalready possesses some plants in the host country, and therefore, any taxesgenerated in those plants may be credited against the levy on bauxite from newprojects.

- 51 -
Table 30 presents estimates of income taxes to be paid on a newproject using a real rate of return of 10 percent on investment and 50 percentcorporate tax on profits. The gross and net levies computed on the basis ofthese assumptions, are shown in Table 31 for companies operating only bauxitemines, and in Table 32 for companies operating a bauxite alumina integratedcomplex in the host country. Although the effect of crediting income taxagainst the levy is not very significant if only mines are developed, it seemsto be very important if an integrated mine and refinery complex are built.Thus, in Table 32 it is shown that for an integrated operation the net levy isabout one half of the gross levy, and that for a new project in Jamaica, itcould all be credited against income tax. Besides, for a country withpotential hydroelectric power, as in the case of Suriname, the possibilityexists of building additional smelter capacity. In such a case the estimatedincome tax for the integrated operation would be higher than the gross levy,and therefore, the effect of the latter would be nil.
3.7 Import Tariffs on Bauxite, Alumina and Aluminum
In order to protect local industry, most countries restrict aluminumimports by imposing tariffs. Some of these countries extend this protectionagainst bauxite and alumina imports. Tables 33 and 34 show import duties forbauxite/alumina and aluminum, respectively, expressed in ad-valorem terms.One may appreciate that tariffs are generally higher for aluminum ingot inorder to promote processing in the aluminum consuming country. Of the majoraluminum consumers, only Western Europe protects also its alumina refineries.
The possible effects of these protective measures are reflected inthe delivered cost of aluminum as shown in Table 35 for major countries.These figures are for new projects, and they show that with tariffs at thepresent level, it would not be competitive for a company to build an aluminumsmelter in the major industrial countries. This does not rule out theprotection of already existing smelters, which have long-term contracts forcheap electricity supplies, and for which capital investments were lower thanthose currently required to build a new smelter.

- 52 -
Table 30: INCOME TAX CALCULATIONS FOR NEW PROJECTS
(1980 US$)
Discount rate 10%
Life of equipment 20 years
Capital recovery factor 0.117
CapitalInvestment Tax per Tax per
per metric ton metric ton metric tonof gross output (2% of capital) bauxite
Bauxite mines 40 0.80 0.80
Alumina refining 1,050 20.80 9.50
Aluminum smelters 2,900 58.00 13.00
Source: World Bank estimates.
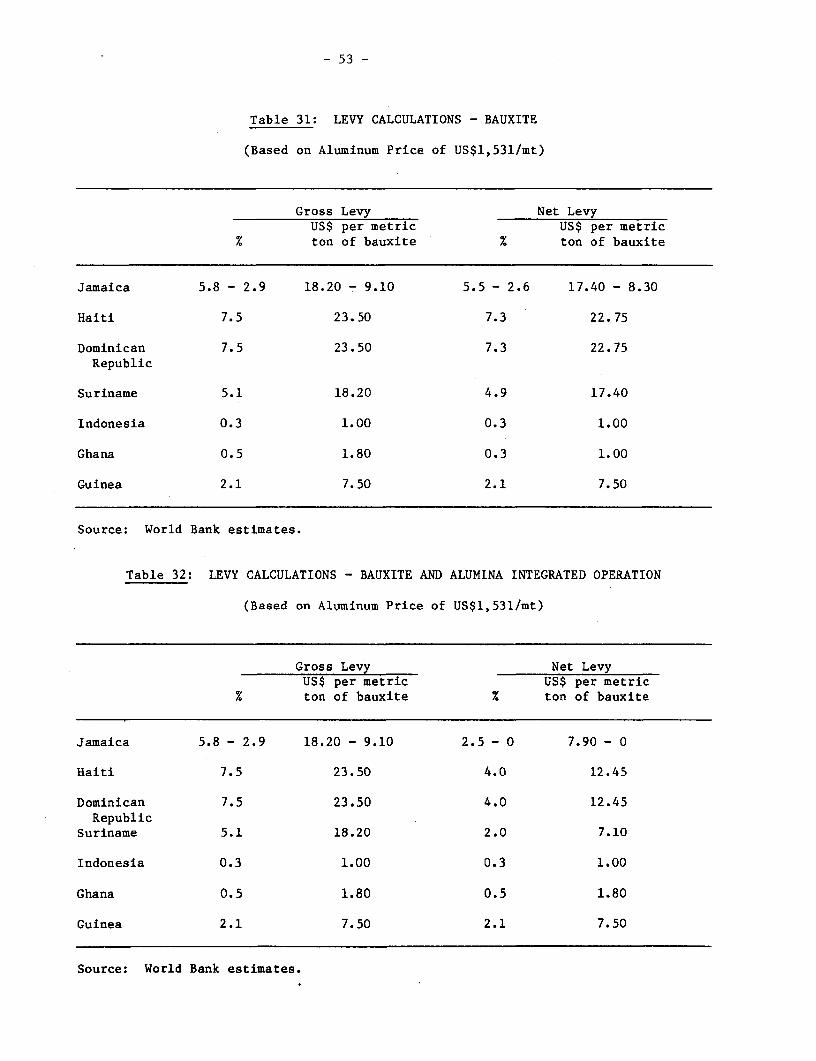
- 53 -
Table 31: LEVY CALCULATIONS - BAUXITE
(Based on Aluminum Price of US$1,531/mt)
Gross Levy Net LevyUS$ per metric US$ per metric
% ton of bauxite % ton of bauxite
Jamaica 5.8 - 2.9 18.20 - 9.10 5.5 - 2.6 17.40 - 8.30
Haiti 7.5 23.50 7.3 22.75
Dominican 7.5 23.50 7.3 22.75Republic
Suriname 5.1 18.20 4.9 17.40
Indonesia 0.3 1.00 0.3 1.00
Ghana 0.5 1.80 0.3 1.00
Guinea 2.1 7.50 2.1 7.50
Source: World Bank estimates.
Table 32: LEVY CALCULATIONS - BAUXITE AND ALUMINA INTEGRATED OPERATION
(Based on Aluminum Price of US$1,531/mt)
Gross Levy Net LevyUS$ per metric US$ per metric
% ton of bauxite x ton of bauxite
Jamaica 5.8 - 2.9 18.20 - 9.10 2.5 - 0 7.90 - 0
Haiti 7.5 23.50 4.0 12.45
Dominican 7.5 23.50 4.0 12.45Republic
Suriname 5.1 18.20 2.0 7.10
Indonesia 0.3 1.00 0.3 1.00
Ghana 0.5 1.80 0.5 1.80
Guinea 2.1 7.50 2.1 7.50
Source: World Bank estimates.

- 54 -
Table 33: TARIFFS ON BAUXITE AND ALUMINA IMPORTS
(Ad-valorem equivalents)
Country/Region Bauxite Alumina
United States 0 0Canada 0 0Jamaica 12 12Central America - Caribbean 1.3 - 322 0.4 - 100Guyana 15 15Suriname 5 5Brazil 0 15Venezuela 5 5Western Europe 0 5.6Eastern Europe 0- 10 0 - 10 /bAustralia 0 0ASEAN 10 /c 10 /cKorea o7 7fOChina 5 5Japan 0 0India 40 40Rest of Asia 40 40Middle East 0 /e 0 /eNorthern Africa 5 7h 5 7Ghana 50 50Guinea 35 35Zaire 5 5Rest of Africa 0 1 O iSouth Africa 0 0
/a Computed from duty values in US$ per ton. Haiti represents the lowervalue, the Dominican Republic the higher value.
/b Czechoslavakia 0%, USSR 0-8%, Hungary 10%.
/c Philippines and Indonesia.
/d Korea.
/e Saudi Arabia, Iraq.
/f Egypt.
/g Cameroon.
Source: International Customs Tariffs Bureau, International Customs Journal,(various issues), Brussels.

- 55 -
Table 34: TARIFFS ON ALUMINUM IMPORTS
Country/Region Percentage
United States 0
Central America/Caribbean 5.9 /a
Western South America 50 /b
Eastern South America 45 /c
Western Europe 5.8
Eastern Europe 5 /d
Australia 0 /e
ASEAN 10 /f
Korea 10
China 20
Japan 9
India 40
Rest of Asia 40
Middle East 0 /g
North Africa 5 /h
West Africa 6 /i
East Africa 0
South Africa 0
/a Mexico7W- Venezuela7T Brazil/d Czechoslovakia 0%; USSR 0-5%; Hungary 50%7e- Subject to import permits/f Indonesia, Philippines
g Saudi Arabia, IraqIh Egypt7T Cameroon
Source: International Customs Tariffs Bureau, International Customs Journal,(various issues), Brussels.

Table 35: EFFECT OF IMPORT DUTIES ON ALUMINUM:COST OF DELIVERED ALUMINUM FROM NEW PLANTS, YEAR 2000
(1980 US$/metric ton)
United States Western Europe JapanImported Imported Importedaluminum aluminum aluminum
(from Local (from Local (From Local(Brazil) production Australia) production Australia) production
Cost f.o.b. 1,860 1,870 1,870
Transport 30 - 130 45
Import duties - - 130 - 205 .- U
TOTAL 1,890 2,260 2,130 2,310 2,120 2,270 1
Source: World Bank estimates.

- 57 -
4. Framework of Analysis
4.1 Problem Formulation
The preceding sections provide the background for the main questionbeing addressed in this study: to what extent will changes in the cost andavailability of inputs for the aluminum industry affect the future investment,production and trading patterns for products in the industry.
The depletion of low cost bauxite mines in industrial countries hasforced the industry to exploit new deposits in less developed areas. 1/Selection of deposits to be mined depends on mining costs, ore quality,transportation and taxation. The development of new mines in remoteunexploited locations requires, in most cases, heavy investments in physicaland social infrastructure which, due to their lumpiness, require the openingof large mines to reduce unit investment costs. In order to compare miningcosts among deposits, the type and quality of the ore needs to be consideredsince their treatment at refineries varies considerably. As both inland andocean transport constitute a significant portion of bauxite costs, and typicalshipment costs may represent from 10 to over 50 percent of the delivered costof bauxite, such costs are another important factor to be taken intoaccount. So is taxation, in particular bauxite production levies which havebeen imposed by a number of countries, 2/ and which may increase substantiallythe cost of bauxite.
Alumina refineries experience significant economies of scale up toabout two million metric tons per year of output. The investment cost perunit volume for a two million metric ton refinery is approximately 15 percentlower than for a one million metric ton plant. As mentioned above, the typeof bauxite to be processed also influences the cost of production alumina.Variations in equipment and operating conditions may account for differencesin production costs of up to 20 percent. Plant location is another mainfactor in determining alumina costs. Less developed regions require higherinvestments costs due to imported components and infrastructurerequirements. Nevertheless, locating a refinery in a less developed bauxiteproducing country may result in savings in transportation costs, since freightrates per ton for bauxite and alumina are similar but the latter has a higheraluminum content. Thus, there are trade-offs that need to be considered andrefineries may be built near mine sites or close to aluminum smelters.
1/ See Langton, Thomas G., "Economic Aspects of the Bauxite/AluminumIndustry, in Proceedings of Bauxite Symposium IV, 1980, the Journal of theGeological Society of Jamaica, Kingston Jamaicia, 1980.
2/ Jamaica, Suriname, Haiti, Dominican Republic and Guinea.

- 58 -
The main cost components at aluminum smelters are capital, aluminaand electric power. Capital costs at a smelter are high, representing from 20to 30 percent of aluminum production costs; economies of scale in investmentare significant only to about 200 thousand metric tons per year of aluminum.Alumina costs represent another 25 percent of total costs differing from plantto plant according to their sources of supply and to transportation costs. Asmentioned in the previous section, the availability of low cost electricity isa main determinant for the location of a smelter. Due to rising power costsin industrial countries, the tendency is to search for those areas where theopportunity cost of energy is relatively low, e.g, abundant hydropowerpotential, flared gas or cheap coal. In order to countervail this trend andto protect local smelters, many countries may be tempted to increase tariffson imported aluminum. Therefore, the viability of new smelters at particularlocations depends not only on low-cost resources, but also on futureinternational trade policies.
While bauxite mines, alumina refineries and aluminum smelters allexhibit economies of scale up to a given plant size, one can not assume thatthe investment cost function for new plants is independent of the total amountof capacity installed. Assuming cost-minimizing behavior in terms of siteselection, the most attractive sites will be selected first, so thatsubsequent plants will tend to be higher-cost. As additional plants arebuilt, greater demands will be placed upon infrastructure requirements, andthe risk premium in investment capital costs may increase. It is for thisreason that our capital cost estimates include a factor that increases capitalcost for a range of relevant plant sizes dependent upon the number of plantsto be built in a given producing region.
There are, therefore, a large number of factors to be considered todetermine the least-cost supply pattern to meet future demand for aluminum.Moreover, many of the factors mentioned cannot be projected into the futurewith great accuracy, and at best, a range of quantitative values can be placedupon them. Extensive sensitivity analysis was therefore carried out, focusingon high and low demand estimates for aluminum, electricity prices andsupplies, capital costs, and trade policies.
It should be emphasized that our results relate to a representationof the industry that covers bauxite, alumina and aluminum smelting, andtherefore does not extend to the production of semi-finished and finishedaluminum. The framework of analysis could be extended to include thesefurther processing steps, which, indeed, may be important for certain uses ofthe analysis.
4.2 A Model of the Aluminum Sector
The model we have used is formulated in terms of a mixed-integerprogramming problem, a variant of linear programming, which permits thecapture of economies of scale. Given a set of assumptions regarding theexogenous variables, the model yields the least-cost pattern of investment,production and trade for meeting aluminum demand in the world during theplanning period. The data and assumptions used were described in the previoussubsection; they are given in computer-readable form in Annex 1.

- 59 -
We realize that cost minimization may not be the sole objective ofaluminum corporations, and the other goals such as market diversification andthe minimization of risk, as well as institutional constraints in hostcountries should be considered as well. As such factors are difficult toquantify, however, we have dealt with them only to the extent that we carriedout sensitivity analysis to determine the cost of other than least-coststrategies.
Schematically, the model can be described as follows:
Minimize total costs (investment, operating and transport costs,with or without levies and tarriffs) such that
o Market demand is satisfied in each region;
o Input and output flows for bauxite, alumina andaluminum are consistent with each other;
o Bauxite may be produced at each region subjectto reserves availability;
o Aluminum smelters have access to limited lowcost electricity in some regions, but highcost power is unlimited;
o Production at each region is limited by existingcapacity, but this capacity may be expanded at acost by new investments.
A mathematical statement of the model is given in Annex 2.
4.3 Uses and Limitations
The primary use of the analytic framework presented in this paper isto determine to what extent the increase in the price of energy during theseventies has shifted the comparative advantage for aluminum smelting fromenergy-importing countries to those that have access to relatively abundantnon-tradeable hydro-power. As the answer to this question is notstraightforward, and depends upon a large number of factors besides relativeenergy cost, such as investment cost, access to high-quality bauxite, andproximity to markets, a model was required that can capture the most importantinterdependencies.
Even for a simplified representation of reality, an enormous amountof data, assumptions and forecasts is needed. These data requirements are notunique to our approach, and would be identical to any other systematic methodof analysis addressed to the same sorts of questions. The model we have usedprovides an efficient framework for the organization of the data, assumptionsand forecasts, as illustrated in Annex 1. Any further improvements in theempirical base for our analysis can easily be incorporated into thisframework. The discipline imposed by our approach includes an explicitdocumentation on any data used or assumptions and forecast made.

- 60 -
A major use of the model lies in the facility offered to carry outsensitivity analysis. Depending upon one's perspective or specific interest,views of future events may vary, and it would be naive to assume that a singlebase case can be formulated that represents a consensus view. Nevertheless,many forecasts of industry patterns describe a single trajectory, often verydifferent, without providing the user an opportunity to determine theimplications of a varying set of assumptions. Our approach allows for thispossibility, although not without costs. In the results section, we describeseveral such scenarios, focused on different assumptions regarding the costand availability of relatively cheap power, different levels of investmentcosts, and different trade policies. Clearly, many more variants could beformulated.
While our approach, therefore, has a number of important uses, thereare clear limitations that need to be spelled out. The need to limit datarequirements for empirical as well as computational reasons, and thestandardized form in which many data categories are available, placeslimitations on the interpretation one can attach to the results. They are atbest indications of broad patterns of investment, production and trade, notrecommendations for specific investment opportunities in specific areas. Thisis most obvious in the case of vaguely defined regions such as "Other Asia."But it may also be valid for individual countries, where local conditions maylead to a cost structure which is somewhat different from the standardized oneused in our analysis, and where one would need to ascertain that theadjustments required would not affect the earlier results. As will be shownin the next section, the sensitivity of the results varies for differentproducts in the industry, alumina being the most volatile.
A second limitation relates to product coverage. Our "final" good isprimary aluminum, and the efficiency of different investment patterns isdetermined on the basis of forecast demand for this product. Conceivably, theintroduction of semi-processed products could have an impact on the optimallocation of smelters, although this is doubted by industry specialists, giventhe relatively limited importance of transport costs in total delivered costsof aluminum ingots.
A third limitation of our approach is methodological. While ourmodel can capture the impact of economies of scale on the sizing, location,and timing of capacity expansion in the industry, it can not handle price-elastic demand. While most demand studies for aluminum conclude that in thelong run the growth of demand is closely correlated with the growth of GNP orindustrial production, it should be borne in mind that in a number of usesaluminum has close substitutes.
Finally, it should be stressed that although sensitivity analysis candeal with small-event uncertainty, large-event uncertainty is relevant for theindustry. A technological breakthrough may drastically reduce energyrequirements for aluminum smelting. Or nuclear power may expand much fasterthan implied in our forecasts. Such events would have a very major impact onthe results, and lead to the continued dominance of OECD countries in aluminumsmelting.

- 61 -
5. Results
In the first two sub-sections, we shall describe the major resultsachieved with the model when tariffs and levies are ignored. Given theemphasis on actual resource costs, we call these results normative: assumingour data, assumptions and projections to be correct, they describe the least-cost supply pattern that would meet world demand for aluminum by the year2000. In the last sub-section, the results will be described when tariffs andlevies are taken into account.
For purposes of investment analysis, it appears sensible to take as astarting point a relatively pessimistic view of the future growth of demandfor aluminum, in correspondence with projections of low rates of growth ofgross domestic product in the main consuming regions between now and 2000. Wewill refer to this assumption as the base case. Variants of the base run are:
A. High demand;
B. Higher investment costs in LDCs;
C. Electricity prices in Canada raised to US levels;
D. As in C but hydropower costs in LDCs increased as well;
E. No trade among the three blocks (OECD, LDCs, EasternEurope/USSR);
F. Limited trade among the three blocks.
The main results obtained for the base case and the variants aredescribed below.
5.1 The Base Case: Low Demand
The set of demand projections used for this version of the model wasgiven in Table 4 of Section 3. As is shown there, the total demand forprimary aluminum in the world will amount to 31.6 million tons by 2000. 1/OECD countries account for 46 percent of this total, USSR/Eastern Europe for13 percent, and all other countries (LDCs) for 41 percent.
To meet this demand, expansion of capacity is required, from 17 to 33million tons, assuming on average 95 percent capacity utilization. Details onthe pattern of investment and capacity that we obtained in the analysis arepresented in Table 36 below.
1/ Scrap recoveries are projected to amount to 12 million tons by 2000.

- 62 -
Table 36: EXISTING AND NEW CAPACITY, 2000, BAUXITE MINING,ALUMINA REFINING, AND ALUMINUM SMELTING
(Million tons per year)
Initial Committed Additional TotalCapacity New Capacity New Capacity Capacity
BauxiteOECD 40.5 4.4 - 44.9LDCs 48.3 1.5 87.1 137.0USSR/EE 10.1 - 8.0 18.1Total 98.9 5.9 95.2 200.0
AluminaOECD 26.3 3.4 4.0 33.7LDCs 7.6 3.0 23.4 34.0USSR/EE 5.4 - - 5.4Total 39.3 6.4 27.4 73.1
AluminumOECD 11.7 1.9 2.8 16.4LDCs 2.6 1.4 8.6 12.6USSR/EE 3.2 - 1.2 4.4Total 17.5 3.3 12.6 33.4
The most striking feature revealed by the table is the sharp increasein the share of productive capacity for all three stages in the productionprocess that could occur in the LDCs as a group. For bauxite mining, theshare would increase from a little less than 50 percent in 1980 to almost 70percent of total capacity in 2000. More than 90 percent of all new bauxitemine capacity would be installed in LDCs. In the case of alumina, 85 percentof new capacity would be installed in LDCs, and, as a result, its share intotal capacity would increase from 20 percent in 1980 to just below 50 percentin 2000. Similarly, for aluminum, total capacity in LDCs would grow from 15percent in 1980 to 40 percent in 2000. Almost three-quarters of all newcapacity for aluminum smelting would in fact be installed in LDCs. On costgrounds, therefore, it would appear that LDCs have gained a distinct costadvantage over the more developed countries, and while they would certainlynot dominate the market by the year 2000, particularly for aluminum andalumina, they could increase their share of total world output verysubstantially. For LDCs as a group, the ample availability of good-qualitybauxite, in relatively accessible deposits, combined with access tocomparatively cheap hydro-power, appear to provide sufficient compensation forhigher investment costs and transport costs to markets, to set in motion amajor shift in supply patterns.

- 63 -
In the next table (Table 37), we provide results that relate tocapacity utilization. By assumption, effective capacity is assumed to equal95 percent of nominal capacity to account for plant maintenance. Comparingeffective capacity to production, for the year 2000, we obtain estimates forcapacity utilization levels. It is interesting to note that for both aluminaand aluminum, capacity utilization levels come out very high for allregions. Comparative costs in OECD countries may have moved in a directionwhich makes new investments inefficient; however, they have not increased somuch that existing capacity is not utilized. In interpreting this result, itshould be stressed that capacity installed at the beginning of the planningperiod is treated as sunk cost, so that for such productive capacity onlymarginal costs are taken into account. Nevertheless, bauxite mining occursbelow full capacity, 72 percent for OECD as a group.
Table 37: NOMINAL CAPACITY AND PRODUCTION, LOW DEMAND, 2000,BAUXITE, ALUMINA, ALUMINUM /1
(Million tons per year)
Nominal Effective CapacityCapacity Capacity Production Utilization
BauxiteOECD 44.9 40.4 29.2 .72LDCs 137.0 123.3 120.0 .97USSR/EE 18.1 16.3 16.3 1.00Total 200.0 180.0 165.5 .92
AluminaOECD 33.7 31.0 30.2 .98LDCs 34.0 31.3 30.5 .97USSR/EE 5.4 5.0 5.0 1.00Total 73.1 67.2 65.7 .98
AluminumOECD 16.4 15.6 15.6 1.00LDCs 12.6 11.9 11.9 1.00USSR/EE 4.4 4.1 4.1 1.00Total 33.3 31.6 31.6 1.00
/1 Totals may not add up due to rounding.
In Table 38, the destination of production is presented, includingsales of product for non-metal uses. LDCs are completely self-sufficient forbauxite, while OECD is the major importer; by 2000 it would import over 40percent of its requirements, mainly from LDCs. USSR/Eastern Europe wouldimport about one-fourth of its bauxite requirements by the year 2000, entirelyfrom LDCs. A little more than 80 percent of all alumina internationallytraded by 2000 would originate in LDCs, most of it destined for OECDcountries. Most interestingly, LDCs as a group could achieve a considerable
% a

- 64 -
degree of self-sufficiency for aluminum, supplying 5 out of 7 million tons ofmarket requirements. In fact, LDCs produce much more than their needs, 12million tons, of which 5 million are exported to OECD countries, and over 1million tons to USSR/Eastern Europe. OECD would import about one-fourth ofits total requirements, almost entirely from LDCs.
Table 38: PRODUCTION AND DESTINATION OF BAUXITE, ALUMINA ANDALUMINUM, 2000 (LOW DEMAND); EXCLUDING NON-METAL USES
(Million ton/yr)
Destination Non-MetalProduction OECD LDCs USSR/EE Uses
BauxiteOECD 29.2 27.8 - - 1.3LDCs 120.0 41.1 69.9 2.6 6.5USSR/EE 16.3 6.8 - 9.5 -Total 165.5 75.8 69.9 12.0 7.9
AluminaOECD 30.2 23.2 2.4 - 4.6LDCs 30.5 6.8 20.6 3.1 -USSR/EE 5.0 - - 5.0 -Total 65.7 30.0 23.0 8.0 4.6
AluminumOECD 15.6 13.8 0.7 1.0LDCs 11.9 5.1 5.6 1.3USSR/EE 4.1 0.5 1.0 2.6Total 31.6 19.5 7.3 4.9
Note: Totals may not add up due to rounding.
What additional insights are gained from the results at the nextlevel of aggregation, a 7 - region breakdown of the world: North America,Western Europe, Japan and Oceania, South America and the Caribbean, Africa,Asia, and USSR/Eastern Europe? The first three regions form OECD, the nextthree are grouped into what was referred to as LDCs, and the last one remainsunchanged.
For bauxite, OECD's production capacity is expanded only in theregion "Japan/Oceania", which in this case means in Australia. 1/ Moreover,capacity utilization in North America is only 41 percent by 2000, entirely fornon-metal uses. It is clearly more efficient to import most of North
1/ And this capacity expansion was firmly committed at the time of analysis.
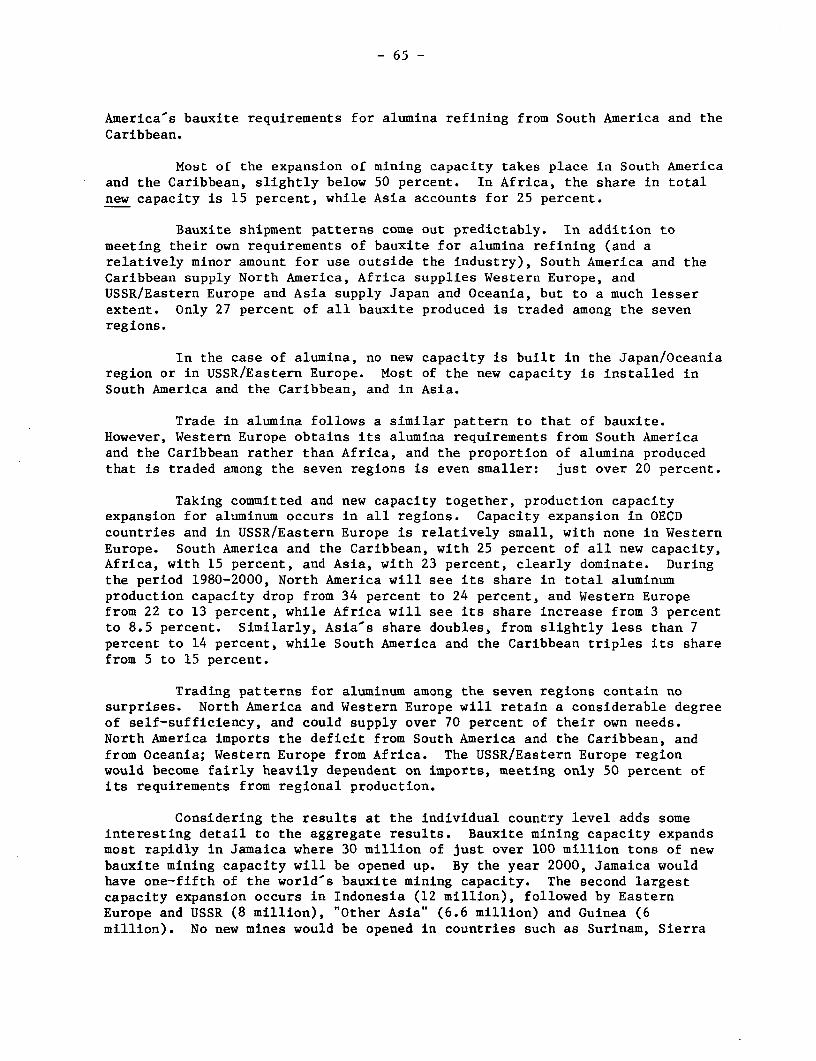
- 65 -
America's bauxite requirements for alumina refining from South America and theCaribbean.
Most of the expansion of mining capacity takes place in South Americaand the Caribbean, slightly below 50 percent. In Africa, the share in totalnew capacity is 15 percent, while Asia accounts for 25 percent.
Bauxite shipment patterns come out predictably. In addition tomeeting their own requirements of bauxite for alumina refining (and arelatively minor amount for use outside the industry), South America and theCaribbean supply North America, Africa supplies Western Europe, andUSSR/Eastern Europe and Asia supply Japan and Oceania, but to a much lesserextent. Only 27 percent of all bauxite produced is traded among the sevenregions.
In the case of alumina, no new capacity is built in the Japan/Oceaniaregion or in USSR/Eastern Europe. Most of the new capacity is installed inSouth America and the Caribbean, and in Asia.
Trade in alumina follows a similar pattern to that of bauxite.However, Western Europe obtains its alumina requirements from South Americaand the Caribbean rather than Africa, and the proportion of alumina producedthat is traded among the seven regions is even smaller: just over 20 percent.
Taking committed and new capacity together, production capacityexpansion for aluminum occurs in all regions. Capacity expansion in OECDcountries and in USSR/Eastern Europe is relatively small, with none in WesternEurope. South America and the Caribbean, with 25 percent of all new capacity,Africa, with 15 percent, and Asia, with 23 percent, clearly dominate. Duringthe period 1980-2000, North America will see its share in total aluminumproduction capacity drop from 34 percent to 24 percent, and Western Europefrom 22 to 13 percent, while Africa will see its share increase from 3 percentto 8.5 percent. Similarly, Asia's share doubles, from slightly less than 7percent to 14 percent, while South America and the Caribbean triples its sharefrom 5 to 15 percent.
Trading patterns for aluminum among the seven regions contain nosurprises. North America and Western Europe will retain a considerable degreeof self-sufficiency, and could supply over 70 percent of their own needs.North America imports the deficit from South America and the Caribbean, andfrom Oceania; Western Europe from Africa. The USSR/Eastern Europe regionwould become fairly heavily dependent on imports, meeting only 50 percent ofits requirements from regional production.
Considering the results at the individual country level adds someinteresting detail to the aggregate results. Bauxite mining capacity expandsmost rapidly in Jamaica where 30 million of just over 100 million tons of newbauxite mining capacity will be opened up. By the year 2000, Jamaica wouldhave one-fifth of the world's bauxite mining capacity. The second largestcapacity expansion occurs in Indonesia (12 million), followed by EasternEurope and USSR (8 million), "Other Asia" (6.6 million) and Guinea (6million). No new mines would be opened in countries such as Surinam, Sierra
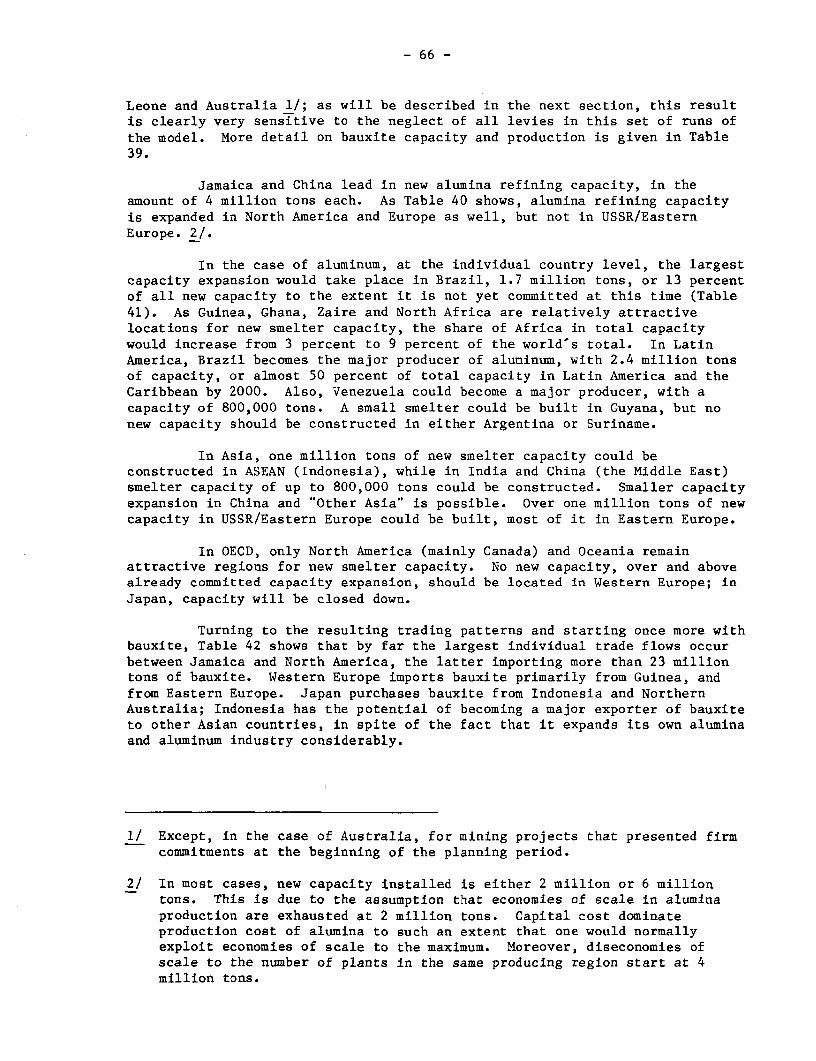
- 66 -
Leone and Australia 1/; as will be described in the next section, this resultis clearly very sensitive to the neglect of all levies in this set of runs ofthe model. More detail on bauxite capacity and production is given in Table39.
Jamaica and China lead in new alumina refining capacity, in theamount of 4 million tons each. As Table 40 shows, alumina refining capacityis expanded in North America and Europe as well, but not in USSR/EasternEurope. 2/.
In the case of aluminum, at the individual country level, the largestcapacity expansion would take place in Brazil, 1.7 million tons, or 13 percentof all new capacity to the extent it is not yet committed at this time (Table41). As Guinea, Ghana, Zaire and North Africa are relatively attractivelocations for new smelter capacity, the share of Africa in total capacitywould increase from 3 percent to 9 percent of the world's total. In LatinAmerica, Brazil becomes the major producer of aluminum, with 2.4 million tonsof capacity, or almost 50 percent of total capacity in Latin America and theCaribbean by 2000. Also, Venezuela could become a major producer, with acapacity of 800,000 tons. A small smelter could be built in Guyana, but nonew capacity should be constructed in either Argentina or Suriname.
In Asia, one million tons of new smelter capacity could beconstructed in ASEAN (Indonesia), while in India and China (the Middle East)smelter capacity of up to 800,000 tons could be constructed. Smaller capacityexpansion in China and "Other Asia" is possible. Over one million tons of newcapacity in USSR/Eastern Europe could be built, most of it in Eastern Europe.
In OECD, only North America (mainly Canada) and Oceania remainattractive regions for new smelter capacity. No new capacity, over and abovealready committed capacity expansion, should be located in Western Europe; inJapan, capacity will be closed down.
Turning to the resulting trading patterns and starting once more withbauxite, Table 42 shows that by far the largest individual trade flows occurbetween Jamaica and North America, the latter importing more than 23 milliontons of bauxite. Western Europe imports bauxite primarily from Guinea, andfrom Eastern Europe. Japan purchases bauxite from Indonesia and NorthernAustralia; Indonesia has the potential of becoming a major exporter of bauxiteto other Asian countries, in spite of the fact that it expands its own aluminaand aluminum industry considerably.
I
1/ Except, in the case of Australia, for mining projects that presented firmcommitments at the beginning of the planning period.
2/ In most cases, new capacity installed is either 2 million or 6 milliontons. This is due to the assumption that economies of scale in aluminaproduction are exhausted at 2 million tons. Capital cost dominateproduction cost of alumina to such an extent that one would normallyexploit economies of scale to the maximum. Moreover, diseconomies ofscale to the number of plants in the same producing region start at 4million tons.

- 67 -
Table 39: BAUXITE MINING: BASE CASE PRODUCTION AND CAPACITY
EXPANSION, 2000
(million metric tons)
TotalMine Production Mine Capacity Expansion /a Capacity
1980 2000 1980-2000 in 2000
U.S. 1.5 0.7 - 1.9W. Europe 8.3 - - 8.8USSR/E. Europe 10.1 16.3 8.0 18.1Jamaica /b 12.1 /d 34.4 29.8 38.2
/c 8.5 5.1 9.4Guyana 3.1 8.6 5.8 9.5Haiti/DominicanRepublic 1.0 1.1 - 1.2
Surinam 4.9 4.7 _ 5.3Brazil 4.2 7.8 3.5 8.7Venezuela - 6.1 6.7 6.7Ghana 0.2 4.8 5.0 5.3Guinea Aye-Koye 13.3 /e 11.8 3.5 13.1
Fria 6.7 6.0 7.4Tougue - - 2.5
Sierra Leone 0.8 0.7 0.8N. Australia 27.2 /f 12.3 - 16.3W. Australia 16.1 4.4 18.0India 1.7 5.9 4.4 6.6Indonesia 1.2 12.1 12.2 13.4China 1.7 0.5 - 1.7Other Asia 0.5 6.5 6.6 7.2TOTAL 91.8 165.5 101.1 200.0
/a Capacity expansion in this column includes current firmly committedinvestments of 1.5 mn tons in Brazil and 4.4 mn tons in WesternAustralia.
/b Trihydrate.
Ic Tri-monohydrate.
/d Includes trihydrate and monohydrate.
/e Includes Fria and Tougue.
/f Includes Western Australia.

Table 40: ALU};NA BASE CASE PRODUCTION, CAPACITY EXPANSION AND CONSUMPTION IN 2000
(million metric tons)
CapacIItyProduction Comitted Purther Increase Consumption
1980 2000 1980 Expansions to 2000 Total 2000
World 34.9 65.7 39.2 6.4 27.4 73.1 65.7
OECD 23.4 30.2 26.2 3.4 4.0 33.7 33.4N. America 8.2 9.7 9.2 0.1 2.0 11.3 14.7W. Europe 5.8 9.7 7.1 1.5 2.0 10.6 9.9Japan 2.2 2.4 2.6 - - 2.6 3.2
Oceania 7.2 8.4 7.3 1.8 - 9.1 5.6
Latin America & Caribbean 4.6 17.8 5.0 2.4 12.0 19.4 7.8Jamaica 2.4 6.3 2.8 - 4.0 6.8 -Guyana 0.3 0.3 0.4 - 0.4 0.3Surinam 1.4 3.1 1.3 - 2.0 3.3 0.2Venezuela - 2.8 - 1.0 2.0 3.0 0.9Brazil 0.5 3.5 0.5 1.4 2.0 3.9 4.5Argentina - - - - 0.3Central America - 1.8 2.0 2.0 1.6 1
OD
Africa 0.7 2.4 0.7 2.0 2.7 9.4Ghana - 1.8 - 2.0 2.0 6.0
Guinea 0.7 0.6 0.7 - 0.7 0.9N. Africa - - - 1.8Zaire - - - 0.4S. Africa - - - - 0.3
Asia (Excl. Japan, USSR) 1.5 10.2 2.0 0.7 9.4 12.1 7.1ASEAN - 3.5 - 0.5 3.4 3.9 2.4
Korea 0.1 0.1 0.2 - - 0.2 0.2China 0.8 3.7 0.9 4.0 4.9 1.1
India 0.5 2.5 0.7 2.0 2.7 2.5Middle East - - - - 0.7
Rest Asia 0.1 0.4 0.2 0.2 - 0.4 0.2
USSR & E. Europe 4.7 5.0 5.4 5.4 8.0E. Europe 4.7 5.0 5.4 _ 5.0Asian USSR - - - - 3.0
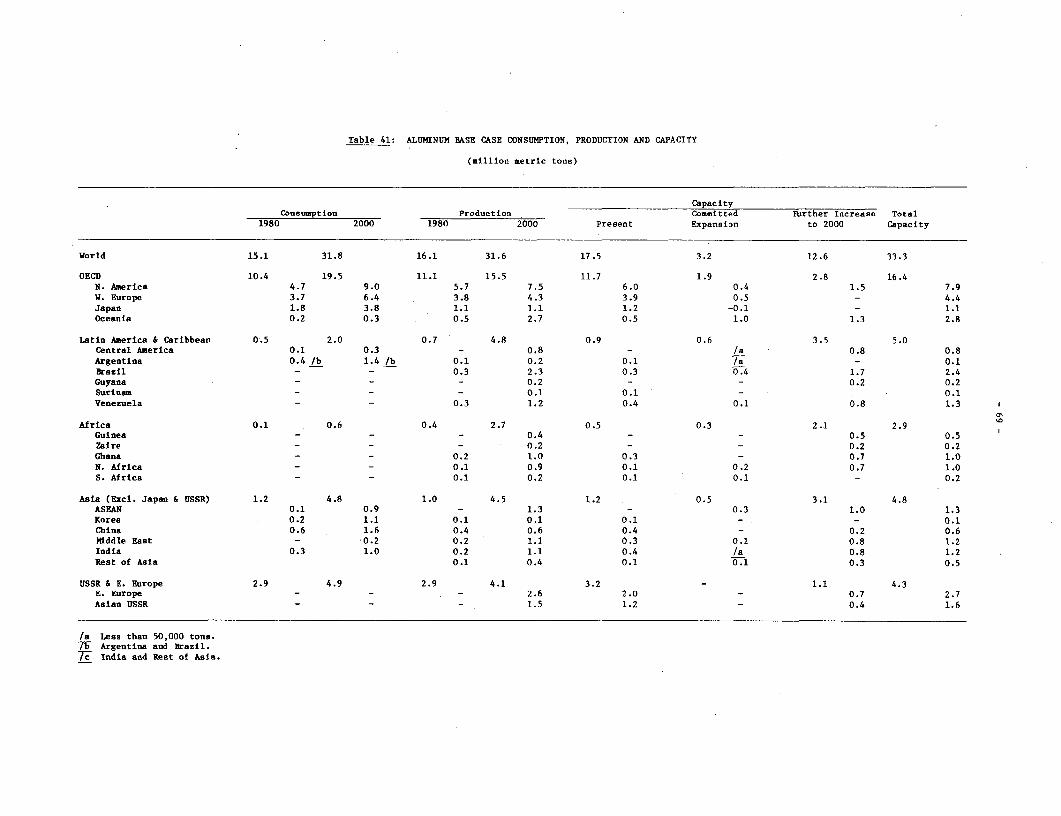
Table 41: ALUMINUM BASE CASE CONSUMPTION, PRODUCTION AND CAPACITY
(million metric tons)
CapacityConsumption Production Committed Fjrther Increase Total
1980 2000 1980 2000 Present Expansion to 2000 Capacity
World 15.1 31.8 16.1 31.6 17.5 3.2 12.6 33.3
OECD 10.4 19.5 11.1 15.5 11.7 1.9 2.8 16.4N. America 4.7 9.0 5.7 7.5 6.0 0.4 1.5 7.9W. Europe 3.7 6.4 3.8 4.3 3.9 0.5 - 4.4Japan 1.8 3.8 1.1 1.1 1.2 -0.1 - 1.1Oceania 0.2 0.3 0.5 2.7 0.5 1.0 1.3 2.8
Latin America & Caribbean 0.5 2.0 0.7 4.8 0.9 0.6 3.5 5.0Central America 0.1 0.3 - 0.8 - /a 0.8 0.8Argentina 0.4 /b 1.4 /b 0.1 0.2 0.1 7a - 0.1Brazil - - 0.3 2.3 0.3 0.4 1.7 2.4Guyana - - - 0.2 - - 0.2 0.2Surinam - - - 0.1 0.1 - 0.1Venezuela - - 0.3 1.2 0.4 0.1 0.8 1.3
a,
Africa 0.1 0.6 0.4 2.7 0.5 0.3 2.1 2.9Guinea - - - 0.4 - 0.5 0.5Zaire - - - 0.2 - 0.2 0.2Ghana - - 0.2 1.0 0.3 - 0.7 1.0N. Africa - - 0.1 0.9 0.1 0.2 0.7 1.0S. Africa - - 0.1 0.2 0.1 0.1 - 0.2
Asia (Excl. Japan & USSR) 1.2 4.8 1.0 4.5 1.2 0.5 3.1 4.8ASEAN 0.1 0.9 - 1.3 - 0.3 1.0 1.3Korea 0.2 1.1 0.1 0.1 0.1 - - 0.1China 0.6 1.6 0.4 0.6 0.4 - 0.2 0.6Middle East - -0.2 0.2 1.1 0.3 0.1 0.8 1.2India 0.3 1.0 0.2 1.1 0.4 /a 0.8 1.2Rest of Asia 0.1 0.4 0.1 0.1 0.3 0.5
USSR & E. Europe 2.9 4.9 2.9 4.1 3.2 - 1.1 4.3B. Europe - - - 2.6 2.0 - 0.7 2.7
Asian USSR - - - 1.5 1.2 0.4 1.6
/a Less than 50,000 tons.7F Argentina and Brazil.77 India and Rest of Asia.

Table 42: BAUXITE: BASE CASE TRADE FLOWS IN 2000
(milllon metric tons)
Korea& Other Rest of
From/To N. America W. Europe Japan USSR & EE ASEAN Surinam China Asia Asia Total
E. Europe 6.8 6.8
Haiti/DominicanRepublic 1.1 1.1
Jamaica 23.1 23.1
Guyana 3.3 3.3
Sierra Leone 0.7 0.7
Guinea 15.3 1.8 17.1
Ghana 0.7 0.7
Australia 3.7 3.7
Indonesia 1.6 1.8 8.1 0.3 0.1 11.9
Other Asia 6.5 6.5
TOTAL 24.2 22.1 5.3 2.5 8.3 3.3 8.1 0.3 0.8 74.9

Table 43: ALUMINA BASE CASE: TRADE FLOWS IN 2000
(million metric tons)
North West Middle East/ South Asian
Importers/Exporters America Europe Japan Brazil Argentina North Africa Guinea Zaire Africa USSR World
Jamaica 6.3 0.2 - - 6.5
Venezuela - - - 0.2 - - - 0.2
Suriname - - - 2.9 - - - - - - 2.9
Brazil - - - - 0.3 1.7 0.1 - - - 2.1
China - - - - - - 2.5 2.5
Australia - - 0.8 - - 1.7 - 0.4 0.3 - 3.2
ASEAN - - - - - 0.3 - - - 0.5 0.8
India - - - - - 0.3 - - - - 0.3
TOTAL 6.3 0.2 0.8 2.9 0.3 4.0 0.3 0.4 0.3 3.0 18.5

Table 44: ALMINUM: TRADE FLOWS IN THE BASE CASE, 2000
(million metric tons)
North Western South East Asia Rest Eastern South
From/To America Europe Japan America China Incl. Korea of Asia Europe/USSR Africa Total
North America 0.1 1.0 1.1
Oceania 0.6 1.1 0.6 2.3
Caribbean 0.7 0.7
Suriname 0.1 0.1
Brazil 1.4 0.9 2.3
Venezuela 1.2 1.2
Ghana 0.9 0.9
Guinea 0.4 0.4
India 1.0 0.1 1.1
Asian-USSR 0.5 1.0 1.5
Argentina 0.2 0.2
ASEAN 0.4 O.4
Korea 0.1 0.1
Mid East 0.9 0.9
Rest of Asia 0.4 0.4
N. Africa 0.8 0.1 0.9
Zaire 0.2 0.2
TOTAL 2.5 2.1 2.6 1.7 1.0 1.1 1.0 2.4 0.2 14.6

- 73 -
In addition to bauxite, North America imports more than 6 milliontons of alumina from Jamaica. Western Europe imports alumina from Jamaica aswell, making Jamaica the source of one-third of all alumina internationallytraded. The remainder originates mainly in Australia, Brazil, Venezuela,China and ASEAN, as Table 43 shows.
Relatively more diversified trading patterns for aluminum wereobtained in the base case, even though they were geographically concen-trated. North America, while supplying most of its regional needs fromsmelters within the region, imports from Venezuela, the Caribbean, Guyana andSurinam, as well as Oceania (see Table 44). Western Europe imports itsdeficit from Ghana and Guinea, while Japan obtains supplies from Oceania,India and Asian USSR. Brazil supplies most of Latin America.
Eastern Europe and the USSR import from Ghana, and North Africa.Most other trade flows are within continental groupings.
The total cost of supplying the world's requirements of primaryaluminum in 2000, i.e., 31.6 million tons, without tariffs and levies, wouldamount to $49.6 billion if the supply pattern of the base case were tomaterialize. The breakdown of these costs is given in Table 45.
On average, the costs amount to $1,570 per ton of primary aluminum.Electricity costs contribute on average $300, or 20%, with considerablevariations between OECD on the one hand, and LDCs and Eastern Europe/USSR onthe other. While the average cost for electricity in OECD is $338 per ton ofaluminum, the cost in LDCs, amounts to only $265 and in Eastern Europe/USSR$252.
It should be borne in mind that these cost estimates do not includecapital charges for capacity that was already installed in 1980. Moreover,neither profits nor levies or tariffs are taken into account.
Table 45: COST ELEMENTS FOR THE BASE CASE - LOW DEMAND,NO LEVIES OR TARIFFS
Investment charges, mines $ 429.8 million
Investment charges, refineries and smelters 8,111.4 million
Operating costs, mines 1,727.8 million
Operating costs, refineries and smelters 37,463.8 million
Transport costs 1,859.9 million
TOTAL 49,592.6 million

- 74 -
We shall now turn to a comparative discussion of the sensitivity ofthese results to changes in the major parameters, still neglecting theexistence of tariffs and levies.
5.2 Sensitivity Analysis
The results of the base case will be compared to a total of 10variants, described in the table below. The first one investigates the impactof a faster rate of growth of demand for primary aluminum. The second onefocuses on the effects of higher investment costs in LDCs. The next fivevariants of the base case all relate to assumptions on the cost andavailability of electric power at actual or potential production sites.Variant 8 studies the combined effect of higher investment and energy costs inLDCs. Finally, variants 9 and 10 focus on trade, and investigate the impactof different degrees of self-sufficiency for the main country groupings.
The results obtained in the sensitivity analysis will be described atthe aggregate level, focusing on production levels for bauxite, alumina, andaluminum, and on cost components. At the disaggregate level, attention willbe paid to the effects of different assumptions on new capacity construction.
Production Levels
Table 47 summarizes the results of the ten variants of the base casefor the three country groupings with regard to production levels.
If demand for primary aluminum grows faster than assumed in the basecase, and reaches almost 39 million tons by the year 2000 rather than 31.6million, almost all additional production of bauxite, alumina and aluminumoccurs in LDCs. As a result, LDCs will produce three quarters of all bauxite,and about one-half of all alumina and aluminum in the world by the end of thecentury.
Variant 2 focuses on investment cost in LDCs. Although the base caseassumptions recognize that investment costs in LDCs can normally be expectedto be higher than in industrialized countries, and so-called infrastructurefactors add from 10 to 25 percent to investment costs, we may still haveunderestimated capital cost requirements in LDCs as a group. In this variant,therefore, we have added another 25 percent to investment costs in LDCs. 1/
As Table 47 shows, the production of bauxite and alumina in OECDwould be much higher than in the base case, entirely at the expense of LDCs asa group. Eastern Europe and USSR are not affected. Moreover, in the case ofbauxite, total production requirements are larger because of the lower qualitybauxite produced in OECD. However, for aluminum, the change in productionlevels is much less dramatic, implying that the availability of relatively
1/ This variant may be given another interpretation: the 25 percent mark-uprepresents a proxy for risk, in the sense that investment in LDCs carriesrisks that result in higher real investment charges.
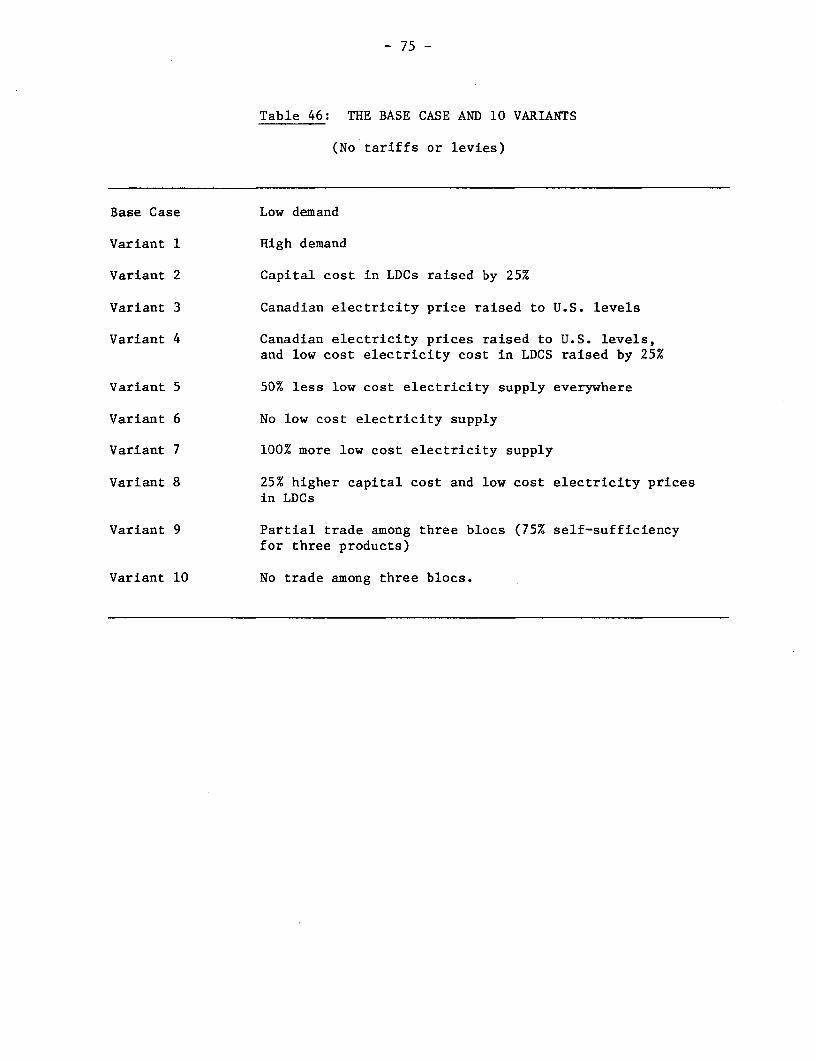
- 75 -
Table 46: THE BASE CASE AND 10 VARIANTS
(No tariffs or levies)
Base Case Low demand
Variant 1 High demand
Variant 2 Capital cost in LDCs raised by 25%
Variant 3 Canadian electricity price raised to U.S. levels
Variant 4 Canadian electricity prices raised to U.S. levels,and low cost electricity cost in LDCS raised by 25%
Variant 5 50% less low cost electricity supply everywhere
Variant 6 No low cost electricity supply
Variant 7 100% more low cost electricity supply
Variant 8 25% higher capital cost and low cost electricity pricesin LDCs
Variant 9 Partial trade among three blocs (75% self-sufficiencyfor three products)
Variant 10 No trade among three blocs.

Table 47: PRODUCTION LEVELS: THE BASE CASE AND 10 VARIANTS, 2000
(Million metric tons)
Energy TradeBase Case Variant 1 Variant 2 Variant 3 Variant 4 Variant 5 Variant 6 Variant 7 Variant 8 Variant 9 Variant 10
High Costs in Canadian Low Cost 50% Less No Low 100% more Capital Cost Partial No Trade
Demand LDCs + 25% Electricity Electricity Low Cost Cost Low Cost + Low Cost Trade (75%) Among
Prices at in LDCs +25% Electricity Electricity Electricity Electricity Among Blocs Blocs
US Level
BauxiteOECD 29.2 31.5 43.6 29.2 29.2 29.2 29.2 29.2 43.6 59.2 113.0LDCs 120.0 148.7 109.0 120.0 120.0 119.8 119.1 119.4 109.0 94.3 39.3
EE/USSR 16.3 16.3 16.3 16.3 16.3 16.3 16.3 16.3 16.3 14.1 23.6
TOTAL 165.5 196.5 168.9 165.5 165.5 165.3 164.6 164.9 168.9 167.6 175.9
Alumina
OECD 30.2 31.5 49.9 30.2 30.2 30.2 31.2 30.2 49.9 30.2 42.2LDCs 30.5 43.3 10.8 30.5 30.5 30.5 29.5 30.5 10.8 27.7 14.1EE/USSR 5.0 5.0 5.0 5.0 5.0 5.0 5.0 5.0 5.0 7.8 9.4
TOTAL 65.7 79.7 65.7 65.7 65.7 65.7 65.7 65.7 65.7 65.7 65.7
Aluminum
OECD 15.6 15.8 15.8 15.6 15.8 14.1 15.9 14.0 15.9 15.8 19.5LDCs 11.9 18.9 11.6 11.9 11.7 13.6 11.7 13.5 11.6 11.7 7.3 >
EE/USSR 4.1 4.1 4.1 4.1 4.1 4.0 4.0 4.1 4.2 4.1 4.9TOTAL 31.6 38.9 31.6 31.6 31.6 31.6 31.6 31.6 31.6 31.6 31.6

- 77 -
cheap electric power continues to bestow a cost advantage upon LDCs, even ifinvestment costs were 25 percent higher. This results in the unusualsituation in which developed countries are the dominant producers ofintermediate product (alumina), of which a substantial proportion issubsequently transformed into final product (aluminum) in LDCs. To someextent this production pattern already occurs. For example, Kaiser Aluminumships alumina from a refinery in Louisana to Ghana where aluminum ingots areproduced with low-cost power.
Variants 3-7 focus on electric power. Within the range ofasusmptions made, the effects of changes in cost or availabilities of electricpower on production levels in the three country groupings is surprisinglysmall. Neither a change in Canadian electric power costs, or an increase inthe price of low cost power in LDCs has noticeable effect on productionlevels. Rather drastic changes in the assumptions regarding the availabilityof low-cost power--50% less, none, or 100% more--does affect production levelsin OECD and LDCs relative to the base case.
Variant 5 and 7 have very similar results, mostly by coincidence.While neither production levels for bauxite nor alumina are affected, ascompared to the base case, a substantial amount of additional aluminumsmelting capacity expansion would take place in LDCs rather than in OECDcountries. In the case of variant 5, the lower availability of low costelectricity in OECD provides an effective constraint on capacity expansion, infavor of LDCs with relatively abundant low-cost power, even in the presence ofthis constraint. Conversely, when low cost power availability is doubledeverywhere, some LDC locations that were hitherto not cost-efficient couldexpand smelting capacity, at the expense of OECD countries.
In variant 6, it is assumed that no low cost electricity is availableanywhere. In that case, more smelting capacity is installed in the mainconsuming regions, i.e., OECD, in order to save on transport cost andinvestment charges. In comparison to the base case, this variant gives a verysimilar picture at the aggregate level.
In variant 8, the combined effect on production levels is determinedby an increase in capital costs and low-cost electricity in LDCs of 25percent. It appears that the effects are virtually identical to those foundfor variant 2, where only investment costs are increased. Production levelsfor bauxite and alumina are severely affected as a result of the increase incapital costs in LDCs. However, the effect on alumina production is marginal,and, as a group, LDCs retain their share of world production.
Variants 9 and 10 focus on the impact of trade policies that differfrom free trade, by varying assumptions with regard to the degree of self-sufficiency in all products that the main country groupings might want toachieve. In variant 9, we assume that 75 percent of total requirements mustcome from within each grouping; in variant 10 we assume that no trade ispermitted at all among the three groups. Trade restrictions of this sortwould have severe repercussions for LDCs as a group. In the case of partialtrade, production levels for both bauxite and alumina would fall although theproduction pattern for aluminum would not be affected much. However, in the
- 78 -
absence of trade among the groups, also the aluminum production level in LDCswill fall substantially, such that less than one-quarter of world productionwill take place in these countries, as opposed to over 60 percent in OECD.
Costs
What are the cost implications of these variants of the base case?Table 48 gives the relevant details. A higher rate of growth of demand,necessitating the construction of a considerable amount of additionalcapacity, not only raises total cost of meeting aluminum requirements, it alsoraises the average costs per ton from $1,569 to $1,665.
If no low cost electric power would be available to the aluminumsector by 2000, the cost implications would be quite substantial. Averagecost per ton of primary aluminum would be 8% higher, and total cost of meetingthe world's alumina requirements would increase by $4 billion. The increasein operating costs on account of electricity costs would be offset by lowerinvestment costs (because of a shift to OECD countries) and lower transportcosts.
The two scenarios relating to trade also exhibit substantial costincreases. Not surprisingly, total self-sufficiency for each bloc carries thelargest cost, 7 percent more than the base case.
Considering the individual cost components of the other variants, andleaving aside the high demand variant--where every cost element is larger--itis striking how few of the cost components are substantially different fromthe base case. It is not surprising that when capital costs in LDCs areraised, investment charges increase. Similarly, once it is demonstrated thatLDCs have gained a comparative cost advantage in aluminum smelting, a tradeembargo among blocs, necessitating an increase in aluminum production in OECDresults in much higher operating costs. However, considering the average costper ton associated with each variant, it is striking how narrow the range ofestimates is.
We shall now turn to a discussion of the results of the sensitivityanalysis of the individual country or region level; the focus will be oncapacity expansion.
Capacity Expansion
Tables 49, 50, and 51 summarize the results with respect to thecapacity expansion that would take place under each of the variants that wereconsidered at the country or region level.
In the case of bauxite, under no circumstances would new mines beopened in either Europe or Western Europe. In Australia, mine expansionbeyond the level currently committed is possible in two cases: if investmentcosts for mines in LDCs are seriously underestimated in the base case(variants 2 and 8), and if trade policies impose partial or total self-sufficiency on OECD. In all other cases, the needed mine expansion will takeplace in LDCs, mostly in Latin America and the Caribbean, followed by Asia,and lastly, in Africa.

Table 48: COSTS: TEN VARIANTS OF THE BASE CASE
(Million US dollars)
Energy TradeBase Case Variant 1 Variant 2 Variant 3 Variant 4 Variant 5 Variant 6 Variant 7 Variant 8 Variant 9 Variant 10
High Costs in Canadian Low Cost 50% Less No Low 100% more Capital Cost Partial No TradeDemand LDCs + 25% Electricity Electricity Low Cost Cost Low Cost + Low Cost Trade (75%) Among
Prices at in LDCs +25% Electricity Electricity Electricity Electricity Among Blocs BlocsUS Level
InvestmentCharges TaMines 430 558 506 430 430 428 405 428 505 402 468Refineries &Smelters 8,111 13,445 8,828 8,111 8,096 8,331 7,740 8,364 8,802 8,251 8,250
Operating CostsMines 1,728 2,039 1,772 1,728 1,728 1,718 1,712 1,723 1,771 1,781 1,842Refineries &Smelters 37,464 46,251 37,765 37,766 38,397 38,008 41,957 36,993 38,710 37,540 39,423
Transport 1,860 2,491 1,991 1,860 1,863 2,011 1,763 1,902 1,986 2,229 3,114
Total 49,593 64,784 50,861 49,895 50,514 50,496 53,577 49,410 51,774 50,203 53,107
Average CostPer Ton Zb 1,569 1,665 1,610 1,579 1,599 1,598 1,695 1,564 1,638 1,589 1,681Diff. to basecase - +6.1% +2.6% +0.6% +1.9% +1.8% +8.0% -0.3% +4.4% +1.3% +7.1%
Electricity CostsPer Ton 299 309 299 309 328 314 442 287 329 299 345
/a Excludes cost of existing or committed capacity.7Wb Excludes depreciation charges for existing plants and committed expansions.

Table 49: BAUXITE MINING: CAPACITY EXPANSION SUMMARY /a
(Million Metric Tons)
Energy TradeCommitted Base Case Variant I Variant 2 Variant 3 Variant 4 Variant 5 Variant 6 Variant 7 Variant 8 Variant 9 Variant 10Expansion Nigh Costs in Canadian Low Cost 502 Less No Low 100% more Capital Cost Partial No Trade
Demand LDCa + 25% Electricity Electricity Low Cost Cost Low Cost + Low Cost Trade (75%) AmongPrices at in LDCs +25% Electricity Electricity Electricity Electricity Among Blocs Blocs
US Level
United StatesW. Europe - - - - - - - - - - - -Australia 4.4 4.4 4.4 17.9 4.4 4.4 4.4 4.4 4.4 17.9 87.4 27.6
4.4 4.4 4.4 17.9 4.4 4.4 4.4 4.4 4.4 17.9 87.4 27.6
Jamaica - 34.7 34.7 52.1 34.7 34.7 31.8 29.9 30.9 51.8 - 20.0Haiti/D. Republic - - - - - - - - - - - -Guyana - 5.8 9.9 2.2 5.8 5.8 5.8 7.6 9.9 2.2 2.2 5.8Suriname - - - - - - - - - - - -Brazil 1.5 3.5 5.1 1.5 3.5 3.5 3.5 1.5 3.5 1.5 1.5 3.5Venezuela - 6.7 10.0 2.2 6.7 6.7 6.7 11.0 2.2 2.2 2.2 6.7
1.5 50.7 59.9 58.0 50.7 50.7 47.8 50.0 46.5 57.7 5.9 36.0
Ghana - 5.0 9.5 - 5.0 5.0 5.0 - 5.0 - - 5.0Guinea - 9.5 14.4 10.0 9.5 9.5 9.5 12.3 13.9 10.2 - 1.5Sierra Leone - - - - - - - - - - -Cameroon/Rest ofAfrica - - - - - - - - - -
0 14.5 23.9 10.0 1475 14.5 14.5 12.3 18.9 10.2 0.0 6.5
India - 4.4 9.3 4.4 4.4 4.4 4.4 5.6 4.4 4.4 - 4.4Indonesia - 12.2 20.5 5.5 12.2 12.2 15.0 19.6 11.2 5.5 1.9 8.0China - - - - - - - - - - - -other Asia - 6.6 6.6 .5 6.6 6.6 6.6 - 6.6 .5 5.4 6.6
0 23.2 36.4 10.4 23.2 23.2 26.0 25.2 22.2 10.4 7.3 19.0
E. Europe - 8.0 8.0 8.0 8.0 8.0 8.0 8.0 8.0 8.0 16.1 5.5
World 5.9 100.8 132.4 104.3 100.8 100.8 100.8 99.9 100.2 104.3 116.7 94.7
/a Includes committed expansions in Australia and Brazil of 4.4 and 1.5 million tons.

Table 50: ALUMINA: CAPACITY EXPANSION SUMMARY /a
(million metric tons)
Energy TradeCommitted Base Case Variant 1 Variant 2 Variant 3 Variant 4 Variant 5 Variant 6 Variant 7 Variant 8 Variant 9 Variant 10Expansion High Costa in Canadian Low Cost 50% Less No Low 100% more Capital Cost Partial No Trade
Demand LDCs + 25% Electricity Electricity Low Cost Cost Low Cost + Low Cost Trade (75%) AmongPrices at in LDCs +25% Electricity Electricity Electricity Electricity Among Blocs BlocsUS Level
Western U.S. - - - 2.0 - - - - - 2.9 6.8Eastern U.S. .1 2.1 2.1 9.1 2.1 2.1 2.1 2.1 2.1 10.1 .1 .1Western Canada - - - 2.0 - - - - - - 2.2 -Eastern Canada - - - 2.0 - - - - - 2.0 -Western Europe 1.5 3.5 3.8 3.8 3.5 3.5 3.5 4.6 3.5 3.9 1.5 1.5Japan - - - 2.0 - - - - - 2.0 - -Oceania 1.8 1.8 2.9 7.8 1.8 1.8 1.8 1.8 1.8 7.8 9.8 5.8
3.4 7.4 8.8 28.7 7.4 7.4 7.4 8.5 7.4 28.7 20.4 7.4
Central America - 2.0 2.0 - 2.0 2.0 2.0 - 2.0 - - 2.0Jamaica - 4.0 4.0 - 4.0 4.0 2.8 4.0 2.4 - 1.6 3.0Guyana - - 2.0 - - - - 2.0 2.0 -Suriname - 2.0 2.0 - 2.0 2.0 2.0 - 2.0 - - 2.0Brazil 1.4 3.4 4.1 1.4 3.4 3.4 3.4 3.4 3.4 1.4 2.1 3.4Venezuela 1.0 3.0 4.5 1.0 3.0 3.0 3.0 4.9 1.0 1.0 1.0 3.0Argentina - - - - - - - - - - - -
2.4 14.4 18.6 2.4 1474 14.4 13.2 14.3 12.8 2.4 4.7 13.5
Ghana - 2.0 4.0 - 2.0 2.0 2.0 - 2.0 - - 2.0Guinea - - - - - - - -Zaire - - - -N. Africa - - 2.0 - - - - - 2.0S. Africa - - - -Rest of Africa - - - - - - - -
- 2.0 6.0 0.0 2.0 2.0 2.0 0.0 4.0 0.0 0.0 2.0
India - 2.0 4.0 2.0 2.0 2.0 2.0 2.5 2.0 2.0 - 2.0China - 4.0 4.0 - 4.0 4.0 3.7 4.0 3.0 - 1.3 2.8ASEAN .5 3.9 4.5 .5 3.9 3.9 3.4 4.5 4.5 .5 2.5 2.9Korea & Other E. Asia - - 3.1 - - - 2.0 - - - -Middle East - - - - - - - - - -Rest of Asia .2 .2 .2 .2 .2 .2 .2 .2 .2 .2 .2 .2
.7 10.1 15.8 2.7 10.1 10.1 11.3 11.2 9.7 27 4.0 7.9
Eastern Europe - -_ _ 6.1 2.0Asian/USSR - - - - - - - - - - - 1.00.0 o.o 0.0 0.0 0.0 070 0.0 070 0.0 070 671 3.0
World 6.5 33.9 49.2 33.9 33.9 33.9 33.9 33.9 33.9 33.9 35.1 33.9
/a Includes committed capacities of 6.5 million tons.

Table 51: ALUMINUM: CAPACITY EXPANSION SUMMARY /a
(Millions of metric tons)
Energy TradeCommitted Base Case Variant 1 Variant 2 Variant 3 Variant 4 Variant 5 Variant 6 Variant 7 Variant 8 Variant 9 Variant 10Expansion High Costs in Canadian Low Cost 50% Less No Low 100% more Capital Cost Partial No Trade
Demand LDCs + 25% Electricity Electricity Low Cost Cost Low Cost + Low Cost Trade (75%) AmongPrices at in LDCs +25% Electricity Electricity Electricity Electricity Among Blocs Blocs
US Level
Western U.S. .06 .23 .26 .26 .23 .23 .26 2.06 .23 .28 1.68 .23Eastern U.S. .23 .23 .23 .23 .23 .23 .23 .23 .23 .23 .23 .23W. Canada - 1.12 1.12 1.12 1.12 1.12 .58 .2 .20 1.12 1.12 1.12E. Canada .11 .36 .36 .36 .36 .36 .31 .11 .11 .36 .76 .32Western Europe .53 .53 .53 .53 .53 .53 .53 1.02 .53 .53 2.53 .53
Japan -. 09 -. 09 -. 09 -. 09 -. 09 -. 09 -. 09 .30 -. 09 -. 09 -. 09 -. 09Oceania 1.03 2.31 2.58 2.58 2.31 2.58 1.36 1.03 1.83 2.58 2.58 2.58
1.87 4.69 4.99 4.99 4.69 4.99 3.18 4.95 3.04 5.01 8.81 4.95
Central America .05 .86 .86 .86 .86 .86 .46 .05 1.35 .86 .74 .86Jamaica - - - - - - - .80 - - - -Guyana - .17 .20 .17 .17 .17 .20 .80 .33 .17 .17 .17Suriname - - .20 - - - .20 .80 - - - -
Brazil .41 2.13 2.13 2.13 2.13 2.13 1.28 1.21 3.41 2.13 1.21 2.13
Venezuela .07 .87 1.20 .87 .87 .87 .63 .87 .07 .87 .07 .87Argentina .04 .04 2.11 .04 .04 .04 1.07 .04 .04 .04 0.4 .04
.57 4.07 6.70 4.07 4.07 4.07 3.84 4.57 5.20 4.07 2.23 4.07
Ghana - .72 2.0 .40 .72 .52 1.69 .20 .40 .40 - .52
Guinea - .47 .47 .47 .47 .40 .23 - .40 .40 .20 .40Zaire - .21 .21 .21 .21 .21 .10 - .41 .21 .21 .21N. Africa .17 .85 .85 .85 .85 .85 .43 .17 1.01 .85 .85 .85S. Africa .09 .09 .09 .09 .09 .09 .09 .34 .09 .09 .09 .09Rest of Africa - - - - - - - - - - - -
.26 2.34 3.62 2.02 2.34 2.07 2.54 .71 2732 1.95 1.35 2.07
India .02 .82 1.2 .82 .82 .82 .55 .82 .22 .82 .02 .82China - .20 .26 .20 .20 .20 .20 .80 .34 .20 .20 .20
ASEAN .33 1.32 1.32 1.32 1.32 1.32 .66 1.13 2.63 1.32 1.13 1.32Korea 6 Other Asia - - .80 - - - .78 .80 - - - -
Mid East .14 .94 3.14 .94 .94 .94 3.14 .14 .94 .94 .14 1.00Rest of Asia .06 .34 .34 .34 .34 .34 .26 .86 - .34 .06 .34
.55 3.62 7.06 3.62 3.62 3.62 5.59 4.55 6.45 3.62 1.55 3.68
Eastern Europe - .72 .72 .72 .72 .72 .72 .80 .72 .80 1.50 .72Asian-USSR - .44 .44 .44 .44 .44 .23 .20 .40 .44 .44 .42
0.00 1.16 1.16 1.16 1.16 1.16 .95 1.0 1.12 1.24 1.94 1.14
World 3.2 15.9 23.5 15.9 15.9 15.9 15.9 15.9 15.9 15.9 15.9 15.9
/a Includes committed capacity expansion of 3.2 million tons.

- 83 -
In most cases, mine expansion in Jamaica is limited to 30-35 milliontons. This is due to our assumption that at some point each country reaches aproduction volume where diseconomies of scale begin to occur, and beyond whichinvestment cost per ton begin to increase. It is only when capital costs inLDCs are higher than assumed in the base case that mine expansion in Jamaicais larger. This is due to the fact that in that case more alumina is producedin North America on the basis of imported Jamaican bauxite, as is shown inTable 50.
In all variants, capacity expansion for alumina is widespread,although in Africa, only Ghana is efficient under most assumptions. While theU.S., Western Europe and Australia remain consistently efficient locations foralumina refineries, most of the expansion takes place in LDCs. In LatinAmerica, Jamaica, Brazil and Venezuela, are attractive locations under mostconditions, while in Asia, India, China and ASEAN fall into that category.The sensitivity analysis confirms a point made earlier, i.e., that thelocational pattern for alumina refineries is the most volatile within thesector. A change in the assumption relating to investment costs in LDCscauses a major shift in the amount of expansion within OECD, as variants 2 and8 show.
In Table 51, capacity expansion results are given for aluminumsmelting. Under all circumstances, capacity in OECD will be expanded by some4-5 million tons. Most of this expansion will take place in Australia andWestern Canada, except if the availability of low cost power in the latter isreduced by 50%. If no low cost power is available anywhere, smelting capacityexpansion in OECD would be concentrated in the Western US, Western Europe andAustralia.
The major smelting capacity expansion in Latin America is likely totake place in Brazil, one-half of the total under most assumptions. Theremainder is most likely to be located in Venezuela and in Central America.
In Africa, in most of the variants considered, Ghana, Guinea andZaire, as well as North Africa, emerge consistently as potential sites forrelatively modest new smelter capacity. Ghana would be the major beneficiaryof a change in assumptions with regard to the availability of low-cost power(variant 5), expanding aluminum smelting capacity by 1.7 million tons, mainlyfor shipment to Europe.
In Asia, ASEAN (including Indonesia) would be the site for thelargest smelting capacity expansion. Moreover, India, China and the MiddleEast emerge consistently as efficient sites under most circumstances.
In conclusion, it may be said that the sensitivity analysis so farconducted reveals a remarkable degree of stability to the capacity expansionpattern of the base case. Individual country or regional differences dooccur, but a fairly robust pattern of efficient future producing locations canbe derived.

- 84 -
5.3 The Impact of Tariffs and Levies
Assuming that present tariffs, levies and royalties on the productsof the aluminum sector continue to be imposed during the period 1980-2000--anadmittedly strong assumption--one can determine their impact in terms ofcapacity expansion and costs. In what follows, we shall confine thecomparison to the base case, with and without tariffs and levies.
At the aggregate level, the results show considerable similarity. AsTable 52 shows, the capacity expansion patterns for bauxite are identical.For alumina and aluminum, capacity in OECD expands somewhat less, while LDCsincrease their production capacity even more rapidly than in the base case.The main reason for this shift is the impact of protective tariffs, causingsome decline in trade between blocs.
At the individual country level, differences between the base casewith and without tariffs and levies become appreciable. Tables 53, 54 and 55give the detailed results for capacity expansion of bauxite, alumina andaluminum respectively.
For bauxite, most of the changes in mining capacity expansion occurwithin regions rather than among them. Leaving aside Australia, where ineither case only currently committed capacity expansion takes place, thegeneral pattern is that within regions, capacity expansion shifts fromcountries with relatively high levies to countries with relatively low or nolevies, i.e., from Jamaica to Venezuela and Brazil in Latin America, and fromGuinea to Ghana in Africa. In Asia, both India and Indonesia would be goodlocations for increased mining capacity if the present structure of tariffsand levies remains in place.
Table 54 shows alumina capacity expansion for the base case with andwithout tariffs and levies. The main differences appear again at the countrylevel. Capacity expansion is considerably lower in the U.S. and W. Europe.Both Central America and Suriname cease to be attractive locations for aluminarefining, in favor of other Latin American countries (Brazil, Guyana andVenezuela).
The more modest growth of refining capacity in U.S. and WesternEurope results in larger capacity expansion in Ghana and the appearance ofNorth Africa as an attractive location for alumina refining. In Asia, theimpact of tariffs and levies is limited to a rearrangement of capacitieswithin the region, with India gaining and China and ASEAN experiencing slowergrowth of capacity.
Aluminum capacity expansion is shown in Table 55. The patternsemerging for the base case with and without tariffs and levies are strikinglysimilar, once more illustrating the importance of electric power cost inexplaining locational patterns. The most significant change is a much largersmelting capacity expansion in China when tariffs and levies are taken intoaccount. The existing tariff of 20 percent on imported aluminum provides aneffective barrier to trade, and China would produce all its aluminumrequirements domestically. This would lead to a loss of an export market for

- 85 -
Table 52: CAPACITY EXPANSION WITH AND WITHOUTTARIFFS AND LEVIES 1980-2000
Total Capacity in 2000Initial Base Case WithCapacity Base Case Tariffs & Levies
BauxiteOECD 40.5 44.9 44.9LDCs 48.3 137.0 137.0USSR/EE 10.1 18.1 18.1TOTAL 98.9 200.0 200.0
AluminaOECD 26.3 33.7 29.7LDCs 7.6 34.0 38.0USSR/EE 5.4 5.4 5.4TOTAL 39.3 73.1 73.1
AluminumOECD 11.7 16.4 15.2LDCs 2.6 12.6 13.7USSR/EE 3.2 4.4 4.3TOTAL 17.4 33.3 33.3

- 86 -
Table 53: BAUXITE CAPACITY EXPANSION 1980-2000, VARIANT WITHTARIFFS AND LEVIES 1/
(million metric tons)
Base Case with TariffsBase Case and Levies
Australia 4.4 4.4
Jamaica 37.7 12.2Guyana 5.8 6.3Brazil 3.5 6.3Venezuela 6.7 22.5
50.7 47.3
Ghana 5.0 8.2Guinea 9.5 3.5
14.5 11.7
India 4.4 9.1Indonesia 12.2 14.0Other Asia 6.6 6.6
23.2 29.7
Eastern Europe/USSR 8.0 8.0
TOTAL 100.8 101.1
1/ Including presently committed capacity.
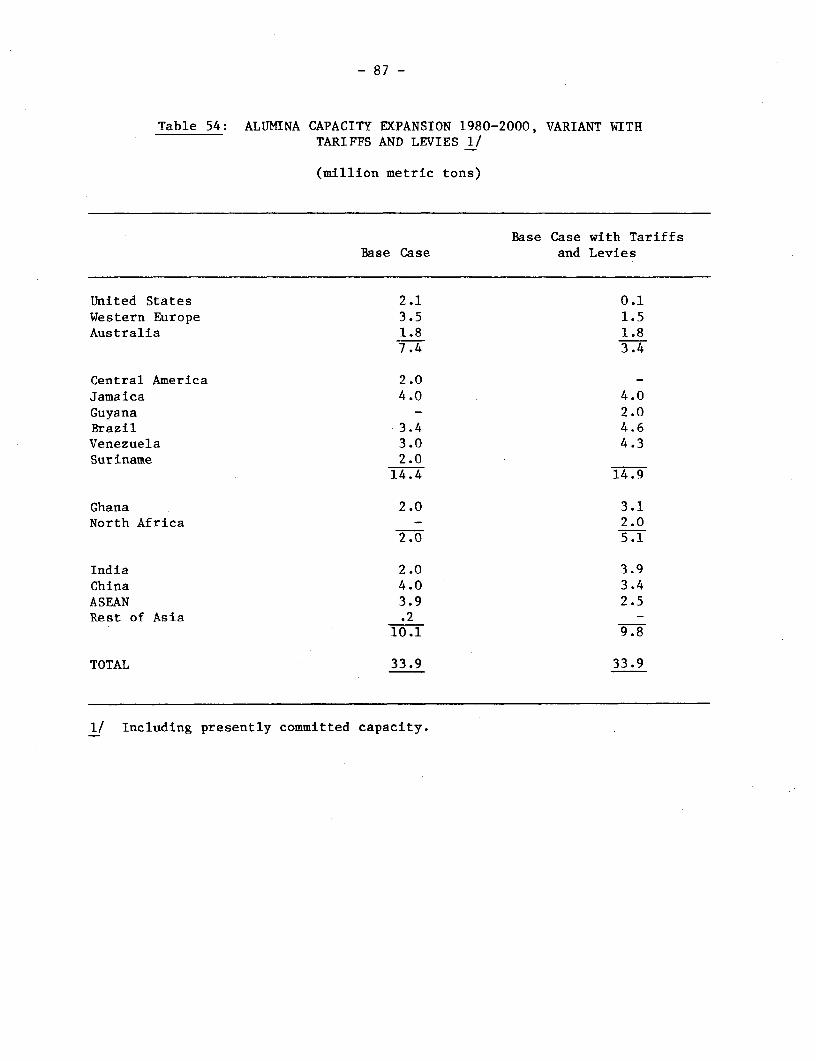
- 87 -
Table 54: ALUMINA CAPACITY EXPANSION 1980-2000, VARIANT WITHTARIFFS AND LEVIES 1/
(million metric tons)
Base Case with TariffsBase Case and Levies
United States 2.1 0.1Western Europe 3.5 1.5Australia 1.8 1.8
7.4 3.4
Central America 2.0Jamaica 4.0 4.0Guyana - 2.0Brazil -3.4 4.6Venezuela 3.0 4.3Suriname 2.0
14.4 14.9
Ghana 2.0 3.1North Africa - 2.0
2.0 5.1
India 2.0 3.9China 4.0 3.4ASEAN 3.9 2.5Rest of Asia .2 -
10.1 9.8
TOTAL 33.9 33.9
1/ Including presently committed capacity.

- 88 -
Table 55: ALUMINUM CAPACITY EXPANSION 1980-2000, VARIANT WITHTARIFF AND LEVIES 1/
Base Case with TariffsBase Case and Levies
United States 0.5 0.5Canada 1.5 0.8Western Europe 0.5 0.5Japan -0.1 -0.1Australia 2.3 1.8
4.7 3.5
Central America 0.9 0.9Brazil 2.1 2.1Venezuela 0.9 0.9Guyana 0.2 -
4.1 3.9
Ghana 0.7 1.3North Africa 0.9 0.9South Africa - 0.1Guinea 0.5 0.3Zaire 0.2 0.2
2.3 2.8
India 0.8 0.8China 0.2 1.2ASEAN 1.3 1.3Mid-East 0.9 0.9Rest of Asia 0.3 0.1
3.5 4.3
Eastern Europe 0.7 0.7Asian USSR 0.4 0.4
1.1 1.1
TOTAL 15.8 15.8
1/ Including presently committed capacity.

- 89 -
Australia, and, indirectly, for Canada. In turn, Ghana would become a majoralumina exporter to Western Europe. In all other cases, the pattern ofcapacity expansion for aluminum smelters is unaffected by taking account oftariffs and levies.
Costs
The final issue to be considered here is the impact on the structureand level of costs of the introduction of tariffs and levies. The relevantresults are summarized in Table 56. The total costs increase by over U.S.$1.5 billion, or by 3% per ton of aluminum. Most of the cost increase is dueto tariffs, i.e., US$1 billion. Levies add another $230 million, while theremainder is due to relatively smaller increases in investment, operating andtransport costs. Given the changes that occur in production and tradepatterns once tariffs and levies are taken into account, the impact on thereal cost structure of the world aluminum industry is surprising small, lessthan one percent.

- 90 -
Table 56: COSTS OF THE BASE CASE, WITH AND WITHOUTTARIFFS AND LEVIES
(million US$)
Base Case with TariffsBase Case and Levies
Investment ChargesMines 430 444Refineries and smelters 8,111 8,256
Operating CostsMines 1,728 1,713Refineries and Smelters 37,464 37,600
Transport 1,860 1,919
Tariffs - 974
Royalties and Levies - 233
Total 49,593 51,139
Average Cost per Ton 1,569 1,618

- 91 -
6. Conclusions
This study presented a framework for doing systematic analysis onfuture investment patterns in the bauxite/aluminum industry, taking intoaccount comparative advantages of each region, for each processing stage. Oneof the major undertakings was the establishment of a comprehensive database. This step was a difficult one not only because of the scarcity of datareadily available, but also because it was necessary to make judgements onfactors which are difficult to quantify. The second step dealt with selectingand applying the method of analysis. The methodology used was mixed integerlinear programming, which permitted us to carry out systematic investmentanalysis taking explicitly into account interdependencies among location,scale, technology and product mix of new productive investment. Many variantswere tested in this framework in order to carry out sensitivity analysis onthe various parameters of the model.
The results of the study showed that, due to the abundance of cheapbauxite reserves in the LDCs, most new mining investments are likely to takeplace in those countries. More than 90 percent of all new bauxite minecapacity would be installed in LDCs, whose share in bauxite mining wouldincrease from less than 50 percent in 1980 to about 70 percent in 2000.Sensitivity analysis on these results showed them to be fairly robust at theaggregate level, although with the introduction of levies and tariffs, minecapacity expansion shifted within developing countries (i.e., from Jamaica andGuinea to Venezuela, Brazil and Ghana).
The pattern of location of new alumina refineries proved to be themost sensitive to changes in the data since this is determined mainly not byresource endowments as for bauxite and aluminum but by differences in costs,shipping distances and the application of levies and tariffs. Thus, the shareof alumina production for LDCs which was 20 percent in 1980, could range in2000 from 16 to 50 percent, according to which version of the model followsmore closely future events.
One would expect that the availability in LDCs makes these countriesmost promising locations for new aluminum smelters. The model confirms thishypothesis, as the share of aluminum smelter capacity in LDCs increases from15 percent in 1980 to about 40 percent by 2000. Investments in aluminumsmelters are likely to be widely distributed among developing countries (seeTable 15).
While the availability of low cost energy makes it attractive forcompanies to locate smelters in developing countries, this study finds somequalifications to it. First, one must take into account the existence of longterm contracts for cheap electricity supplies in industrial countries whichwould make it feasible for many existing smelters to continue profitableoperations in those locations. Second, new investments are expensive and inmany cases they require heavy infrastructure expenditures, with the resultthat low cost electricity advantages may be wiped out by high capital costs.

- 92 -
Although this study is presented as a finished product we intend tomake it part of an ongoing operation. It is hoped that it will serve as abasis for discussions with the industry and related institutions. Besides,the data base will be periodically updated in order to incorporate futurechanges and to do further analysis as new requirements arise.

ANNEX 1GAMS 1.0 WORLD ALUMINUM MODEL DATA AND MODEL DEFINITION 04/19/83 09.52.52. PAGE 1
INTRODUCTION
NEW MARGIN - 002-1204 * MODEL STRUCTURE:5 *6 * SECTION 1 : GENERAL SET DEFINITIONS78 * SECTION 2 : DEMAND CHARACTERISTICS FOR PRIMARY ALUMINUM
910 * SECTION 3 : MINE DATA1112 * SECTION 4 : TECHNOLOGY13
14 * SECTION 5 : CAPACITIES AND DEPOSITS1516 * SECTION 6: INFRASTRUCTURE AND INVESTMENT COSTS17
18 * SECTION 7: OPERATING COSTS1920 * SECTION 8: TRANSPORT DESCRIPTION2122 * SECTION 9 : PRICES, TARIFFS AND LEVIES2324 * SECTION 10: MODEL REDUCTION
2526 * SECTION 11: COST CALCULATIONS ON DATA27 Hc
28 * SECTION 12: DATA CHECKS29 0 C30 * SECTION 13: MODEL SPECIFICATION H
3132 * SECTION 14: SCENARIO3334 * SECTION 15: REPORT353637 * IN SECTIONS 2 THROUGH 8, SET AND PARAMETER DECLARATIONS ARE MADE38 * MADE FIRST, FOLLOWED BY DATA, AND FINALLY STRUCTURAL LINK CHECKS.39 *40 * THROUGHOUT THE MODEL TONS MEANS METRIC TONS. AND TPY - TONS PER YEAR.41 *42 * THE FOLLOWING SET CALLED PRINT ORDER IS USED ONLY TO DETERMINE THE43 * DISPLAY FEATURES OF THE REPORT SECTION.44 SET PO PRINT ORDER /4546 USA , WESTERN-US , EASTERN-US , WEST-CAN , EAST-CAN , WN-AMERICA , EN-AMERICA , N-AMERICA47 W-EUROPE , WEST-EUR , JAPAN , JAPAN+OC , N-AUSTRAL , W-AUSTRAL , OCEANIA , OECD48 C-AMER+CAR , JAMAICA , JAMAICAl , JAMAICA2 , HAITI+DR , GUYANA , SURINAM , BRAZIL49 VENEZUELA , ARGENTINA , WS-AMERICA , ES-AMERICA , S-AMER+CAR , GHANA , AYEK-GUIN , FRIA-GUIN50 TOUG-GUIN , S-LEONE , CAMER+OA , N-AFRICA , REST-GUIN , ZAIRE , REST-AFRIC , S-AFRICA51 W-AFRICA , E-AFRICA , AFRICA , INDIA , INDONESIA , CHINA , O-ASIA , ASEAN52 KOREA+OEA , MID-EAST , REST-ASIA , ASIA-X , LDCS , EE+USSR , E-EUROPE , ASIAN-USSR /

GAMS 1.0 WORLD ALUMINUM MODEL DATA AND MODEL DEFINITION 04/19/83 09.52.52. PAGE 2
GENERAL SET DEFINITIONS
54 SET I MINING REGIONS /5556 USA , W-EUROPE , N-AUSTRAL , W-AUSTRAL , JAMAICAl , JAMAICA2 , HAITI+DR , GUYANA
57 SURINAM , BRAZIL , VENEZUELA , GHANA , AYEK-GUIN , FRIA-GUIN , TOUG-GUIN , S-LEONE
58 CAMER+OA , INDIA , INDONESIA , CHINA , O-ASIA , EE+USSR5960 R PRODUCING REGIONS /6162 WESTERN-US , EASTERN-US , WEST-CAN , EAST-CAN , W-EUROPE , JAPAN , W-AUSTRAL , OCEANIA
63 C-AMER+CAR , JAMAICA , GUYANA , SURINAM , BRAZIL , VENEZUELA , ARGENTINA , GHANA
64 AYEK-GUIN , N-AFRICA , REST-GUIN , ZAIRE , REST-AFRIC , S-AFRICA , INDIA , CHINA
65 ASEAN , KOREA+OEA , MID-EAST , REST-ASIA , E-EUROPE , ASIAN-USSR I66
67 J MARKETING AREAS /68
69 WN-AMERICA , EN-AMERICA , W-EUROPE JAPAN , OCEANIA C-AMER+CAR , WS-AMERICA , ES-AMERICA
70 N-AFRICA , S-AFRICA , W-AFRICA , E-AFRICA , CHINA ASEAN , KOREA+OEA , MID-EAST
71 REST-ASIA , EE+USSR /7273 G SEVEN REGION GROUPINGS /7475 N-AMERICA , WEST-EUR , JAPAN+OC , S-AMER+CAR , AFRICA , ASIA-X , EE+USSR
7677 F THREE WAY GROUPING / OECD , LDCS , EE+USSR /7879
80 GI(G,I) MAP OF SEVEN REGIONAL GROUPS TO MINES/
8182 N-AMERICA.USA83 WEST-EUR.W-EUROPE84 JAPAN+OC.(N-AUSTRAL,W-AUSTRAL)85 S-AMER+CAR.(JAMAICAI,JAMAICA2,HAITI+DR,GUYANA,SURINAM,BRAZIL,VENEZUELA)86 AFRICA.(GHANA,AYEK-GUIN,FRIA-GUIN,TOUG-GUIN,S-LEONE,CAMER+OA)87 ASIA-X.(INDIA,INDONESIA,CHINA,O-ASIA)
88 EE+USSR.EE+USSR I8990 GR(G,R) MAP OF SEVEN REGIONAL GROUPS TO REFINERIES AND SMELTERS I9192 N-A14ERICA.(WESTERN-US,EASTERN-US,WEST-CAN,EAST-CAN)
93 WEST-EUR.W-EUROPE94 JAPAN+OC.(W-AUSTRAL,OCEANIA,JAPAN)95 S-AMER+CAR.(GUYANA,SURINAM,BRAZIL,VENEZUELA,JAMAICA,C-AMER+CAR,ARGENTINA)96 AFRICA.(GHANA,AYEK-GUIN,N-AFRICA,REST-GUIN,ZAIRE,REST-AFRIC,S-AFRICA)
97 ASIA-X.(INDIA,CHINA,ASEAN,KOREA+OEA,REST-ASIA,MID-EAST)
98 EE+USSR.(E-EUROPE,ASIAN-USSR) /99
100 GJ(G,J) MAP OF SEVEN REGIONAL GROUPS TO MARKETS/
101102 N-AMERICA.(WN-AMERICA,EN-AMERICA)
103 WEST-EUR.W-EUROPE
104 JAPAN+OC.(OCEANIA,JAPAN)105 S-AMER+CAR.(C-AMER+CAR,WS-AMERICA,ES-AMERICA)

GAMS 1.0 WORLD ALUMINUM MODEL DATA AND MODEL DEFINITION 04/19/83 09.52.52. PAGE 3GENERAL SET DEFINITIONS
106 AFRICA.(N-AFRICA,S-AFRICA,W-AFRICA,E-AFRICA)107 ASIA-X.(CHINA,ASEAN,KOREA+OEA,REST-ASIA,MID-EAST)108 EE+USSR.(EE+USSR) /109110 FG(F,G) MAP OF SEVEN REGIONAL GROUPS TO THREE WAY GROUPING /111112 OECD.(N-AMERICA,WEST-EUR, JAPAN+OC)113 LDCS.(S-AMER+CAR, AFRICA, ASIA-X)114 EE+USSR.EE+USSR /115116117118 FR(F,R) MAP OF PRODUCING REGIONS TO THREE WAY GROUPING
119120 FI(F,I) MAP OF MINING REGIONS TO THREE WAY GROUPING121122 FJ(F,J) MAP OF MARKETS TO THREE WAY GROUPING123
124 C COMMODITIES/125126 TRI-201 TRIHYDRATE BA 2:1 SI 4%127 TRI-221 TRIHYDRATE BA 2.2:1 SI 3%128 TRI-241 TRIHYDRATE BA 2.4:1 SI 3%129 TRI-341 TRIHYDRATE BA 3.4:1 SI 1.5%130 TRI-MO-271 MIXED BA 2.7:1 ST 1.5%131 TRI-MO-221 MIXED BA 2.2:1 SI 4%132 MONO MONOHYDRATE BAUXITE133 HIGHSI HIGH SILICA BAUXITE134 ALUMINA135 ALUMINUM136 ELECTR ELECTRICITY137138 CF(C) FINAL PRODUCTS / ALUMINUM /139140 CI(C) INTERMEDIATES / ALUMINA I141142 CL(C) ELECTRICITY / ELECTR /143144 CM(C) BAUXITES / TRI-201, TRI-221, TRI-241, TRI-341, TRI-MO-271, TRI-MO-221, MONO, HIGHSI /145
146 CMI MISCELLANEOUS INPUTS /147
148 LABOR MAN-HOURS PER TON
149 ENERGY MILLION BTU PER TON150 SODA-ASH TONS PER TON151 LIME TONS PER TON152 FUEL-LUB MILLION BTU PER TON153 THERM-EGY MILLION BTU PER TON154 COKE TONS PER TON155 FLUORIDES KILOGRAMS PER TON
e 156 PITCH TONS PER TON157 OTHER IN 1980 US$ PER TON /

GAMS 1.0 WORLD ALUMINUM MODEL DATA AND MODEL DEFINITION 04/19/83 09.52.52. PAGE 4
GENERAL SET DEFINITIONS
158159 L COMMODITY - ELECTRICITY SUPPLY TYPES /160 EL-ACTUAL ELECTRICITY FOR PLANTS IN PRODUCTION
161 EL-LOCOST POTENTIAL ELECTRICTY SUPPLIES
162 EL-HICOST ELECTRICITY FROM TRADABLE FUELS /163164 P PROCESSES FOR REFINING AND SMELTING /165166 REF-T201 REF-TRIHYDRATES BA 2:1 SI 4%
167 REF-T221 REF-TRIHYDRATES BA 2.2:1 SI 3%
168 REF-T241 REF-TRIHYDRATES BA 2.4:1 SI 3%
169 REF-T341 REF-TRIHYDRATES BA 3.4:1 SI 1.5%
170 REF-TM271 REF TRI-MONOHYDRATES BA 2.7:1 SI1.5%
171 REF-TM221 REF-TRI-MONOHYDRATES BA 2.2:1 SI 4%
172 REF-M REF-MONOHYDRATES HIGH TEMP PRESS
173 REF-HS REF-HIGH SILICA SODA SINTER PROCESS
174 SMELTING SMELTING OF ALUMINA
175
176
177 M PRODUCTIVE UNITS FOR REFINING AND SMELTING /178179 REFINERYT REFINERY FOR TRIHYDRATES
180 REFINERYTM REFINERY FOR TRI-MONOHYDRATES
181 REFINERYM REFINERY FOR MONOHYDRATES
182 REFINERYSS REFINERY FOR HIGH SILICA
183 SMELTER TO PROCESS ALUMINA INTO ALUMINUM /184
185 MR(M) PRODUCTIVE UNITS FOR REFINING / REFINERYT, REFINERYTM, REFINERYM, REFINERYSS I186187 MS(M) PRODUCTIVE UNITS FOR SMELTING / SMELTER /188
189 SEG INVESTMENT SEGMENTS I 1*4 /;
190191 ALIAS(R,RP),(G,GP),(F,FP);
192193 FR(F,R) = YES$SUM(G, FG(F,G)*GR(G,R));194 FI(F,I) - YES$SUM(G, FG(F,G)*GI(G,I));
195 FJ(F,J) = YES$SUM(G, FG(F,G)*GJ(G,J));
196 DISPLAY FR,F1,FJ;
197198 SCALAR INTERVAL TIME INTERVAL FOR MINE RESOURCE CONSTRAINT / 20 /;

GAMS 1.0 WORLD ALUMINUM MODEL DATA AND MODEL DEFINITION 04/19/83 09.52.52. PAGE 5DEMAND CHARACTERISTICS FOR PRIMARY ALUMINUM
200 PARAMETER D(J) ALUMINUM DEMAND IN THE YEAR 2000 (1000 TPY)201 NMAA2000(R) NON-METAL ALUMINA DEMAND IN YEAR 2000 (1000 TPY)202 NMBA2000(I) NON-METAL BAUXITE DEMAND IN YEAR 2000 (1000 TPY)203204 PARAMETER NMBA1980(I) NON-METAL GRADE BAUXITE PRODUCTION IN 1980 /205206 USA 272207 GUYANA 1765208 SURINAM 493209 N-AUSTRAL 230210 CHINA 200 /211212 NMAA1980(R) NON-METAL GRADE ALUMINA DEMAND AT SMELTERS IN 1980 /213214 EASTERN-US 884215 W-EUROPE 857216 JAPAN 582 /;217218219 * NONMETAL BAUXITE CONSUMPTION GROWS AT THE ANNUAL RATE OF 5% AND220 * NONMETAL ALUMINA CONSUMPTION GROWS AT THE ANNUAL RATE OF 3.5%.221222 NMBA2000(I) = NMBA1980(I)*1.05**20;223 NMAA2000(R) = NMAA1980(R)*1.035**20;224225 TABLE DEM2000 HIGH AND LOW DEMAND FORECASTS FOR ALUMINUM IN THE YEAR 2000 AND HISTORICAL 1980226227 HIGH LOW 1980228229 W-EUROPE 8016 6398 3884230 EE+USSR 6099 4884 2776231 CHINA 1575 1575 618232 C-AMER+CAR 364 281 96233 OCEANIA 376 328 243234 ASEAN 1243 886 65235 KOREA+OEA 1374 1120 240236 JAPAN 4331 3762 1637237 REST-ASIA 1350 987 278238 MID-EAST 216 216 70239 N-AFRICA 74 70 35240 S-AFRICA 376 361 78241 WN-AMERICA 5750 4489 2382242 EN-AMERICA 5750 4489 2382243 WS-AMERICA 340 263 117244 ES-AMERICA 1549 1407 378245 W-AFRICA 70 70 31246 E-AFRICA 70 46 16247248 D(J) = DEM2000(J,"HIGH");

GAMS 1.0 WORLD ALUMINUM MODEL DATA AND MODEL DEFINITION 04/19/83 09.52.52. PAGE 6MINE DATA
250 PARAMETER SRATIO(I,CM) STRIP RATIOS FOR MINE LOCATIONS AND BAUXITE TYPES /251252 USA.HIGHSI 1.5 , (W-EUROPE,EE+USSR).MONO 1.5253 GUYANA.TRI-201 1.37 , BRAZIL.TRI-221 1.37254 (VENEZUELA,GHANA).TRI-221 1.22 , O-ASIA.TRI-241 1.22255 (FRI GUIN,S-LEONE,INDONESIA).TRI-221 1. , (JAMAICA1,SURINAM,CAMER+OA,INDIA).TRI-241 1.256 W-AUS\TRAL.TRI-341 1. , (N-AUSTRAL,AYEK-GUIN,TOUG-GUIN).TRI-MO-221 1.257 (JAMAICA2,HAITI+DR).TRI-MO-271 1. , CHINA.HIGHSI 1.258
'N~~~~~~~~~~~~~~~~~~~~~~~~~~~~~~~~~~~~~~~~~~~~~~~~~~~~~~~~c
/
w

GAMS 1.0 WORLD ALUMINUM MODEL DATA AND MODEL DEFINITION 04/19/83 09.52.52. PAGE 7TECHNOLOGY
NEW MARGIN - 002-120261 SET AR ROW LABELS FOR MATRIX A /262 TRI-201 , TRI-221 , TRI-241 , TRI-341 , TRI-MO-271, TRI-MO-221, MONO , HIGHSI263 ALUMINA , ALUMINUM , LABOR , ENERGY , SODA-ASH , LIME , FUEL-LUB , THERM-EGY264 COKE , FLUORIDES , PITCH , OTHER , ELECTR /265266 PARAMETER BATOAA(CM) RATIO OF BAUXITE TO ALUMINA (WEIGHT)267 AATOAL(CI) RATIO OF ALUMINA TO ALUMINUM (WEIGHT);
NEW MARGIN - 002-100269 TABLE A INPUT-OUTPUT COEFFICIENTS270271 REF-T201 REF-T221 REF-T241 REF-T341 REF-TM271 REF-TM221 REF-M REF-HS SMELTING272273 TRI-201 -2.000 THE ELECTRICAL274 TRI-221 -2.200 ENERGY REQUIRE-275 TRI-241 -2.400 MENT IS BASED276 TRI-341 -3.400 ON THE PREBAKED277 TRI-MO-271 -2.700 SYSTEM. IN 1980278 TRI-MO-221 -2.200 13500 - 14300KWH279 MONO -2.500 WAS REQUIRED.280 HIGHSI -2.300 ASSUMING AN ENERGY281 ALUMINA 1.000 1.000 1.000 1.000 1.000 1.000 1.000 1.000 -1.930 PRODUCTIVITY IM-282 ALUMINUM 1.000 PROVEMENT OF .5%283 LABOR -1.800 -1.800 -1.800 -1.800 -2.000 -2.000 -2.000 -4.000 -8.600 PER YEAR APPROXI-284 ENERGY -13.100 -13.100 -13.100 -13.100 -14.100 -14.100 -14.700 -43.000 ATELY 12600KWH285 SODA-ASH -.110 -.090 -.100 -.070 -.090 -.120 -.150 -.050 IS REQUIRED IN286 LIME -.100 -.100 -.100 -.100 -.100 -.100 -.100 -1.750 THE PERIOD OF287 THERM-EGY -4.400 1995 - 2000.288 COKE -.375289 FLUORIDES -30.000290 PITCH -.1291 OTHER -30.0 -30.0 -30.0 -30.0 -30.0 -30.0 -30.0 -60.0 -220.0292 ELECTR -12.6293
NEW MARGIN - 002-120295 TABLE B(M,P) CAPACITY UTILIZATION296297 REF-T201 REF-T221 REF-T241 REF-T341 REF-TM271 REF-TM221 REF-M REF-HS SMELTING298299 REFINERYT 1.0 1.0 1.0 1.0300 REFINERYTM 1.0 1.0301 REFINERYM 1.0302 REFINERYSS 1.0303 SMELTER 1.0304305306307308 BATOAA(CM) - - SMIN(P, A(CM,P));309 AATOAL(CI) - - SMIN(P, A(CI,P));310 DISPLAY BATOAA, AATOAL;

GAMS 1.0 WORLD ALUMINUM MODEL DATA AND MODEL DEFINITION 04/19/83 09.52.52. PAGE 8CAPACITIES AND DEPOSITS
312 SET CC COLUMN LABELS FOR INITIAL CAPACITY AND RESERVES MATRIX /313 INITIAL, INVEST, RESERVES, INITIAL-70, RESERVE-70, T-70, TM-70, M-70, SS-70, SMELT-70 I314315 EC1 COLUMN LABELS FOR ELECTRICAL ENERGY RESOURCES MATRIX / HYDRO, FLAREDGAS, COAL, LC316317 MAPCC(M,CC) MAP DATA LABELS FOR 1970 TO PRODUCTIVE UNITS I REFINERYT.T-70318 REFINERYTM.TM-70319 REFINERYM.M-70320 REFINERYSS.SS-70321 SMELTER. SMELT-70 /322323 PARAMETER CAPM(I) EXISTING AND COMMITED MINE CAPACITIES (1000 TPY)324 ZMBAR(I) MAXIMUM MINE OUTPUT LEVEL (MILLION TONS)325 CAPR(R,M) TOTAL REFINERY AND SMELTER CAPACITIES (1000 TPY)326 UBAR(R,*) ELECTRICITY SUPPLY (GIGAWATT HOURS PER YEAR)327 UTM CAPACITY UTILIZATION FOR MINES328 UTR(M) CAPACITY UTILIZATION FOR REFINERIES;329
NEW MARGIN = 002-090331 TABLE CAPMI(I,*) MINE CAPACITIES AND RESERVES IN 1980 AND 1970 COMMENT332333 INITIAL INVEST RESERVES INITIAL-70 RESERVE-70334 * (1000 TPY) (1000 TPY) (MILLION TPY) (1000 TPY) (MILLION TPY) CAPACITIES REPRESENT335 TOTAL MATERIAL REMOVED.336 USA 1945 40 2300 59337 JAMAICAI 8420 1050 8420 1140338 JAMAICA2 4350 542 4350 590 THE "INVEST COLUMN o339 HAITI+DR 1200 50 2000 65 REFERS TO FIRM340 GUYANA 3720 700 4800 140 INVESTMENT COMMIT-341 SURINAM 5260 490 6500 540 MENTS.342 BRAZIL 5150 1500 4070 550 2500343 VENEZUELA 500 500344 W-EUROPE 8803 1200 8400 1280345 EE+USSR 10126 600 10100 700346 N-AUSTRAL 16250 3400 4560 3450347 W-AUSTRAL 13500 4400 1200 5500 1250348 INDIA 2150 600 1500 250349 INDONESIA 1215 700 1340 390350 CHINA 1665 200 650 210351 O-ASIA 605 130 1200 140352 GHANA 279 500 420 250353 AYEK-GUIN 9600 1200 1200354 FRIA-GUIN 1440 300 2700 300355 TOUG-GUIN 2500 4000 2000356 S-LEONE 755 280 490 120357 CAMER+OA 1020 1020358359360 * MAXIMUM MINE OUTPUT LEVELS AND CAPACITY.361 ZMBAR(I) - CAPM1(I,"RESERVES")*1000;362 CAPM(I) - CAPM1(I,"INITIAL") + CAPM1(I,"INVEST");363 DISPLAY CAPM,ZMBAR;
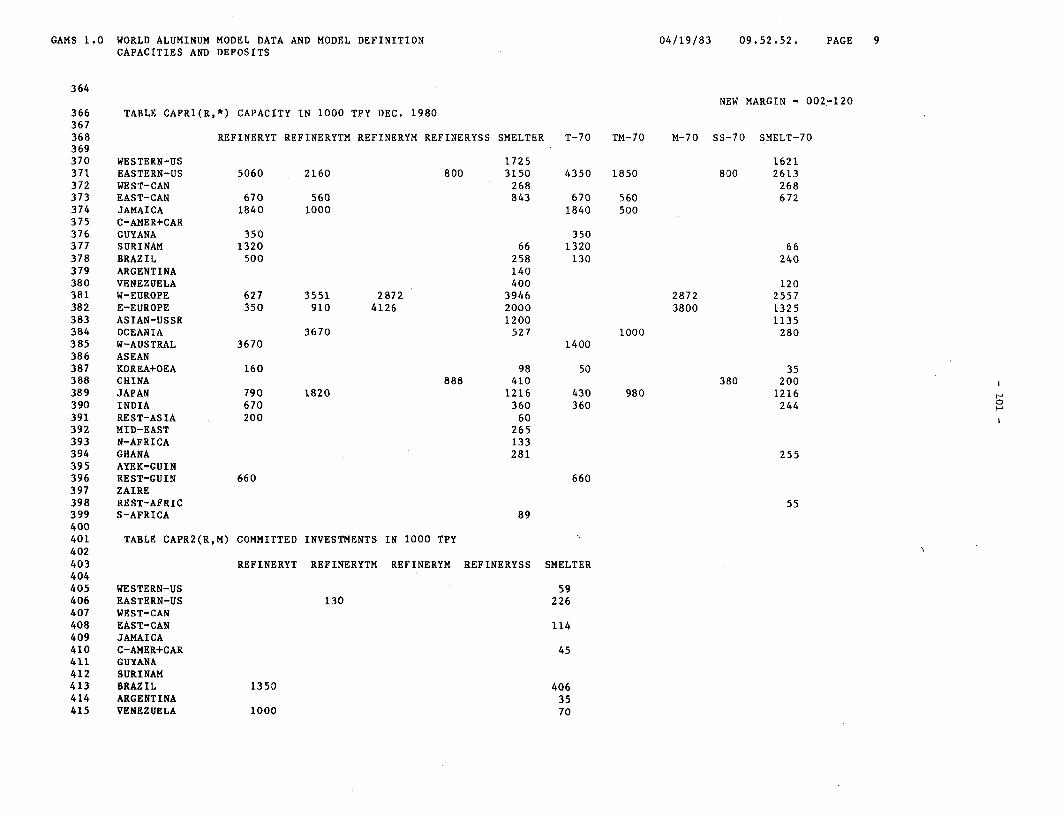
GAMS 1.0 WORLD ALUMINUM MODEL DATA AND MODEL DEFINITION 04/19/83 09.52.52. PAGE 9CAPACITIES AND DEPOSITS
364NEW MARGIN = 002-120
366 TABLE CAPR1(R,*) CAPACITY IN 1000 TPY DEC. 1980367368 REFINERYT REFINERYTM REFINERYM REFINERYSS SMELTER T-70 TM-70 M-70 SS-70 SMELT-70369370 WESTERN-US 1725 1621371 EASTERN-US 5060 2160 800 3150 4350 1850 800 2613372 WEST-CAN 268 268373 EAST-CAN 670 560 843 670 560 672374 JAMAICA 1840 1000 1840 500375 C-AMER+CAR376 GUYANA 350 350377 SURINAM 1320 66 1320 66378 BRAZIL 500 258 130 240379 ARGENTINA 140380 VENEZUELA 400 120381 W-EUROPE 627 3551 2872 3946 2872 2557382 E-EUROPE 350 910 4126 2000 3800 1325383 ASIAN-USSR 1200 1135384 OCEANIA 3670 527 1000 280385 W-AUSTRAL 3670 1400386 ASEAN387 KOREA+OEA 160 98 50 35388 CHINA 888 410 380 200389 JAPAN 790 1820 1216 430 980 1216390 INDIA 670 360 360 244391 REST-ASIA 200 60392 MID-EAST 265393 N-AFRICA 133394 GHANA 281 255395 AYEK-GUIN396 REST-GUIN 660 660397 ZAIRE398 REST-AFRIC 55399 S-AFRICA 89400401 TABLE CAPR2(R,M) COMMITTED INVESTMENTS IN 1000 TPY402403 REFINERYT REFINERYTM REFINERYM REFINERYSS SMELTER404405 WESTERN-US 59406 EASTERN-US 130 226407 WEST-CAN408 EAST-CAN 114409 JAMAICA410 C-AMER+CAR 45411 GUYANA412 SURINAM413 BRAZIL 1350 406414 ARGENTINA 35415 VENEZUELA 1000 70
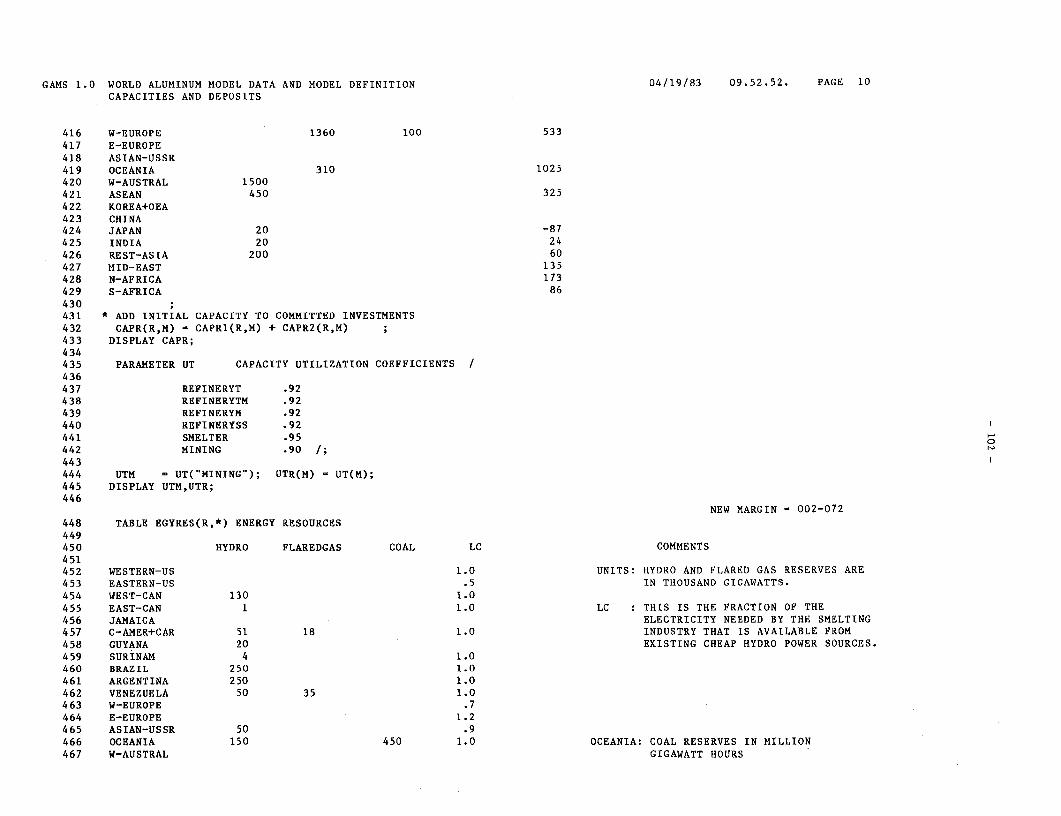
GAMS 1.0 WORLD ALUMINUM MODEL DATA AND MODEL DEFINITION 04/19/83 09.52.52. PAGE 10
CAPACITIES AND DEPOSITS
416 W-EUROPE 1360 100 533
417 E-EUROPE
418 ASIAN-USSR419 OCEANIA 310 1025
420 W-AUSTRAL 1500
421 ASEAN 450 325
422 KOREA+OEA423 CHINA424 JAPAN 20 -87
425 INDIA 20 24
426 REST-ASIA 200 60
427 MID-EAST 135
428 N-AFRICA 173
429 S-AFRICA 86
430431 * ADD INITIAL CAPACITY TO COMMITTED INVESTMENTS432 CAPR(R,M) = CAPR1(R,M) + CAPR2(R,M)
433 DISPLAY CAPR;434435 PARAMETER UT CAPACITY UTILIZATION COEFFICIENTS /436
437 REFINERYT .92438 REFINERYTM .92439 REFINERYM .92440 REFINERYSS .92
441 SMELTER .95
442 MINING .90 /;
443444 UTM UT("MINING"); UTR(M) 5 UT(M);445 DISPLAY UTM,UTR;446
NEW MARGIN = 002-072
448 TABLE EGYRES(R,*) ENERGY RESOURCES449450 HYDRO FLAREDGAS COAL LC COMMENTS
451452 WESTERN-US 1.0 UNITS: HYDRO AND FLARED GAS RESERVES ARE
453 EASTERN-US .5 IN THOUSAND GIGAWATTS.
454 WEST-CAN 130 1.0
455 EAST-CAN 1 1.0 LC : THIS IS THE FRACTION OF THE
456 JAMAICA ELECTRICITY NEEDED BY THE SMELTING457 C-AMER+CAR 51 18 1.0 INDUSTRY THAT IS AVAILABLE FROM458 GUYANA 20 EXISTING CHEAP HYDRO POWER SOURCES.
459 SURINAM 4 1.0460 BRAZIL 250 1.0
461 ARGENTINA 250 1.0
462 VENEZUELA 50 35 1.0
463 W-EUROPE .7
464 E-EUROPE 1.2465 ASIAN-USSR 50 .9466 OCEANIA 150 450 1.0 OCEANIA: COAL RESERVES IN MILLION467 W-AUSTRAL GIGAWATT HOURS

GAMS 1.0 WORLD ALUMINUM MODEL DATA AND MODEL DEFINITION 04/19/83 09.52.52. PAGE 11CAPACITIES AND DEPOSITS
468 ASEAN 120 15 -1.0 NEGATIVE LC:469 CHINA 17 1.0 IN ASEAN AND KOREA+OEA LC IS470 JAPAN .2 NEGATIVE INDICATING NO CURRENTLY471 INDIA 160 .6 EXISTING CHEAP POWER IS AVAILABLE472 REST-ASIA 40 1.0 TO THE SMELTING INDUSTRY. MINUS473 MID-EAST 320 1.1 1 IS USED IN PLACE OF ZERO AS IT474 N-AFRICA 40 1.0 FACILITATES DATA CHECKS.475 GHANA 170 9C 1.0476 REST-GUIN 56 0.0
477 ZAIRE 110478 S-AFRICA 1.0
479 KOREA+OEA -1.0480
NEW MARGIN - 002-120482 * EL-THEORY: THEORETICAL ELECTRICAL ENERGY REQUIREMENTS FOR EXISTING CAPACITY:
483 *484 * (CAPACITY OF SMELTER) X (UTILIZATION FACTOR) X (GICAWATT RRS OF ELECTRICITY NEEDED PER 1000 TONS OF ALUMINUM)485 *486 * EL-ACTUAL: ACTUAL ENERGY RESOURCES AVAILABLE TO THE INDUSTRY: EL-THEORY X LC487 *488 * EL-LOCOST: POTENTIAL LOW COST ENERGY AVAILABLE FROM MORE EXPENSIVE HYDRO, FLARED GAS AND COAL SUPPLIES:489 * 0.1 X HYDRO POTENTIAL + 0.25 X FLARED GAS POTENTIAL490 *491 * EL-HICOST: POTENTIAL ENERGY SUPPLY FROM EXPENSIVE COAL AND NUCLEAR SOURCES.492 *493 * NOTE: (A) IN AUSTRALIA (OCEANIA) ONLY 15000 GIGAWATT HRS PER YEAR GENERATED FROM COAL IS CONSIDERED; O
494 * (B) IN ZAIRE, DESPITE 109000 GIGAWATT HRS PER YR IN POTENTIAL HYDRO POWER, ONLY 2450 GIGAWATT HRS495 * PER YEAR IS CONSIDERED AS PRACTICALLY AVAILABLE FOR ALUMINUM SMELTING PURPOSES;496 * (C) IN C-AMER+CAR ALTHOUGH THERE IS NO SMELTING INDUSTRY 607 GIGAWATT HRS PER YR OF ELECTRICAL ENERGY497 * IS AVAILABLE;
498 * (D) MOST HYDRO-POTENTIAL POWER AVAILABLE IN EASTERN CANADA IS NOT AVAILABLE. BUT A SMALL FRACTION,499 * TOGETHER WITH SOME FROM WESTERN CANADA, TOTALING 3000 GIGAWATT HRS IS AVAILABLE.500
501 UBAR(R,VEL-THEORY") - CAPR1(R,"SMELTER")*O.95*14.3;502
503 UBAR(R,"EL-ACTUAL")$( EGYRES(R,"LC") GT 0 ) UBAR(R,"EL-THEORY")*EGYRES(R,"LC");504505 UBAR("C-AMER+CAR","EL-ACTUAL") - 607;
506
507 UBAR(R,"EL-LOCOST") - (0.1*EGYRES(R,"HYDRO") + 0.25*EGYRES(R,"FLAREDGAS"))*1000;508
509 UBAR("OCEANIA",7EL-LOCOST") - UBAR('OCEANIA","EL-LOCOST") + 33.3*EGYRES("OCEANIA","COAL");
510511 UBAR("ZAIRE","EL-LOCOST") - .02247*EGYRES("ZAIRE"',"HYDRO")*1OOO;
512
513 UBAR("EAST-CAN","EL-LOCOST") - 3000;514
515 DISPLAY EGYRES,UBAR;

GAMS 1.0 WORLD ALUMINUM MODEL DATA AND MODEL DEFINITION 04/19/83 09.52.52. PAGE 12INFRASTRUCTURE AND INVESTMENT COSTS
517 SET RHIGH(R) REFINERY LOCATIONS WITH HIGH LEVEL INFRASTRUCTURE518519 RMID(R) REFINERY LOCATIONS WITH MEDIUM LEVEL INFRASTRUCTURE520521 RLOW(R) REFINERY LOCATIONS WITH LOW LEVEL INFRASTRUCTURE522523 IHIGH(I) MINE LOCATIONS WITH HIGH LEVEL INFRASTRUCTURE524525 IMID(I) MINE LOCATIONS WITH MEDIUM LEVEL INFRASTRUCTURE526527 ILOW(I) MINE LOCATIONS-WITH LOW LEVEL INFRASTRUCTURE528529 ICC COLUMN LABELS FOR INVESTMENT COST DATA TABLES / FIX-COST, PROP-COST, SCALE , OMEGAHAT /530531 SIN1 COST LEVEL ESCALATORS FOR INVESTMENT AT LOCATIONS / HIGH, MID, LOW /532533 SIN2 COST LEVEL ESCALATION MAP FOR REFINERY LOCATION534535 SIN3 COST LEVEL ESCALATION MAP FOR MINE LOCATIONS;536537538 RHIGH(R)$GR('N-AMERICA",R) - YES; RHIGH(R)$GR("WEST-EUR",R) - YES;539540 RLOW(R)$GR("AFRICA",R) - YES; RLOW("ASIAN-USSR") - YES; RLOW("N-AFRICA") NO ; RLOW("S-AFRICA") - NO;541542 RMID(R) - YES$(NOT RHIGH(R))$(NOT RLOW(R)) ;543 4,
544 SIN2(RHIGH,"HIGH") = YES; SIN2(RMID,"MID") = YES; SIN2(RLOW,"LOW") = YES;545546 DISPLAY RHIGH,RMID,RLOW;547548 SCALAR LIFE FINANCIAL LIFE TIME OF PRODUCTIVE UNIT (YEARS)549 RHO RISKLESS DISCOUNT RATE550 SIGMA CAPITAL RECOVERY FACTOR551552 PARAMETER OMEGAM(I,SEG) FIXED PORTION OF INVESTMENT COST: MINES (US$ MILLION PER 1000 TPY)553 OMEGAR(M,SEG,R) FIXED PORTION OF INVESTMENT COSTS: REFINERIES AND SMELTERS (US$ MILLION PER 1000 TPY)554 SBM(I,SEG) PLANT SIZE AT SEGMENTS: MINES (1000 TPY)555 SBR(M,SEG,R) PLANT SIZE AT SEGMENTS: REFINERIES AND SMELTERS (1000 TPY)556 IEM(I) MISCELLANEOUS INVESTMENT COSTS: MINES557 IER(R) MISCELLANEOUS INVESTMENT COSTS: REFINERIES AND SMELTERS;558559 * TO COMPENSATE FOR DIFFERENCES IN EXISTING INFRASTRUCTURE THE PARAMETER INFAC, BELOW, IS SET TO RAISE560 * THE EFFECTIVE INVESTMENT COSTS FOR CERTAIN GROUPINGS.561562 PARAMETER INFAC(R) INACCESS AND INFRASTRUCTURE FACTOR FOR REFINERIES AND SMELTERS563564 INFAC(RHIGH) - 1.0565 INFAC(RMID) 1.1566 INFAC(RLOW) - 1.25567568

GAMS 1.0 WORLD ALUMINUM MODEL DATA AND MODEL DEFINITION 04/19/83 09.52.52. PAGE 13INFRASTRUCTURE AND INVESTMENT COSTS
569 PARAMETER INFMI(I) FACTOR FOR MINE CAPITAL COSTS /570571 (USA,EE+USSR,W-EUROPE,CHINA) 1.0572 (JAMAICA1,JAMAICA2,RAITI+DR,N-AUSTRAL,W-AUSTRAL,GBANA,GUYANA,SURINAM,BRAZIL,573 VENEZUELA,INDIA,INDONESIA,O-ASIA,AYEK-GUIN,FRIA-GUIN,S-LEONE) 1.1574 (CAMER+OA,TOUG-GUIN) 1.25 /;575576 * THE FOLLOWING SCALARS ARE USED TEMPORARILY DUE TO A PROBLEM IN GAMS.577578 SCALAR ONE1 / 1.05 /, ONE2 / 1.1 /;579580 IHIGH(I) - YES$(INFMI(I) LE ONEI);581 IMID(I) - YES$(INFMI(I) EQ ONE2);582 ILOW(I) - YES$(INFMI(I) GT ONE2);583 SIN3(IHIGH,"HIGH") - YES; SIN3(IMID,"MID") = YES; SIN3(ILOW,'LOW") YES;584585 *INVESTMENT COSTS586587 RHO - .1;588589 LIFE - 20;590591 SIGMA - RHO*(l+RHO)**LIFE/((l+RHO)**LIFE-1);592593 DISPLAY RHO, LIFE, SIGMA;594 o595 * MINING PRODUCTIVE UNIT OUTPUTS ARE IN TONS OF BAUXITE596597 TABLE INV(*,ICC) INVESTMENT COSTS AND ECONOMIES OF SCALE598599 FIX-COST PROP-COST SCALE600 * (US$MILL) (US$MILL/lOOOTPY) 1000 TPY601602 MINING 30.0 .0275 16000603 REFINERYT 330 0.72 2000604 REFINERYTH 350 0.76 2000605 REFINERYM 370 0.81 2000606 REFINERYSS 412 0.90 2000607 SMELTER 100 2.4 200
NEW MARGIN - 002-072609 TABLE IP(SIN1,*)610 PROP HDS-S HDS-R MAX-S MAX-R HDS-I MAX-I HDS: DISECONOMIES OF SCALE SIZE611 HIGH 1.2 10 5 20 10 4 6 MAX: MAXIMUM SIZE612 MID 1.2 4 2 15 4 3 5 S : SMELTERS R: REFINERIES613 LOW 1.2 2 2 10 3 2 4 I :MINES
NEW MARGIN - 002-120615616 INV(M,"OMEGAHAT") - INV(M,"FIX-COST") + INV(M,"PROP-COST")*INV(M,"SCALE");617 INV("MINING"-,OMEGAHAT") - INV("MINING",nFIX-COST") + INV("MINING","PROP-COST")*INV("MINING",nSCALE");618619 OMEGAR(M,-l",R) - INV(M,CFIX-COST")*INFAC(R);620 OMEGAR(M,"2",R) - INV(M,"OMEGAHAT")*INFAC(R);

GAMS 1.0 WORLD ALUMINUM MODEL DATA AND MODEL DEFINITION 04/19/83 09.52.52. PAGE 14INFRASTRUCTURE AND INVESTMENT COSTS
621 OMEGAR(MR,"3",R) = SUM(SIN1$SIN2(R,SINI), OMEGAR(MR,"2",R)*IP(SIN1,"HDS-R"));622 OMEGAR(MS,"3",R) = SUM(SIN1$SIN2(R,SINl), OMEGAR(MS,"2",R)*IP(SIN1,"HDS-S"));623 OMEGAR(MR,"4",R) = SUM(SINl$SIN2(R,SINl), OMEGAR(MR,"2",R)*IP(SINI,"MAX-R")*IP(SINI,"PROP"));624 OMEGAR(MS,"4",R) = SUM(SINI$SIN2(R,SINl), OMEGAR(MS,"2"R)*IP(SIN1'"MAX-S")*IP(SIN1I"PROP"));625626 SBR(M,"1",R) = 0;627 SBR(M,"2",R) = INV(M,'SCALE");628 SBR(MR,3",R) - SUM(SIN1$SIN2(R,SIN1), SBR(MR,"2",R)*IP(SIN1"HDS-R"));629 SBR(MS,"3",R) = SUM(SIN1$SIN2(R,SINl), SBR(MS,"2 ,R)*IP(SIN1,"HDS-S"));630 SBR(MR,-4",R) = SUM(SIN1$SIN2(R,SIN1), SBR(MR,"2",R)*IP(SIN17"MAX-R"));631 SBR(MS,"4",R) = SUM(SINI$SIN2(R,SINl), SBR(MS,"2"R)*IP(SIN1,"MAX-S"));632633 IEM(I) - SUM(CM, INFMI(I)*SRATIO(I,CM));634 OMEGAM(I,"1") = INV("MINING","FIX-COST")*IEM(I);635 OMEGAM(I,"2") = INV("MINING-",OMEGAHAT")*IEM(I);636 OMEGAM(I,-3") = SUM(SIN1$SIN3(I,SINl), OMECAM(I,(2")*IP(SIN1V"HDS-I"));637 OMEGAH(I,"4") = SUM(SINI$SIN3(I,SINI), OMEGAM(I,"2")*IP(SIN1"MAX-I")*IP(SINI,"PROP"));638639 SBM(l,"l') = 0;
640 SBM(I2") = INV("MINING","SCALE");641 SBM(I"3") = SUM(SIN1$SIN3(I,SIN1), SBM(Il"2")*IP(SIN1,"HDS-I'));642 SBM(I,"4") = SUM(SIN1$SIN3(I,SINI), SBM(I,"2")*IP(SIN1,"MAX-I"));643644 DISPLAY INV,INFAC,INFMI,IEM,IP,OMEGAR,OMECAM,SBR,SBM;
C

GAMS 1.0 WORLD ALUMINUM MODEL DATA AND MODEL DEFINITION 04/19/83 09.52.52. PAGE 15OPERATING COSTS
646 SET MCC COLUMN LABELS FOR MINE OPERATING COSTS DATA / WDRYING, NODRYING/647648 PARAMETER OBR(I,CM) OVERBURDEN RATIO649 MDATA(I,*) MINE COST DATA;650651 ** TEMPORARY**652 SCALAR STRI /1.5/, STR2 /1.37/, STR3 /1.22/653 **654655 OBR(I,CM)$SRATIO(I,CM) = 1;656 OBR(I,CM)$(SRATIO(I,CM) EQ STRI) - 4;657 OBR(I,CM)$(SRATIO(I,CM) EQ STRZ) = 3;658 OBR(I,CM)$(SRATIO(I,CM) EQ STR3) = 2;
NEW MARGIN - 002-090660 MDATA(I,"LMM") = .3; LABOR FOR MAINTENANCE661 MDATA(I,"LMM")$FI("LDCS",I) = .4; & MINING: M-HR/TON662 MDATA(I,"LSTRIP") = SUM(CM$OBR(I,CM), MDATA(I,"LMM")*0.33*OBR(I,CM));663 MDATA(I,"LDRY") = .1; LABOR FOR DRYING664 MDATA(I,"LDRY")$FI("LDCS",I) = .2; M-HR/TON665 MDATA(I,"L-M+DRY") = MDATA(I,"LMM") + MDATA(I,"LDRY");666667 MDATA(I,"WAGE") = 11; WAGES: US$/M-HR668 MDATA(I,"WAGE")$GI("S-AMER+CAR",I) = 6;669 MDATA(I,"WAGE")$GI("AFRICA",I) - 5;670 MDATA(I,"WAGE")$GI("ASIA-X",I) = 2;671 MDATA(I,"WAGE")$GI("EE+USSR",I) = 4;672673 MDATA(I,"FDRY") = 2.4; DRYING FUEL: US-GAL/TON674 MDATA("N-AUSTRAL","FDRY^) = 0 ; BECAUSE OF SOLAR DRYING675 MDATA("W-AUSTRAL","FDRY") = 0 ; DUE TO LOW BAUXITE CONTENT676677 MDATA(I,"FCOST")$MDATA(I,"FDRY") = .8; FUEL COST: US$/US-GAL678 MDATA(I,"MF+LUB") - 1.2; LUBRICANT COST: US$679680 MDATA(I,"OTHER") = 3.5; MISCELLANEOUS COST681 DISPLAY SRATIO,OBR,MDATA;
NEW MARGIN - 002-120683 PARAMETER ORS(R,P) OPERATING COSTS AT REFINERIES AND SMELTERS (US$ PER TON)684 MLC(I) LABOR COST AT MINES (US$ PER TON)685 MFC(I,MCC) FUEL COST AT MINES (US$ PER TON)686 OM(I) OPERATING COST AT MINES (US$ PER TON)687688689 ORSWL(CMI) REFINERIES AND SMELTER OPERATING COST EXCLUDING LABOR /690691 SODA-ASH 170 , FUEL-LUB 1 , THERM-EGY 7.5, ENERGY 4.5, PITCH 250692 OTHER 1 , LIME 40 , COKE 675 , FLUORIDES .8 /693694 ORSL(R) REFINERY AND SMELTER LABOR COST D(US$ PER MAN-HR) /695696 (WESTERN-US, EASTERN-US, WEST-CAN, EAST-CAN, W-AUSTRAL, OCEANIA, MID-EAST697 JAPAN, ARGENTINA, W-EUROPE) 11

GAMS 1.0 WORLD ALUMINUM MODEL DATA AND MODEL DEFINITION 04/19/83 09.52.52. PAGE 16
OPERATING COSTS
698 (SURINAM, BRAZIL, VENEZUELA, C-AMER+CAR, S-AFRICA, ZAIRE, GHANA, AYEK-GUIN
699 gEST-GUIN, GUYANA, E-EUROPE, JAMAICA, ASIAN-USSR, REST-AFRIC) 5
700 (KOREA+OEA, N-AFRICA, INDIA, CHINA, ASEAN, REST-ASIA) 3
701702 COSTRS(R,CMI) COST DATA FOR UNIT INPUT AT REFINERIES AND SMELTERS;
703704 COSTRS(R,CMI) - ORSWL(CMI);
705 COSTRS(R,"LABOR")-- ORSL(R);
706
707708 * REFINERY AND SMELTER OPERATING COSTS.
709710 ORS(R,P) SUM(CMI, ABS( A(CMI,P) * COSTRS(R,CMI) ) );711
712 DISPLAY COSTRS,ORS;
713
714 * MIN COSTS COMPUTATION:715 * STEP 1: LABOR COSTS
716 * STEP 2: FUEL COSTS
717 * STEP 3: OPERATING COSTS FOR LOCATIONS WITH DRYING COSTS
718 * STEP 4: OPERATING COSTS FOR LOCATIONS WITHOUT DRYING COSTS
719 * STEP 5: SPECIAL CASES
720721 * STEP 1.722723 MLC(I) = (MDATA(I,"L-M+DRY") + MDATA(I,"LSTRIP"))*MDATA(I,"WAGE"); °
724725 * STEP 2.726727 MFC(I,"NODRYING")$(MDATA(I,"FDRY") LE 0) 5 MDATA(I,"MF+LUB");
728729 MFC(I,"WDRYING")$(MDATA(I,"FDRY") GT 0) = MDATA(I,"FDRY")*MDATA(I,"FCOST") + MDATA(I,"MF+LUB");
730731 * STEP 3.
732
733 OM(I)$(MDATA(I,"FDRY") GT 0) MLC(I) + MFC(I,"WDRYING") + MDATA(I,"OTHER");
734735 * STEP 4.
736737 OM(I)$(MDATA(I,"FDRY") LE 0) = MLC(I) + MFC(I,"NODRYING") + MDATA(I,"OTHER");
738739740 DISPLAY ORS,OM;

GAMS 1.0 WORLD ALUMINUM MODEL DATA AND MODEL DEFINITION 04/19/83 09.52.52. PAGE 17TRANSPORT DESCRIPTION
742 * THIS SECTION DESCRIBES THE TRANSPORT STRUCTURE OF THE MODEL. THE PORT SETS ARE DEFINED FIRST, FOLLOWED BY743 * THE SET OF "LAND" TRANSPORT MODES THAT EXIST BETWEEN THE MINES AND THE PORTS. THEN LAND DISTANCES AND SEA744 * DISTANCES BETWEEN MINES AND PORTS, AND BETWEEN PORTS, RESPECTIVELY, ARE DEFINED. THE ASSUMPTION IS THAT745 * ONLY MINES MIGHT BE LOCATED AWAY FROM PORTS, AND THAT ALL REFINERIES, SMELTERS, AND MARKET CENTERS ARE746 * EITHER LOCATED NEXT TO PORTS OR ARE PORTS THEMSELVES.747748 PARAMETER MUR(I,R) TRANSPORT COST (US$ PER TON)749 MURS(I,R) TRANSPORT COST (US$ PER TON): SEA750 MURL(I) TRANSPORT COST (US$ PER TON): LAND751 MUI(R,RP) TRANSPORT COST (US$ PER TON): INTERPLANT752 MUF(R,J) TRANSPORT COST (0S$ PER TON): FINAL753754 SET N PORTS /755756 ACCRA, ALBAHRAYN, ALEXANDRIA, ANTALYA, BANANA, BELAWAN, BELEM, BOMBAY757 BUNBURY, CIUDAD-GUY, CONAKRY, DOUALA, FREETOWN, ITEA, KAMSAR, KAOHSIUN758 LENINGRAD, LINDEN, MIRAGOANE, MOBILE, NACALA, NEW-YORK, PANAMA, PARAMARIB759 PERTH, PONTIANAK, PORTLAND, P-ALFRED, P-JOHORE, P-MADRYN, P-RHOADES, RICH-BAY760 RIO-DE-JAN, ROTTERDAM, SHANGHAI, SYDNEY, TOKYO, VALPARAISO, VANCOUVER, VERACRUZ761 VISHAKAP, VLADIVSTK, WEIPA /762763 NL(N) LARGE PORTS764765 NS(N) SMALL PORTS / LINDEN, PARAMARIB, VISHAKAP, DOUALA, ITEA, FREETOWN, P-JOHORE, PERTH /766767 MODES MODES OF TRANSPORTATION BETWEEN MINES AND PORTS768 RAIL , ROAD , RIVER-SHAL , RIVER-DEEP , CONVEYOR /769770 COTC COMMODITIES FOR OCEAN TRANSPORT COST DETERMINATION / BAUXITE, ALUMINA, ALUMINUM /771772 FREIGHT FREIGHT CATEGORIES /773 F ALUMINUIM FREIGHT CARRIER774 FNL OBO CARRIERS - 60000 DWT775 FNS BAUXITE CARRIERS - 25000 DWT /776777 COTCF(COTC) FREIGHT COMMODITIES WITH BILEVEL FREIGHT CHARGES / BAUXITE, ALUMINA /778779780 * THE FOLLOWING SETS PROVIDE THE VARIOUS MAPPINGS BETWEEN PORTS AND MINES, REFINERIES, SMELTERS AND MARKETS.781782783 IN(I,N) MINES TO PORTS MAP /784785 USA.MOBILE, JAMAICA1.P-RHOADES, JAMAICA2.P-RHOADES, HAITI+DR.MIRAGOANE786 GUYANA.LINDEN, SURINAM.PARAMARIB, BRAZIL.BELEM, VENEZUELA.CIUDAD-GUY787 W-EUROPE.ITEA, EE+USSR.LENINGRAD, N-AUSTRAL.WEIPA, W-AUSTRAL.BUNBURY788 INDIA.VISHAKAP, INDONESIA.PONTIANAK, CHINA.SHANGHAI, O-ASIA.P-JOHORE789 GHANA.ACCRA, AYEK-GUIN.KAMSAR, FRIA-GUIN.CONAKRY, TOUG-GUIN.CONAKRY790 S-LEONE.FREETOWN, CAMER+OA.DOUALA /791792793 RN(R,N) PRODUCTION LOCATIONS TO PORTS MAP /

GAM4S 1.0 WORLD ALUMINUM MODEL DATA AND MODEL DEFINITION 04/19/83 09.52.52. PAGE 18
TRANSPORT DESCRIPTION
794
795 GUYANA.LINDEN, SURINAM.PARAMARIB, BRAZIL.BELEM, VENEZUELA.CIUDAD-GUY
796 W-EUROPE.ROTTERDAM, E-EUROPE.LENINGRAD, W-AUSTRAL.BUNBURY, INDIA.VISHAKAP
797 CHINA.SHANGHAI, GHANA.ACCRA, AYEg-GUIN.KAMSAR, WESTERN-US.PORTLAND
798 EASTERN-US.MOBILE, WEST-CAN.VANCOUVER, EAST-CAN.P-ALFRED, JAMAICA.P-RHOADES
799 C-AMER+CAR.VERACRUZ, ARGENTINA.P-MADRYN, ASIAN-USSR.VLADIVSTK, OCEANIA.WEIPA
800 ASEAN.BELAWAN, KOREA+OEA.KAOHSIUN, JAPAN.TOKYO, REST-ASIA.ANTALYA
801 MID-EAST.ALBAHRAYN, N-AFRICA.ALEXANDRIA, REST-GUIN.CONAKRY, ZAIRE. BANANA
802 REST-AFRIC.NACALA, S-AFRICA.RICH-BAY /803
804
805 JN(J,N) MARKETS TO PORTS MAP /806
807 W-EUROPE.ROTTERDAM, EE+USSR.LENINGRAD, CHINA. SHANGHAI, C-AMER+CAR.PANAMA
808 OCEANIA. SYDNEY, ASEAN. BELAWAN, KOREA+OEA.KAOHSIUN, JAPAN.TOKYO
809 REST-ASIA.BOMBAY, MID-EAST.ALBAHRAYN, N-AFRICA.ALEXANDRIA, S-AFRICA.RICH-BAY
810 WN-AMERICA.PORTLAND, EN-AMERICA.NEW-YORK, WS-AMERICA.VALPARAISO, ES-AMERICA.RIO-DE-JAN
811 W-AFRICA.DOUALA, E-AFRICA.NACALA /;
812
813 NL(N) = YES$(NOT NS(N));814 ALIAS (N,NP);
815 DISPLAY N,NS,NL,MODES,RP;816817
818 TABLE DMP(I,MODES) DISTANCES IN MILES FROM MINE TO PORT BY MODE
819
820 RAIL ROAD RIVER-SHAL RIVER-DEEP CONVEYOR
821
822 USA 174
823 JAMAICAl 4
824 JAMAICA2 4
825 HAITI+DR 4
826 GUYANA 140
827 SURINAM 50 200
828 BRAZIL 14 690
829 VENEZUELA 20 250
830 W-EUROPE 20
831 EE+USSR 30832 N-AUSTRAL 24
833 W-AUSTRAL 30
834 INDIA 100
835 INDONESIA 80836 CHINA 170
837 O-ASIA 20
838 GHANA 50839 AYEK-GUIN 75
840 FRIA-GUIN 75
841 TOUG-GUIN 200
842 S-LEONE 34
843 CAMER+OA 350844845

GAMS 1.0 WORLD ALUMINUM MODEL DATA AND MODEL DEFINITION 04/19/83 09.52.52. PAGE 19TRANSPORT DESCRIPTION
846 PARAMETER MPC(MODES) TRANSPORT COST PER TON PER MILE FROM I TO N / RAIL .05 , ROAD .4 , RIVER-SHAL .016847 RIVER-DEEP .006, CONVEYOR .03 /848849850 TABLE OTC(COTC,*) OCEAN TRANSPORT COST851852 FIXED F FNL FNS853 * (1980 US$ (1980 US$ PER METRIC TON854 * PER METRIC PER NAUTICAL MILE)855 * TON)856857 BAUXITE 3.5 .0024 .0036858 ALUMINA 3.5 .00288 .00432859 ALUMINUM 4.0 .01860

GAMS 1.0 WORLD ALUMINUM MODEL DATA AND MODEL DEFINITION 04/19/83 09.52.52. PAGE 20
TRANSPORT DESCRIPTION
862863 TABLE SD(N,NP) SEA DISTANCES (NAUTICAL MILES)864865 ACCRA ALBAHRAYN ALEXANDRIA ANTALYA BANANA BELAWAN BELEM BOMBAY BUNBURY CIUDAD-GUY CONAKRY DOUALA FREETOWN
866867 ALBAHRAYN 9590868 ALEXANDRIA 6622 3296869 ANTALYA 4283 3478 349870 BANANA 1067 7181 7755 8426871 BELAWAN 6832 3598 4733 3243 6821872 BELEM 4271 8360 5107 5107 6592 9659873 BOMBAY 6832 1700 3213 3394 6821 2154 9565874 BUNBURY 7374 5270 6460 6658 4600 9700 10688 4156875 CIUDAD-GUY 3951 9696 6400 6400 5594 10034 1222 9784 10347876 CONAKRY 1036 6800 3950 4576 2468 3080 2500 7900 8000 3050877 DOUALA 671 7389 5649 6514 742 3674 4226 7102 6200 4600 1726878 FREETOWN 955 7041 4073 3818 2070 8401 2600 7787 7900 2996 100 1626
879 ITEA 3457 3895 600 500 5596 5644 4279 3648 7009 4397 4750 6249 4673
880 KAMSAR 1130 6866 3898 4476 2245 8656 3316 7962 8050 2996 80 1600 175
881 KAOHSIUN 10866 7389 7589 8426 11530 3035 10958 4848 4600 10059 11550 6710 11437
882 LENINGRAD 5123 7550 4582 4342 6214 10766 5243 5959 10361 7521 5265 6991 5365
883 LINDEN 4170 10968 5180 5180 7250 10998 896 9623 11570 419 3396 5122 3496
884 MIRAGOANE 4622 8295 5327 5000 8204 8518 1866 10665 9200 681 3000 5293 3667
885 MOBILE 5616 9776 6438 6317 9685 9208 3124 11667 10814 1963 4700 5997 4710
886 NACALA 4565 8226 3935 4981 3125 5372 6765 3461 11425 7391 5560 4785 5520 H
887 NEW-YORK 6213 8251 5119 4998 9025 10504 2975 11398 11570 1939 5200 6723 5383
888 PANAMA 5016 9754 6294 6173 8712 9370 2757 9343 9444 1539 4200 5860 4234
889 PARAMARIB 4397 11113 7860 5097 7339 9474 747 9407 9400 646 5450 7540 5500
890 PERTH 7374 6067 6486 6656 5550 2573 9221 3986 76 8976 8032 7293 7977891 PONTIANAK 7865 3316 4852 5000 7515 800 11351 2109 2000 10885 8900 8205 8889
892 PORTLAND 9920 13267 10163 10040 11018 7509 6307 7509 8850 5408 8950 11269 8953
893 P-ALFRED 6552 8358 5390 4981 9364 12292 3680 11737 11425 2644 5560 7062 5600
894 P-JOHORE 7199 3652 5100 5446 7188 368 10026 2441 2473 10401 8900 8085 8769
895 P-MADRYN 4351 8660 7112 7102 6689 8996 3274 8300 8951 4551 3780 4524 3712
896 P-RHOADES 4785 8276 5998 5097 8823 9964 2159 10875 9400 1103 5450 6328 3830
897 RICH-BAY 2619 4957 5504 6000 795 5291 4368 4597 4755 5594 3300 2432 3190898 RIO-DE-JAN 3200 8280 8827 6062 5547 10232 2174 7920 8078 3400 2640 4239 2613899 ROTTERDAM 3628 6541 3245 3243 5163 8142 4214 6415 9700 4231 3080 5009 3127900 SHANGHAI 10405 5859 7307 8244 9395 2574 11237 4648 4100 10338 10800 6249 10976
901 SYDNEY 8859 7874 9322 8654 8852 4593 9761 6023 2100 9213 9900 8264 9614
902 TOKYO 7647 6551 8081 8252 10087 4548 10555 4538 4410 9231 11668 10974 11768
903 VALPARAISO 6870 10651 8910 8789 7918 9710 6142 10674 7705 4155 6160 8476 6850
904 VANCOUVER 7514 13630 10698 10160 11177 7445 6470 12292 9270 5571 9100 11203 9107
905 VERACRUZ 5838 9891 6923 6661 9800 12167 3925 12261 11294 2519 4900 6510 4883
906 VISHAKAP 7271 3813 5170 4931 7370 1281 10119 1670 3600 10576 8322 7472 8230907 VLADIVSTK 11202 6656 8307 9214 11664 3371 11072 5445 5050 9879 11900 10950 11773
908 WEIPA 9473 6120 7664 7846 3500 2836 10920 4849 2713 10139 11817 11000 11900
909910911912913

GAMS 1.0 WORLD ALUMINUM MODEL DATA AND MODEL DEFINITION 04/19/83 09.52.52. PAGE 21TRANSPORT DESCRIPTION
914 + ITEA KAMSAR KAOHSIUN LENINGRAD LINDEN MIRAGOANE MOBILE NACALA NEW-YORK PANAMA PARAMARIB PERTH PONTIANAK915916 KAMSAR 3650917 KAOHSIUN 8680 11612918 LENINGRAD 3469 3993 12410919 LINDEN 4352 3215 10078 5199920 MIRAGOANE 6284 3287 9366 4544 1057921 MOBILE 5930 4661 10579 6103 2404 2770922 NACALA 4396 5162 6449 4923 7061 7504 9038923 NEW-YORK 4185 5142 10528 4428 2217 1489 1874 8361924 PANAMA 6773 5939 8510 6080 1558 776 1413 9991 2018925 PARAMARIB 4269 3442 10211 5108 215 1272 2691 7445 2334 1691926 PERTH 7086 8132 4600 12095 9192 10263 10814 4300 11849 9487 9407927 PONTIANAK 5919 8542 3130 9804 10687 11401 11900 3709 10505 10625 10604 2811928 PORTLAND 9214 8953 5156 9763 5427 4715 5405 9891 5887 3869 5560 8894 6028929 P-ALFRED 4155 5481 11724 4362 3077 2579 2991 8464 1460 3204 3150 11425 10572930 P-JOHORE 5799 9023 2668 9704 9990 11281 11540 4080 10871 10505 9841 2391 420931 P-MADRYN 6700 2993 10158 7957 3954 5140 6645 6033 5871 5491 3813 8111 9699932 P-RHOADES 4885 3830 9114 5360 1334 430 1108 8539 1474 594 1549 10081 11220933 RICH-BAY 6079 3365 9306 7420 5026 5948 7461 1797 6801 8194 5980 4755 6100934 RIO-DE-JAN 6602 2613 11309 6806 2853 4367 5133 5653 4770 4484 2713 8034 9266935 ROTTERDAM 2417 2980 11052 1102 4097 4039 4850 6604 3376 4842 4056 9731 8097936 SHANGHAI 8498 11151 369 11643 10357 9645 10061 6249 10584 8648 10490 4000 2075937 SYDNEY 8908 9989 5178 13926 9192 8520 9210 6400 9692 7674 10735 2157 4600938 TOKYO 8506 8777 838 12603 9059 8538 9105 6931 9700 7692 9274 4340 2767939 VALPARAISO 9389 6163 10500 8510 4174 3392 4026 8015 4634 2616 4307 7748 10903940 VANCOUVER 9334 9107 5100 9926 5590 4878 5568 11158 6050 4032 5723 9265 5960941 VERACRUZ 5835 4883 9983 6140 2429 2239 2876 9100 1989 1463 2578 10950 12388942 VISHAKAP 5625 8401 4314 9752 10415 10980 12661 2706 8673 11805 11266 3600 1700943 VLADIVSTK 9468 11948 726 13197 9315 9480 10693 7076 9775 7757 10325 5022 2872944 WEIPA 8199 11900 3500 12172 10618 10160 10013 6548 10618 8600 10291 2600 2000945946 + PORTLAND P-ALFRED P-JOHORE P-MADRYN P-RHOADES RICH-BAY RIO-DE-JAN ROTTERDAM SHANGHAI SYDNEY TOKYO947948 P-ALFRED 7073949 P-JOHORE 7142 12659950 P-MADRYN 8471 6455 8996951 P-RHOADES 4463 2744 11242 5224952 RICH-BAY 7561 7134 5658 3720 7586953 RIO-DE-JAN 8353 5354 8846 1151 4194 3323954 ROTTERDAM 8711 3310 8509 6358 4308 6505 5300955 SHANGHAI 5445 11852 2207 12267 9393 9585 11109 10591956 SYDNEY 6737 10878 4222 6810 8268 6624 9455 12516 4636957 TOKYO 4328 10896 2899 10697 8286 8478 11513 10768 1117 4330958 VALPARAISO 5764 5820 10483 2852 3120 6050 3670 7458 10148 6294 9280959 VANCOUVER 371 7236 7078 8100 4626 7932 9797 8874 5379 7108 4272960 VERACRUZ 5332 3540 11968 6375 1210 7576 4079 5088 9463 8157 9155961 VISHAKAP 10726 12230 1300 9203 11354 5040 8363 10793 3856 5760 4199962 VLADIVSTK 4278 12568 3004 12338 9228 8457 11780 12599 998 5105 962963 WEIPA 6294 11804 2468 8611 10291 7217 9605 10805 3000 1900 3500964965

GAMS 1.0 WORLD ALUMINUM MODEL DATA AND MODEL DEFINITION 04/19/83 09.52.52. PAGE 22TRANSPORT DESCRIPTION
966 + VALPARAISO VANCOUVER VERACRUZ VISHAKAP VLADIVSTK967968 VANCOUVER 6135969 VERACRUZ 4079 5495970 VISHAKAP 10734 10813 9736971 VLADIVSTK 9606 4396 10097 4304972 WEIPA 8165 6614 10064 3970 4150973 ;974975976 PARAMETER SEACOST(N,NP,COTC) PORT TO PORT TRANSPORT COST (US$ PER TON)977 FCP(N,NP,COTC,FREIGHT) FREIGHT CHARGE POSSIBILITIES;978979 SD(N,NP) - MAX(SD(N,NP),SD(NP,N));980981 *NOTE:982 * THIS CONSTRUCTION MAY CAUSE PROBLEMS OF DOUBLE COUNTING OR ZERO DISTANCES. THIS IS THE RESULT OF THE FORMAT OF983 * THE DISTANCE MATRIX: WHICH IS A LOWER TRIANGULAR MATRIX PLUS AN IRREGULAR BLOCK984985986 * SET ALLOWED COMBINATIONS OF FCP TO 1 AS FOLLOWS:987988 * FOR ALUMINUM SHIPMENTS, THE FREIGHT CHARGE IS INCURRED IF SEA DISTANCES EXIST BETWEEN ANY TWO PORTS.989 H
990 FCP(N,NP,"ALUMINUM","F")$SD(N,NP) = 1; H
991992993 * BAUXITE AND ALUMINA INCUR LOWER FREIGHT CHARGE LEVELS IF THE TWO994 * PORTS ARE LARGE PORTS - TRANSPORTING BY OBO CARRIERS OF 60,000 DWT.995996 FCP(N,NP,COTCF,-FNL")$(NL(N)$NL(NP)$SD(N,NP)) - 1;997998999 * BAUXITE AND ALUMINA INCUR THE HIGHER FREIGHT CHARGE LEVELS IF AT LEAST
1000 * ONE PORT IS A SMALL PORT - TRANSPORTING BY BAUXITE CARRIERS OF 25,000 DWT.10011002 FCP(N,NP,COTCF,"FNS")$((NOT(NL(N)*NL(NP)))$SD(N,NP)) = 1;100310041005 SEACOST(N,NP,COTC)$SD(N,NP) =
1006 OTC(COTC,"FIXED") + SUM(FREIGHT$(FCP(N,NP,COTC,FREIGHT) NE 0), OTC(COTC,FREIGHT)*SD(N,NP));10071008 * MURS(I,I) - SUM((N,NP)$(IN(I,N)*RN(I,NP)),SEACOST(N,NP,"BAUXITE") );1009 * MUI(I,IP) - SUM((N,NP)$(RN(I,N)*RN(IP,NP)),SEACOST(N,NP,"ALUMINA") );1010 * MUF(I,J) - SUM((N,NP)$(JN(J,N)*RN(I,NP)),SEACOST(N,NP,"ALUMINUM") );1011 *NOTE:1012 * THE ASSIGNMENTS WRITTEN THIS WAY TAKE TOO MUCH TIME TO EXECUTE. UNTIL FURTHER IMPROVEMENTS IN GAMS WE USE THE1013 * FOLLOWING FORMULATION USING SOME EXTRA PARAMETERS.10141015 PARAMETER MURSX INTERMEDIATE TRANSPORT COST CALCULATIONS: BAUXITE1016 MUIX INTERMEDIATE TRANSPORT COST CALCULATIONS: ALUMINA1017 MUFX INTERMEDIATE TRANSPORT COST CALCULATIONS: ALUMINUM;
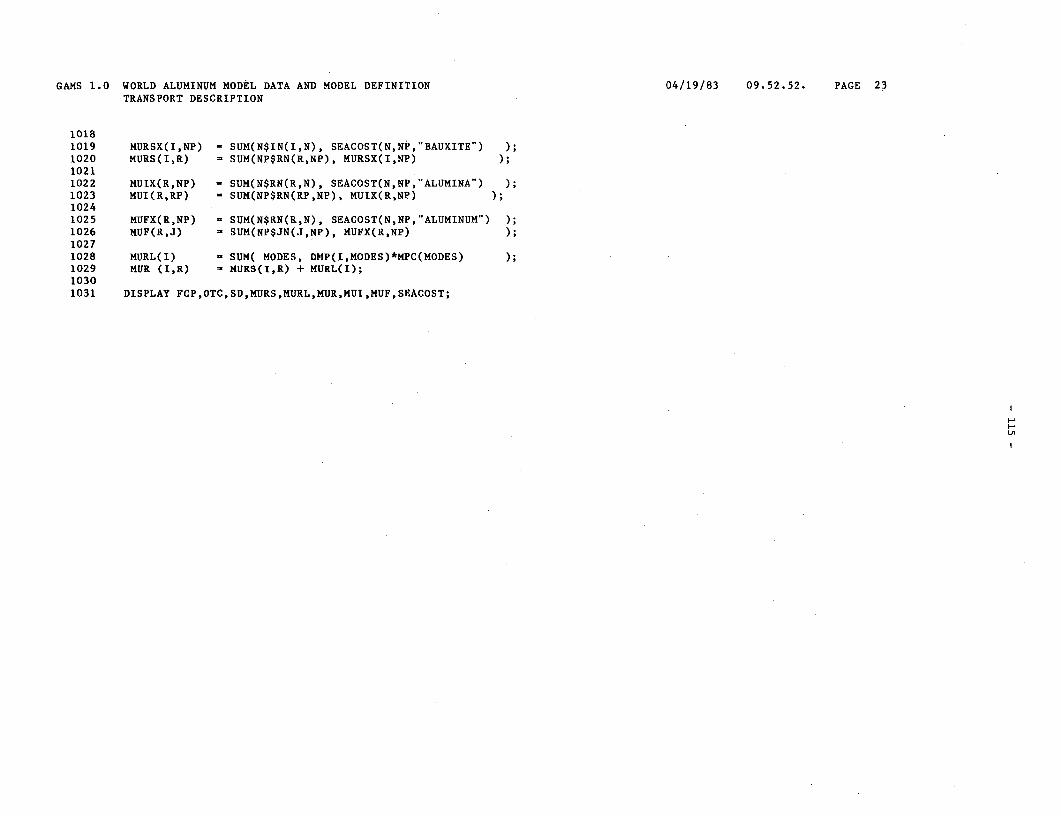
GAMS 1.0 WORLD ALUMINUM MODEL DATA AND MODEL DEFINITION 04/19/83 09.52.52. PAGE 23TRANSPORT DESCRIPTION
10181019 MURSX(I,NP) - SUM(N$IN(I,N), SEACOST(N,NP,"BAUXITE') );1020 MURS(I,R) = SUM(NP$RN(R,NP), MURSX(I,NP)10211022 MUIX(R,NP) - SUM(N$RN(R,N), SEACOST(N,NP,"ALUMINA") );1023 MUI(R,RP) - SUM(NP$RN(RP,NP), MUIX(R,NP)10241025 MUFX(R,NP) = SUM(N$RN(R,N), SEACOST(N,NP,"ALUMINUM") );1026 MUF(R,J) - SUM(NP$JN(J,NP), MUFX(R,NP)10271028 MURL(I) - SUM( MODES, DMP(I,MODES)*MPC(MODES)1029 MUR (I,R) - MURS(I,R) + MURL(I);10301031 DISPLAY FCP,OTC,SD,MURS,MURL,MUR,MUI,MUF,SEACOST;
In

GAMS 1.0 WORLD ALUMINUM MODEL DATA AND MODEL DEFINITION 04/19/83 09.52.52. PAGE 24PRICES, TARIFFS AND LEVIES
1033 * DEFINE MAPPINGS FOR LEVIES10341035 SET NIR(I,R) REGIONAL CLUSTERS HAVING NO LEVIES FROM I TO R /10361037 USA.(WESTERN-US,EASTERN-US)1038 (JAMAICAI,JAMAICA2).JAMAICA1039 GUYANA. GUYANA1040 SURINAM.SURINAM1041 BRAZIL.BRAZIL1042 VENEZUELA.VENEZUELA1043 W-EUROPE.W-EUROPE1044 EE+USSR.(E-EUROPE,ASIAN-USSR)1045 (N-AUSTRAL,W-AUSTRAL).(OCEANIA,W-AUSTRAL)1046 INDIA.INDIA1047 INDONESIA.ASEAN1048 CHINA.CHINA1049 O-ASIA.REST-ASIA1050 GHANA.GHANA1051 (AYEK-GUIN,FRIA-GUIN,TOUG-GUIN).(AYEK-GUIN,REST-GUIN)10521053 RR(R,R) PRODUCTION CLUSTERS HAVING NO LEVIES ON ALUMINA/10541055 (WESTERN-US,EASTERN-US,WEST-CAN,EAST-CAN).(WESTERN-US,1056 EASTERN-US,WEST-CAN,EAST-CAN)1057 (E-EUROPE,ASIAN-USSR).(E-EUROPE,ASIAN-USSR) o1058 (OCEANIA,W-AUSTRAL).(OCEANIA,W-AUSTRAL)1059 (AYEK-GUIN,REST-GUIN).(AYEK-GUIN,REST-GUIN) /;10601061 RR(R,R) 3 YES;106210631064 * DEFINE MAPPINGS FOR TARIFFS10651066 SET FRTRADE(J,R) NO TARIFF ON ALUMINUM SHIPMENTS TO FROM/10671068 W-EUROPE.(W-EUROPE,JAMAICA,GUYANA,SURINAM,GHANA,ZAIRE,REST-AFRIC,AYEK-GUIN,REST-GUIN)1069 EE+USSR.(E-EUROPE, ASIAN-USSR)1070 OCEANIA.(OCEANIA, W-AUSTRAL)1071 CHINA.CHINA1072 C-AMER+CAR.C-AMER+CAR1073 ASEAN.ASEAN1074 KOREA+OEA.KOREA+OEA1075 JAPAN .JAPAN
1076 REST-ASIA.INDIA.1077 REST-ASIA.REST-ASIA1078 N-AFRICA.N-AFRICA1079 (WN-AMERICA,EN-AMERICA).(WESTERN-US,EASTERN-US,WEST-CAN,EAST-CAN)1080 ES-AMERICA.(ARGENTINA,BRAZIL)1081 WS-AMERICA. VENEZUELA1082 W-AFRICA.(GHANA,AYEK-GUIN) /10831084

GAMS 1.0 WORLD ALUMINUM MODEL DATA AND MODEL DEFINITION 04/19/83 09.52.52. PAGE 25PRICES, TARIFFS AND LEVIES
1085 FRAA(RP,R) NO TARIFF ON ALUMINA SHIPMENTS TO FROM /10861087 JAMAICA.JAMAICA1088 GUYANA.GUYANA1089 SURINAM.SURINAM1090 BRAZIL.BRAZIL1091 VENEZUELA.VENEZUELA1092 W-EUROPE.(W-EUROPE,JAMAICA,GUYANA,SURINAM,GHANA,ZAIRE,AYEK-GUIN,REST-GUIN,REST-AFRIC)1093 E-EUROPE.(E-EUROPE,ASIAN-USSR)1094 ASIAN-USSR.(E-EUROPE,ASIAN-USSR)1095 ASEAN.ASEAN1096 CHINA.CHINA1097 INDIA.INDIA1098 REST-ASIA. REST-ASIA1099 N-AFRICA.N-AFRICA1100 GHANA.GHANA1101 (AYEK-GUIN,REST-GUIN).(AYEK-GUIN,REST-GUIN)1102 ZAIRE.ZAIRE /11031104 L80 LABELS FOR ELECTRICITY COST IN 1980 / ELA-1980, ELL-1980, ELH-1980 /11051106 LL80(L,L80) MAP FROM 1980 PRICE LABELSTO ELECTRICITY TYPES / EL-ACTUAL.ELA-19801107 EL-LOCOST.ELL-19801108 EL-HICOST.ELH-1980 I1109 x1110 NFTRADE(J,R) MAPPING OF REGIONS AND PLANTS WITH TARIFF ON SHIPMENTS1111 NFAA(RP,R) MAPPING OF REGIONS WITH TARIFFS ON ALUMINA;11121113 DISPLAY NFTRADE, NFAA;11141115 NFTRADE(J,R) - YES$( NOT FRTRADE(J,R));1116 NFAA(RP,R) - YES$( NOT FRAA(RP,R));11171118 PARAMETER ALPHAA(RP) ALUMINA TARIFFS IN US$ PER TON1119 PRELEC(R,L) ELECTRCITY PRICE IN USMILS PER KWH OR US$ PER MWH;1120
NEW MARGIN X 002-0951122 TABLE PELEC(R,*) US MILS PER KWH OR US$ PER MWH11231124 EL-ACTUAL EL-LOCOST EL-HICOST ELA-1980 ELL-1980 ELH-198011251126 WESTERN-US 20 50 5 5 28 EL-LOCOST1127 EASTERN-US 24 50 5 5 28 ELECTRICITY GENERATED1128 WEST-CAN 4 30 50 5 5 28 WITH FLARED GAS IS1129 EAST-CAN 4 30 50 5 5 28 CONSIDERED AT US$201130 JAMAICA 50 28 PER MWH; HYDRO POWER1131 C-AMER+CAR 20 20 50 3 3 24 IS PRICED AT US$201132 GUYANA 20 50 13 13 28 PER MWH FOR HIGH HEAD1133 SURINAM 4.5 30 50 7 7 29 RIVERS AND US$30 PER1134 BRAZIL 20 20 - 50 7 7 29 MWH FOR LOW HEAD1135 ARGENTINA 8 30 50 7 7 29 RIVERS.1136 VENEZUELA 26 30 50 3 3 24

GAMS 1.0 WORLD ALUMINUM MODEL DATA AND MODEL DEFINITION 04/19/83 09.52.52. PAGE 26PRICES, TARIFFS AND LEVIES
1137 W-EUROPE 20 50 5 5 28 EL-HICOST1138 E-EUROPE 20 50 4 4 23 REFERS TO COAL FIRED1139 ASIAN-USSR 20 20 50 30 30 30 OR NUCLEAR PLANTS.1140 OCEANIA 12 20 50 4 4 281141 W-AUSTRAL 50 28 28 281142 ASEAN 20 50 20 20 281143 KOREA+OEA 50 28 28 281144 CHINA 20 20 50 28 28 281145 JAPAN 30 50 28 28 281146 INDIA 20 30 50 7 7 281147 REST-ASIA 20 30 50 4 4 281148 MID-EAST 3 20 50 4 4 281149 N-AFRICA 20 20 50 7 7 291150 GHANA 4.8 20 50 7 7 29111 AYEK-GUIN 50 29 29 291152 REST-GUIN 20 50 7 7 291153 ZAIRE 6 50 7 7 291154 REST-AFRIC 50 7 7 291155 S-AFRICA 20 50 7 7 29115611571158 PRELEC(R,L) PELEC(R,L);1159 DISPLAY PRELEC;
NEW MARGIN 002-120
1161 X
1162 SCALAR PA MARKET PRICE FOR ALUMINA (US$ PER TON) / 330 /1163 GAMMA COMPLEMENT OF ACTUAL TRADE FLOW / 1 /11641165 * UNITS FOR TARIFF DATA TARIFF VALUES ARE GIVEN AS FRACTIONS OF IMPORT PRICES.11661167 PARAMETER TARIFFAA(R) TARIFF ON IMPORTED ALUMINA /11681169 JAMAICA .121170 GUYANA .151171 SURINAM .051172 BRAZIL .151173 VENEZUELA .051174 W-EUROPE .0561175 E-EUROPE .051176 ASIAN-USSR .051177 ASEAN .101178 CHINA .051179 INDIA .401180 REST-ASIA .401181 N-AFRICA .051182 GHANA .501183 AYEK-GUIN .351184 REST-GUIN .351185 ZAIRE .05 /118611871188

GAMS 1.0 WORLD ALUMINUM MODEL DATA AND MODEL DEFINITION 04/19/83 09.52.52. PAGE 27PRICES, TARIFFS AND LEVIES
1189 ALPHAL(J) TARIFF ON IMPORTED ALUMINUM11901191 WN-AMERICA .001192 EN-AMERICA .001193 C-AMER+CAR .0591194 WS-AMERICA .501195 ES-AMERICA .451196 W-EUROPE .0581197 EE+USSR .051198 OCEANIA .001199 ASEAN .101200 KOREA+OEA .101201 CHINA .201202 JAPAN .091203 REST-ASIA .401204 MID-EAST .001205 N-AFRICA .051206 W-AFRICA .061207 E-AFRICA .001208 S-AFRICA .00 /;12091210 * CONVERT TARIFFS FROM PERCENTAGES TO US $.1211 ALPHAA(RP) - PA*TARIFFAA(RP);1212 DISPLAY ALPHAA;12131214 *NOTE: UNITS FOR LEVY DATA LEVIES ON ALUMINA AND BAUXITE ARE EXPRESSED AS FRACTIONS PER TON OF ALUMINUM CONTENT.12151216 PARAMETER BETAB(I) LEVIES ON BAUXITE /12171218 JAMAICAl .0261219 JAMAICA2 .0261220 HAITI+DR .0731221 SURINAM .0491222 INDONESIA .0031223 GHANA .0051224 AYEK-GUIN .0211225 FRIA-GUIN .0211226 TOUG-GUIN .021 /12271228 BETAA(R) LEVIES ON ALUMNINA12291230 SURINAM .0201231 ASEAN .0031232 GHANA .0051233 AYEK-GUIN .0211234 REST-GUIN .021 /;12351236 *CONVERT THE BAUXITE AND ALUMINA LEVIES TO A PER TON OF ALUMINUM BASIS1237 BETAB(I) - SUM(CM$SRATIO(I,CM), BETAB(I)/(SUM(CI, AATOAL(CI))*BATOAA(CM)));12381239 BETAA(R) - BETAA(R)/(SUM(CI, AATOAL(CI)));1240 DISPLAY ALPHAL,BETAB,BETAA;
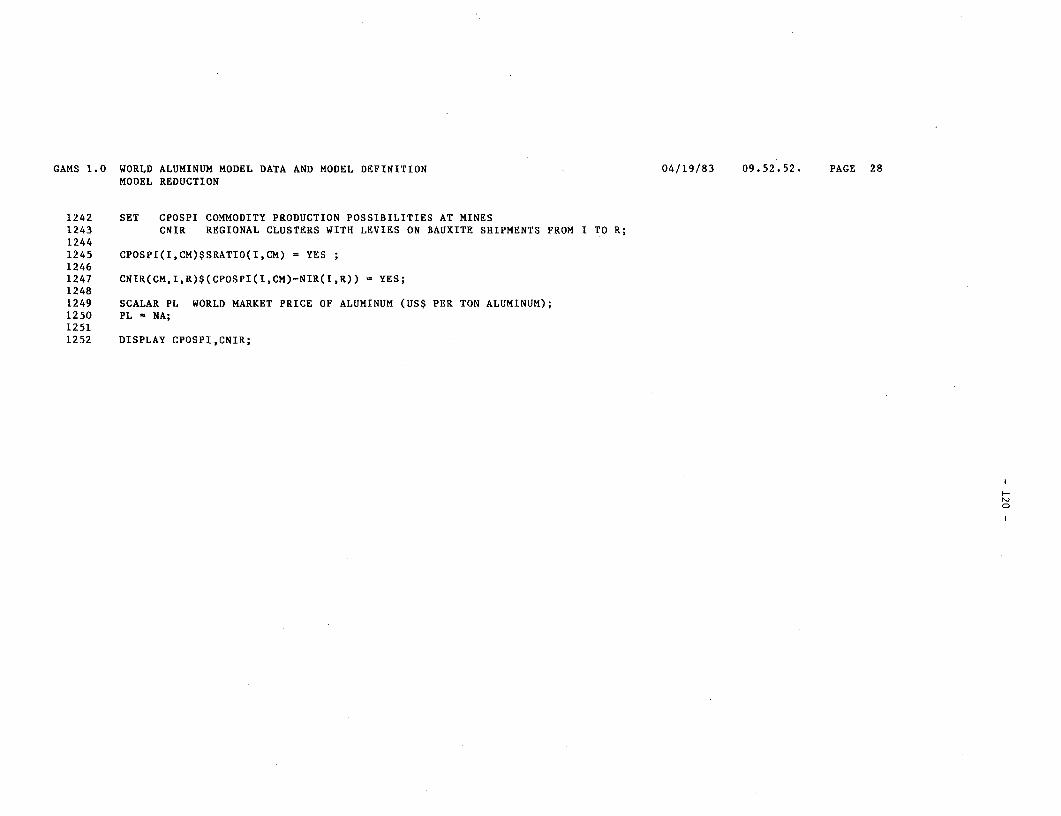
GAMS 1.0 WORLD ALUMINUM MODEL DATA AND MODEL DEFINITION 04/19/83 09.52.52. PAGE 28MODEL REDUCTION
1242 SET CPOSPI COMMODITY PRODUCTION POSSIBILITIES AT MINES1243 CNIR REGIONAL CLUSTERS WITH LEVIES ON BAUXITE SHIPMENTS FROM I TO R;12441245 CPOSPI(I,CM)$SRATIO(I,CM) = YES12461247 CNIR(CM,I,R)$(CPOSPI(I,CM)-NIR(I,R)) - YES;12481249 SCALAR PL WORLD MARKET PRICE OF ALUMINUM (US$ PER TON ALUMINUM);1250 PL - NA;12511252 DISPLAY CPOSPI,CNIR;
H.l)

GAMS 1.0 WORLD ALUMINUM MODEL DATA AND MODEL DEFINITION 04/19/83 09.52.52. PAGE 29COST CALCULATIONS ON DATA
1254 SET CLAB LABELS /12551256 BAUXITE BAUXITE COSTS , ALUMINA ALUMINA COSTS, ALUMINUM ALUMINUM COSTS1257 NET-LEVY , TRANSPORT COST BY SEA , DEL-COST DELIVERED COST1258 NAOR CAUSTIC SODA , CAO LIME , POWER ELECTRICITY COSTS1259 MC2 ENERGY , LABOUR , THERMAL ENERGY1260 COKE-1 COKE INPUTS , MFP FLUORIDES , PIT PITCH1261 OTHER-IN OTHER INPUT COSTS , OPERATING COSTS , CAPITAL COSTS1262 INLAND TRANSPORT COSTS , LEVY , TARIFF1263 TOT-EXP TOTAL EXPORT COST , LESS-TAX TAX SAVINGS , LESS-DRY SAVINGS ON DRYING1264 TOT-LOCAL LOCAL PROCESS COST, TOT-F-O-B EXPORT COST12651266 CASE CASE IDENTIFICATION NUMBERS / 1*23 /12671268 COMB1(CASE,I,R) COMBINATIONS: CASE-MINES-REFINERIES /12691270 l.JAMAICAl.EASTERN-US, 2.JAMAICA2.EASTERN-US, 3.BRAZIL.EASTERN-US,1271 4.AYEK-GUIN.EASTERN-US, 5.W-EUROPE.W-EUROPE, 6.AYEK-GUIN.W-EUROPE,1272 7.N-AUSTRAL.W-EUROPE, 8.W-AUSTRAL.W-AUSTRAL, 9.W-AUSTRAL.W-AUSTRAL,1273 10.BRAZIL.BRAZIL, ll.AYEK-GUIN.AYEK-GUIN, 12.AYEK-GUIN.AYEK-GUIN,1274 13.SURINAM.SURINAM, 14.GHANA.GHANA, 15.GHANA.MID-EAST,1275 16.INDONESIA.ASEAN, 17.INDONESIA.ASEAN, 18.INDONESIA.JAPAN,1276 19.INDONESIA.KOREA+OEA, 20.JAMAICA2.JAMAICA, 21.JAMAICA2.JAMAICA,1277 22.JAMAICA2.JAMAICA, 23.SURINAM.SURINAM / 1278
1279 COMB2(CASE,RP,J) COMBINATIONS: CASES-SMELTERS-MARKETS /12801281 1.EASTERN-US.EN-AMERICA, 2.EASTERN-US.EN-AMERICA, 3.EASTERN-US.EN-AMERICA,1282 4.EASTERN-US.EN-AMERICA, 5.W-EUROPE.W-EUROPE, 6.W-EUROPE.W-EUROPE,1283 7.W-EUROPE.W-EUROPE, 8.EASTERN-US.EN-AMERICA, 9.W-EUROPE.W-EUROPE,1284 1O.EASTERN-US.EN-AMERICA, ll.EASTERN-US.EN-AMERICA, 12.W-EUROPE.W-EUROPE,1285 13.EASTERN-US.EN-AMERICA, 14.GHANA.W-EUROPE, 15.SURINAM.W-EUROPE,1286 16.JAPAN.JAPAN, 17.ASEAN.JAPAN, 18.JAPAN.JAPAN,1287 19.WESTERN-US.EN-AMERICA, 20.JAMAICA.EN-AMERICA, 21.JAMAICA.EN-AMERICA,1288 22.EASTERN-US.EN-AMERICA, 23.SURINAM.EN-AMERICA12891290 PARAMETER Xl COST COMPONENTS AT MINES1291 X2 COST COMPONENTS AT REFINERIES1292 X3 COST COMPONENTS AT SMELTERS1293 X4 COST COMPONENTS AT MARKETS129412951296 ** COMPUTE INCOME TAX SAVINGS FOR LOCAL PROCESSING **1297 * LOGIC: IF THE ORE MINED AT I IS PROCESSED AT R (SAME LOCATION) THEN A PERCENTAGE OF THE TOTAL1298 * INVESTMENT COST CAN BE DEDUCTED FROM PRODUCTION OR EXPORT LEVY IMPOSED AT I12991300 PARAMETER LTS(I,R) TAX DEDUCTIONS AS A PERCENTAGE OF INVESTMENT COST / JAMAICA1.JAMAICA .021301 JAMAICA2.JAMAICA .021302 SURINAM.SURINAM .021303 HAITI+DR.C-AMER+CAR .02 /;13041305 PL - 2000;

GAMS 1.0 WORLD ALUMINUM MODEL DATA AND MODEL DEFINITION 04/19/83 09.52.52. PAGE 30COST CALCULATIONS ON DATA
13061307 PARAMETER BETABP CONVERT PRODUCTION OR EXPORT LEVY AT I FROM RATE TO DOLLAR
1308 TAXIA TAX SAVINGS FROM REFINERIES1309 TAXlB TAX SAVINGS FROM SMELTERS1310 TAXS2 TOTAL TAX SAVINGS13111312 BETABP(I) = PL*BETAB(I);
1313 PARAMETER BBB,AAA; AAA(I,R) - l$NIR(I,R);1314 BBB(I,R)$((AAA(I,R) EQ 1) AND (LTS(I,R) NE 0)) - BETABP(I);
13151316 TAX1A(I,R) = -SUM((CM,P,MR)$(SRATIO(I,CM) GT 0 AND A(CM,P) LT 0 AND B(MR,P) GT 0),1317 (1000*LTS(I,R)*OMEGAR(MR,"2",R)/SBR(MR,"2",R))/A(CM,P) );1318 TAX1B(I,R) (1000*LTS(I,R)*OMEGAR("SMELTER","2",R)/SBR("SMELTER",'2",R))/SUM(CM$SRATIO(I,CM), AATOAL("ALUMINA")*
1319 BATOAA(CM));
1320
1321 TAXS2(I) - SUM((R,RP)$(NIR(I,R)*RR(R,RP)), TAXIA(I,R) + TAXlB(I,RP) )1322 TAXS2(I)$((BETABP(I) - TAXS2(I)) LT 0) = BETABP(I);1323 DISPLAY AAA,BBB,TAXIA,TAXIB,TAXS2;
13241325
1326 ** SELECT ELECTRICITY COST LEVEL **1327 PARAMETER CELI, CELCOST(R) ELECTRICIY COST AT SMELTER;
13281329 * OPTION 1: CHEAPEST ELECTRICITY M
1330 *CEL1(R,L) = -A("ELECTR","SMELTING")*PRELEC(R,L)$(UBAR(R,L) GT 0);1331 *CELI(R,L)$(CELI(R,L) EQ 0) = 12.6*50;1332 *CELCOST(R) = SMIN(L, CELI(R,L));
13331334 * OPTION 2: SELECT THE MINIMUM BETWEEN LOCOST AND EXPENSIVE1335 CELCOST(R) = 12.6*PRELEC(R,"EL-LOCOST")$UBAR(R,"EL-LOCOST");1336 CELCOST(R)$(CELCOST(R) EQ 0) = 12.6*50;
1337
1338 * OPTION 3: ALL LOCATIONS HAVE MOST EXPENSIVE
1339 *CELCOST(R) = 12.6*50;1340 DISPLAY CELCOST;13411342 ** MAIN SECTION **1343 SET CMM(CM),PROC(P),MMM(M);13441345
1346 LOOP((CASE,I,R)$COMBI(CASE,I,R), LOOP((RP,J)$COMB2(CASE,RP,J),1347
1348 CMM(CM) - YES$SRATIO(I,CM);1349 PROC(P) - YES$SUM(CMM, A(CMM,P) LT 0);1350 MMM(M) = YES$SUM(PROC, B(M,PROC));
1351 DISPLAY CMM,PROC,MMM;13521353 LOOP((CM,P,M)$(CMM(CM)*PROC(P)*MMM(M)),13541355
1356 Xl("OPERATING",CASE) - OM(I);1357 X1("CAPITAL",CASE) - (SIGMA*1000*OMEGAM(I,"2")/SBM(I,'2"))/UT("MINING");

GAMS 1.0 WORLD ALUMINUM MODEL DATA AND MODEL DEFINITION 04/19/83 09.52.52. PAGE 31COST CALCULATIONS ON DATA
1358 Xl("INLAND",CASE) = MURL(I);1359 X1("LEVY",CASE) = BETABP(I)$( (AAA(I,R) EQ 0) OR (AAA(I,R) NE 0 AND LTS(I,R) NE 0));1360 Xl("TOT-EXP",CASE) = SUM(CLAB, X1(CLAB,CASE));1361 X1("LESS-TAX",CASE) = TAXS2(I)$(BBB(I,R) NE 0);1362 X1("TOT-LOCAL",CASE) = X1("TOT-EXP",CASE) - X1("LESS-TAX",CASE);13631364 X2("BAUXITE",CASE) = - A(CM,P)*(X1("OPERATING",CASE) + X1("CAPITAL",CASE) + X1("INLAND",CASE));1365 X2('TRANSPORT",CASE) = - A(CM,P)*MURS(I,R);1366 X2("NET-LEVY",CASE) = -A(CM,P)*PL*BETAB(I)$(NOT NIR(I,R));1367 X2("DEL-COST",CASE) = SUM(CLAB, X2(CLAB,CASE));1368 X2("NAOH",CASE) = - A("SODA-ASH",P)*COSTRS(R,"SODA-ASH");1369 X2("CAO",CASE) = - A("LIME",P)*COSTRS(R,"LIME");1370 X2("MC2",CASE) = - A("ENERGY",P)*COSTRS(R, ENERGY");1371 X2("LABOUR",CASE) = - A("LABOR",P)*COSTRS(R,"LABOR");1372 X2("OTHER-IN",CASE) = - A("OTHER",P)*COSTRS(R,"OTHER");1373 X2("OPERATING",CASE) = X2("NAOH",CASE) + X2("CAO",CASE) + X2("MC2",CASE) + X2("LABOUR",CASE)1374 + X2("OTHER-IN",CASE);1375 X2("CAPITAL",CASE) = (1000*SIGMA*OMEGAR(M,"2",R)/SBR(M,"2",R))/UT(M);1376 X2("TOT-F-O-B",CASE) = X2("DEL-COST",CASE) + X2( OPERATING',CASE) + X2("CAPITAL',CASE);13771378
1379 X3("ALUMINA",CASE) = - A("ALUMINA","SMELTING")*X2("TOT-F-O-B",CASE);1380 X3(-NET-LEVY",CASE) = - A("ALUMINA","SMELTING")*(PL*BETAA(R)$(NOT RR(R,RP)) + ALPHAA(RP)$NFAA(RP,R));1381 X3("TRANSPORT",CASE) - - A("ALUMINA","SMELTING")*MUI(R,RP);1382 X3("DEL-COST",CASE) = SUM(CLAB, X3(CLAB,CASE));1383 X3("POWER",CASE) = CELCOST(RP);1384 X3("LABOUR",CASE) = - A("LABOR","SMELTING")*COSTRS(RP,"LABOR");1385 X3("THERMAL",CASE) = - A("THERM-EGY","SMELTING")*COSTRS(RP,"THERM-EGY");1386 X3("COKE-1",CASE) - - A("COKE","SMELTING")*COSTRS(RP,"COKE");1387 X3("MFP",CASE) - - A("FLUORIDES","SMELTING")*COSTRS(RP,"FLUORIDES");1388 X3("PIT",CASE) = - A("PITCH","SMELTING")*COSTRS(RP,"PITCH");1389 X3("OTHER-IN",CASE) - - A("OTHER","SMELTING")*COSTRS(RP,"OTHER");1390 X3("OPERATING",CASE) - X3("POWER",CASE) + X3("LABOUR",CASE) + X3("THERMAL",CASE) + X3("COKE-1",CASE)1391 + X3("MFP",CASE) + X3("PIT",CASE) + X3("OTHER-IN",CASE);1392 X3("CAPITAL",CASE) - (1000*SIGMA*OMEGAR( SMELTER ,"2",RP)/SBR( SMELTER","2",RP))/UT("SMELTER");1393 X3("TOT-F-O-B",CASE) - X3("DEL-COST",CASE) + X3("OPERATING",CASE) + X3("CAPITAL",CASE);13941395 X4("ALUMINUM",CASE) - X3("TOT-F-0-B",CASE);
1396 X4("TRANSPORT",CASE) - MUF(RP,J);1397 X4("LEVY",CASE) - (PL*ALPHAL(J)$NFTRADE(J,RP));1398 X4("DEL-COST",CASE) - SUM(CLAB, X4(CLAB,CASE)) ) ) );13991400 DISPLAY X1,X2,X3,X4;

GAMS 1.0 WORLD ALUMINUM MODEL DATA AND MODEL DEFINITION 04/19/83 09.52.52. PAGE 32DATA CHECKS
1402 SET DC1(I) INCONSISTENCY BETWEEN MINE CAPACITIES AND RESERVES1403 DC3(R,M) PRODUCTIVE UNIT WITH CAPACITY BUT NO PROCESS TO OPERATE1404 DC4(R,P) PRODUCTIVE UNIT HAVING CAPACITY AND PROCESS MAPPING BUT WITHOUT ANY INPUT COMMODITIES1405 DC5(R) LOCATION WITH NONZERO SMELTER CAPACITY BUT WITH ZERO ELECTRICITY AVAILABILITY14061407 DC6(R) LOCATION WITH NONZERO SMELTER CAPACITY BUT NEGATIVE ELECTRICITY AVAILABILITY1408 DC7(I) MINES WITH CAPACITY BUT NO INFRASTRUCTURE FACTOR1409 DC8(R,CMI) REFINERIES AND SMELTERS WITH NONZERO CAPACITY BUT ZERO OPERATING COST1410 DC9(I) MINES WITH NONZERO CAPACITY BUT WITH EITHER NO LABOR COST OR FUEL COST OR OPERATING COSTS14111412 DCIO(I) UNMAPPED MINES TO PORTS1413 DC11(R) UNMAPPED PRODUCTION CENTERS TO PORTS1414 DC12(J) UNMAPPED MARKETS TO PORTS1415 DC13(I,MODES) MINES HAVING NONZERO DISTANCES TO PORTS BUT ZERO COST14161417 DC14(R) REFINERIES AND SMELTERS WITH ELECTRICITY AVAILABLE FROM EXISTING CHEAP POWER SOURCES BUT NO COST1418 DC15(R) REFINERIES AND SMELTERS WITH LOW COST FUTURE POWER SOURCES BUT AT NO COST1419 DC16(J) MARKETS HAVING A NONZERO TARIFF ON IMPORTED ALUMINUM BUT ZERO DEMAND1420 DC17(J) INCONSISTENCY BETWEEN THE WORLD PRICE OF ALUMINUM USED AND THE ALUMINUM DEMAND LEVEL USED14211422 DC18(I,R) NONZERO LEVY BETWEEN BAUXITE PRODUCER AND BAUXITE USER WITH PORT MAPPING BUT NO SEA TRANSPORT COST1423 DC19(RP,R) NONZERO ALUMINA LEVY BETWEEN REFINERS WITH PORT MAPPING BUT NO SEA TRANSPORT COST1424 DC20(RP,R) NONZERO ALUMINA TARIFFS BETWEEN REFINERS WITH PORT MAPPING BUT NO SEA TRANSPORT COST1425 DC21(J,R) NONZERO ALUMINUM TARIFF BETWEEN SMELTERS AND MARKETS WITH PORT MAPPING BUT NO SEA COST;1426
14271428 DC1(I)$( (CAPM(I) NE 0) AND (ZMBAR(I) EQ 0) ) - YES;1429 DC3(R,M)$( (CAPR(R,M) NE 0) AND (SUM(P, B(M,P)) EQ 0) ) - YES;1430 DC4(R,P)$( ((SUM(M, CAPR(R,M)) NE 0) AND (SUM(M, B(M,P)) NE 0) )1431 AND (SUM(AR, A(AR,P)) EQ 0) ) = YES;14321433 DC5(R)$((CAPR(R,"SMELTER") NE 0) AND (EGYRES(R,"LC") EQ 0) ) = YES;1434 DC6(R)$((CAPR(R,"SMELTER") NE 0) AND (EGYRES(R,"LC") LT 0) AND (UBAR(R,"EL-ACTUAL") LT 0)) YES;14351436 DC7(I)$( ( INFMI(I) EQ 0) AND (CAPM(I) NE 0) ) - YES;1437 DC8(R,CMI)$( (SUM(M, CAPR(R,M)) NE 0) AND (COSTRS(R,CMI) EQ 0) ) - YES;1438 DC9(I)$( (CAPM(I) NE 0) AND ((SUM(MCC, MLC(I)) EQ 0) OR (SUM(MCC, MFC(I,MCC)) EQ 0) OR (OM() EQ 0)) ) = YES;1439
1440 DC1O(I) = SUM(N$IN(I,N), 1) NE 1;1441 DCl1(R) = SUM(N$RN(R,N), 1) NE 1;1442 DC12(J) = SUM(N$JN(J,N), 1) NE 1;1443 DC13(I,MODES)$( (DMP(I,MODES) NE 0) AND (MPC(MODES) EQ 0) ) = YES;14441445 DC14(R)$( (PRELEC(R,"EL-ACTUAL") EQ 0) AND (EGYRES(R,"LC") GT 0) ) YES;1446 DC15(R)$( (PRELEC(R,"EL-LOCOST") EQ 0) AND ((EGYRES(R,"HYDRO") + EGYRES(R,"FLAREDGAS")1447 + EGYRES(R,"COAL")) GT 0) ) YES;1448 DC16(J)$( (ALPHAL(J) NE 0) AND (D(J) EQ 0) ) YES;14491450 DC18(I,R)$( (MURS(I,R) EQ 0) AND (SUM(CM$CNIR(CM,I,R), BETAB(I)) NE 0)) - YES;1451 DC19(RP,R)$( (MUI(R,RP) EQ 0) AND (BETAA(R) NE O)$NFAA(RP,R) ) = YES;1452 DC20(RP,R)$( (MUI(R,RP) EQ 0) AND (TARIFFAA(RP) NE O)$NFAA(RP,R) ) = YES;1453 DC21(J,R)$( (MUF(R,J) EQ 0) AND (ALPHAL(J) NE O)$NFTRADE(J,R) ) = YES;

GAMS 1.0 WORLD ALUMINUM MODEL DATA AND MODEL DEFINITION 04/19/83 09.52.52. PAGE 33DATA CHECK AND PROGRAM ABORT
1455 * THE FOLLOWING PROCEDURE WILL TEST IF THE DATA CHECKS MADE EARLIER ARE NON-ZERO, AND IF THEY ARE IT WILL DISPLAY A1456 *1457 * MESSAGE FOLLOWED BY THE DATA WHERE THE ERROR POSSIBLY OCCURS. THE JOB WILL THEN BE ABORTED.14581459 ABORT$SUM(I,DC1(I))"INCONSISTENCY BETWEEN MINE CAPACITIES AND ZMBAR"DC1,CAPM,ZMBAR1460 ABORT$SUM((R,M),DC3(R,M))"FOLLOWING LOCATIONS HAVE PROD. UNITS WHICH HAVE CAPACITY BUT NO PROCESS TO OPERATE"1461 DC3,CAPR,B1462 ABORT$SUM((R,P),DC4(R,P))"THESE LOCATIONS HAVE PROD UNITS WITH CAP AND PROCESS MAPPING BUT NO INPUT COMM DATA"1463 DC4,B,A1464 ABORT$SUM(R,DC5(R))"SMELTER LOCATIONS WITH NONZERO SMELTER CAPACITY BUT ZERO ELECTRICITY AVAILABILITY"DC5,1465 CAPR,EGYRES1466 ABORT$SUM(R,DC6(R))"LOCATIONS WITH NONZERO SMELTER CAPACITY BUT NEGATIVE ELECTRICITY REQUIREMENTS"DC6,CAPR,1467 EGYRES,UBAR1468 ABORT$SUH(I,DC7(I))"MINES WITH CAPACITY BUT NO INFRASTRUCTURE FACTOR DATA"DC7,CAPM,INFMI1469 ABORT$SUM((R,CMI),DC8(R,CMI))"REFINERIES AND SMELTERS HAVING NONZERO CAPACITY BUT ZERO OPERATING COSTS DC8,CAPR,1470 COSTRS1471 ABORT$SUM(I,DC9(I))"MINES WITH NONZERO CAPACITY BUT WITH EITHER NO LABOR COST OR FUEL COST OR OPERATING COSTS"1472 DC9,CAPM,MLC,MFC,OM1473 ABORT$SUM(I,DC1O(I))"MINES WITHOUT A MAP TO PORTS"DC1O,I,N,IN1474 ABORT$SUM(R,DCII(R))"PRODUCTION REGIONS WITHOUT MAP TO PORTS"DC1I,R,N,RN1475 ABORT$SUM(J,DC12(J))"MARKETING REGIONS WITHOUT A MAP TO PORTS"DC12,J,N,JN1476 ABORT$SUM((I,MODES),DC13(I,MODES))"MINES HAVING NONZERO DISTANCES TO PORTS BUT AT ZERO COST"DC13,DMP,MPC1477 ABORT$SUM(R,DC14(R))1478 "SMELTERS WITH ELECTRICITY AVAILABLE FROM EXISTING CHEAP POWER SOURCES BUT AT NO COST"DC14,PRELEC,EGYRES1479 ABORT$SUM(R,DC15(R))"REFINERIES AND SMELTERS WITH LOW COST FUTURE POWER SOURCES BUT AT NO COST"DC15,PRELEC,EGYRES1480 ABORT$SUM(J,DC16(J))`MARKETS WITH A NONZERO TARIFF ON IMPORTED ALUMINUM BUT WITH NO DEMAND"DC16,ALPHAL,D1481 ABORT$SUM((I,R),DC18(I,R))"LEVY BETWEEN BAUXITE PRODUCER AND USER WITH PORT MAP BUT AT NO SEA TRANSPORT COST'1482 DC18,BETAB,MURS1483 ABORT$SUM((RP,R),DC19(RP,R))"ALUMINA LEVY BETWEEN REFINERS WITH PORT MAP BUT AT NO SEA TRANSPORT COST"1484 DC19,BETAA,MUI1485 ABORT$SUM((RP,R),DC20(RP,R))1486 "NONZERO ALUMINA TARIFF BETWEEN REFINER AND SMELTER WITH PORT MAP BUT AT NO SEA TRANSPORT COST"1487 DC20,TARIFFAA,MUI1488 ABORT$SUM((J,R),DC21(J,R))"ALUMINUM TARIFF BETWEEN SMELTERS AND MARKETS WITH PORT MAPPING BUT NO SEA COST"1489 DC21,ALPHAL,MUF;

GAMS 1.0 WORLD ALUMINUM MODEL DATA AND MODEL DEFINITION 04/19/83 09.52.52. PAGE 34
MODEL SPECIFICATION
NEW MARGIN - 002-120
1492 VARIABLES
14931494 XF(R,J) SHIPMENT: FINAL PRODUCTS (1000 TPY)1495 XI(R,RP) StIIPMENT: INTERMEDIATES (1000 TPY)
1496 XM(C,I,R) SHIPMENT: BAUXITES (1000 TPY)
1497 Z(P,R) PROCESS LEVEL (1000 TPY)1498 ZM(CM,I) MINING OUTPUT LEVEL (1000 TPY)
1499 U(L,R) ELECTRICITY SUPPLY (GIGAWATT HOURS PER YEAR)
1500 HM(I) EXPANSIONS (LINEAR): MINES (MILLION TONS PER ANNUAL CAPACITY)1501 HR(R,M) EXPANSIONS (LINEAR): REFINERY AND SMELTER (MILLION TONS PER ANNUAL CAPACITY)
1502 SM(SEG,I) EXPANSIONS (FIXED): MINES (MILLION TONS PER ANNUAL CAPACITY)1503 SR(M,SEG,R) EXPANSIONS (FIXED): REFINERY AND SMELTER (MILLION TONS PER ANNUAL CAPACITY)1504 YM(I) BINARY EXPANSION VARIABLE: MINES
1505 YR(R,M) BINARY EXPANSION VARIABLE: REFINERIES AND SMELTERS
1506 PHIKM INVESTMENT COST: MINES (US$ MILLION)
1507 PHIKR INVESTMENT COST: REFINERIES AND SMELTERS (US$ MILLION)
1508 PHIOM OPERATING COST: MINES (US$ MILLION)1509 PHIOR OPERATING COST: REFINERIES AND SMELTERS (US$ MILLION)
1510 PHIT COST: TRANSPORT (US$ MILLION)
1511 PHITF COST: TARIFFS (US$ MILLION)
1512 PHIL COST: ROYALTIES AND LEVIES (US$ MILLION)
1513 PHIl COST: TOTAL (US$ MILLION) ,
1514 PHI2 COST: TOTAL COST WITHOUT TARIFFS (US$ MILLION) a1515 PHI3 COST: TOTAL COST WITHOUT LEVIES (US$ MILLION)1516 PHI4 COST: TOTAL COST WITHOUT LEVIES OR TARIFFS (US$ MILLION);
1517
1518 POSITIVE VARIABLES XF,XI,XM,Z,ZM,U,HM,HR,SM,SR;1519 BINARY VARIABLES YM,YR;
152015211522

GAMS 1.0 WORLD ALUMINUM MODEL DATA AND MODEL DEFINITION 04/19/83 09.52.52. PAGE 35
MODEL SPECIFICATION
1524 EQUATIONS
15251526 MBM(CM,I) MATERIAL BALANCE: MINES (1000 UNITS)
1527 MBR(C,R) MATERIAL BALANCE: REFINERIES AND SMELTERS (1000 UNITS)
1528 FDB(J) FINAL DEMAND BALANCE (1000 UNITS)
1529 CCM(I) CAPACITY CONSTRAINT: MINES (MILLION TYP)
1530 CCR(R,M) CAPACITY CONSTRAINT: REFINERIES AND SMELTERS (MILLION TYP)
1531 I1M(I) DEFINITION OF H: MINES
1532 I1R(R,M) DEFINITION OF H: REFINERIES AND SMELTERS
1533 12M(I) CONVEX COMBINATION AND 0-1 CONSTRAINT: MINES
1534 I2R(R,M) CONVEX COMBINATION AND 0-1 CONSTRAINT: REFLNERIES AND SMELTERS
1535 RES(CM,I) BAUXITE RESERVE CONSTRAINT (1000 TONS)
1536 TBA(F) TRADE RESTRICTIONS: BAUXITE
1537 TAA(F) TRADE RESTRICTIONS: ALUMINA1538 TAL(F) TRADE RESTRICTIONS: ALUMINUM
1539 AKM ACCOUNTING: MINE INVESTMENTS (US$ MILLION)
1540 AKR ACCOUNTING: REFINERY AND SMELTER INVESTMENTS (US$ MILLION)
1541 AOM ACCOUNTING: MINE OPERATING COSTS (US$ MILLION)
1542 AOR ACCOUNTING: REFINERIES AND SMELTERS OPERATING COSTS (US$ MILLION)1543 AT ACCOUNTING: TRANSPORT COST (US$ MILLION)
1544 ATF ACCOUNTING: TARIFFS (US$ MILLION)
1545 AL ACCOUNTING: ROYALTIES AND LEVIES (US$ MILLION)
1546 Al ACCOUNTING: TOTAL COST (US$ MILLION)
1547 A4 ACCOUNTING: TOTAL COST WITH NO LEVIES OR TARIFFS (US$ MILLION);'\I

GAMS 1.0 WORLD ALUMINUM MODEL DATA AND MODEL DEFINITION 04/19/83 09.52.52. PAGE 36MODEL SPECIFICATION
1550 MBM(CM,I)$CPOSPI(I,CM).. ZM(CM,I)$CPOSPI(I,CM) -G- SUM(R, XM(CM,I,R)) + NMBA2000(I);
1551
1552 MBR(C,R).. SUM(P, A(C,P)*Z(P,R)) + SUM(I, XM(C,I,R)$(CM(C)$CPOSPI(I,C))) + SUM(RP, XI(RP,R)$CI(C))
1553 + SUM(L$PRELEC(R,L), U(L,R)$CL(C)) =G= SUM(J, XF(R,J)$CF(C)) + SUM(RP, XI(R,RP)$CI(C)) + NMAA2000(R)$CI(C);
1554
1555 FDB(J).. SUM(R, XF(R,J) ) =G= D(J);
1556
1557 RES(CM,I)$CPOSPI(I,CM).. INTERVAL*ZM(CM,I) -L= ZMBAR(I)$CPOSPI(I,CM)
1558
1559 CCM(I).. SUM(CM$CPOSPI(I,CM), ZM(CM,I)) =L= UTM*(CAPM(I) + HM(I));
1560 H
1561 CCR(R,M).. SUM(P, B(M,P)*Z(P,R)) =L= UTR(M)*(CAPR(R,M) + HR(R,M));
1562
1563 I1M(I).. HM(I) =E= SUM(SEG, SBM(I,SEG)*SM(SEG,I));
1564
1565 I1R(R,M).. HR(R,M) =E- SUM(SEG, SBR(M,SEG,R)*SR(M,SEG,R));
1566
1567 I2M(I).. YM(I) =E= SUM(SEG, SM(SEG,I));
1568
1569 I2R(R,M).. YR(R,M) =E= SUM(SEG, SR(M,SEG,R));
1570
1571 TBA(F).. SUM((CM,I,R)$(FR(F,R)*CPOSPI(I,CM)), XM(CM,I,R)$FI(F,I) - GAMMA*XM(CM,I,R)) =G= 0;
1572
1573 TAA(F).. (1-GAMMA)*SUM((CI,R)$FR(F,R), -A(CI,'SMELTING0)*Z('SMELTING",R)
1574 =G= SUM((R,RP)$FR(F,RP), XI(R,RP)$(NOT FR(F,R)) );
1575

GAMS 1.0 WORLD ALUMINUM MODEL DATA AND MODEL DEFINITION 04/19/83 09.52.52. PAGE 37MODEL SPECIFICATION
1576 TAL(F).. SUM((R,J)$FJ(F,J), XF(R,J)$FR(F,R) - GAMMA*XF(R,J)) =G= 0;
1577
1578 AOM.. PHIOM =E- SUM((CM,I)$CPOSPI(I,CM),OM(I)*ZM(CM,I))/1000;
1579
1580 AOR.. PHIOR =E= ( SUM((R,P), ORS(R,P)*Z(P,R)) + SUM((R,L), PRELEC(R,L)*U(L,R)) )/1000;
1581
1582 AT.. PHIT =E= SUM(R, SUM(J, MUF(R,J)*XF(R,J)) + SUM(RP, MUI(R,RP)*XI(R,RP))
1583 + SUM((CM,I)$CPOSPI(I,CM), MUR(I,R)*XM(CM,I,R)))/1000;
1584
1585 AKM.. PHIKM =E= SIGMA*SUM((SEG,I), OMEGAM(I,SEG)*SM(SEG,I));
1586
1587 AKR.. PHIKR = E= SIGMA*SUM((SEG,R,M), OMEGAR(M,SEG,R)*SR(M,SEG,R));
1588
1589 ATF.. PHITF =E= (SUM(J, PL*ALPHAL(J)*SUM(R$NFTRADE(J,R), XF(R,J)))
1590 + SUM(RP, ALPHAA(RP)*SUM(R$NFAA(RP,R), XI(R,RP))))/1000;
1591
1592 AL.. PHIL -E- PL*(SUM((CM,I,R)$CNIR(CM,I,R), BETAB(I)*XM(CM,I,R))
1593 + SUM((R,RP)$(NOT RR(R,RP)), BETAA(R)*XI(R,RP)))/1000;
1594
1595 Al.. PHIl -E- PHIT + PHIOM + PRIOR + PHITF + PHIL +PHIKM +PHIKR
1596
1597 A4.. PH14 E- PHIT + PHIOM + PHIOR + PHIKM + PHIKR ;

GAMS 1.0 WORLD ALUMINUM MODEL DATA AND MODEL DEFINITION 04/19/83 09.52.52. PAGE 38SCENARIO AND MODEL
1600 PL = 2000;
1601 D(J) - DEM2000(J,"LOW");1602 GAMMA = 0;16031604 U.UP(L,R) = UBAR(R,L);1605 U.UP("EL-HICOST",R) = +INF;16061607 MODEL GAM GLOBAL ALUMINUM MODEL / ALL /;1608 SOLVE GAM MINIMIZING PHI4 USING MIP;
0

GAMS 1.0 WORLD ALUMINUM MODEL DATA AND MODEL DEFINITION 04/19/83 09.52.52. PAGE 39REPORT
1610 SET RCOL REPORT COLUMNS /1611 NCAP-EXIST,NCAP-COM,NCAP-NEW,NCAP-TOT,ECAP-TOT,PRODUCTION,SHIPPED,NON-IND,ECAP-UT /16121613 RCOLEL COLUMN LABELS FOR ELECTRICITY REPORTING /1614 EL-ACTUAL,EL-LOCOST,EL-HICOST,EL-TOTAL,EL-COST,AV-COST /;161516161617 PARAMETER REPB BAUXITE PRODUCTION AND CONSUMPTION (1000 TPY)1618 AREPB BAUXITE PRODUCTION AND CONSUMPTION (1000 TPY)1619 BREPB BAUXITE PRODUCTION AND CONSUMPTION (1000 TPY)16201621 REPAA ALUMINA PRODUCTION AND CONSUMPTION (1000 TPY)1622 AREPAA ALUMINA PRODUCTION AND CONSUMPTION (1000 TPY)1623 BREPAA ALUMINA PRODUCTION AND CONSUMPTION (1000 TPY)16241625 REPAM ALUMINIUM PRODUCTION AND CONSUMPTION (1000 TPY)1626 AREPAM ALUMINIUM PRODUCTION AND CONSUMPTION (1000 TPY)1627 BREPAM ALUMINIUM PRODUCTION AND CONSUMPTION (1000 TPY)16281629 REPEL ELECTRICITY REPORT BY PLANTS1630 AREPEL ELECTRICITY REPORT BY REGIONS1631 BREPEL ELECTRICITY REPORT BY BLOCKS;163216331634 REPB(I,R) - SUM(CM, XM.L(CM,I,R));1635 REPB("**TOTAL**",R) - SUM(I, REPB(I,R));1636 REPB(I,"SHIPPED") = SUM(R, REPB(I,R));1637 REPB(I,"NON-IND") = NNBA2000(I);1638 REPB(I,"PRODUCTION") SUM(CM, ZM.L(CM,I));16391640 REPB(I,"ECAP-TOT") - UT("MINING")*(CAPM(I)+HM.L(I));1641 REPB(I,"NCAP-TOT") - CAPM(I)+HM.L(I);1642 REPB(I,"NCAP-EXIST") - CAPM1(I,"INITIAL");1643 REPB(I,"NCAP-COM") - CAPM1(I,"INVEST");1644 REPB(I,"NCAP-NEW") - HM.L(I);16451646 REP8(I,"ECAP-UT") - REPB(I,"PRODUCTION")/REPB(I,"ECAP-TOT");1647 REPB("**TOTAL**",RCOL) - SUM(I,REPB(I,RCOL));1648 REPB("**TOTAL**","ECAP-UT") - REPB("**TOTAL**","PRODUCTION")/REPB("**TOTAL**","ECAP-TOT");16491650 AREPB(G,RCOL) - SUM(I$GI(G,I),REPB(I,RCOL));1651 AREPB(G,GP) - SUM((I,R)$(GI(G,I)*GR(GP,R)), REPB(I,R));1652 AREPB("**TOTAL**",G) - SUM(GP, AREPB(GP,G));1653 AREPB("**TOTAL**",RCOL) - REPB("**TOTAL**",RCOL);1654 AREPB(G,"ECAP-UT") - AREPB(G,"PRODUCTION")/AREPB(G,"ECAP-TOT");16551656 BREPB(F,RCOL) - SUM(G$FG(F,G),AREPB(G,RCOL));1657 BREPB(F,FP) - SUM((G,GP)$(FG(F,G)*FG(FP,GP)), AREPB(G,GP));1658 BREPB("**TOTAL**",F) - SUM(FP, BREPB(FP,F));1659 BREPB("**TOTAL**",RCOL) - AREPB("**TOTAL**",RCOL);1660 BREPB(F,"ECAP-UT") - BREPB(F,"PRODUCTION")/BREPB(F,"ECAP-TOT");1661

GAMS 1.0 WORLD ALUMINUM MODEL DATA AND MODEL DEFINITION 04/19/83 09.52.52. PAGE 40
REPORT
16621663 SET SMELT / SMELTER |;16641665 REPAA(R,RP) - XI.L(R,RP);1666 REPAA(R,"NON-IND") - NMAA2000(R);1667 REPAA(R,"PRODUCTTON") = SUM(P$(A("ALUMINA",P) GE 0), A("ALUMINA",P)*Z.L(P,R));1668 REPAA(R,R) = REPAA(R,"PRODUCTION") - SUM(RP, REPAA(R,RP)) - REPAA(R,"NON-IND");16691670 REPAA(R,"SHIPPED") = REPAA(R,"PRODUCTION") - REPAA(R,"NON-IND");1671 REPAA("**TOTAL**",RP) - SUM(R, REPAA(R,RP));1672 REPAA(R,"ECAP-TOT") - SUM(M$(NOT SMELT(M)), UT(M)*(CAPR(R,M)+HR.L(R,M)));1673 REPAA(R,"NCAP-TOT") - SUM(M$(NOT SMELT(M)), CAPR(R,M)+HR.L(R,M));
1674 REPAA(R,"NCAP-EXIST") = SUM(M$(NOT SMELT(M)), CAPR1(R,M));1675 REPAA(R,"NCAP-COM") - SUM(M$(NOT SMELT(M)), CAPR2(R,M));16761677 REPAA(R,"NCAP-NEW") = SUM(M$(NOT SMELT(M)), HR.L(R,M));1678 REPAA(R,"ECAP-UT") = SUM((P,M)$(NOT SMELT(M)), B(M,P)*Z.L(P,R))/REPAA(R,"ECAP-TOT");1679 REPAA("**TOTAL**",RCOL) - SUM(R, REPAA(R,RCOL));1680 REPAA("**TOTAL**","ECAP-UT") = REPAA("**TOTAL**" 'PRODUCTION")/REPAA("**TOTAL**","ECAP-TOT");16811682 AREPAA(G,RCOL) = SUM(R$GR(G,R),REPAA(R,RCOL));1683 AREPAA(G,GP) = SUM((R,RP)$(GR(G,R)*GR(GP,RP)), REPAA(R,RP));1684 AREPAA("**TOTAL**",G) = SUM(GP, AREPAA(GP,G));1685 AREPAA("**TOTAL**",RCOL) = REPAA("**TOTAL**",RCOL);1686 AREPAA(G,"ECAP-UT") = AREPAA(G,"PRODUCTION")/AREPAA(G,"ECAP-TOT");16871688 BREPAA(F,RCOL) = SUM(G$FG(F,G),AREPAA(G,RCOL));1689 BREPAA(F,FP) = SUM((G,GP)$(FG(F,G)*FG(FP,GP)), AREPAA(G,GP));1690 BREPAA("**TOTAL**",F) = SUM(FP, BREPAA(FP,F));1691 BREPAA("**TOTAL**",RCOL) = AREPAA("**TOTAL**",RCOL);1692 BREPAA(F,"ECAP-UT") - BREPAA(F,"PRODUCTION")/BREPAA(F,"ECAP-TOT");16931694 REPAM(R,J) = XF.L(R,J);1695 REPAM("**TOTAL**",J) = SUM(R, REPAM(R,J));1696 REPAM(R,"SHIPPED") = SUM(J, REPAM(R,J));1697 REPAM(R,"PRODUCTION") - A("ALUMINUM","SMELTING")*Z.L("SMELTING",R);1698 REPAM(R,"ECAP-TOT") = UT("SMELTER")*(CAPR(R,"SMELTER")+HR.L(R,"SMELTER"));1699 REPAM(R,"NCAP-TOT") = (CAPR(R,"SMELTER")+HR.L(R,"SMELTER"));17001701 REPAM(R,"NCAP-EXIST") = CAPRI(R,"SMELTER");1702 REPAM(R,"NCAP-COM") = CAPR2(R,"SMELTER");1703 REPAM(R,"NCAP-NEW") - HR.L(R,"SMELTER");1704 REPAM(R,"ECAP-UT") = B("SMELTER","SMELTING")*Z.L("SMELTING",R)/REPAM(R,"ECAP-TOT");1705 REPAM("**TOTAL**",RCOL) - SUM(R, REPAM(R,RCOL));1706 REPAM("**TOTAL**","ECAP-UT") = REPAM("**TOTAL**","PRODUCTION")/REPAM("**TOTAL**","ECAP-TOT");17071708 AREPAM(G,RCOL) SUM(R$GR(G,R),REPAM(R,RCOL));1709 AREPAM(G,GP) = SUM((R,J)$(GR(G,R)*GJ(GP,J)), REPAM(R,J));1710 AREPAM("**TOTAL**",G) - SUM(GP, AREPAM(GP,G));1711 AREPAM("**TOTAL**",RCOL) - REPAM("**TOTAL**",RCOL);1712 AREPAM(G,"ECAP-UT") - AREPAM(G,"PRODUCTION")/AREPAM(G,"ECAP-TOT");1713

GAMS 1.0 WORLD ALUMINUM MODEL DATA AND MODEL DEFINITION 04/19/83 11.06.05. PAGE 41REPORT
1714 BREPAM(F,RCOL) = SUM(G$FG(F,G),AREPAM(G,RCOL));1715 BREPAM(F,FP) = SUM((G,GP)$(FG(F,G)*FG(FP,GP)), AREPAM(G,GP));1716 BREPAM("**TOTAL**",F) - SUM(FP, BREPAM(FP,F));1717 BREPAM("**TOTAL**",RCOL) = AREPAM("**TOTAL**",RCOL);1718 BREPAM(F,"ECAP-UT") - BREPAM(F,"PRODUCTION")/BREPAM(F,"ECAP-TOT");171917201721 DISPLAY BREPB,BREPAA,BREPAM,AREPB,AREPAA,AREPAM,REPB,REPAA,REPAM;17221723 REPEL(R,L) = U.L(L,R);1724 REPEL(R,"EL-TOTAL") = SUM(L, REPEL(R,L));1725 REPEL(R,"EL-COST") = SUM(L, REPEL(R,L)*PRELEC(R,L))/1000;1726 REPEL(R,"AV-COST") = (REPEL(R,"EL-COST")/REPEL(R,"EL-TOTAL"))*1000;1727 REPEL("**TOTAL**",RCOLEL) = SUM(R, REPEL(R,RCOLEL));1728 REPEL("**TOTAL**","AV-COST") = (REPEL("**TOTAL**","EL-COST")/REPEL("**TOTAL**","EL-TOTAL"))*1000;1729 REPEL(R,"COST/TON") = (REPEL(R,"EL-COST")/REPAM(R,"PRODUCTION"))*1000;17301731 AREPEL(G,RCOLEL) = SUM(R$GR(G,R), REPEL(R,RCOLEL));1732 AREPEL("**TOTAL**",RCOLEL) = REPEL("**TOTAL**",RCOLEL);1733 AREPEL(G,"AV-COST") = (AREPEL(G,"EL-COST")/AREPEL(G,"EL-TOTAL"))*1000;1734 AREPEL("**TOTAL**","AV-COST") = REPEL("**TOTAL**","AV-COST");1735 AREPEL(G,0COST/TON") = (AREPEL(G,"EL-COST")/AREPAM(G,"PRODUCTION"))*1000;17361737 BREPEL(F,RCOLEL) = SUM(G$FG(F,G), AREPEL(G,RCOLEL));1738 BREPEL("**TOTAL**",RCOLEL) = AREPEL("**TOTAL**",RCOLEL);1739 BREPEL(F,"AV-COST") = (BREPEL(F,"EL-COST")/BREPEL(F,"EL-TOTAL"))*1000;1740 BREPEL(-**TOTAL**","AV-COST") = AREPEL("**TOTAL**","AV-COST"); L
1741 BREPEL(F,7COST/TON") - (BREPEL(F, EL-COST )/BREPAM(F,"PRODUCTION ))*1000;17421743 REPEL("**TOTAL**","COST/TON") = (REPEL("**TOTAL**","EL-COST")/REPAM("**TOTAL**","PRODUCTION"))*1000;1744 AREPEL("**TOTAL**","COST/TON") = REPEL("**TOTAL**","COST/TON");1745 BREPEL("**TOTAL**","COST/TON") - REPEL("**TOTAL**","COST/TON");17461747 DISPLAY REPEL,AREPEL,BREPEL;1748 DISPLAY PHIKM.L,PHIKR.L,PHIOM.L,PHIOR.L,PHIT.L,PHITF.L,PHIL.L,PHI1.L,PHI2.L,PHI3.L,PHI4.L;

GAMS 1.0 WORLD ALUMINUM MODEL DATA AND MODEL DEFINITION 04/19/83 11.06.05. PAGE 42REFERENCE MAP OF VARIABLES
VARIABLES TYPE REFERENCES
A PARAM REF 308 309 710 1316 1317 1349 1364 1365 13661368 1369 1370 1371 1372 1379 1380 1381 1384 13851386 1387 1388 1389 1431 1463 1552 1573 2*1667 1697
DEFINED 269 DCL 269AAA PARAM REF 1314 1323 2*1359 DEFINED 1313 DCL 1313AATOAL PARAM REF 310 1237 1239 1318 DEFINED 309 DCL 267ABS FUNCT REF 710AKM EQU DEFINED 1585 DCL 1539AKR EQU DEFINED 1587 DCL 1540AL EQU DEFINED 1592 DCL 1545ALPHAA PARAM REF 1212 1380 1590 DEFINED 1211 DCL 1118ALPHAL PARAM REF 1240 1397 1448 1453 1480 1489 1589 DEFINED 1189
DCL 1189AOM EQU DEFINED 1578 DCL 1541AOR EQU DEFINED 1580 DCL 1542AR SET REF 1431 DEFINED 261 CONTROL 1431 DCL 261AREPAA PARAM REF 1684 2*1686 1688 1689 1691 1721 DEFINED 1682 1683
1684 1685 1686 DCL 1622AREPAM PARAM REF 1710 2*1712 1714 1715 1717 1721 1735 DEFINED 1708
1709 1710 1711 1712 DCL 1626AREPB PARAM REF 1652 2*1654 1656 1657 1659 1721 DEFINED 1650 1651
1652 1653 1654 DCL 1618AREPEL PARAM REF 2*1733 1735 1737 1738 1740 1747 DEFINED 1731 1732
1733 1734 1735 1744 DCL 1630AT EQU DEFINED 1582 DCL 1543ATF EQU DEFINED 1589 DCL 1544Al EQU DEFINED 1595 DCL 1546A4 EQU DEFINED 1597 DCL 1547B PARAM REF 1316 1350 1429 1430 1461 1463 1561 1678 1704
DEFINED 295 DCL 295BATOAA PARAM REF 310 1237 1319 DEFINED 308 DCL 266BBB PARAM REF 1323 1361 DEFINED 1314 DCL 1313BETAA PARAM REF 1239 1240 1380 1451 1484 1593 DEFINED 1228 1239
DCL 1228BETAB PARAM REF 1237 1240 1312 1366 1450 1482 1592 DEFINED 1216
1237 DCL 1216BETABP PARAM REF 1314 2*1322 1359 DEFINED 1312 DCL 1307BREPAA PARAM REF 1690 2*1692 1721 DEFINED 1688 1689 1690 1691 1692
DCL 1623BREPAM PARAM REF 1716 2*1718 1721 1741 DEFINED 1714 1715 1716 1717
1718 DCL 1627BREPB PARAM REF 1658 2*1660 1721 DEFINED 1656 1657 1658 1659 1660
DCL 1619BREPEL PARAM REF 2*1739 1741 1747 DEFINED 1737 1738 1739 1740 1741
1745 DCL 1631C SET REF 138 140 142 144 1496 1527 5*1552 4*1553 DEFINED
124 CONTROL 1552 DCL 124CAPM PARAM REF 363 1428 1436 1438 1459 1468 1472 1559 1640
1641 DEFINED 362 DCL 323CAPM14 PARAM REF 361 2*362 1642 1643 DEFINED 331 DCL 331

GAMS 1.0 WORLD ALUMINUM MODEL DATA AND MODEL DEFINITION 04/19/83 11.06.05. PAGE 43REFERENCE MAP OF VARIABLES
VARIABLES TYPE REFERENCES
CAPR PARAM REF 433 1429 1430 1433 1434 1437 1461 1465 14661469 1561 1672 1673 1698 1699 DEFINED 432 DCL 325
CAPRI PARAM REF 432 501 1674 1701 DEFINED 366 DCL 366CAPR2 PARAM REF 432 1675 1702 DEFINED 401 DCL 401CASE SET REF 1268 1279 2*1346 1356 1357 1358 1359 2*1360 1361
3*1362 4*1364 1365 1366 2*1367 1368 1369 1370 1371 13725*1373 1374 1375 4*1376 2*1379 1380 1381 2*1382 1383 1384
1385 1386 1387 1388 1389 5*1390 3*1391 1392 4*1393 2*13951396 1397 2*1398 DEFINED 1266 CONTROL 1346 DCL 1266
CC SET REF 317 DEFINED 312 DCL 312CCM EQU DEFINED 1559 DCL 1529CCR EQU DEFINED 1561 DCL 1530CELCOST PARAM REF 1336 1340 1383 DEFINED 1335 1336 DCL 1327CELI PARAM DCL 1327CF SET REF 1553 DEFINED 138 DCL 138CI SET REF 267 309 1237 1239 1552 2*1553 1573 DEFINED 140
CONTROL 309 1237 1239 1573 DCL 140CL SET REF 1553 DEFINED 142 DCL 142CLAB SET REF 1360 1367 1382 1398 DEFINED 1254 CONTROL 1360 1367
1382 1398 DCL 1254CM SET REF 250 266 308 633 648 655 656 657 658
2*662 2*1237 1245 1247 2*1316 1317 1318 1319 1343 13481353 1364 1365 1366 1450 1498 1526 1535 4*1550 1552
3*1557 2*1559 3*1571 2*1578 2*1583 2*1592 1634 1638 DEFINED 144CONTROL 308 633 655 656 657 658 662 1237 1245
1247 1316 1318 1348 1353 1450 1550 1557 1559 15711578 1583 1592 1634 1638 DCL 144
CMI SET REF 689 702 704 2*710 1409 1437 1469 DEFINED 146CONTROL 704 710 1437 1469 DCL 146
CMM SET REF 1349 1351 1353 DEFINED 1348 CONTROL 1349 DCL 1343CNIR SET REF 1252 1450 1592 DEFINED 1247 DCL 1243COMB1 SET REF 1346 DEFINED 1268 DCL 1268COMB2 SET REF 1346 DEFINED 1279 DCL 1279COSTRS PARAM REF 710 712 1368 1369 1370 1371 1372 1384 1385
1386 1387 1388 1389 1437 1470 DEFINED 704 705 DCL702
COTC SET REF 777 850 976 977 3*1006 DEFINED 770 CONTROL 1005DCL 770
COTCF SET DEFINED 777 CONTROL 996 1002 DCL 777CPOSPI SET REF 1247 1252 2*1550 1552 2*1557 1559 1571 1578 1583
DEFINED 1245 DCL 1242D PARAM REF 1448 1480 1555 DEFINED 248 1601 DCL 200DC1 SET REF 2*1459 DEFINED 1428 DCL 1402DC10 SET REF 2*1473 DEFINED 1440 DCL 1412DC11 SET REF 2*1474 DEFINED 1441 DCL 1413DC12 SET REF 2*1475 DEFINED 1442 DCL 1414DC13 SET REF 2*1476 DEFINED 1443 DCL 1415DC14 SET REF 1477 1478 DEFINED 1445 DCL 1417DC15 SET REF 2*1479 DEFINED 1446 DCL 1418DC16 SET REF 2*1480 DEFINED 1448 DCL 1419

GAMS 1.0 WORLD ALUMINUM MODEL DATA AND MODEL DEFINITION 04/19/83 11.06.05. PAGE 44REFERENCE MAP OF VARIABLES
VARIABLES TYPE REFERENCES
DC17 SET DCL 1420DC18 SET REF 1481 1482 DEFINED 1450 DCL 1422DC19 SET REF 1483 1484 DEFINED 1451 DCL 1423DC20 SET REF 1485 1487 DEFINED 1452 DCL 1424DC21 SET REF 1488 1489 DEFINED 1453 DCL 1425DC3 SET REF 1460 1461 DEFINED 1429 DCL 1403DC4 SET REF 1462 1463 DEFINED 1430 DCL 1404DC5 SET REF 2*1464 DEFINED 1433 DCL 1405DC6 SET REF 2*1466 DEFINED 1434 DCL 1407DC7 SET REF 2*1468 DEFINED 1436 DCL 1408DC8 SET REF 2*1469 DEFINED 1437 DCL 1409DC9 SET REF 1471 1472 DEFINED 1438 DCL 1410DEM2000 PARAM REF 248 1601 DEFINED 225 DCL 225DMP PARAM REF 1028 1443 1476 DEFINED 818 DCL 818EC1 SET DEFINED 315 DCL 315EGYRES PARAM REF 2*503 2*507 509 511 515 1433 1434 1445 2*1446
1447 1465 1467 1478 1479 DEFINED 448 DCL 448F SET REF 110 118 120 122 191 193 194 195 1536
1537 1538 2*1571 1573 2*1574 2*1576 1656 1657 1658 2*16601688 1689 1690 2*1692 1714 1715 1716 2*1718 1737 2*1739
2*1741 DEFINED 77 CONTROL 193 194 195 1571 1573 15761656 1657 1658 1660 1688 1689 1690 1692 1714 17151716 1718 1737 1739 1741 DCL 77
FCP PARAM REF 1006 1031 DEFINED 990 996 1002 DCL 977 wFDB EQU DEFINED 1555 DCL 1528FG SET REF 193 194 195 1656 2*1657 1688 2*1689 1714 2*1715
1737 DEFINED 110 DCL 110FI SET REF 196 661 664 1571 DEFINED 194 DCL 120FJ SET REF 196 1576 DEFINED 195 DCL 122FP SET REF 1657 1658 1689 1690 1715 1716 CONTROL 1657 1658
1689 1690 1715 1716 DCL 191FR SET REF 196 1571 1573 2*1574 1576 DEFINED 193 DCL 118FRAA SET REF 1116 DEFINED 1085 DCL 1085FREIGHT SET REF 977 2*1006 DEFINED 772 CONTROL 1006 DCL 772FRTRADE SET REF 1115 DEFINED 1066 DCL 1066G SET REF 80 90 100 110 191 2*193 2*194 2*195 1650
1651 1652 2*1654 2*1656 2*1657 1682 1683 1684 2*1686 2*16882*1689 1708 1709 1710 2*1712 2*1714 2*1715 1731 2*1733 2*17352*1737 DEFINED 73 CONTROL 193 194 195 1650 1651 1652
1654 1656 1657 1682 1683 1684 1686 1688 1689 17081709 1710 1712 1714 1715 1731 1733 1735 1737 DCL
73GAM MODEL REF 1608 DEFINED 1607 DCL 1607GAMMA PARAM REF 1571 1573 1576 DEFINED 1163 1602 DCL 1163GI SET REF 194 668 669 670 671 1650 1651 DEFINED 80
DCL 80GJ SET REF 195 1709 DEFINED 100 DCL 100GP SET REF 1651 1652 2*1657 1683 1684 2*1689 1709 1710 .2*1715
CONTROL 1651 1652 1657 1683 1684 1689 1709 1710 1715DCL 191

GAIMS 1.0 WORLD ALUMINUM MODEL DATA AND MODEL DEFINITION 04/19/83 11.06.05. PAGE 45REFERENCE MAP OF VARIABLES
VARIABLES TYPE REFERENCES
GR SET REF 193 2*538 540 1651 1682 2*1683 1708 1709 1731DEFINED 90 DCL 90HM VAR REF 1518 1559 1563 1640 1641 1644 DCL 1500HR VAR REF 1518 1561 1565 1672 1673 1677 1698 1699 1703DCL 1501I SET REF 80 120 194 202 204 222 250 323 324331 361 2*362 523 525 527 552 554 556 569580 581 582 2*633 634 635 2*636 2*637 2*641 2*642648 649 655 656 657 658 661 3*662 664 2*665668 669 670 671 677 684 685 686 3*723 2*7274*729 4*733 4*737 748 749 750 783 818 1019 10201028 2*1029 1035 1216 2*1237 1245 2*1247 1268 1300 13121313 3*1314 1316 1317 2*1318 3*1321 3*1322 1346 1348 13562*1357 1358 4*1359 2*1361 1365 2*1366 1402 1408 1410 14121415 1422 2*1428 2*1436 4*1438 1440 1443 3*1450 1459 14681471 2*1473 1476 1481 1496 1498 1500 1502 1504 15261529 1531 1533 1535 5*1550 2*1552 4*1557 4*1559 3*1563 2*15674*1571 3*1578 3*1583 2*1585 3*1592 1634 1635 1636 1637 16382*1640 2*1641 1642 1643 1644 2*1646 1647 2*1650 2*1651 DEFINED54 CONTROL 194 222 361 362 580 581 582 633634 635 636 637 639 640 641 642 655 656657 658 660 661 662 663 664 665 667 668669 670 671 673 677 678 680 723 727 729733 737 1019 1020 1028 1029 1237 1245 1247 13121313 1314 1316 1318 1321 1322 1346 1428 1436 14381440 1443 1450 1459 1468 1471 1473 1476 1481 15501552 1557 1559 1563 1567 1571 1578 1583 1585 15921634 1635 1636 1637 1638 1640 1641 1642 1643 16441646 1647 1650 1651 DCL 54ICC SET REF 597 DEFINED 529 DCL 529IEM PARAM REF 634 635 644 DEFINED 633 DCL 556IER PARAM DCL 557IHIGH SET DEFINED 580 CONTROL 583 DCL 523ILOW SET DEFINED 582 CONTROL 583 DCL 527IMID SET DEFINED 581 CONTROL 583 DCL 525IN SET REF 1019 1440 1473 DEFINED 783 DCL 783INFAC PARAM REF 619 620 644 DEFINED 564 565 566 DCL 562INFMI PARAM REF 580 581 582 633 644 1436 1468 DEFINED 569DCL 569INTERVAL PARAM REF 1557 DEFINED 198 DCL 198INV PARAM REF 3*616 3*617 619 620 627 634 635 640 644DEFINED 597 616 617 DCL 597IP PARAM REF 621 622 2*623 2*624 628 629 630 631 6362*637. 641 642 644 DEFINED 609 DCL 609i1M EQU DEFINED 1563 DCL 1531IIR EQU DEFINED 1565 DCL 1532I2M EQU DEFINED 1567 DCL 1533I2R EQU DEFINED 1569 DCL 1534J SET REF 100 122 195 200 248 752 805 1026 10661110 1115 1189 1279 1346 1396 2*1397 1414 1419 1420

GAMS 1.0 WORLD ALUMINUM MODEL DATA AND MODEL DEFINITION 04/19/83 11.06.05. PAGE 46REFERENCE MAP OF VARIABLES
VARIABLES TYPE REFERENCES
1425 1442 2*1448 3*1453 2*1475 1480 1488 1494 1528 15532*1555 3*1576 2*1582 3*1589 1601 1694 1695 1696 2*1709 DEFINED
67 CONTROL 195 248 1026 1115 1346 1442 1448 14531475 1480 1488 1553 1555 1576 1582 1589 1601 16941695 1696 1709 DCL 67
JN SET REF 1026 1442 1475 DEFINED 805 DCL 805L SET REF 1106 1119 1158 1499 2*1553 2*1580 1604 1723 1724
2*1725 DEFINED 159 CONTROL 1158 1553 1580 1604 1723 17241725 DCL 159
LIFE PARAM REF 2*591 593 DEFINED 589 DCL 548LL80 SET DEFINED 1106 DCL 1106LTS PARAM REF 1314 1317 1318 1359 DEFINED 1300 DCL 1300L80 SET REF 1106 DEFINED 1104 DCL 1104M SET REF 185 187 295 317 325 328 401 2*432 444
553 555 3*616 619 620 627 1343 1350 1353 3*13751403 2*1429 2*1430 1437 1460 1501 1503 1505 1530 15321534 4*1561 3*1565 2*1569 2*1587 4*1672 3*1673 2*1674 2*1675 2*1677
2*1678 DEFINED 177 CONTROL 432 444 616 619 620 626627 1350 1353 1429 2*1430 1437 1460 1561 1565 1569
1587 1672 1673 1674 1675 1677 1.678 DCL 177MAPCC SET DEFINED 317 DCL 317MAX FUNCT REF 979MBM EQU DEFINED 1550 DCL 1526MBR EQU DEFINED 1552 DCL 1527MCC SET REF 685 1438 DEFINED 646 CONTROL 2*1438 DCL 646MDATA PARAM REF 662 2*665 677 681 3*723 2*727 4*729 2*733 2*737
DEFINED 660 661 662 663 664 665 667 668 669670 671 673 674 675 677 678 680 DCL 649
MFC PARAM REF 733 737 1438 1472 DEFINED 727 729 DCL 685MLC PARAM REF 733 737 1438 1472 DEFINED 723 DCL 684MMM SET REF 1351 1353 DEFINED 1350 DCL 1343MODES SET REF 815 818 846 2*1028 1415 2*1443 1476 DEFINED 767
CONTROL 1028 1443 1476 DCL 767MPC PARAM REF 1028 1443 1476 DEFINED 846 DCL 846MR SET REF 621 623 628 630 1316 2*1317 DEFINED 185 CONTROL
621 623 628 630 1316 DCL 185MS SET REF 622 624 629 631 DEFINED 187 CONTROL 622 624
629 631 DCL 187MUF PARAM REF 1031 1396 1453 1489 1582 DEFINED 1026 DCL 752MUFX PARAM REF 1026 DEFINED 1025 DCL 1017MUI PARAM REF 1031 1381 1451 1452 1484 1487 1582 DEFINED 1023
DCL 751MUIX PARAM REF 1023 DEFINED 1022 DCL 1016MUR PARAM REF 1031 1583 DEFINED 1029 DCL 748MURL PARAM REF 1029 1031 1358 DEFINED 1028 DCL 750MURS PARAM REF 1029 1031 1365 1450 1482 DEFINED 1020 DCL 749MURSX PARAM REF 1020 DEFINED 1019 DCL 1015N SET REF 763 765 783 793 805 813 814 815 863
976 977 2*979 990 2*996 2*1002 1005 2*1006 2*1019 2*10222*1025 1440 1441 1442 1473 1474 1475 DEFINED 754 CONTROL

GAMS 1.0 WORLD ALUMINUM MODEL DATA AND MODEL DEFINITION 04/19/83 11.06.05. PAGE 47REFERENCE MAP OF VARIABLES
VARIABLES TYPE REFERENCES
813 979 990 996 1002 1005 1019 1022 1025 14401441 1442 DCL 754
NFAA SET REF 1113 1380 1451 1452 1590 DEFINED 1116 DCL 1111NFTRADE SET REF 1113 1397 1453 1589 DEFINED 1115 DCL 1110NIR SET REF 1247 1313 1321 1366 DEFINED 1035 DCL 1035NL SET REF 815 2*996 2*1002 DEFINED 813 DCL 763NMAA1980 PARAM REF 223 DEFINED 212 DCL 212NMAA2000 PARAM REF 1553 1666 DEFINED 223 DCL 201NMBA1980 PARAM REF 222 DEFINED 204 DCL 204NMBA2000 PARAM REF 1550 1637 DEFINED 222 DCL 202NP SET REF 863 976 977 2*979 990 2*996 2*1002 1005 2*1006
1019 2*1020 1022 2*1023 1025 2*1026 CONTROL 979 990 9961002 1005 1019 1020 1022 1023 1025 1026 DCL 814
NS SET REF 813 815 DEFINED 765 DCL 765OBR PARAM REF 2*662 681 DEFINED 655 656 657 658 DCL 648OM PARAM REF 740 1356 1438 1472 1578 DEFINED 733 737 DCL
686OMEGAM PARAM REF 636 637 644 1357 1585 DEFINED 634 635 636
637 DCL 552OMEGAR PARAM REF 621 622 623 624 644 1317 1318 1375 1392
1587 DEFINED 619 620 621 622 623 624 DCL 553ONE1 PARAM REF 580 DEFINED 578 DCL 578ONE2 PARAM REF 581 582 DEFINED 578 DCL 578ORS PARAM REF 712 740 1580 DEFINED 710 DCL 683ORSL PARAM REF 705 DEFINED 694 DCL 694ORSWL PARAM REF 704 DEFINED 689 DCL 689OTC PARAM REF 2*1006 1031 DEFINED 850 DCL 850P SET REF 295 308 309 683 710 2*1316 1317 1343 1349
1353 1364 1365 1366 1368 1369 1370 1371 1372 14041429 1430 1431 1462 1497 2*1552 2*1561 2*1580 3*1667 2*1678
DEFINED 164 CONTROL 308 309 710 1316 1349 1353 14291430 1462 1552 1561 1580 1667 1678 DCL 164
PA PARAM REF 1211 DEFINED 1162 DCL 1162PELEC PARAM REF 1158 DEFINED 1122 DCL 1122PHIKM VAR REF 1585 1595 1597 1748 DCL 1506PHIKR VAR REF 1587 1595 1597 1748 DCL 1507PHIL VAR REF 1592 1595 1748 DCL 1512PRIOM VAR REF 1578 1595 1597 1748 DCL 1508PHIOR VAR REF 1580 1595 1597 1748 DCL 1509PHIT VAR REF 1582 1595 1597 1748 DCL 1510PHITF VAR REF 1589 1595 1748 DCL 1511PHI1 VAR REF 1595 1748 DCL 1513PHI2 VAR REF 1748 DCL 1514PHI3 VAR REF 1748 DCL 1515PHI4 VAR REF 1597 1608 1748 DCL 1516PL PARAM REF 1312 1366 1380 1397 1589 1592 DEFINED 1250 1305
1600 DCL 1249PO SET DEFINED 44 DCL 44PRELEC PARAM REF 1159 1335 1445 1446 1478 1479 1553 1580 1725
DEFINED 1158 DCL 1119

GAMS 1.0 WORLD ALUMINUM MODEL DATA AND MODEL DEFINITION 04/19/83 11.06.05. PAGE 48REFERENCE MAP OF VARIABLES
VARIABLES TYPE REFERENCES
PROC SET REF 1350 1351 1353 DEFINED 1349 CONTROL 1350 DCL 1343
R SET REF 90 118 191 193 201 212 223 325 326366 401 2*432 448 501 3*503 2*507 517 519 521
2*538 540 2*542 553 555 557 562 619 620 2*6212*622 2*623 2*624 2*628 2*629 2*630 2*631 683 694 702
705 710 748 749 751 752 793 1020 1022 1023
1025 1026 1029 1035 2*1053 1061 1066 1085 1110 11111115 1116 1119 1122 1158 1167 1228 1239 1247 12681300 1313 2*1314 3*1317 3*1318 3*1321 1327 2*1335 1336 1346
3*1359 1361 1365 1366 1368 1369 1370 1371 1372 2*13753*1380 1381 1403 1404 1405 1407 1409 1413 1417 1418
1422 1423 1424 1425 1429 1430 2*1433 3*1434 2*1437 14412*1445 3*1446 1447 2*1450 3*1451 2*1452 2*1453 1460 1462 1464
1466 1469 2*1474 1477 1479 1481 1483 1485 1488 14941495 1496 1497 1499 1501 1503 1505 1527 1530 15321534 1550 3*1552 5*1553 1555 3*1561 3*1565 2*1569 3*1571 2*1573
2*1574 3*1576 4*1580 4*1582 2*1583 2*1587 2*1589 2*1590 2*1592 3*1593
1604 1634 1635 1636 2*1651 1665 1666 1667 4*1668 2*16701671 2*1672 2*1673 1674 1675 1677 2*1678 1679 2*1682 2*16831694 1695 1696 1697 2*1698 2*1699 1701 1702 1703 2*17041705 2*1708 2*1709 1723 1724 2*1725 2*1726 1727 2*1729 2*1731
DEFINED 60 CONTROL 193 223 432 501 503 507 2*538540 542 619 620 621 622 623 624 626 627 H
628 629 630 631 704 705 710 1020 1022 10231025 1026 1029 1061 1115 1116 1158 1239 1247 13131314 1316 1318 1321 1335 1336 1346 1429 1430 1433
1434 1437 1441 1445 1446 1450 1451 1452 1453 14601462 1464 1466 1469 1474 1477 1479 1481 1483 14851488 1550 1552 1555 1561 1565 1569 1571 1573 15741576 2*1580 1582 1587 1589 1590 1592 1593 1604 16051634 1635 1636 1651 1665 1666 1667 1668 1670 16711672 1673 1674 1675 1677 1678 1679 1682 1683 16941695 1696 1697 1698 1699 1701 1702 1703 1704 17051708 1709 1723 1724 1725 1726 1727 1729 1731 DCL
60RCOL SET REF 1647 1650 1653 1656 1659 1679 1682 1685 1688
1691 1705 1708 1711 1714 1717 DFFINED 1610 CONTROL 16471650 1653 1656 1659 1679 1682 1685 1688 1691 17051708 1711 1714 1717 DCL 1610
RCOLEL SET REF 1727 1731 1732 1737 1738 DEFINED 1613 CONTROL 17271731 1732 1737 1738 DCL 1613
REPAA PARAM REF 3*1668 2*1670 1671 1678 1679 2*1680 1682 1683 16851721 DEFINED 1665 1666 1667 1668 1670 1671 1672 16731674 1675 1677 1678 1679 1680 DCL 1621
REPAM PARAM REF 1695 1696 1704 1705 2*1706 1708 1709 1711 17211729 1743 DEFINED 1694 1695 1696 1697 1698 1699 17011702 1703 1704 1705 1706 DCL 1625
REPB PARAM REF 1635 1636 2*1646 1647 2*1648 1650 1651 1653 1721DEFINED 1634 1635 1636 1637 1638 1640 1641 1642 1643
1644 1646 1647 1648 DCL 1617

GAMS 1.0 WORLD ALUMINUM MODEL DATA AND MODEL DEFINITION 04/19/83 11.06.05. PAGE 49REFERENCE MAP OF VARIABLES
VARIABLES TYPE REFERENCES
REPEL PARAM REF 1724 1725 2*1726 1727 2*1728 1729 1731 1732 17341743 1744 1745 1747 DEFINED 1723 1724 1725 1726 17271728 1729 1743 DCL 1629
RES EQU DEFINED 1557 DCL 1535RHIGH SET REF 542 546 DEFINED 2*538 CONTROL 544 564 DCL 517RHO PARAM REF 3*591 593 DEFINED 587 DCL 549RLOW SET REF 542 546 DEFINED 4*540 CONTROL 544 566 DCL 521RMID SET REF 546 DEFINED 542 CONTROL 544 565 DCL 519RN SET REF 1020 1022 1023 1025 1441 1474 DEFINED 793 DCL
793RP SET REF 751 815 1023 1085 1111 1116 1118 1211 1279
2*1321 1346 3*1380 1381 1383 1384 1385 1386 1387 13881389 2*1392 1396 1397 1423 1424 2*1451 3*1452 1483 14851495 1552 1553 2*1574 2*1582 3*1590 2*1593 1665 1668 1671
2*1683 CONTROL 1023 1116 1211 1321 1346 1451 1452 14831485 1552 1553 1574 1582 1590 1593 1665 1668 16711683 DCL 191
RR SET REF 1321 1380 1593 DEFINED 1053 1061 DCL 1053SBM PARAM REF 641 642 644 1357 1563 DEFINED 639 640 641
642 DCL 554SBR PARAM REF 628 629 630 631 644 1317 1318 1375 1392
1565 DEFINED 626 627 628 629 630 631 DCL 555SD PARAM REF 2*979 990 996 1002 1005 1006 1031 DEFINED 863
979 DCL 863SEACOST PARAM REF 1019 1022 1025 1031 DEFINED 1005 DCL 976SEG SET REF 552 553 554 555 1502 1503 2*1563 2*1565 1567
1569 2*1585 2*1587 DEFINED 189 CONTROL 1563 1565 1567 15691585 1587 DCL 189
SIGMA PARAM REF 593 1357 1375 1392 1585 1587 DEFINED 591 DCL550
SIN1 SET REF 609 2*621 2*622 3*623 3*624 2*628 2*629 2*630 2*6312*636 3*637 2*641 2*642 DEFINED 531 CONTROL 621 622 623
624 628 629 630 631 636 637 641 642 DCL531
SIN2 SET REF 621 622 623 624 628 629 630 631 DEFINED3*544 DCL 533
SIN3 SET REF 636 637 641 642 DEFINED 3*583 DCL 535SM VAR REF 1518 1563 1567 1585 DCL 1502SMELT SET REF 1672 1673 1674 1675 1677 1678 DEFINED 1663 DCL
1663SR VAR REF 1518 1565 1569 1587 DCL 1503SRATIO PARAM REF 633 655 656 657 658 681 1237 1245 1316
1318 1348 DEFINED 250 DCL 250STR1 PARAM REF 656 DEFINED 652 DCL 652STR2 PARAM REF 657 DEFINED 652 DCL 652STR3 PARAM REF 658 DEFINED 652 DCL 652TAA EQU DEFINED 1573 DCL 1537TAL EQU DEFINED 1576 DCL 1538TARIFFAA PARAM REF 1211 1452 1487 DEFINED 1167 DCL 1167TAXS2 PARAM REF 1322 1323 1361 DEFINED 1321 1322 DCL 1310

CAMS 1.0 WORLD ALUMINUM MODEL DATA AND MODEL DEFINITION 04/19/83 11.06.05. PAGE 50REFERENCE MAP OF VARIABLES
VARIABLES TYPE REFERENCES
TAXIA PARAM REF 1321 1323 DEFINED 1316 DCL 1308TAXIB PARAM REF 1321 1323 DEFINED 1318 DCL 1309TBA EQU DEFINED 1571 DCL 1536U VAR REF 1518 1553 1580 1723 DEFINED 1604 1605 DCL 1499UBAR PARAM REF 503 509 515 1335 1434 1467 1604 DEFINED 501
503 505 507 509 511 513 DCL 326UT PARAM REF 2*444 1357 1375 1392 1640 1672 1698 DEFINED 435
DCL 435UTM PARAM REF 445 1559 DEFINED 444 DCL 327UTR PARAM REF 445 1561 DEFINED 444 DCL 328XF VAR REF 1518 1553 1555 2*1576 1582 1589 1694 DCL 1494XI VAR REF 1518 1552 1553 1574 1582 1590 1593 1665 DCL
1495XM VAR REF 1518 1550 1552 2*1571 1583 1592 1634 DCL 1496Xi PARAM REF 1360 2*1362 3*1364 1400 DEFINED 1356 1357 1358 1359
1360 1361 1362 DCL 1290X2 PARAM REF 1367 4*1373 1374 3*1376 1379 1400 DEFINED 1364 1365
1366 1367 1368 1369 1370 1371 1372 1373 1375 1376DCL 1291
X3 PARAM REF 1382 4*1390 3*1391 3*1393 1395 1400 DEFINED 1379 13801381 1382 1383 1384 1385 1386 1387 1388 1389 13901392 1393 DCL 1292
X4 PARAM REF 1398 1400 DEFINED 1395 1396 1397 1398 DCL 1293YM VAR REF 1519 1567 DCL 1504YR VAR REF 1519 1569 DCL 1505Z VAR REF 1518 1552 1561 1573 1580 1667 1678 1697 1704
DCL 1497ZM VAR REF 1518 1550 1557 1559 1578 1638 DCL 1498ZMBAR PARAM REF 363 1428 1459 1557 DEFINED 361 DCL 324
SETS
AR ROW LABELS FOR MATRIX AC COMMODITIESCASE CASE IDENTIFICATION NUMBERSCC COLUMN LABELS FOR INITIAL CAPACITY AND RESERVES MATRIXCF FINAL PRODUCTSCI INTERMEDIATESCL ELECTRICITYCLAB LABELSCM BAUXITESCMI MISCELLANEOUS INPUTSCMMCNIR REGIONAL CLUSTERS WITH LEVIES ON BAUXITE SHIPMENTS FROM I TO RCOMB1 COMBINATIONS: CASE-MINES-REFINERIESCOMB2 COMBINATIONS: CASES-SMELTERS-MARKETSCOTC COMMODITIES FOR OCEAN TRANSPORT COST DETERMINATIONCOTCF FREIGHT COMMODITIES WITH BILEVEL FREIGHT CHARGESCPOSPI COMMODITY PRODUCTION POSSIBILITIES AT MINESDC1 INCONSISTENCY BETWEEN MINE CAPACITIES AND RESERVES

GAMS 1.0 WORLD ALUMINUM MODEL DATA AND MODEL DEFINITION 04/19/83 11.06.05. PAGE 51REFERENCE MAP OF VARIABLES
SETS
DCIO UNMAPPED MINES TO PORTSDCI1 UNMAPPED PRODUCTION CENTERS TO PORTSDC12 UNMAPPED MARKETS TO PORTSDC13 MINES HAVING NONZERO DISTANCES TO PORTS BUT ZERO COSTDC14 REFINERIES AND SMELTERS WITH ELECTRICITY AVAILABLE FROM EXISTING CHEAP POWER SOURCES BUT NO COSTDC15 REFINERIES AND SMELTERS WITH LOW COST FUTURE POWER SOURCES BUT AT NO COSTDC16 MARKETS HAVING A NONZERO TARIFF ON IMPORTED ALUMINUM BUT ZERO DEMANDDC17 INCONSISTENCY BETWEEN THE WORLD PRICE OF ALUMINUM USED AND THE ALUMINUM DEMAND LEVEL USEDDC18 NONZERO LEVY BETWEEN BAUXITE PRODUCER AND BAUXITE USER WITH PORT MAPPING BUT NO SEA TRANSPORT COSTDC19 NONZERO ALUMINA LEVY BETWEEN REFINERS WITH PORT MAPPING BUT NO SEA TRANSPORT COSTDC20 NONZERO ALUMINA TARIFFS BETWEEN REFINERS WITH PORT MAPPING BUT NO SEA TRANSPORT COSTDC21 NONZERO ALUMINUM TARIFF BETWEEN SMELTERS AND MARKETS WITH PORT MAPPING BUT NO SEA COSTDC3 PRODUCTIVE UNIT WITH CAPACITY BUT NO PROCESS TO OPERATEDC4 PRODUCTIVE UNIT HAVING CAPACITY AND PROCESS MAPPING BUT WITHOUT ANY INPUT COMMODITIESDC5 LOCATION WITH NONZERO SMELTER CAPACITY BUT WITH ZERO ELECTRICITY AVAILABILITYDC6 LOCATION WITH NONZERO SMELTER CAPACITY BUT NEGATIVE ELECTRICITY AVAILABILITYDC7 MINES WITH CAPACITY BUT NO INFRASTRUCTURE FACTORDC8 REFINERIES AND SMELTERS WITH NONZERO CAPACITY BUT ZERO OPERATING COSTDC9 MINES WITH NONZERO CAPACITY BUT WITH EITHER NO LABOR COST OR FUEL COST OR OPERATING COSTSEC1 COLUMN LABELS FOR ELECTRICAL ENERGY RESOURCES MATRIXF THREE WAY GROUPINGFG MAP OF SEVEN REGIONAL GROUPS TO THREE WAY GROUPINGFI MAP OF MINING REGIONS TO THREE WAY GROUPING § WFJ MAP OF MARKETS TO THREE WAY GROUPINGFP ALIAS FOR FFR MAP OF PRODUCING REGIONS TO THREE WAY GROUPINGFRAA NO TARIFF ON ALUMINA SHIPMENTS TO FROMFREIGHT FREIGHT CATEGORIESFRTRADE NO TARIFF ON ALUMINUM SHIPMENTS TO FROMG SEVEN REGION GROUPINGSGI MAP OF SEVEN REGIONAL GROUPS TO MINESGJ MAP OF SEVEN REGIONAL GROUPS TO MARKETSGP ALIAS FOR GGR MAP OF SEVEN REGIONAL GROUPS TO REFINERIES AND SMELTERSI MINING REGIONSICC COLUMN LABELS FOR INVESTMENT COST DATA TABLESIHIGH MINE LOCATIONS WITH HIGH LEVEL INFRASTRUCTUREILOW MINE LOCATIONS WITH LOW LEVEL INFRASTRUCTUREIMID MINE LOCATIONS WITH MEDIUM LEVEL INFRASTRUCTUREIN MINES TO PORTS MAPJ MARKETING AREASJN MARKETS TO PORTS MAPL COMMODITY - ELECTRICITY SUPPLY TYPESLL80 MAP FROM 1980 PRICE LABELSTO ELECTRICITY TYPESL80 LABELS FOR ELECTRICITY COST IN 1980M PRODUCTIVE UNITS FOR REFINING AND SMELTINGMAPCC MAP DATA LABELS FOR 1970 TO PRODUCTIVE UNITSMCC COLUMN LABELS FOR MINE OPERATING COSTS DATAMNMMODES MODES OF TRANSPORTATION BETWEEN MINES AND PORTS

GAMS 1. WORLD ALUMINUM MODEL DATA AND MODEL DEFINITION 04/19/83 11.06.05. PAGE 52
REFERENCE MAP OF VARIABLES
SETS
MR PRODUCTIVE UNITS FOR REFININGMS PRODUCTIVE UNITS FOR SMELTING
N PORTSNFAA MAPPING OF REGIONS WITH TARIFFS ON ALUMINANFTRADE MAPPING OF REGIONS AND PLANTS WITH TARIFF ON SHIPMENTS
NIR REGIONAL CLUSTERS HAVING NO LEVIES FROM I TO R
NL LARGE PORTS
NP ALIAS FOR NNS SMALL PORTS
P PROCESSES FOR REFINING AND SMELTINGPO PRINT ORDERPROCR PRODUCING REGIONS
RCOL REPORT COLUMNSRCOLEL COLUMN LABELS FOR ELECTRICITY REPORTINGRHIGH REFINERY LOCATIONS WITH HIGH LEVEL INFRASTRUCTURERLOW REFINERY LOCATIONS WITH LOW LEVEL INFRASTRUCTURE
RMID REFINERY LOCATIONS WITH MEDIUM LEVEL INFRASTRUCTURE
RN PRODUCTION LOCATIONS TO PORTS MAPRP ALIAS FOR RRR PRODUCTION CLUSTERS HAVING NO LEVIES ON ALUMINA
SEG INVESTMENT SEGMENTS H
SIN1 COST LEVEL ESCALATORS FOR INVESTMENT AT LOCATIONS
SIN2 COST LEVEL ESCALATION MAP FOR REFINERY LOCATIONSIN3 COST LEVEL ESCALATION MAP FOR MINE LOCATIONS
SMELT
PARAMETERS
A INPUT-OUTPUT COEFFICIENTS
AAMAATOAL RATIO OF ALUMINA TO ALUMINUM (WEIGHT)
ALPHAA ALUMINA TARIFFS IN US$ PER TONALPHAL TARIFF ON IMPORTED ALUMINUMAREPAA ALUMINA PRODUCTION AND CONSUMPTION (1000 TPY)
AREPAM ALUMINIUM PRODUCTION AND CONSUMPTION (1000 TPY)AREPB BAUXITE PRODUCTION AND CONSUMPTION (1000 TPY)
AREPEL ELECTRICITY REPORT BY REGIONSB CAPACITY UTILIZATION
BATOAA RATIO OF BAUXITE TO ALUMINA (WEIGHT)
BBBBETAA LEVIES ON ALUMNINA
BETAB LEVIES ON BAUXITE
BETABP CONVERT PRODUCTION OR EXPORT LEVY AT I FROM RATE TO DOLLAR
BREPAA ALUMINA PRODUCTION AND CONSUMPTION (1000 TPY)BREPAM ALUMINIUM PRODUCTION AND CONSUMPTION (1000 TPY)BREPB BAUXITE PRODUCTION AND CONSUMPTION (1000 TPY)BREPEL ELECTRICITY REPORT BY BLOCKSCAPM EXISTING AND COMMITED MINE CAPACITIES (1000 TPY)
CAPM1 MINE CAPACITIES AND RESERVES IN 1980 AND 1970

GAMS 1.0 WORLD ALUMINUM MODEL DATA AND MODEL DEFINITION 04/19/83 11.06.05. PAGE 53
REFERENCE MAP OF VARIABLES
PARAMETERS
CAPR TOTAL REFINERY AND SMELTER CAPACITIES (1000 TPY)
CAPRI CAPACITY IN 1000 TPY DEC. 1980CAPR2 COMMITTED INVESTMENTS IN 1000 TPYCELCOST ELECTRICIY COST AT SMELTER
CEL1COSTRS COST DATA FOR UNIT INPUT AT REFINERIES AND SMELTERS
D ALUMINUM DEMAND IN THE YEAR 2000 (1000 TPY)DEM2000 HIGH AND LOW DEMAND FORECASTS FOR ALUMINUM IN THE YEAR 2000 AND HISTORICAL 1980
DMP DISTANCES IN MILES FROM MINE TO PORT BY MODEEGYRES ENERGY RESOURCESFCP FREIGHT CHARGE POSSIBILITIESGAMMA COMPLEMENT OF ACTUAL TRADE FLOW
IEM MISCELLANEOUS INVESTMENT COSTS: MINESIER MISCELLANEOUS INVESTMENT COSTS: REFINERIES AND SMELTERSINFAC INACCESS AND INFRASTRUCTURE FACTOR FOR REFINERIES AND SMELTERSINFMI FACTOR FOR MINE CAPITAL COSTSINTERVAL TIME INTERVAL FOR MINE RESOURCE CONSTRAINT
INV INVESTMENT COSTS AND ECONOMIES OF SCALEIP
LIFE FINANCIAL LIFE TIME OF PRODUCTIVE UNIT (YEARS)LTS TAX DEDUCTIONS AS A PERCENTAGE OF INVESTMENT COST
MDATA MINE COST DATAMFC FUEL COST AT MINES (US$ PER TON) 4MLC LABOR COST AT MINES (US$ PER TON)
MPC TRANSPORT COST PER TON PER MILE FROM I TO NMUF TRANSPORT COST (US$ PER TON): FINAL
MUFX INTERMEDIATE TRANSPORT COST CALCULATIONS: ALUMINUMMUI TRANSPORT COST (US$ PER TON): INTERPLANTMUIX INTERMEDIATE TRANSPORT COST CALCULATIONS: ALUMINAMUR TRANSPORT COST (US$ PER TON)MURL TRANSPORT COST (US$ PER TON): LAND
MURS TRANSPORT COST (US$ PER TON): SEA
MURSX INTERMEDIATE TRANSPORT COST CALCULATIONS: BAUXITENMAA1980 NON-METAL GRADE ALUMINA DEMAND AT SMELTERS IN 1980
NMAA2000 NON-METAL ALUMINA DEMAND IN YEAR 2000 (1000 TPY)NMBA1980 NON-METAL GRADE BAUXITE PRODUCTION IN 1980NMBA2000 NON-METAL BAUXITE DEMAND IN YEAR 2000 (1000 TPY)
OBR OVERBURDEN RATIOOM OPERATING COST AT MINES (US$ PER TON)OMEGAM FIXED PORTION OF INVESTMENT COST: MINES (US$ MILLION PER 1000 TPY)OMEGAR FIXED PORTION OF INVESTMENT COSTS: REFINERIES AND SMELTERS (US$ MILLION PER 1000 TPY)
ONE1ONE2
ORS OPERATING COSTS AT REFINERIES AND SMELTERS (US$ PER TON)ORSL REFINERY AND SMELTER LABOR COST D(US$ PER MAN-HR)
ORSWL REFINERIES AND SMELTER OPERATING COST EXCLUDING LABOROTC OCEAN TRANSPORT COST
PA MARKET PRICE FOR ALUMINA (US$ PER TON)
PELEC US MILS PER KWH OR US$ PER MWH
F PL WORLD MARKET PRICE OF ALUMINUM (US$ PER TON ALUMINUM)

GAMS 1.0 WORLD ALUMINUM MODEL DATA AND MODEL DEFINITION 04/19/83 11.06.05. PAGE 54REFERENCE MAP OF VARIABLES
PARAMETERS
PRELEC ELECTRCITY PRICE IN USMILS PER KWH OR US$ PER MWHREPAA ALUMINA PRODUCTION AND CONSUMPTION (1000 TPY)REPAM ALUMINIUM PRODUCTION AND CONSUMPTION (1000 TPY)REPB BAUXITE PRODUCTION AND CONSUMPTION (1000 TPY)REPEL ELECTRICITY REPORT BY PLANTSRHO RISKLESS DISCOUNT RATESBM PLANT SIZE AT SEGMENTS: MINES (1000 TPY)SBR PLANT SIZE AT SEGMENTS: REFINERIES AND SMELTERS (1000 TPY)SD SEA DISTANCES (NAUTICAL MILES)SEACOST PORT TO PORT TRANSPORT COST (US$ PER TON)SIGMA CAPITAL RECOVERY FACTORSRATIO STRIP RATIOS FOR MINE LOCATIONS AND BAUXITE TYPES
STRISTR2STR3TARIFFAA TARIFF ON IMPORTED ALUMINATAXS2 TOTAL TAX SAVINGSTAXIA TAX SAVINGS FROM REFINERIES
TAXIB TAX SAVINGS FROM SMELTERSUBAR ELECTRICITY SUPPLY (GIGAWATT HOURS PER YEAR)UT CAPACITY UTILIZATION COEFFICIENTSUTM CAPACITY UTILIZATION FOR MINESUTR CAPACITY UTILIZATION FOR REFINERIESXi COST COMPONENTS AT MINESX2 COST COMPONENTS AT REFINERIESX3 COST COMPONENTS AT SMELTERSX4 COST COMPONENTS AT MARKETSZMBAR MAXIMUM MINE OUTPUT LEVEL (MILLION TONS)
VARIABLES
HM EXPANSIONS (LINEAR): MINES (MILLION TONS PER ANNUAL CAPACITY)HR EXPANSIONS (LINEAR): REFINERY AND SMELTER (MILLION TONS PER ANNUAL CAPACITY)PHIKM INVESTMENT COST: MINES (US$ MILLION)PHIKR INVESTMENT COST: REFINERIES AND SMELTERS (US$ MILLION)PHIL COST: ROYALTIES AND LEVIES (US$ MILLION)PHIOM OPERATING COST: MINES (US$ MILLION)PHIOR OPERATING COST: REFINERIES AND SMELTERS (US$ MILLION)PHIT COST: TRANSPORT (US$ MILLION)PHITF COST: TARIFFS (US$ MILLION)PHII COST: TOTAL (US$ MILLION)PHI2 COST: TOTAL COST WITHOUT TARIFFS (US$ MILLION)PHI3 COST: TOTAL COST WITHOUT LEVIES (US$ MILLION)PHI4 COST: TOTAL COST WITHOUT LEVIES OR TARIFFS (US$ MILLION)SM EXPANSIONS (FIXED): MINES (MILLION TONS PER ANNUAL CAPACITY)SR EXPANSIONS (FIXED): REFINERY AND SMELTER (MILLION TONS PER ANNUAL CAPACITY)U ELECTRICITY SUPPLY (GIGAWATT HOURS PER YEAR)XF SHIPMENT: FINAL PRODUCTS (1000 TPY)XI SHIPMENT: INTERMEDIATES (1000 TPY)XM SHIPMENT: BAUXITES (1000 TPY)

GAMS 1.0 WORLD ALUMINUM MODEL DATA AND MODEL DEFINITION 04/19/83 11.06.05. PAGE 55REFERENCE MAP OF VARIABLES
VARIABLES
YM BINARY EXPANSION VARIABLE: MINESYR BINARY EXPANSION VARIABLE: REFINERIES AND SMELTERSZ PROCESS LEVEL (1000 TPY)ZM MINING OUTPUT LEVEL (1000 TPY)
EQUATIONS
AKM ACCOUNTING: MINE INVESTMENTS (US$ MILLION)AKR ACCOUNTING: REFINERY AND SMELTER INVESTMENTS (US$ MILLION)AL ACCOUNTING: ROYALTIES AND LEVIES (US$ MILLION)AOM ACCOUNTING: MINE OPERATING COSTS (US$ MILLION)AOR ACCOUNTING: REFINERIES AND SMELTERS OPERATING COSTS (US$ MILLION)AT ACCOUNTING: TRANSPORT COST (US$ MILLION)ATF ACCOUNTING: TARIFFS (US$ MILLION)Al ACCOUNTING: TOTAL COST (US$ MILLION)A4 ACCOUNTING: TOTAL COST WITH NO LEVIES OR TARIFFS (US$ MILLION)CCM CAPACITY CONSTRAINT: MINES (MILLION TYP)CCR CAPACITY CONSTRAINT: REFINERIES AND SMELTERS (MILLION TYP)FDB FINAL DEMAND BALANCE (1000 UNITS)I1M DEFINITION OF H: MINES
IlR DEFINJTION OF R: REFINERIES AND SMELTERSI2M CONVEX COMBINATION AND 0-1 CONSTRAINT: MINESI2R CONVEX COMBINATION AND 0-1 CONSTRAINT: REFINERIES AND SMELTERS
MBM MATERIAL BALANCE: MINES (1000 UNITS)MBR MATERIAL BALANCE: REFINERIES AND SMELTERS (1000 UNITS)RES BAUXITE RESERVE CONSTRAINT (1000 TONS)TAA TRADE RESTRICTIONS: ALUMINATAL TRADE RESTRICTIONS: ALUMINUMTBA TRADE RESTRICTIONS: BAUXITE
MODELS
GAM GLOBAL ALUMINUM MODEL

- 148 -
ANNEX 2
A MATHEMATICAL STATEMENTOF THE WORLD ALUMINUM MODEL
A mathematical formulation of the model used in this study is given
below. First the definition of sets, variables and parameters is given.
SETS AND INDEXES
icI Mining Regions or Mines
USA
Western Europe
North Australia
West Australia
Jamaica - 1
Jamaica - 2
Haiti and Dominican Republic
Guyana
Surinam
Brazil
Venezuela
Ghana
Guinea - Ayek
Guinea - Fria
Guinea - Toug
Sierra Leone
Cameroon and other Africa
China
India

- 149 -
Indonesia
Other Asia
Eastern Europe and USSR
reR Refineries and Smelters
Western USA
Eastern USA
Western Canada
Eastern Canada
Western Europe
Japan
Western Australia
Rest of Oceania
Guyana
Jamaica
Rest of Central America and Caribbean
Surinam
Venezuela
Brazil
Argentina
Ghana
Guinea - Ayek
Guinea - Rest of
North Africa
South Africa
Zaire
Rest of Africa

- 150 -
ASEAN
China
India
Korea and other East Asia
Middle East
Rest of Asia
Eastern Europe
Asian USSR
jeJ Demand Regions
Western North America
Eastern North America
Western Europe
Japan
Oceania
Central America and Caribbean
Western South America
Eastern South America
North Africa
South Africa
West Africa
East Africa
ASEAN
China
Korea and other East Asia
Middle East
Rest of Asia
Eastern Europe and USSR

- 151 -
geG Seven Region Grouping
North America
Western Europe
Japan and Oceania
South America and Caribbean
Africa
Asia excluding USSR
Eastern Europe and USSR
feF Three-Way Grouping
OECD countries
LDCs
Eastern Europe and USSR
teL Electricity Supply Category
Contract
New low cost
Unlimited backstop
ccCM Bauxites
trihydrate 2.0:1 4X SI
trihydrate 2.2:1 3% SI
trihydrate 2.4:1 3X SI
trihydrate 3.4:1 1.5% SI
mixed 2.7:1 1.5% SI
mixed 2.2:1 4% SI
monohydrate
high silica

- 152 -
ceCS Commodities at Refineries and Smelters
trihydrate 2.0:1 4% SI
trihydr.ate 2.2:1 3% SI
trihydrate 2.4:1 3% SI
trihydrate 3.4:1 1.5% SI
mixed 2.7:1 1.5% SI
mixed 2.2:1 4% SI
monohydrate
high silica
alumina
aluminum
--electricity
(i,c)eBAUX Bauxite Mine Mapping
USA high silica
Western Europe monohydrate
North Australia mixed 2.2
West Australia trihydrate 3.4
Jamaica -1 trihydrate 2.4
Jamaica - 2 mixed 2.7
Haiti and Dominican Republic mixed 2.7
Guyana trihydrate 2.0
Surinam trihydrate 2.4
Brazil trihydrate 2.2
Venezuela trihydrate 2.2
Ghana trihydrate 2.2
Guinea - Ayek mixed 2.2
Guinea - Fria trihydrate 2.2

- 153 -
Guinea - Toug mixed 2.2
Sierra Leone trihydrate 2.2
Cameroon and other Africa trihydrate 2.4
China high silica
India trihydrate 2.4
Indonesia trihydrate 2.2
Other Asia trihydrate 2.4
Eastern Europe and USSR monohydrate
pEP Processes
refining of: trihydrates 2.0:1 4% SI
trihydrates 2.2:1 3% SI
trihydrates 2.4:1 3% SI
trihydrates 3.4:1 1.5% SI
mixed hydrates 2.7:1 1.5% SI
mixed hydrates 2.2:1 4% SI
high silica (high temperature using soda sinter process)
monohydrates (high temperature press)
smelting of alumina
mrM Productive Units
refinery for: trihydrates
mixed hydrates
monohydrates
high silica bauxite
smelter

- 154 -
(f,r)eFR Regional mapping
OECD Countries:
Western USA
Eastern USA
Western Canada
Eastern Canada
Western Europe
Japan
Western Australia
Rest of Oceania
LDCs:
Guyana
Jamaica
Rest of Central America and Caribbean
Surinam
Venezuela
Brazil
Argentina
Ghana
Guinea - Ayek
Guinea - Rest of
North Africa
South Africa
Zaire
Rest of Africa
ASEAN
China

- 155 -
India
Korea and other East Asia
Middle East
Rest of Asia
Eastern Europe and USSR:
Eastern Europe
Asian USSR
(f,i)eFI Regional mapping
OECD countries:
USA
Western Europe
North Australia
West Australia
LDCs:
Jamaica - 1
Jamaica - 2
Haiti and Dominican Republic
Guyana
Surinam
Brazil
Venezuela
Ghana
Guinea - Ayek
Guinea - Fria
Guinea - Toug
Sierra Leone
Cameroon and Other Africa

- 156 -
China
India
Indonesia
Other Asia
Eastern Europe and USSR
Eastern Europe and USSR
(f,J)eFJ Regional mapping
OECD countries:
Western North America
Eastern North America
Western Europe
Japan
Oceania
LDCs:
Central America and Caribbean
Western South America
Eastern South America
North Africa
South Africa
West Africa
East Africa
ASEAN
China
Korea and Other East Asia
Middle East
Rest of Asia

- 157 -
Eastern Europe and USSR:
Eastern Europe and USSR
q E Q Investment Cost Segments
1, 2, 3, 4
Variables
mining operating level
m
Xcir shipments of bauxite
process level of refineries and smelters
U9,r purchase of electricity for smelting
Xrr? shipment of alumina
Xr,j shipment of aluminum
capacity expansion mines.
sm interpolation of capacity expansion minesq ,i
hm,r capacity expansion refineries and smelters
8q,m,r interpolation of capacity expansion refineries and smelters
ym decision variable mines (0/1)yi
Ym,r decision variable refineries and smelters (0/1)
El objective excluding tariffs and levies

- 158 -
C2 objective including tariffs and levies
Ox transport cost
-operating costII
4Dc mining cost
(DK capital cost charges
(D X tariffs
XDv royalties and levies
Parameters
di nonindustry demand for bauxitec,i
dr nonindustry demand at smeltersc,r
d demand for aluminum
z maximum mine output level
Tm capacity utilization of mines
kim initial mining capacity

- 159
a input output matrix
b capacity use matrixm,p
Tim capacity utilization of refineries and smelters
k initial capacity of refineries and smelters
uY.r electricity supply limit
hqmi interpolation plant scale - mines
h interpolation plant scale - refineries and smelters
r trade restriction parameter
pr j transport cost for aluminum
ir r' transport cost for alumina
mIF. transport cost for bauxite
i,r~~~~~~~~~~~~~~~~~~~~~~~~~~~
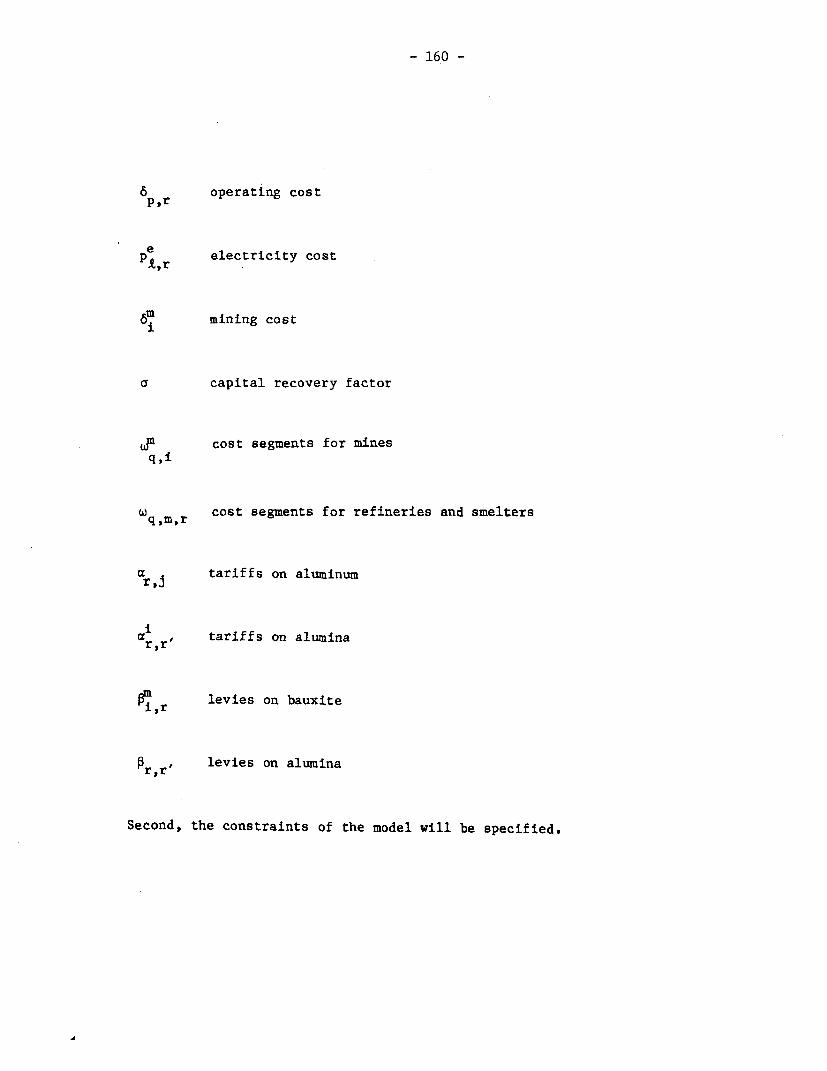
- 160 -
°p8r operating cost
eP,t,r electricity cost
6mi mining cost
a capital recovery factor
(Jfl cost segments for minesq,i
wq,m,r cost segments for refineries and smelters
a tariffs on aluminumr J
aeSr,r tariffs on alumina
0, r levies on bauxitei,,r
pr,r' levies on alumina
Second, the constraints of the model will be specified.

- 161 -
Material Balance at Mines
m ~~~~mm( z ( + dm ciCMiI(i,c)eBAUX rE Xir ci iIl
[mining > [shipments to + [nonindustryoutput] refineries] demand]
Material Balance at Smelters and Refineries
(2) pp ac,p ,r iI c,i,r + Ah uI,r-p ce cmiIrICM c = electricity
[process require- + tshipment from + [electricityments and output] mines] supply]
+ r' = Z x r + dr ceCSrRr r- rr' Ic - alumina ' |c - aluminum c,r reR
[net interplant shipments = [aluminum shipments] + [nonindustryof alumina] demand]
Demand Balance
(3) r6 Xr,j > dj J
[total shipments > [final demandof aluminum] for aluminum]

- 162 -
Bauxite Reserve Constraint
(4) zi n z iel
[output 4 [maximum output level to sustainlevel] at least 20 years of operation]
Capacity Constraints at Mines
m m in(5) zim i T (k i + hi) ieI
[output level] 4 [effective old and new capacity]
Capacity Constraints at Refineries and Smelters
(6) Pb z 4 r (k + h) meMep bm,p p,r m,r nr) r eR
[capacity use] 4 [effective old and new capacity]
Expansion of Mines
(7) hi < E hqi* sm i iI(7)i exaQ cqi q,i i
[capacity expansion] < [interpolation of capacity expansion]

- 163 -
Expansion of Refineries and Smelters
(8) h * I h *s meMm,r qEQ q,m,r q,m,r reR
[capacity ( [interpolation ofexpansion] expansion]
Economies-of-Scale Constraint for Mines
(9) ' I sm ici
[decision] [capacity interpolation]
- Limits to Economies-of-Scale for Refineries and Smelters
(10) Ymr qe q,m,r meMEQ ,mrreR
[decision] = [capacity interpolation]
Trade Restriction - Bauxite
m m(11) ceCR ih rfr [x c, Xc,i,r] ° f£F
(f,r)eFR |(f,i)eFI-
[products originating - [fraction of > 0in own region] total use]
Trade Restriction - Alumina
(12) (l-y) z p -aaluminap ZprI
(f,r)eFR I alumina,p<0
[fraction of total use of alumina ]
i fcER r' PER rfr,reF
(f,r')eFR
> [total alumina received from outside the region]

- 164 -
Trade Restriction - Aluminum
(13) r~ [xrj - TXrj> 0 feFFtl) rer Je rl i '(f,r)eFR r, fe(f, J) cFJ
[products originating in - [fraction of > 0own region] total use]
Objective Functions
(14) min (l = ( + D +e K
(15) min C 2 0 + O II+ ( + (D + O + (D
Transport Cost
(16) 'jr.jj~ xi +m m) rE-R g [jerJ r,j xr,j + r'e'R Pr,r' Xr,r+ CECM i'l 1Ii,r Xc,i,r
[aluminum + [alumina + [bauxiteshipment] shipment] shipment]
Operating Costs
(17) - r6 [p&i 8p,r Zp,r + RL P.,r u1,r]
[operating cost refinery + [electricityand smelter] cost]

- 165 -
Mining Cost
(18) £ = 6m ze iEi i i
[mining cost]
Capital Charges
(19) a m ~m +E Z w s IC qcQ icI 'q,i q,i mEM reR q,m,r q,m,r]
[investment mines] + [investment refineriesand smelters]
Tariffs
(20) ~+ E ,a ,(20) J' jJ reR ar,j Xr,j + rER r' R r,r r,r
[tariffs on + [tariffs onaluminum] alumina]
Royalties and Levies
(21) 0 m xm +v ceCM iel riR i,r Xc,i,r r£R r'eR lr,r' r,r'
[levies on bauxites] + [levies on alumina]

- 166 -
BIBLIOGRAPHY
1. Anthony Bird Associates, "Aluminum Annual Review," (United Kingdom,1980).
2. American Metal Market (daily), American Metal Market (New York).
3. Banks, Ferdinand E., "Bauxite and Aluminum: An Introduction to theEconomics of Nonfuel Minerals," Lexington Books, (Lexington,Massachusetts, 1979).
4. Baumgardner, Luke and Ruth Hough, "Bauxite and Alumina," Reprint for the1978-79 Bureau of Mines Mineral Yearbook, Bureau of Mines, UnitedStates Department of the Interior, (Washington, D.C., 1979).
5. Bennett, Harold, Lyman Moore, Lawrence Welborn and Joseph Toland, "AnEconomic Appraisal of the Supply of Copper from Primary DomesticSources," Bureau of Mines Information Circular, U.S. Department ofthe Interior, (Washington, D.C., 1973).
6. Bliss, Neil, "Non-Bauxite Sources of Alumina with Particular Referenceto ALCAN's Recent Investigations," in: The Journal of theGeological Society of Jamaica - Proceedings of Bauxite SymposiumIV, (Kingston, Jamaica, June 1980).
7. Brubaker, Sterling, "Trends in the World Aluminum Industry," JohnsHopkins Press, (Baltimore, Maryland, 1967).
8. Bureau of Mines, U.S. Department of the Interior, "Primary AluminumPlants, Worldwide," (Washington, D.C., 1981).
9. , "Minerals and Materials - A Monthly Survey," (WashingtonD.C., July 1981).
10. Drewry, H.P., (Shipping Consultants Ltd.), "The Operation of Dry BulkShipping Present and Prospective Trading Costs in the Context ofCurrent and Future Market Trends," (London, January 1979).
11. , "The Structure of Bauxite/Alumina - Trade and Trends in
Ocean Transportation," (London, August 1980).
12. Engineering and Mining Journal (monthly), McGraw-Hill, Inc., (New York)..
13. Fischman Leonard L. (Project Director), "World Mineral Trends and U.S.Supply Problems," Resources for the Future, Johns Hopkins UniversityPress, (Baltimore, Maryland, 1980).
14. Griotheim, Kai and Barry Welch, "Impact of Alternative Processes forAluminum Production on Energy Requirements," in Gordon M. Bell (ed).Light Metals 1981, The Metallurgical Society of AIME, (Pennsylvania,1980).

- 167 -
15. Hashimoto, Hideo, "Bauxite Processing in Developing Countries," Draft,World Bank, (Washington, D.C., December 1980).
16. Hill, V.G., "The Rational Development of Bauxite Resources," The Journalof the Geological Society of Jamaica, Proceedings of BauxiteSymposium IV, (Kingston, Jamaica, June 1980).
17. International Bauxite Association, "IBA Review," (quarterly), (Kingston,Jamaica).
18. International Customs Tariffs Bureau, International Customs Journal,(various issues), (Brussels).
19. International Primary Aluminum Institute, "Statistical Summary," (UnitedKingdom, 1980).
20. King, James and Louis Perlman, "Trends and Prospects in the Bauxite andAlumina Markets," Commodities Research Unit Ltd., The Journal of theGeological Society of Jamaica, Proceedings of Bauxite Symposium IV,(Kingston, Jamaica, June 1980).
21. Langton, Thomas G., "Economic Aspects of the Bauxite/Aluminum Industry,"paper presented to the International Symposium on the Bauxite/Aluminum Industry in the Americas, (Kingston, Jamaica, June 25,1980).
22. Lester, Murray, "The Outlook for Power in the Aluminum Industry," LightMetal Age, June 1980.
23. Metal Bulletin (twice a week), Metal Bulletin Ltd., (London).
24. Metals Week (weekly), McGraw-Hill, Inc., (New York).
25. Mining Journal (weekly), The Mining Journal Ltd. (London).
26. Metallgesellschaft, "Metal Statistics" (annual), (Frankfurt am Main).
27. Moment, Samuel, "The Pricing of Bauxite from Principal ExportingCountries, 1974-1978," United Nations Industrial DevelopmentOrganization (Vienna, 1979).
28. ", Long-term Associations of Development Countries withConsumers of Bauxite, Alumina and Aluminum," paper presented at theUnited Nations Industrial Development Organization Seminar, (Hungary,May 1978).
29. Organization for Economic Cooperation and Development, "IndustrialAdaptation in the Primary Aluminum Industry," (Paris, 1976).
30. Peach, W.N. and James A. Constantin, "Zimmermann's World Resources andIndustries (Third Edition)," Harper and Row, (New York, 1972).
31. Reimers, "Pre-investment Data for the Aluminum Industry," Department ofEconomic and Social Affairs, United Nations (New York, 1966).

- 168 -
32. Rohatgi, P.K. and C. Weiss, "Technology Forecasting for CommodityProjections: A Case Study on the Effect of Substitution byAluminum on the Future Demand for Copper," in TechnologicalForecasting and Social Change, Elsevier North Holland, Inc.,(Amsterdam, Novermber 1977).
33. Stamper, John W., ancd Horace F. Kurtz, "Aluminum" in Mineral Facts andProblems, 1975 ectition, Bureau of Mines, (Washington, D.C., 1975).
34. STRAAM Engineers, "Capital and Operating Cost Estimating SystemHandbook - Mining and Benefication of Metallic and NonmetallicMinerals Except Fossil Fuels in the United States and Canada."Prepared for United States Department of the Interior, Bureau ofMines. Straam Erngineers, (Irving, California, 1979).
35. Synergy Inc., "Joint Aluminum/Copper Forecasting and Simulation Model,"U.S. Department of Commerce, National Technical Information Service,(Washington, D.C., 1977).
36. Teas, E. Bruce and Jan J. Kotte, "The Effects of Impurities on ProcessEfficiency and Methods for Impurity Control and Removal," The Journalof the Geological Society of Jamaica - Proceedings of BauxiteSymposium IV. (Kingston, Jamaica, June 1980).
37. UNIDO, "Mineral Processing in Developing Countries," (Vienna, October1980).
38. U.S. Department of the Navy, "Distances Between Ports," (Washington,D.C., 1965).
39. Vedavalli, R., "Market Structure of Bauxite/Alumina/Aluminum andProspects for Developing Countries," World Bank, (Washington, D.C.,1977).
40. Woods, Douglas, "Financial Decision Making in the Process Industry,"Prentice Hall, (New Jersey, 1975).
41. , and James Burrows, "The World Aluminum Bauxite Market,"A Charles River Associates Research Report, Praeger (New York, 1980).
42. World Bank, "Bauxite and Aluminum Handbook," (Washington, D.C., 1981).
43. , "Energy in the Developing Countries," (Washington, D.C.,1980).
44. , "Price Prospects for Major Primary Commodities,"(Washington, D.C., 1980).
45. , "World Development Report 1981," Oxford University Press,published for the World Bank, (Washington, D.C., 1981).
World Bank Coffee, Tea, and Cocoa: A Dynamic Simulation ModelPublications Market Prospects and of the World Jute Economy
Development Lending Jock Anderson and others
of Related Shamsher Singh, Jos de Vries, World Bank Staff Working Paper No.Ititerest John C. L. Hulley, and 391. May 1980. 39 pages (including
Interest Patrick Yeung references).
Describes prospects for world Stock No. WP-0391. $3.00.markets and discusses World Banklending policies.
The Johns Hopkins University Press, An Econometric Model of1977.142 pages (including the World Rubber Economy
Agricultural Pricing in Togo 3 appendixes). Enzo R. Grilli,David Bovet and LC 76-17239. ISBN 0-8018-1869-9, Ray M. Helterline, andLaurian Unnevehr $6.00 (f3.50) paperback. Peter K. Pollak
World Bank Staff Working Paper No. Spanish: Cafe, te y cacao: perspectivas World Bank Commodity W/orking Paper467. July 1981. 76 pages (including del mercado y financiamiento para el No. 3. April 1979. vii -t- 37 pages.statistical appendix). desarroilo. Editorial Tecnos, 1978. Stock No. CP-0003. $3.00.
Stock No. WP-0467. $3.00. ISBN 84-309-0780-7, 485 pesetas.
The Future for Hard FibersNEW_____ and Competition from
NEW NEW SyntheticsLnzo R. Grilli
Analysis of the World Commodity Trade and Price Enes th uncrtiCocoa Market Trends (1982-83 edition) filDers and makes suggestions for an
Takamasa Akiyama and Historical information on the tracie of adjustment policyRonald C. Duncan developing countries and eighty The Johns Hopkins University Press,
Reports production, consumption, market price quotations for fifty-one 1'175 120 (Ind'and price projections derived from a commodities that figure importantly . pages includingnew econometric model of the world in international trade. Actual current 3 annexes, bibliography).cocoa economy. Buffex stock policies and constant dollar prices are shown LC 74-6824. ISBN 0-8018-1649-1, $5.00are also simulated. in tabular and graphic form to indi- ( 23.00) paperback.
cate commodity price movementsWorld Bank Commodity Working Paper relative to the internationalNo. 8. June 1982. v + 59 pages price level. Imdustrial Processing of(including 4 annexes). The Johns Hopkins University Press., INatural ResourcesStock No. CP-0008. $3.00. Journals Division. Annual. xxx + 140 David Wall
pages. $15.00 paperback. V4orld Bank Commodity Working Paper
French and Spanish translations are Nlo. 4. April 1979. i + 22 pages.Analysis of the World provided alongside the English in the Stock No. CP-0004. $3.00.Coffee Market same volume.Takamasa Akiyama andRonald C. Duncan Intenmational Cotton MarketReports the results from a new Prospectseconometric model of the world IY. Elton Thigpen withcoffee economy constructed to pro- 'ject consumption, output, and prices Maw-Cheng Yangover the next decade. World Bank Commodity Working Paper
World Bank Commodity Working Paper No. 2. June 1978. v + 67 pagesNo. 7. June 1982. v + 54 pages (Including 3 annexes).(including 4 annexes). Siock No. CP-0002. $5.00.
Stock No. CP-0007. $3.00.

The Outlook for Primary Tropical Hardwood Trade in The World Sugar Economy:Commodities the Asia-Pacific Region An Econometric Analysis ofEnzo R. Grilli, editor Kenji Takeuchi Long-Term DevelopmentsExamines the medium- and long-term The Philippines, Malaysia, and Jos de Vriestrade outlook for the major primary Indonesia could industrialize remote Uses an econometric model tocommodities. Policy issues are also areas and more than triple foreign- examine the growth pattern of theexamined. exchange earnings through expan- world sugar economy during the nextWorld Bank Commodity Working Paper sion of wood-processing operations. decade.No. 9. July 1982. vi + 156 pages The Johns Hopkins University Press, World Bank Staff Commodity Working(including 3 annexes). 1974. 108 pages (including Paper No. 5. November 1980. uii + 124Stock No. CP-0009. $5.00. 3 annexes, statistical appendix, pages (including 2 annexes).
references). Stock No. CP-0005. $5.00.LC 74-4214. ISBN 0-8018-1627-0,$5.00 (13.00) paperback.
NEW The World Tin Economy: AnEconometric Analysis
A Simultaneous Equation The World Rubber Economy: Jasbir Chhabra, Enzo R. Grilli,Model of Price and Quantity Structure, Changes, and and Peter K. PollakAdjustments in World Prospects Wortd Bank Commodity Working PaperPrimary Commodity Markets Enzo R. Grilli, No. 1. June 1978. v + 41 pagesErh-Cheng Hwa Barbara Bennett Agostini, and (including 2 annexes).A dynamic, simultaneous model of M1aria J. 't Hooft-Welvaars Stock llo. CP-0001. $3.00.price and quantity adjustments in The flrst integrated analysis of theworld primary commodity markets is nthea andrstynthegrted anaysiboethporesntd. Thea empirical analysis of natural and synthetic rubberthe model is carried out with the economies, with a unique study of theannual data for six primary com- relative costs of production of themnodities: cocoa, coffee, copDer,rubber, tin, and sugar. Dynamic The Johns Hopkins Uniuersity Press,simulations strongly confirm the com- 1980. 222 pages.rnonly observed self-generating andrecurring boom-and-bust cycles of LC 80-554. I5BN 0-8018-2421-4, $10.00primary commodity prices. (.24.50) paperback.
World Bank Staff Working Paper No.499. October 1981. 48 pages (including World Bank Commodityfootnotes, references, appendix). Models, Vol. 1Stock No. WP-0499. $5.00. Shamsher Singh, editor
Proceedings of the Aarhus Workshopon Commodity Models and Policies.
World Bank Commodity Working PaperNo. 6. June 1981. ii + 545 pages.Stock No. CP-0006. $20.00.

WORLD BANK PUBLICATIONSORDER FORM
SEND TO:WORLD BANK PUBLICATIONS WORLD BANK PUBLICATIONSP.O. BOX 37525 or 66, AVENUE D'IENAWASHINGTON, D.C. 20013 75116 PARIS, FRANCEU.S.A.
Name:
Address:
Stock or ISBN # Author, Title Oty. Price Total
. ~ ~_I _ _ _ _
I_ _ _ __ _ _ _ __ L_ , _ __
i ~ ~_ _ _ __ _ _ _ _ NT _ __ X ]__
Sub-Total Cost:
Postage & handling fee for more than two free items ($1.00 each):
Total copies: _ _ Air mail surcharge ($2.00 each):
TOTAL PAYMENT ENCLOSED:
Make checks payable: WORLD BANK PUBLICATIONS
Prepayment on orders from individuals is requested. Purchase orders are accepted from booksellers, library suppliers, libraries. and institutions.All prices include cost of postage by the least expensive means. The prices and publication dates quoted in this Catalog are sublect to changewithout notice.
No refunds will be given for items that cannot be filled. Credit will be applied towards future orders.No more than two free publications will be provided without charge. Requests for additional copies will be filled at a charge of US $1.00 per
copy to cover handling and postage costs.Airmail delivery will require a prepayment of US $2.00 per copy.Mail-order payment to the World Bank need not be in U.S. dollars, but the amount remitted must be at the rate of exchange on the day the
order is placed. The World Bank will also accept Unesco coupons.

I


The World Bank
Headquarters:1818 H Street, N.W.Washington, D.C. 20433, U.S.A.
Telephone: (202) 477-1234Telex: WUI 64145 WORLDBANK
RCA 248423 WORLDBKCable address: INTBAFRAD
WASHINGTONDC
European Office:66, avenue d'Iena75116 Paris, France
Telephone: (1) 723-54.21Telex: 842-620628
Tokyo Office:Kokusai Building1-1, Marunouchi 3-chomeChiyoda-ku, Tokyo 100, Japan
Telephone: (03) 214-5001Telex: 781-26838
ISSN 0253-2115/ISBN 0-8213-0212-4


![Analysis of Regional Investment Frameworks Worldwide · 3. Investment Chapter in Free Trade Agreement • NAFTA (1994): Chapter Eleven on Investment [Canada, USA, Mexico] • MERCOSUR,](https://img.pdfslide.net/doc/110x75/6026e53f319f0a003b5a035c/analysis-of-regional-investment-frameworks-3-investment-chapter-in-free-trade-agreement.jpg)