Embed Size (px)
Citation preview
2018
WORLDWIDE MARKET FOR RAILWAY INDUSTRIES
Market Volumes for OEM Business and After-Sales
Service as well as Prospects for Market Developments of Infrastructure and Rolling Stock
Extract
© SCI Verkehr GmbH • www.sci.de • Worldwide Market for Railway Industries 2
WORLDWIDE MARKET FOR RAILWAY INDUSTRIES Market Volumes for OEM Business and After-Sales Service as well as Prospects for Market Developments of Infrastructure and Rolling Stock Available in English from 14th September 2018. Now you can also purchase the data annex in Excel format (see overview data sheets on page no. 5 for more information). Every two years, SCI Verkehr publishes the MultiClient study “Worldwide Market for Railway Industries”, which summarises the main contents of more than 20 in-depth studies of the various railway industry segments. As a basis for specialised strategic consultancy for railway companies and the railway industry, SCI Verkehr conducts bottom-up analyses of all relevant product segments. An extensive self-developed database allows SCI Verkehr to analyse business segments, market regions and even individual country markets. Thanks to the project-based data collection, the database also provides input for a detailed analysis of OEM and after-sales markets. SCI Verkehr has enhanced its methodologies over the years and can, for example, develop its forecasts based on the real age structures of fleets. Coinciding with the InnoTrans 2018 trade fair, the new MultiClient study “Worldwide Market for Railway Industries 2018” will inform customers from the railway industry about the current status of both the infrastructure and the rolling stock markets as well as about the future development in all world regions. In concrete terms, this market study of the worldwide market for railway industries includes:
– An overview of the market development of the worldwide market for railway industries, subdivided into world market regions and product segments
– Structure and development of the global railway technology market in Western and Eastern Europe, North and South America, Asia, Australia/Pacific, the CIS and Africa/Middle East
– Size of the market, market development and future procurement potential for the product segments infrastructure, system technology and rolling stock until 2022
– List of infrastructure stocks and fleets for the main countries and operators and important vehicle and infrastructure projects in the period from 2013 to 2017
SCI Verkehr analyses markets from the bottom up: based upon systematic observation of the railway markets, a detailed worldwide database of the installed base and projects forms the basis for in-depth studies on the various segments of the railway industry and the most important regional focus markets. Through the continuous production of its MultiClient Series, SCI Verkehr systematically analyses 35 core countries and more than 100 individual markets for railway industries. These studies also go into further detail regarding technological and railway operational aspects, which are not illustrated in this study. SCI Verkehr GmbH is an independent consultancy company specialising in the markets and economics of transport. We have close connections to the rail industry, with consultants in a wide range of specialist fields. We have an extensive network of experts in Germany and abroad and we specialise in market and strategy issues for the mobility sector. Our activities focus on companies in the transport and rail industry, logistics, public and private transport companies and transport and economics departments in public administrations at national, regional and municipal levels. Contact: SCI Verkehr GmbH Alexander Apking Tel.: +49 221 93178 0 E-Mail: [email protected]
Extract
© SCI Verkehr GmbH • www.sci.de • Worldwide Market for Railway Industries 3
CONTENTS
1 Executive Summary: Worldwide Market for Railway Industries ........................................ 17
1.1 Market environment/transport market ........................................................................................ 22
1.2 Market Development by Segment ............................................................................................. 27
1.3 Market Development in the Regions/Countries ......................................................................... 30
1.4 Development of the Manufacturer Landscape ........................................................................... 36
2 Objective of the Study and Delimitation of the Railway Market ........................................ 38
2.1 Objective of the Market Analysis ................................................................................................ 38
2.2 Delimitation of the Rail Market ................................................................................................... 39
3 Market Analysis Methodology ............................................................................................ 43
3.1 SCI Forecasting Tool ................................................................................................................. 43
3.2 Railway Infrastructure/ System Technology Forecast ............................................................... 45
3.3 After-Sales Market Forecast ....................................................................................................... 46
3.4 Analysis of Drivers in the Railway Industries Market .................................................................. 47
4 Characteristics and Transport Development in the World Market Regions...................... 50
4.1 Western Europe ......................................................................................................................... 50
4.2 Eastern Europe .......................................................................................................................... 59
4.3 North America ............................................................................................................................ 67
4.4 South and Central America ........................................................................................................ 75
4.5 Asia ............................................................................................................................................. 83
4.6 Commonwealth of Independent States ..................................................................................... 91
4.7 Africa/Middle East ...................................................................................................................... 98
4.8 Australia/Pacific ........................................................................................................................ 106
5 The Market for Infrastructure ............................................................................................ 113
5.1 Track Systems .......................................................................................................................... 113
5.2 Electrification ............................................................................................................................ 124
6 The Market for System Technology .................................................................................. 134
6.1 Control Command and Signalling ........................................................................................... 134
6.2 Passenger Information Technology ......................................................................................... 143
7 The Market for Rolling Stock ............................................................................................ 149
7.1 Electric Locomotives ................................................................................................................ 149
7.2 Diesel locomotives ................................................................................................................... 161
Extract
© SCI Verkehr GmbH • www.sci.de • Worldwide Market for Railway Industries 4
7.3 High-speed Trains .................................................................................................................... 170
7.4 Electric Multiple Units ............................................................................................................... 178
7.5 Diesel Multiple Units ................................................................................................................. 186
7.6 Passenger Coaches ................................................................................................................. 194
7.7 Freight Wagons ........................................................................................................................ 206
7.8 Light Rail Vehicles .................................................................................................................... 217
7.9 Metro Vehicles .......................................................................................................................... 225 ANNEX
Figures Detailing Infrastructure and Fleets in the Individual Regions
1 Western Europe ................................................................................................................. 234
2 Eastern Europe .................................................................................................................. 246
3 North America ................................................................................................................... 258
4 South and Central America ............................................................................................... 270
5 Asia .................................................................................................................................... 281
6 Commonwealth of Independent States ............................................................................ 293
7 Africa/Middle East ............................................................................................................. 305
8 Australia/Pacific ................................................................................................................ 317
Extract
© SCI Verkehr GmbH • www.sci.de • Worldwide Market for Railway Industries 5
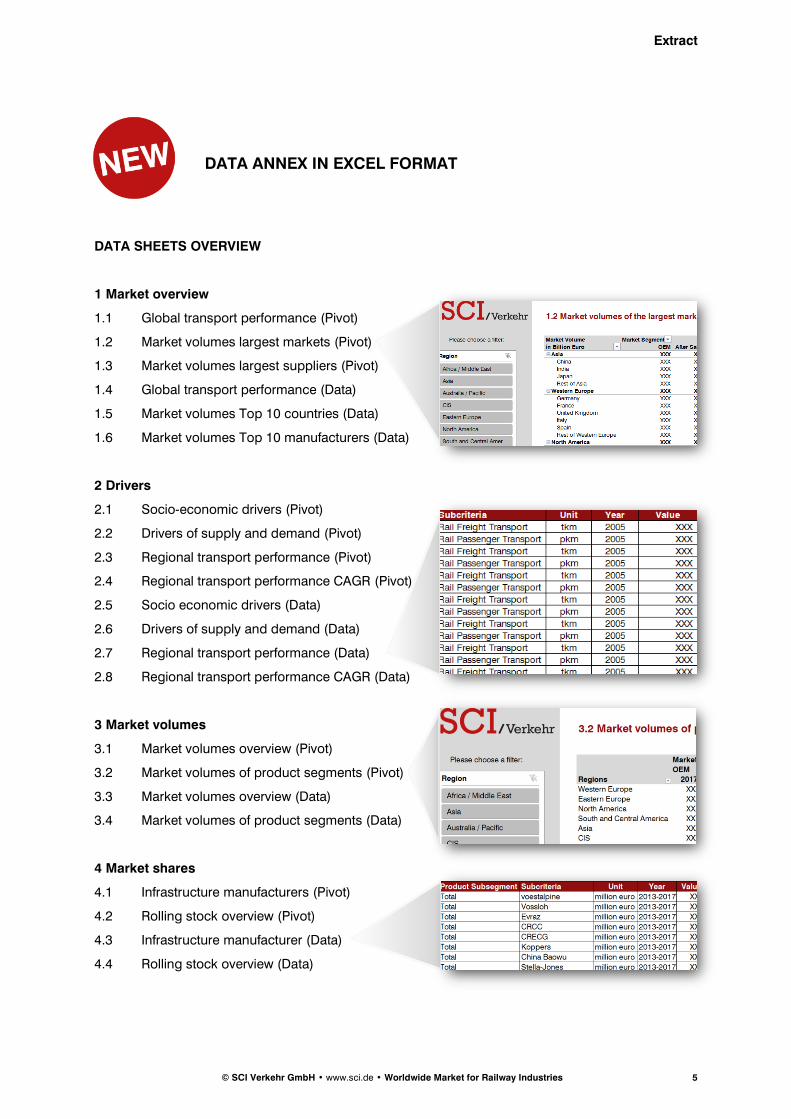
DATA ANNEX IN EXCEL FORMAT
DATA SHEETS OVERVIEW
1 Market overview
1.1 Global transport performance (Pivot)
1.2 Market volumes largest markets (Pivot)
1.3 Market volumes largest suppliers (Pivot)
1.4 Global transport performance (Data)
1.5 Market volumes Top 10 countries (Data)
1.6 Market volumes Top 10 manufacturers (Data)
2 Drivers
2.1 Socio-economic drivers (Pivot)
2.2 Drivers of supply and demand (Pivot)
2.3 Regional transport performance (Pivot)
2.4 Regional transport performance CAGR (Pivot)
2.5 Socio economic drivers (Data)
2.6 Drivers of supply and demand (Data)
2.7 Regional transport performance (Data)
2.8 Regional transport performance CAGR (Data)
3 Market volumes
3.1 Market volumes overview (Pivot)
3.2 Market volumes of product segments (Pivot)
3.3 Market volumes overview (Data)
3.4 Market volumes of product segments (Data)
4 Market shares
4.1 Infrastructure manufacturers (Pivot)
4.2 Rolling stock overview (Pivot)
4.3 Infrastructure manufacturer (Data)
4.4 Rolling stock overview (Data)
Extract
© SCI Verkehr GmbH • www.sci.de • Worldwide Market for Railway Industries 6
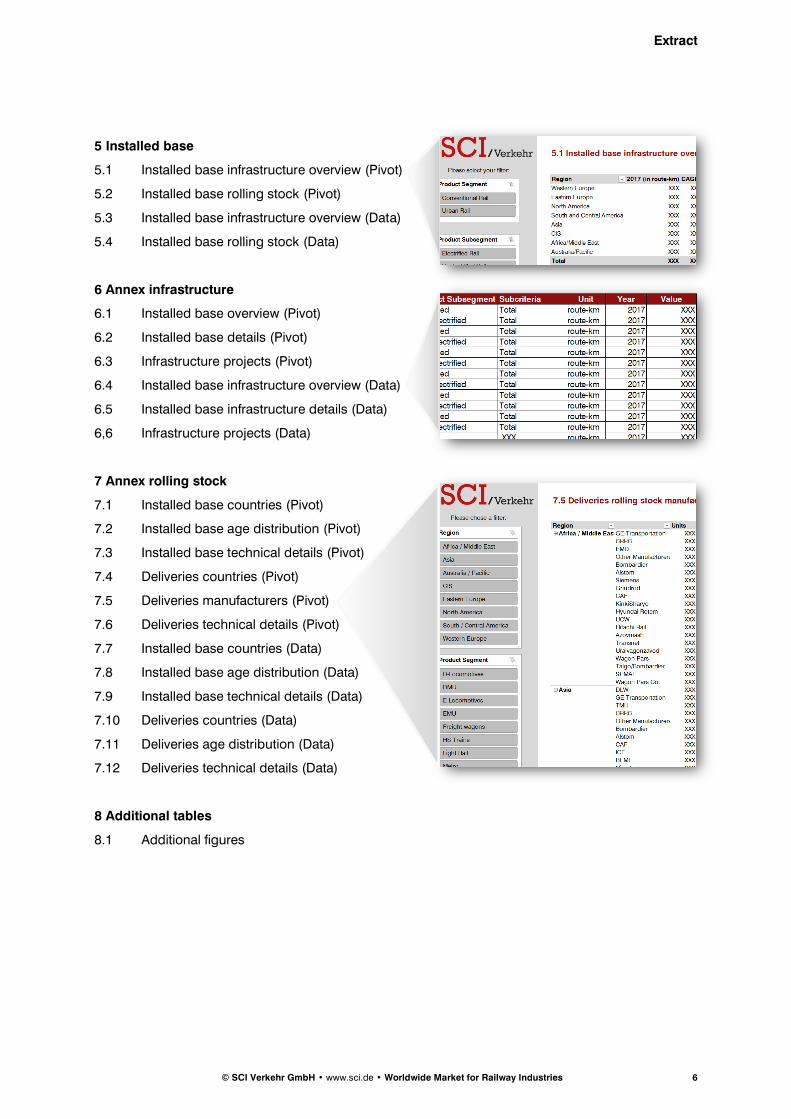
5 Installed base
5.1 Installed base infrastructure overview (Pivot)
5.2 Installed base rolling stock (Pivot)
5.3 Installed base infrastructure overview (Data)
5.4 Installed base rolling stock (Data)
6 Annex infrastructure
6.1 Installed base overview (Pivot)
6.2 Installed base details (Pivot)
6.3 Infrastructure projects (Pivot)
6.4 Installed base infrastructure overview (Data)
6.5 Installed base infrastructure details (Data)
6,6 Infrastructure projects (Data)
7 Annex rolling stock
7.1 Installed base countries (Pivot)
7.2 Installed base age distribution (Pivot)
7.3 Installed base technical details (Pivot)
7.4 Deliveries countries (Pivot)
7.5 Deliveries manufacturers (Pivot)
7.6 Deliveries technical details (Pivot)
7.7 Installed base countries (Data)
7.8 Installed base age distribution (Data)
7.9 Installed base technical details (Data)
7.10 Deliveries countries (Data)
7.11 Deliveries age distribution (Data)
7.12 Deliveries technical details (Data)
8 Additional tables
8.1 Additional figures
Extract
© SCI Verkehr GmbH • www.sci.de • Worldwide Market for Railway Industries 7
Extract from the Study
1 Executive Summary: Worldwide Market for Railway Industries
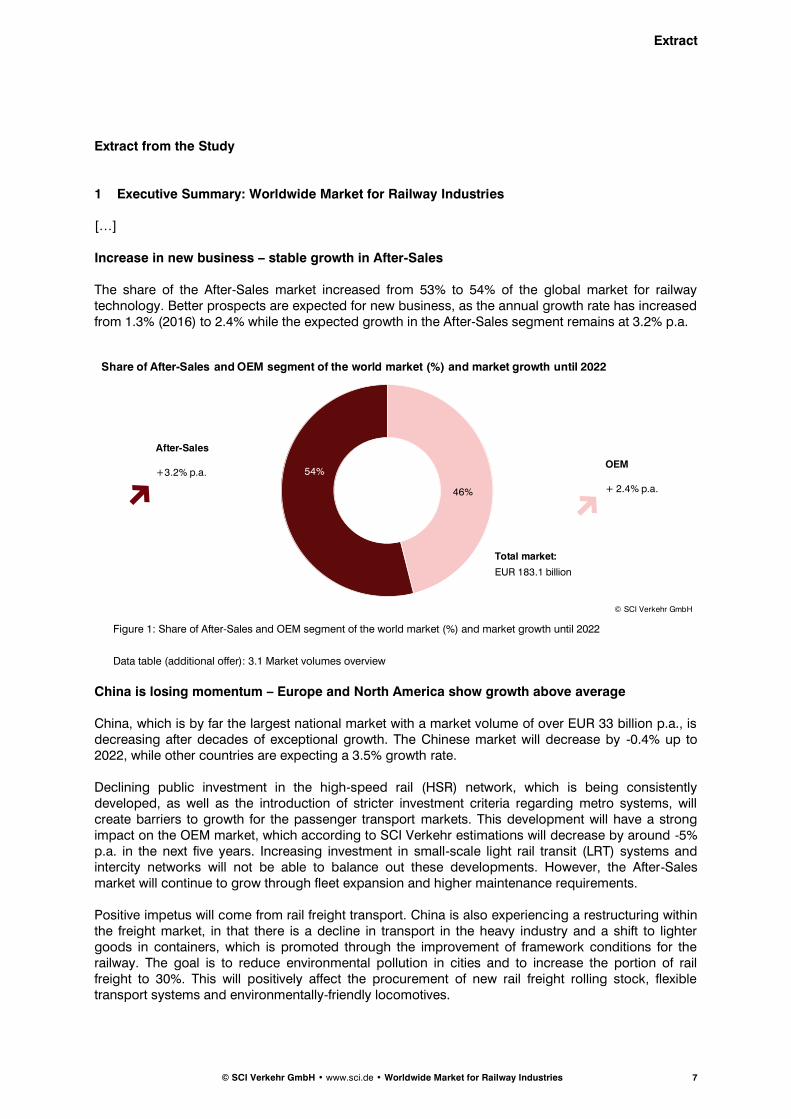
[…] Increase in new business – stable growth in After-Sales The share of the After-Sales market increased from 53% to 54% of the global market for railway technology. Better prospects are expected for new business, as the annual growth rate has increased from 1.3% (2016) to 2.4% while the expected growth in the After-Sales segment remains at 3.2% p.a.
Figure 1: Share of After-Sales and OEM segment of the world market (%) and market growth until 2022
Data table (additional offer): 3.1 Market volumes overview
China is losing momentum – Europe and North America show growth above average China, which is by far the largest national market with a market volume of over EUR 33 billion p.a., is decreasing after decades of exceptional growth. The Chinese market will decrease by -0.4% up to 2022, while other countries are expecting a 3.5% growth rate. Declining public investment in the high-speed rail (HSR) network, which is being consistently developed, as well as the introduction of stricter investment criteria regarding metro systems, will create barriers to growth for the passenger transport markets. This development will have a strong impact on the OEM market, which according to SCI Verkehr estimations will decrease by around -5% p.a. in the next five years. Increasing investment in small-scale light rail transit (LRT) systems and intercity networks will not be able to balance out these developments. However, the After-Sales market will continue to grow through fleet expansion and higher maintenance requirements. Positive impetus will come from rail freight transport. China is also experiencing a restructuring within the freight market, in that there is a decline in transport in the heavy industry and a shift to lighter goods in containers, which is promoted through the improvement of framework conditions for the railway. The goal is to reduce environmental pollution in cities and to increase the portion of rail freight to 30%. This will positively affect the procurement of new rail freight rolling stock, flexible transport systems and environmentally-friendly locomotives.
© SCI Verkehr GmbH
46%
54%
After-Sales
+3.2% p.a.OEM
+ 2.4% p.a.
Share of After-Sales and OEM segment of the world market (%) and market growth until 2022
Total market:
EUR 183.1 billion
Extract
© SCI Verkehr GmbH • www.sci.de • Worldwide Market for Railway Industries 8
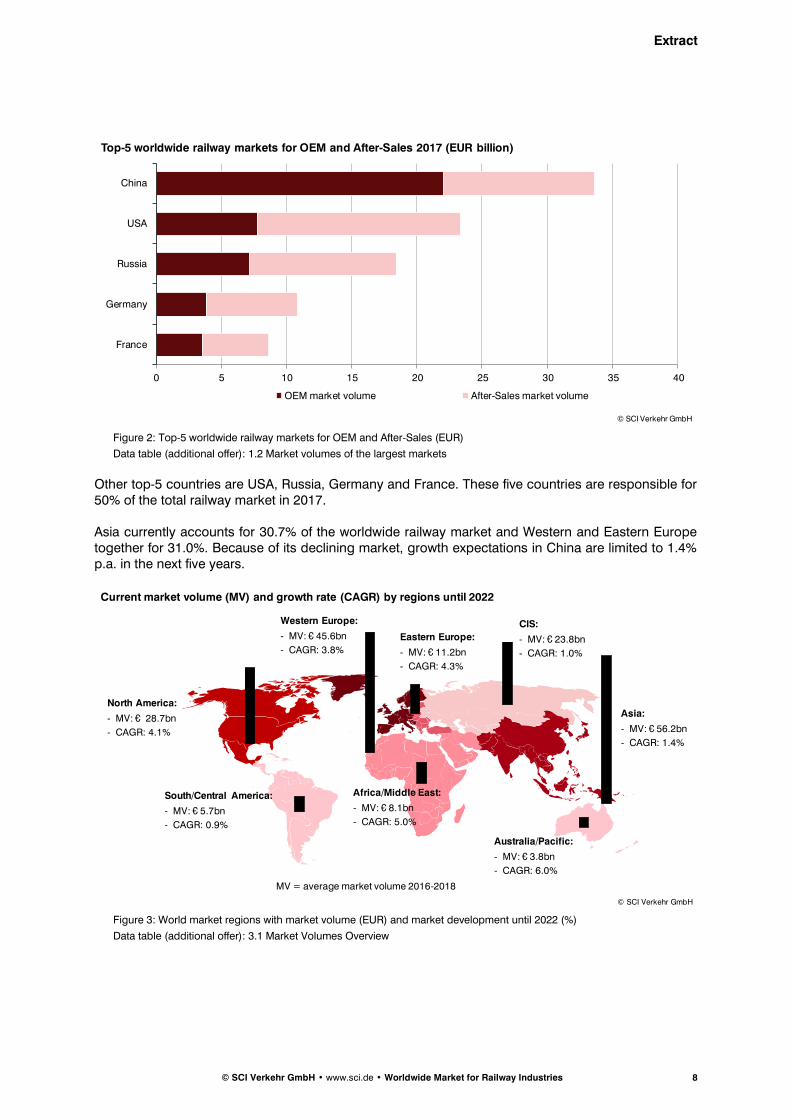
Figure 2: Top-5 worldwide railway markets for OEM and After-Sales (EUR)
Data table (additional offer): 1.2 Market volumes of the largest markets
Other top-5 countries are USA, Russia, Germany and France. These five countries are responsible for 50% of the total railway market in 2017. Asia currently accounts for 30.7% of the worldwide railway market and Western and Eastern Europe together for 31.0%. Because of its declining market, growth expectations in China are limited to 1.4% p.a. in the next five years.
Figure 3: World market regions with market volume (EUR) and market development until 2022 (%)
Data table (additional offer): 3.1 Market Volumes Overview
0 5 10 15 20 25 30 35 40
China
USA
Russia
Germany
France
OEM market volume After-Sales market volume
Top-5 worldwide railway markets for OEM and After-Sales 2017 (EUR billion)
© SCI Verkehr GmbH
MV = average market volume 2016-2018
Current market volume (MV) and growth rate (CAGR) by regions until 2022
© SCI Verkehr GmbH
Africa/Middle East:
- MV: € 8.1bn
- CAGR: 5.0%
Australia/Pacific:
- MV: € 3.8bn
- CAGR: 6.0%
North America:
- MV: € 28.7bn
- CAGR: 4.1%
South/Central America:
- MV: € 5.7bn
- CAGR: 0.9%
Western Europe:
- MV: € 45.6bn
- CAGR: 3.8%
CIS:
- MV: € 23.8bn
- CAGR: 1.0%
Asia:
- MV: € 56.2bn
- CAGR: 1.4%
Eastern Europe:
- MV: € 11.2bn
- CAGR: 4.3%
Extract
© SCI Verkehr GmbH • www.sci.de • Worldwide Market for Railway Industries 9
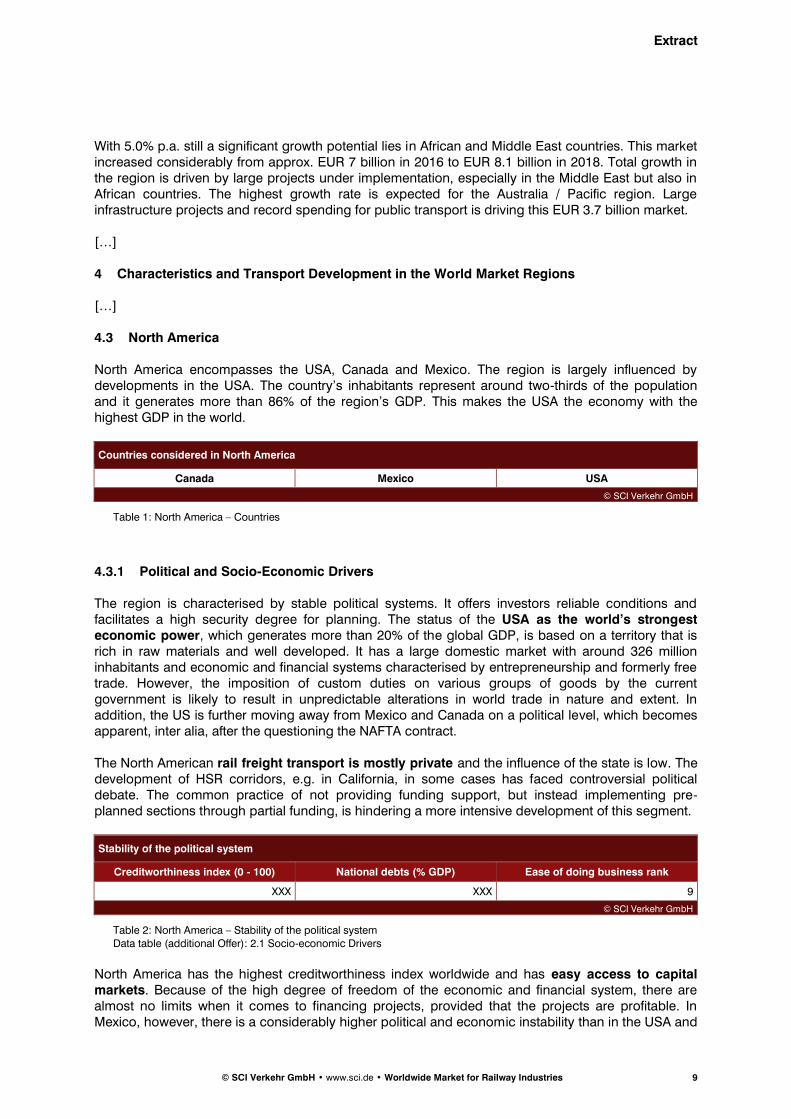
With 5.0% p.a. still a significant growth potential lies in African and Middle East countries. This market increased considerably from approx. EUR 7 billion in 2016 to EUR 8.1 billion in 2018. Total growth in the region is driven by large projects under implementation, especially in the Middle East but also in African countries. The highest growth rate is expected for the Australia / Pacific region. Large infrastructure projects and record spending for public transport is driving this EUR 3.7 billion market.
[…]
4 Characteristics and Transport Development in the World Market Regions
[…]
4.3 North America
North America encompasses the USA, Canada and Mexico. The region is largely influenced by developments in the USA. The country’s inhabitants represent around two-thirds of the population and it generates more than 86% of the region’s GDP. This makes the USA the economy with the highest GDP in the world.
Countries considered in North America
Canada Mexico USA
© SCI Verkehr GmbH
Table 1: North America – Countries
Political and Socio-Economic Drivers 4.3.1
The region is characterised by stable political systems. It offers investors reliable conditions and facilitates a high security degree for planning. The status of the USA as the world’s strongest economic power, which generates more than 20% of the global GDP, is based on a territory that is rich in raw materials and well developed. It has a large domestic market with around 326 million inhabitants and economic and financial systems characterised by entrepreneurship and formerly free trade. However, the imposition of custom duties on various groups of goods by the current government is likely to result in unpredictable alterations in world trade in nature and extent. In addition, the US is further moving away from Mexico and Canada on a political level, which becomes apparent, inter alia, after the questioning the NAFTA contract. The North American rail freight transport is mostly private and the influence of the state is low. The development of HSR corridors, e.g. in California, in some cases has faced controversial political debate. The common practice of not providing funding support, but instead implementing pre-planned sections through partial funding, is hindering a more intensive development of this segment.
Stability of the political system
Creditworthiness index (0 - 100) National debts (% GDP) Ease of doing business rank
XXX XXX 9
© SCI Verkehr GmbH
Table 2: North America – Stability of the political system Data table (additional Offer): 2.1 Socio-economic Drivers
North America has the highest creditworthiness index worldwide and has easy access to capital markets. Because of the high degree of freedom of the economic and financial system, there are almost no limits when it comes to financing projects, provided that the projects are profitable. In Mexico, however, there is a considerably higher political and economic instability than in the USA and
Extract
© SCI Verkehr GmbH • www.sci.de • Worldwide Market for Railway Industries 10
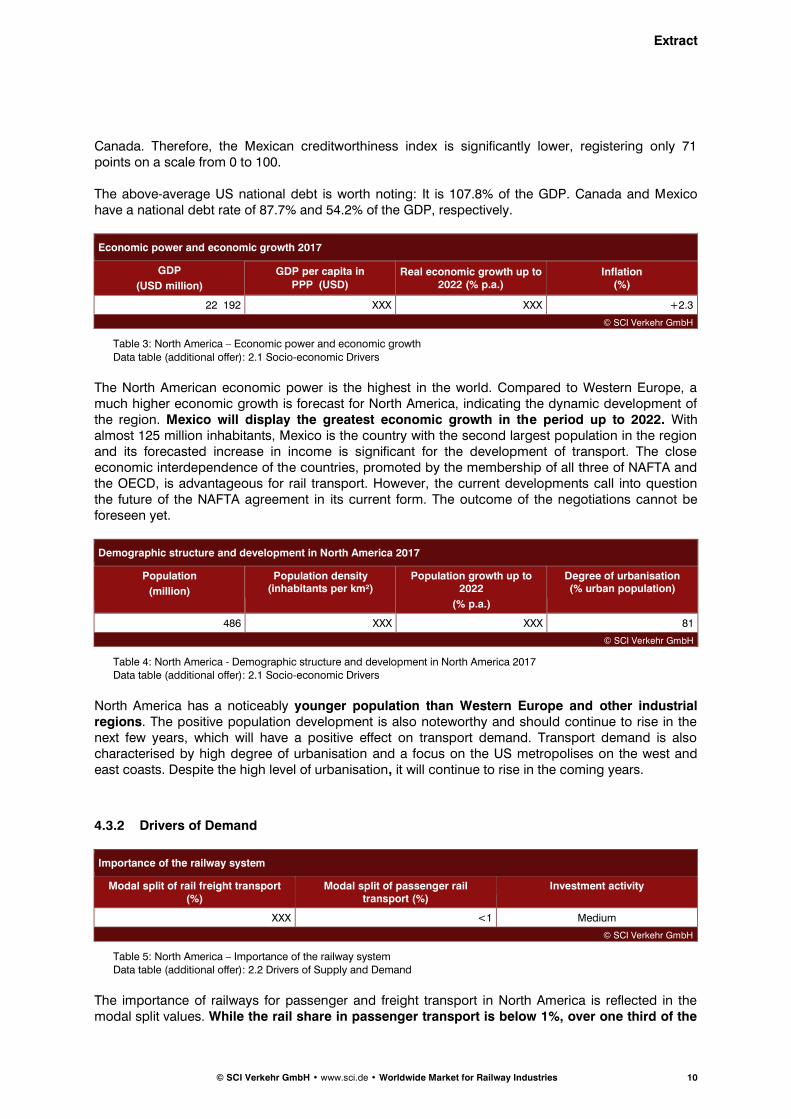
Canada. Therefore, the Mexican creditworthiness index is significantly lower, registering only 71 points on a scale from 0 to 100. The above-average US national debt is worth noting: It is 107.8% of the GDP. Canada and Mexico have a national debt rate of 87.7% and 54.2% of the GDP, respectively.
Economic power and economic growth 2017
GDP
(USD million)
GDP per capita in
PPP(USD) Real economic growth up to
2022 (% p.a.) Inflation
(%)
22 192 XXX XXX +2.3
© SCI Verkehr GmbH
Table 3: North America – Economic power and economic growth
Data table (additional offer): 2.1 Socio-economic Drivers
The North American economic power is the highest in the world. Compared to Western Europe, a much higher economic growth is forecast for North America, indicating the dynamic development of the region. Mexico will display the greatest economic growth in the period up to 2022. With almost 125 million inhabitants, Mexico is the country with the second largest population in the region and its forecasted increase in income is significant for the development of transport. The close economic interdependence of the countries, promoted by the membership of all three of NAFTA and the OECD, is advantageous for rail transport. However, the current developments call into question the future of the NAFTA agreement in its current form. The outcome of the negotiations cannot be foreseen yet.
Demographic structure and development in North America 2017
Population
(million)
Population density (inhabitants per km²)
Population growth up to 2022
(% p.a.)
Degree of urbanisation (% urban population)
486 XXX XXX 81
© SCI Verkehr GmbH
Table 4: North America - Demographic structure and development in North America 2017 Data table (additional offer): 2.1 Socio-economic Drivers
North America has a noticeably younger population than Western Europe and other industrial regions. The positive population development is also noteworthy and should continue to rise in the next few years, which will have a positive effect on transport demand. Transport demand is also characterised by high degree of urbanisation and a focus on the US metropolises on the west and east coasts. Despite the high level of urbanisation, it will continue to rise in the coming years.
Drivers of Demand 4.3.2
Importance of the railway system
Modal split of rail freight transport (%)
Modal split of passenger rail transport (%)
Investment activity
XXX <1 Medium
© SCI Verkehr GmbH
Table 5: North America – Importance of the railway system Data table (additional offer): 2.2 Drivers of Supply and Demand
The importance of railways for passenger and freight transport in North America is reflected in the modal split values. While the rail share in passenger transport is below 1%, over one third of the
Extract
© SCI Verkehr GmbH • www.sci.de • Worldwide Market for Railway Industries 11
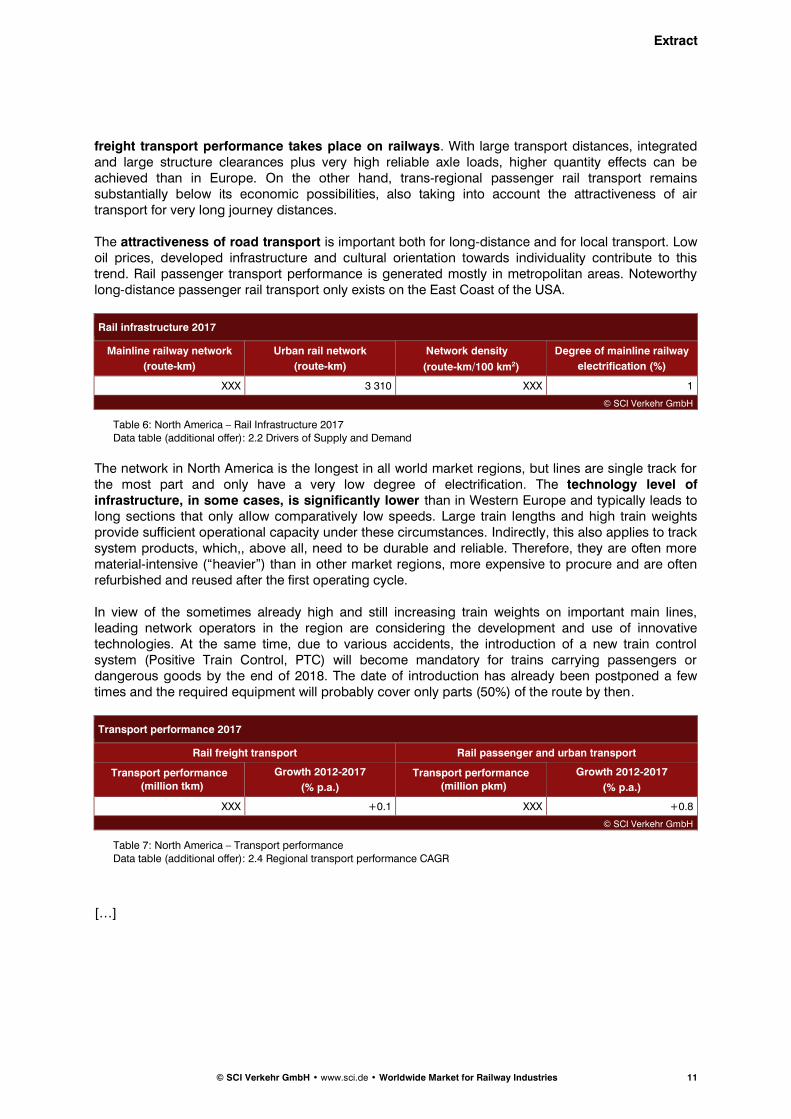
freight transport performance takes place on railways. With large transport distances, integrated and large structure clearances plus very high reliable axle loads, higher quantity effects can be achieved than in Europe. On the other hand, trans-regional passenger rail transport remains substantially below its economic possibilities, also taking into account the attractiveness of air transport for very long journey distances. The attractiveness of road transport is important both for long-distance and for local transport. Low oil prices, developed infrastructure and cultural orientation towards individuality contribute to this trend. Rail passenger transport performance is generated mostly in metropolitan areas. Noteworthy long-distance passenger rail transport only exists on the East Coast of the USA.
Rail infrastructure 2017
Mainline railway network
(route-km)
Urban rail network
(route-km)
Network density
(route-km/100 km2)
Degree of mainline railway
electrification (%)
XXX 3 310 XXX 1
© SCI Verkehr GmbH
Table 6: North America – Rail Infrastructure 2017 Data table (additional offer): 2.2 Drivers of Supply and Demand
The network in North America is the longest in all world market regions, but lines are single track for the most part and only have a very low degree of electrification. The technology level of infrastructure, in some cases, is significantly lower than in Western Europe and typically leads to long sections that only allow comparatively low speeds. Large train lengths and high train weights provide sufficient operational capacity under these circumstances. Indirectly, this also applies to track system products, which,, above all, need to be durable and reliable. Therefore, they are often more material-intensive (“heavier”) than in other market regions, more expensive to procure and are often refurbished and reused after the first operating cycle. In view of the sometimes already high and still increasing train weights on important main lines, leading network operators in the region are considering the development and use of innovative technologies. At the same time, due to various accidents, the introduction of a new train control system (Positive Train Control, PTC) will become mandatory for trains carrying passengers or dangerous goods by the end of 2018. The date of introduction has already been postponed a few times and the required equipment will probably cover only parts (50%) of the route by then.
Transport performance 2017
Rail freight transport Rail passenger and urban transport
Transport performance (million tkm)
Growth 2012-2017
(% p.a.)
Transport performance (million pkm)
Growth 2012-2017
(% p.a.)
XXX +0.1 XXX +0.8
© SCI Verkehr GmbH
Table 7: North America – Transport performance Data table (additional offer): 2.4 Regional transport performance CAGR
[…]
Extract
© SCI Verkehr GmbH • www.sci.de • Worldwide Market for Railway Industries 12
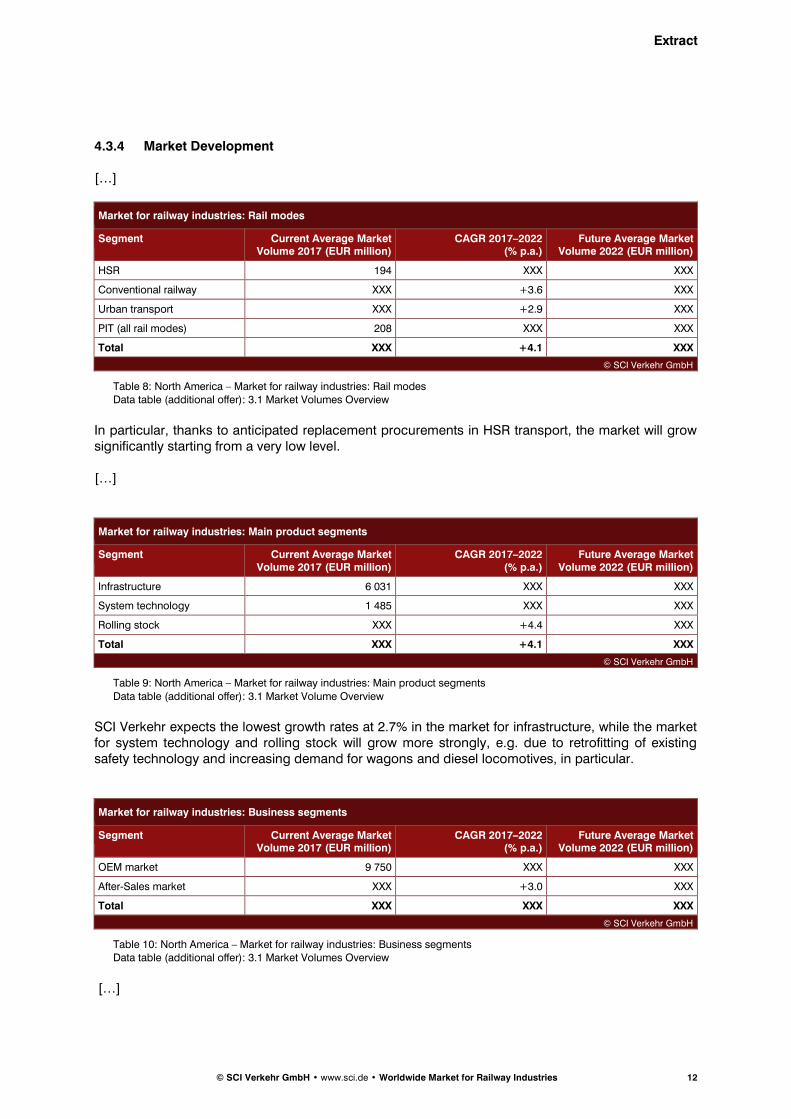
4.3.4 Market Development
[…]
Market for railway industries: Rail modes
Segment Current Average Market Volume 2017 (EUR million)
CAGR 2017–2022 (% p.a.)
Future Average Market Volume 2022 (EUR million)
HSR 194 XXX XXX
Conventional railway XXX +3.6 XXX
Urban transport XXX +2.9 XXX
PIT (all rail modes) 208 XXX XXX
Total XXX +4.1 XXX
© SCI Verkehr GmbH
Table 8: North America – Market for railway industries: Rail modes Data table (additional offer): 3.1 Market Volumes Overview
In particular, thanks to anticipated replacement procurements in HSR transport, the market will grow significantly starting from a very low level. […]
Market for railway industries: Main product segments
Segment Current Average Market Volume 2017 (EUR million)
CAGR 2017–2022 (% p.a.)
Future Average Market Volume 2022 (EUR million)
Infrastructure 6 031 XXX XXX
System technology 1 485 XXX XXX
Rolling stock XXX +4.4 XXX
Total XXX +4.1 XXX
© SCI Verkehr GmbH
Table 9: North America – Market for railway industries: Main product segments
Data table (additional offer): 3.1 Market Volume Overview
SCI Verkehr expects the lowest growth rates at 2.7% in the market for infrastructure, while the market for system technology and rolling stock will grow more strongly, e.g. due to retrofitting of existing safety technology and increasing demand for wagons and diesel locomotives, in particular.
Market for railway industries: Business segments
Segment Current Average Market Volume 2017 (EUR million)
CAGR 2017–2022 (% p.a.)
Future Average Market Volume 2022 (EUR million)
OEM market 9 750 XXX XXX
After-Sales market XXX +3.0 XXX
Total XXX XXX XXX
© SCI Verkehr GmbH
Table 10: North America – Market for railway industries: Business segments Data table (additional offer): 3.1 Market Volumes Overview
[…]
Extract
© SCI Verkehr GmbH • www.sci.de • Worldwide Market for Railway Industries 13
5 The Market for Infrastructure
5.1 Track Systems
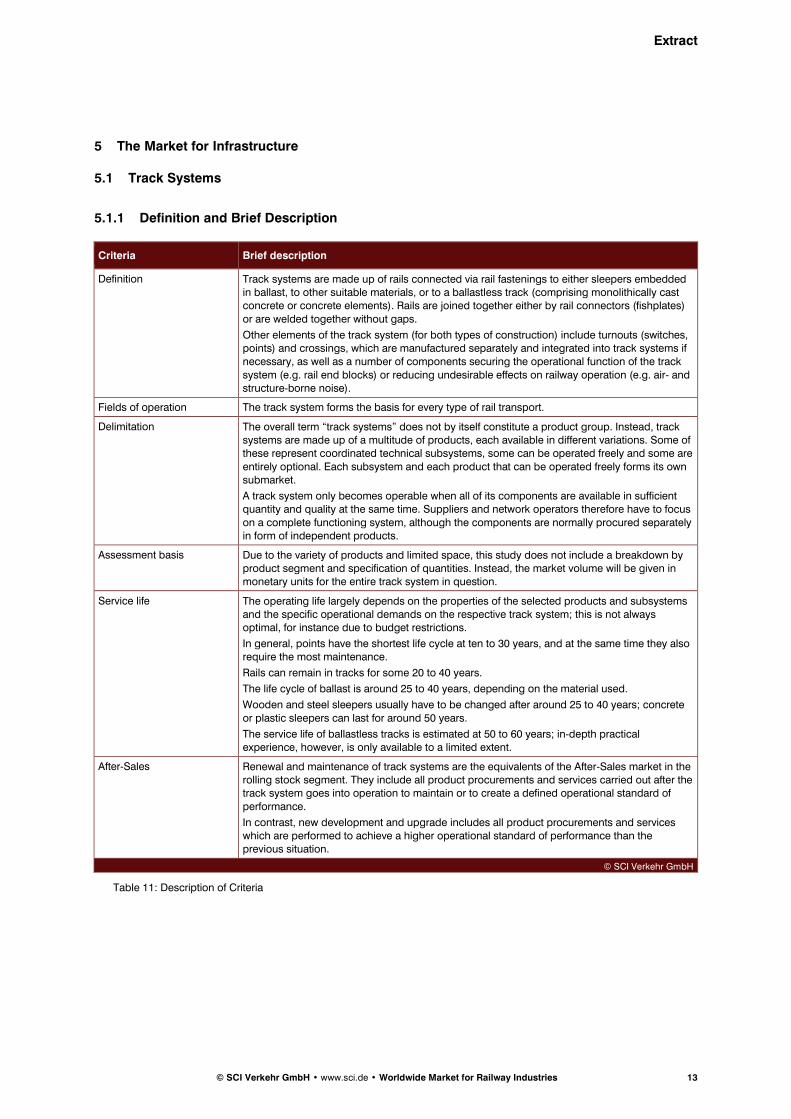
Definition and Brief Description 5.1.1
Criteria Brief description
Definition Track systems are made up of rails connected via rail fastenings to either sleepers embedded in ballast, to other suitable materials, or to a ballastless track (comprising monolithically cast concrete or concrete elements). Rails are joined together either by rail connectors (fishplates)
or are welded together without gaps.
Other elements of the track system (for both types of construction) include turnouts (switches, points) and crossings, which are manufactured separately and integrated into track systems if necessary, as well as a number of components securing the operational function of the track
system (e.g. rail end blocks) or reducing undesirable effects on railway operation (e.g. air- and structure-borne noise).
Fields of operation The track system forms the basis for every type of rail transport.
Delimitation The overall term “track systems” does not by itself constitute a product group. Instead, track systems are made up of a multitude of products, each available in different variations. Some of these represent coordinated technical subsystems, some can be operated freely and some are
entirely optional. Each subsystem and each product that can be operated freely forms its own submarket.
A track system only becomes operable when all of its components are available in sufficient quantity and quality at the same time. Suppliers and network operators therefore have to focus
on a complete functioning system, although the components are normally procured separately in form of independent products.
Assessment basis Due to the variety of products and limited space, this study does not include a breakdown by product segment and specification of quantities. Instead, the market volume will be given in monetary units for the entire track system in question.
Service life The operating life largely depends on the properties of the selected products and subsystems and the specific operational demands on the respective track system; this is not always optimal, for instance due to budget restrictions.
In general, points have the shortest life cycle at ten to 30 years, and at the same time they also require the most maintenance.
Rails can remain in tracks for some 20 to 40 years.
The life cycle of ballast is around 25 to 40 years, depending on the material used.
Wooden and steel sleepers usually have to be changed after around 25 to 40 years; concrete
or plastic sleepers can last for around 50 years.
The service life of ballastless tracks is estimated at 50 to 60 years; in-depth practical experience, however, is only available to a limited extent.
After-Sales Renewal and maintenance of track systems are the equivalents of the After-Sales market in the rolling stock segment. They include all product procurements and services carried out after the track system goes into operation to maintain or to create a defined operational standard of
performance.
In contrast, new development and upgrade includes all product procurements and services which are performed to achieve a higher operational standard of performance than the previous situation.
© SCI Verkehr GmbH
Table 11: Description of Criteria
Extract
© SCI Verkehr GmbH • www.sci.de • Worldwide Market for Railway Industries 14
Suppliers 5.1.2
[…]
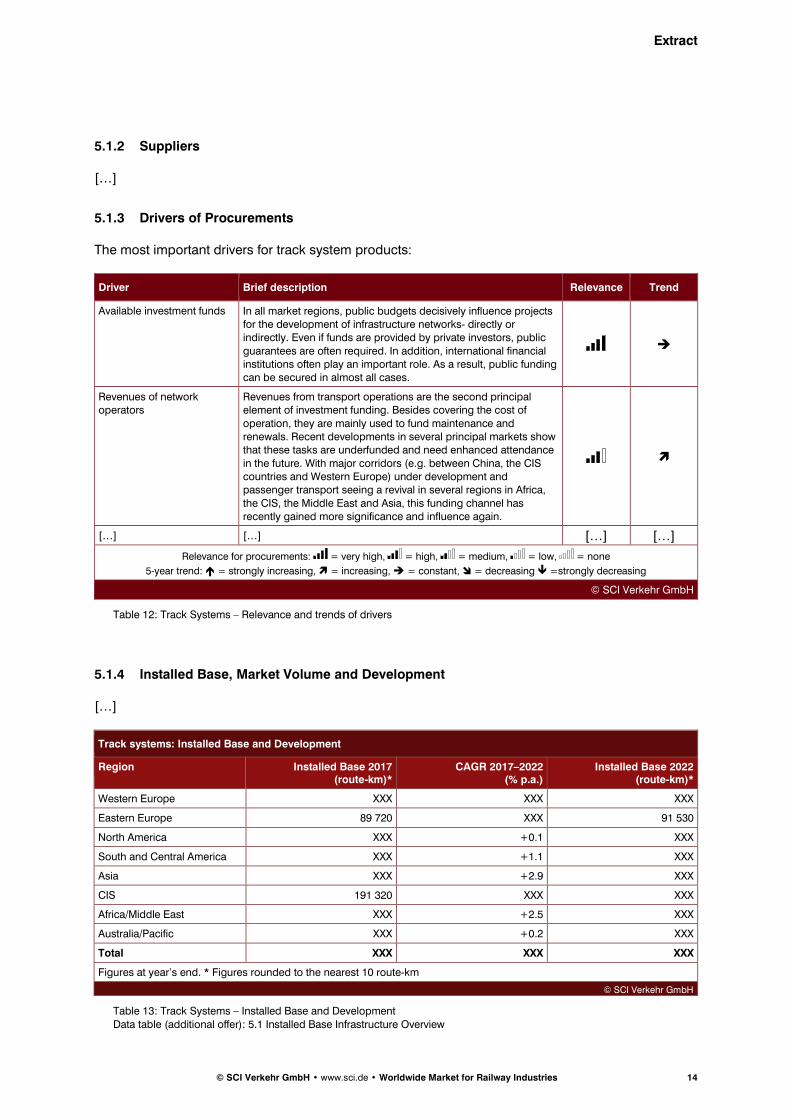
Drivers of Procurements 5.1.3
The most important drivers for track system products:
Driver Brief description Relevance Trend
Available investment funds In all market regions, public budgets decisively influence projects for the development of infrastructure networks- directly or indirectly. Even if funds are provided by private investors, public
guarantees are often required. In addition, international financial institutions often play an important role. As a result, public funding can be secured in almost all cases.
Revenues of network operators
Revenues from transport operations are the second principal element of investment funding. Besides covering the cost of
operation, they are mainly used to fund maintenance and renewals. Recent developments in several principal markets show that these tasks are underfunded and need enhanced attendance
in the future. With major corridors (e.g. between China, the CIS countries and Western Europe) under development and passenger transport seeing a revival in several regions in Africa,
the CIS, the Middle East and Asia, this funding channel has recently gained more significance and influence again.
[…] […] […] […]
Relevance for procurements: = very high, = high, = medium, = low, = none
5-year trend: = strongly increasing, = increasing, = constant, = decreasing =strongly decreasing
© SCI Verkehr GmbH
Table 12: Track Systems – Relevance and trends of drivers
Installed Base, Market Volume and Development 5.1.4
[…]
Track systems: Installed Base and Development
Region Installed Base 2017 (route-km)*
CAGR 2017–2022 (% p.a.)
Installed Base 2022 (route-km)*
Western Europe XXX XXX XXX
Eastern Europe 89 720 XXX 91 530
North America XXX +0.1 XXX
South and Central America XXX +1.1 XXX
Asia XXX +2.9 XXX
CIS 191 320 XXX XXX
Africa/Middle East XXX +2.5 XXX
Australia/Pacific XXX +0.2 XXX
Total XXX XXX XXX
Figures at year’s end. * Figures rounded to the nearest 10 route-km
© SCI Verkehr GmbH
Table 13: Track Systems – Installed Base and Development
Data table (additional offer): 5.1 Installed Base Infrastructure Overview
Extract
© SCI Verkehr GmbH • www.sci.de • Worldwide Market for Railway Industries 15
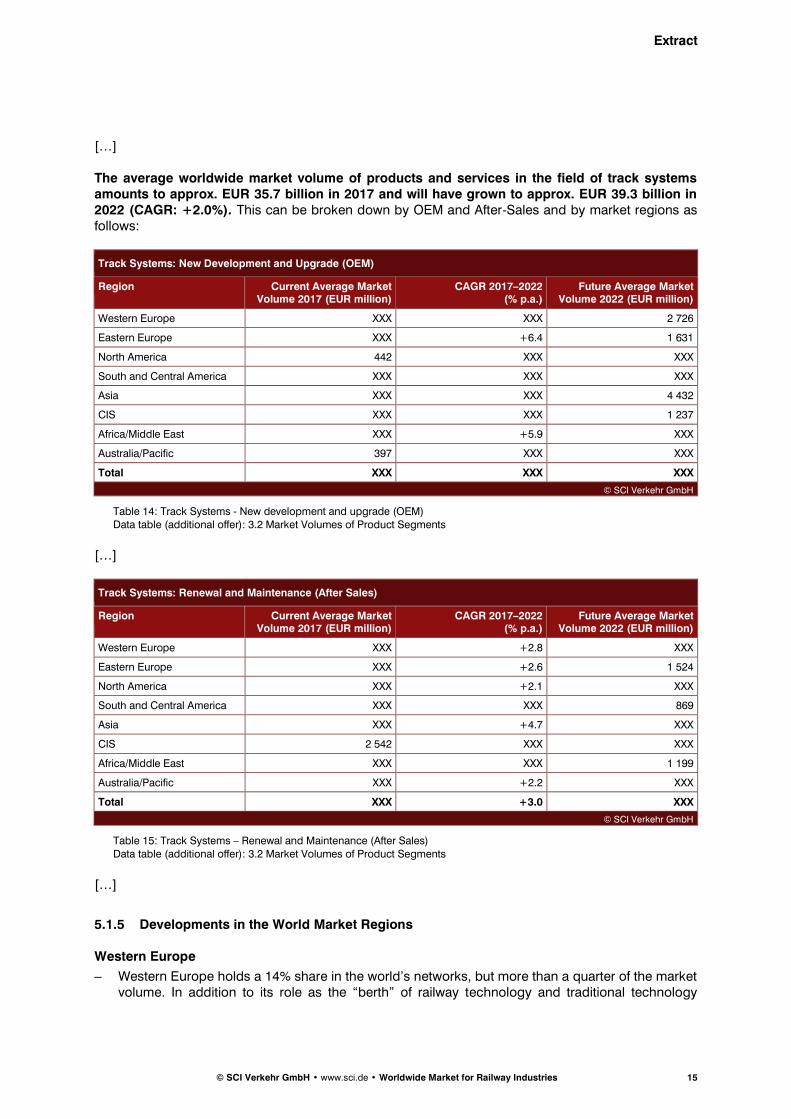
[…] The average worldwide market volume of products and services in the field of track systems amounts to approx. EUR 35.7 billion in 2017 and will have grown to approx. EUR 39.3 billion in 2022 (CAGR: +2.0%). This can be broken down by OEM and After-Sales and by market regions as follows:
Track Systems: New Development and Upgrade (OEM)
Region Current Average Market Volume 2017 (EUR million)
CAGR 2017–2022 (% p.a.)
Future Average Market Volume 2022 (EUR million)
Western Europe XXX XXX 2 726
Eastern Europe XXX +6.4 1 631
North America 442 XXX XXX
South and Central America XXX XXX XXX
Asia XXX XXX 4 432
CIS XXX XXX 1 237
Africa/Middle East XXX +5.9 XXX
Australia/Pacific 397 XXX XXX
Total XXX XXX XXX
© SCI Verkehr GmbH
Table 14: Track Systems - New development and upgrade (OEM) Data table (additional offer): 3.2 Market Volumes of Product Segments
[…]
Track Systems: Renewal and Maintenance (After Sales)
Region Current Average Market Volume 2017 (EUR million)
CAGR 2017–2022 (% p.a.)
Future Average Market Volume 2022 (EUR million)
Western Europe XXX +2.8 XXX
Eastern Europe XXX +2.6 1 524
North America XXX +2.1 XXX
South and Central America XXX XXX 869
Asia XXX +4.7 XXX
CIS 2 542 XXX XXX
Africa/Middle East XXX XXX 1 199
Australia/Pacific XXX +2.2 XXX
Total XXX +3.0 XXX
© SCI Verkehr GmbH
Table 15: Track Systems – Renewal and Maintenance (After Sales) Data table (additional offer): 3.2 Market Volumes of Product Segments
[…]
Developments in the World Market Regions 5.1.5
Western Europe
– Western Europe holds a 14% share in the world’s networks, but more than a quarter of the market volume. In addition to its role as the “berth” of railway technology and traditional technology
Extract
© SCI Verkehr GmbH • www.sci.de • Worldwide Market for Railway Industries 16
leader, this market owes its leading position to relatively high product price levels. However, market dynamics have become significantly lower than in other market regions.
[…]
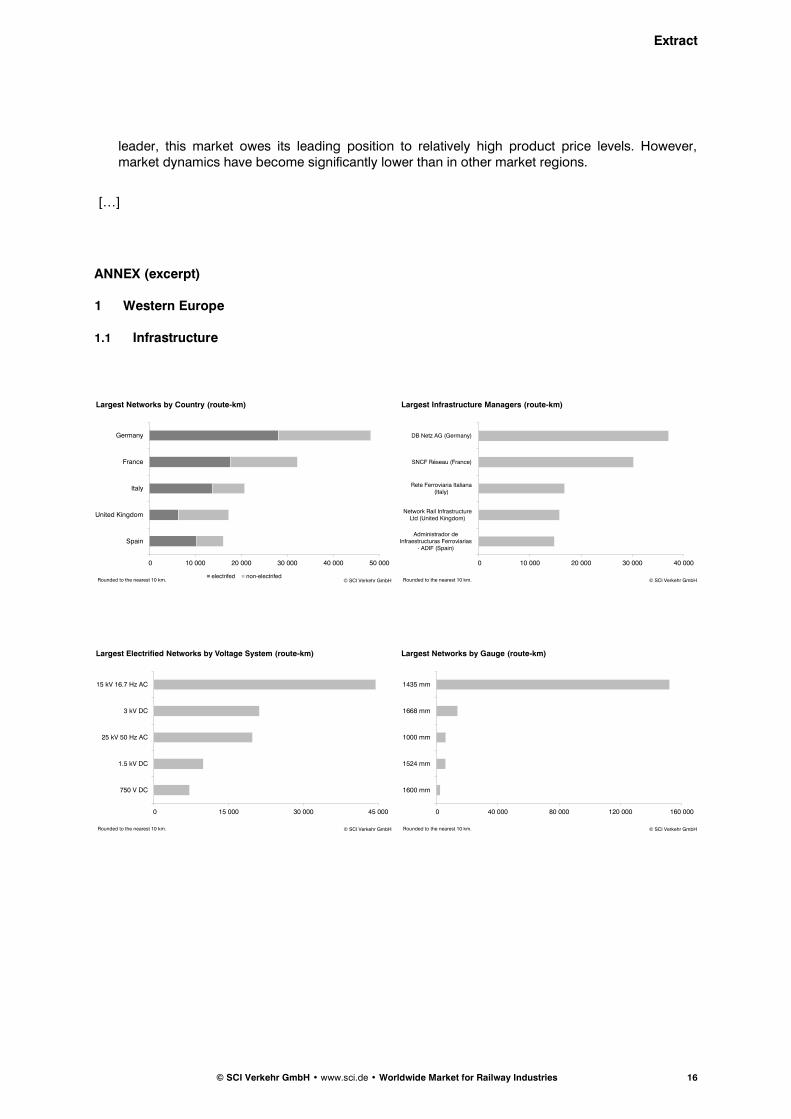
ANNEX (excerpt)
1 Western Europe
1.1 Infrastructure
0 10 000 20 000 30 000 40 000 50 000
Germany
France
Italy
United Kingdom
Spain
Largest Networks by Country (route-km)
electrifed non-electrifed© SCI Verkehr GmbHRounded to the nearest 10 km.
0 10 000 20 000 30 000 40 000
DB Netz AG (Germany)
SNCF Réseau (France)
Rete Ferroviaria Italiana(Italy)
Network Rail InfrastructureLtd (United Kingdom)
Administrador deInfraestructuras Ferroviarias
- ADIF (Spain)
Largest Infrastructure Managers (route-km)
© SCI Verkehr GmbHRounded to the nearest 10 km.
0 15 000 30 000 45 000
15 kV 16.7 Hz AC
3 kV DC
25 kV 50 Hz AC
1.5 kV DC
750 V DC
Largest Electrified Networks by Voltage System (route-km)
© SCI Verkehr GmbHRounded to the nearest 10 km.
0 40 000 80 000 120 000 160 000
1435 mm
1668 mm
1000 mm
1524 mm
1600 mm
Largest Networks by Gauge (route-km)
© SCI Verkehr GmbHRounded to the nearest 10 km.
Extract
© SCI Verkehr GmbH • www.sci.de • Worldwide Market for Railway Industries 17
[…]
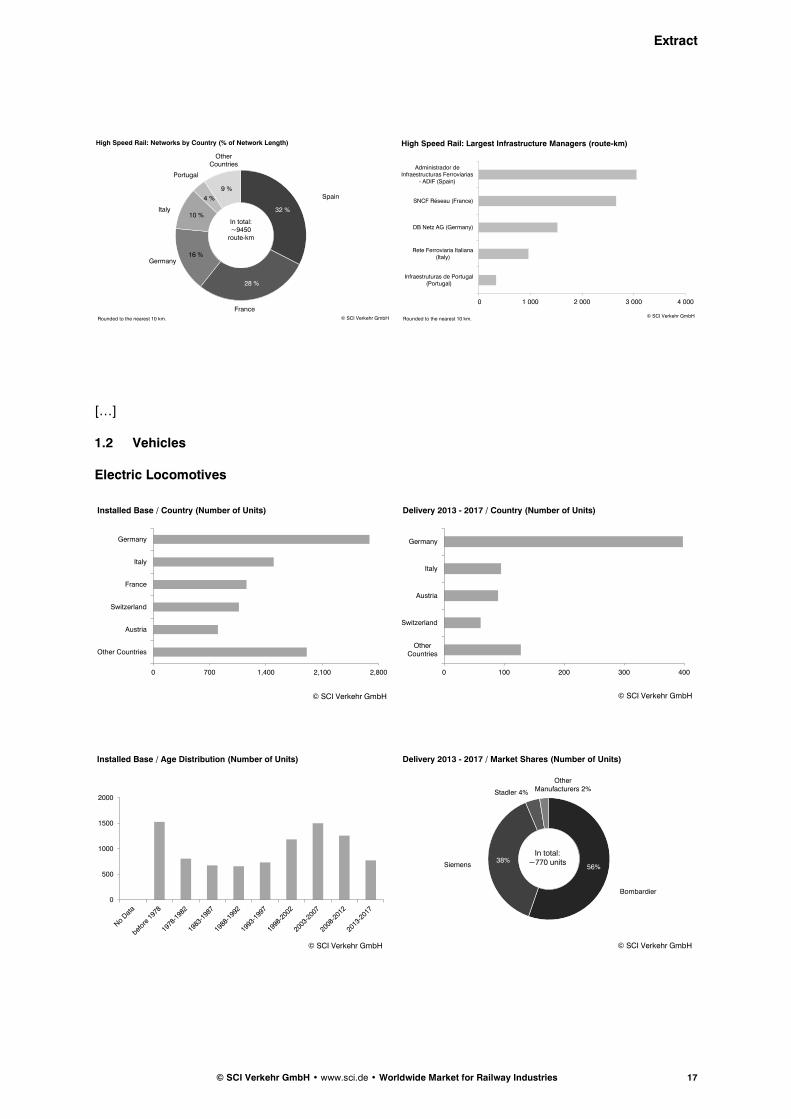
1.2 Vehicles
Electric Locomotives
32 %
28 %
16 %
10 %
4 %
9 %
High Speed Rail: Networks by Country (% of Network Length)
© SCI Verkehr GmbHRounded to the nearest 10 km.
In total: ~9450
route-km
Spain
France
Germany
Italy
Portugal
Other Countries
0 1 000 2 000 3 000 4 000
Administrador deInfraestructuras Ferroviarias
- ADIF (Spain)
SNCF Réseau (France)
DB Netz AG (Germany)
Rete Ferroviaria Italiana(Italy)
Infraestruturas de Portugal(Portugal)
High Speed Rail: Largest Infrastructure Managers (route-km)
© SCI Verkehr GmbHRounded to the nearest 10 km.
0 700 1,400 2,100 2,800
Other Countries
Austria
Switzerland
France
Italy
Germany
Installed Base / Country (Number of Units)
© SCI Verkehr GmbH
0 100 200 300 400
OtherCountries
Switzerland
Austria
Italy
Germany
Delivery 2013 - 2017 / Country (Number of Units)
© SCI Verkehr GmbH
0
500
1000
1500
2000
Installed Base / Age Distribution (Number of Units)
© SCI Verkehr GmbH
56%38%
Delivery 2013 - 2017 / Market Shares (Number of Units)
© SCI Verkehr GmbH
In total: ~770 units
Bombardier
Siemens
Stadler 4%
Other Manufacturers 2%
Extract
© SCI Verkehr GmbH • www.sci.de • Worldwide Market for Railway Industries 18
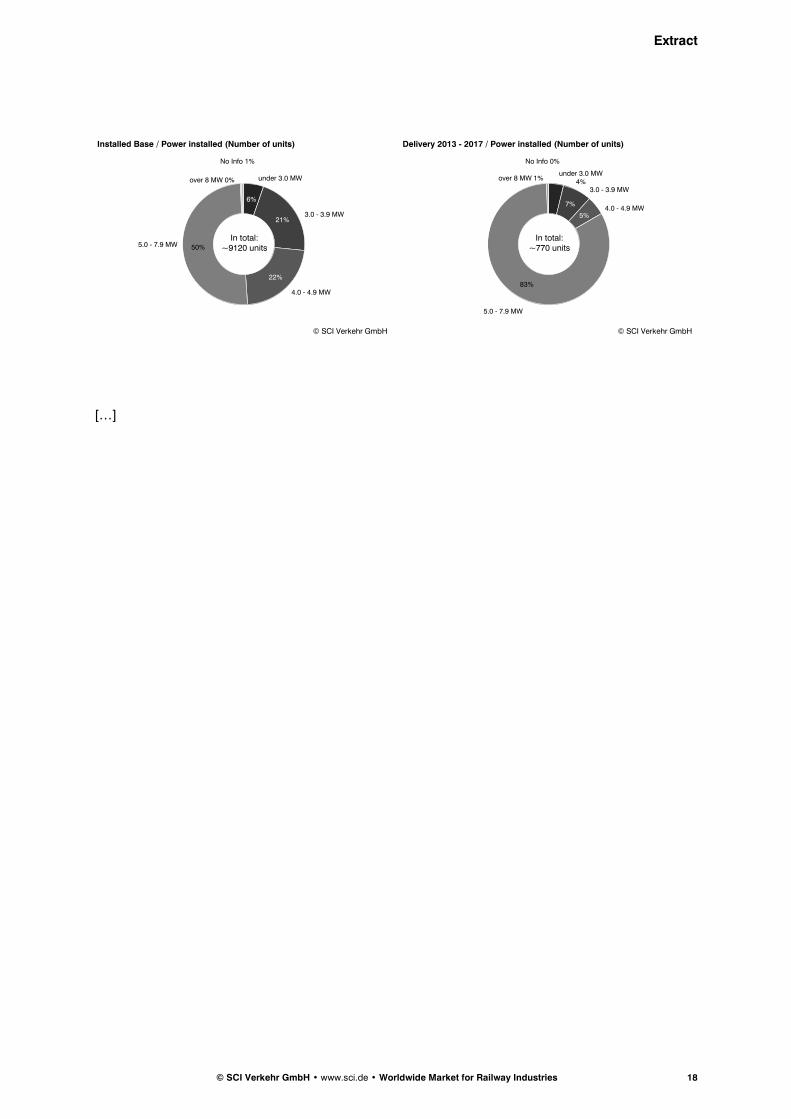
[…]
6%
21%
22%
50%
Installed Base / Power installed (Number of units)
© SCI Verkehr GmbH
In total: ~9120 units
under 3.0 MW
3.0 - 3.9 MW
4.0 - 4.9 MW
5.0 - 7.9 MW
over 8 MW 0%
No Info 1%
7%
5%
83%
Delivery 2013 - 2017 / Power installed (Number of units)
© SCI Verkehr GmbH
In total: ~770 units
under 3.0 MW 4%
3.0 - 3.9 MW
4.0 - 4.9 MW
5.0 - 7.9 MW
over 8 MW 1%
No Info 0%
SCI Verkehr GmbH Schanzenstraße 117 Geschäftsführende Gesellschafterin Maria Leenen Deutsche Bank Hamburg 200 700 24 www.sci.de 20357 Hamburg / Deutschland Registergericht Amtsgericht Hamburg Kontonummer 329 68 60 T +49 (0)40 507197-0 Geschäfts-Nr. 66 HR B 56 572 SWIFT-CODE DEUTDEDBHAM F +49 (0)40 507197-20 Umsatzsteuer ID-Nr. DE 164981264 IBAN DE 55200700240329686000
Order Multi Client Study
Worldwide Market for Railway Industries 2018
Publication date: September 2018
Office Cologne Alexander Apking Vor den Siebenburgen 2 50670 Köln Phone +49 221 93178 20 Fax +49 221 93178 78 E-Mail [email protected] www.sci.de
I would like to order the following option:
PDF file in English for 4,000 €
PDF and printed copy in English for 4,400 €
PDF file + Data in Excel format in English for 6,500 €
PDF and printed copy + Data in Excel format in English for 6,900 €
Additional consulting service* for a surcharge of 2,000 €
Company:
Contact person:
Position:
Street, Number.:
Postcode, Town:
Country:
Phone:
Email:
VAT Number (EU countries)
Other invoice address
Date Signature / Stamp * In addition to the purchased study, the project manager will be available for one day to present the study or to give in-depth explanations by phone or on-site (plus travel expenses) All prices exclude VAT Confirmation of order, delivery of the study document and/or invoice takes place on workdays within 24 hours. We reserve the right to deliver only against advance payment. The order is subject to the General Terms and Conditions of SCI Verkehr GmbH (dated 08.06.2007, place of jurisdiction is Hamburg) and the terms of use for purchasing MC Studies.
Büro Hamburg
SCI Verkehr GmbH
Schanzenstraße 117
20357 Hamburg
Tel.: 49 (0) 40 5071970
Fax: 49 (0) 40 50719720
Büro Köln
SCI Verkehr GmbH
Vor den Siebenburgen 2
50676 Köln
Tel.: 49 (0) 221 931780
Fax: 49 (0) 221 9317878
Büro Berlin
SCI Verkehr GmbH
Wilhelmine-Gemberg-Weg 6
Eingang I
10179 Berlin
Tel.: 49 (0) 30 2844540
Fax: 49 (0) 30 28445420
E-Mail: [email protected]
www.sci.de
Impressum:
© SCI Verkehr GmbH