Embed Size (px)
Citation preview

W P C A
Worldwide Pollution
Control Association
WPCA-Duke Energy
FF/HAPS Seminar
October 12-13, 2011
Visit our website at www.wpca.info
All presentations posted on this website are copyrighted by the Worldwide Pollution
Control Association (WPCA). Any unauthorized downloading, attempts to modify or to
incorporate into other presentations, link to other websites, or to obtain copies for any
other purposes than the training of attendees to WPCA Conferences is expressly
prohibited, unless approved in writing by the WPCA or the original presenter. The
WPCA does not assume any liability for the accuracy or contents of any materials
contained in this library which were presented and/or created by persons who were
not employees of the WPCA.

Applications and Evaluation of PPS Media in Baghouses
Robert Snyder - B&W Technology
.1

O tliOutline
PPS types and configurationyp g
PerformanceEmissionPressure DropBaglife
.2

M t t i l T f PPS BMost typical Types of PPS Bags
PPS – either self supported or scrim supportedPPS either self supported or scrim supported
PPS+ – enhanced via P84 or micro denierPPS+ enhanced via P84 or micro denier
PPSm membranePPSm– membrane
.3

O iOverview:
Focus on Coal Fired Boiler Applications:Focus on Coal Fired Boiler Applications:
Factors that affect filter media interact:Factors that affect filter media interact:
*Temperature low normal upsetsTemperature – low – normal - upsets(Example plant winter low load 235F to
summer full load 335F)summer full load 335F)
.4
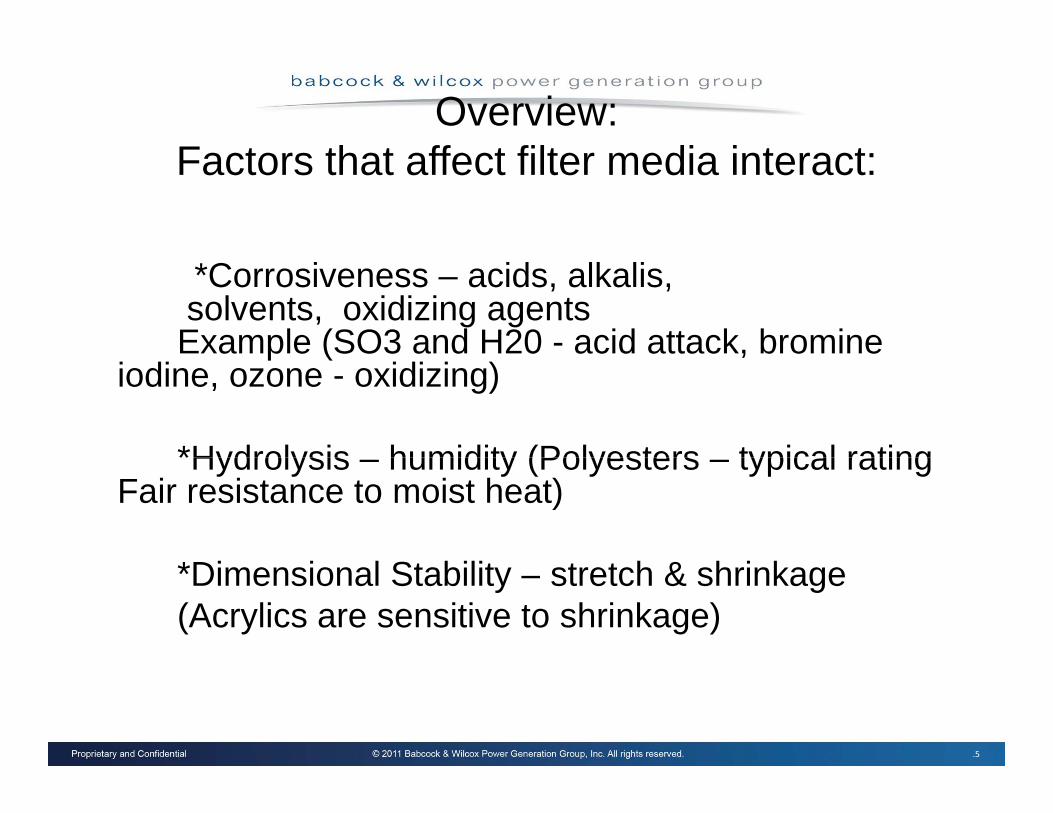
Overview:F t th t ff t filt di i t tFactors that affect filter media interact:
*Corrosiveness – acids, alkalis, solvents, oxidizing agentsExample (SO3 and H20 - acid attack, bromine p ( ,
iodine, ozone - oxidizing)
*Hydrolysis humidity (Polyesters typical ratingHydrolysis – humidity (Polyesters – typical rating Fair resistance to moist heat)
*Dimensional Stability – stretch & shrinkage(Acrylics are sensitive to shrinkage)
.5

Overview:F t th t ff t filt di i t tFactors that affect filter media interact:
.6

Old Ryton ChartsO d yto C a ts
.7

Old R t Ch tOld Ryton Chart
.8

P f IPerformance Issues
.9

Emissions
Collection efficiency for pulse-jet filters (felted fabrics) was investigated by Leith and Ellenbecker
N = N + NNo Nst + Nse
where: No = total outlet flux from filter, kg/m2s;Nst = flux fraction due to straight-through dust, kg/m2s;N = flux fraction due to seepage kg/m2sNse = flux fraction due to seepage, kg/m s.
Straight-through penetration is dust passing through the filter without being collected Seepage was dust collected by any mechanism butbeing collected. Seepage was dust collected by any mechanism but released at a later time during filtration.
No = Nse = k W2 V / twhere: t = time between cleaning pulses, s;
V = superficial filtration velocity, m/s;W = mass of dust per unit area on the filter, kg/m2;
.10
W mass of dust per unit area on the filter, kg/m ;k = a constant depending on fabric elasticity & dust release
properties, (ms)/kg.

R l ti E i i L b T tRelative Emissions Lab Tests
PPSm
PPS+
PPS
.11
0 5 10 15 20 25 30

E i i SEmissions - Seepage
PPS – theory and lab testing has good correlationPPS theory and lab testing has good correlation between cleaning frequency and emission.
PPS+ and PPSm – theory and lab testing does not have good correlation between cleaning frequency g g q yand emission.
.12

Emissions – ICR data – top 50 of 95 testedEmissions ICR data top 50 of 95 testedlb/mbtu
14
16
10
12
S i 1
6
8Series1
2
4
.13
00.001 and below .001 to .002 .002 to .003 .003 to .004 .004 to .005
E i iEmissions
Some of the plants in the ICR table were generally p g ybelow optimal level - lack of maintenance
Historically – emissions many times go down as bags age.
.14

Ti f E i i C t lTips for Emission Control
1 – fix casing-tubesheet leaks1 fix casing tubesheet leaks
2** – have good quality program when installing bags2 have good quality program when installing bags.
3 – monitor emissions on a daily basis (check analog3 monitor emissions on a daily basis (check analog opacity signal) – PJFF
4 – fix leaks when they occur – don’t hold off.
.15
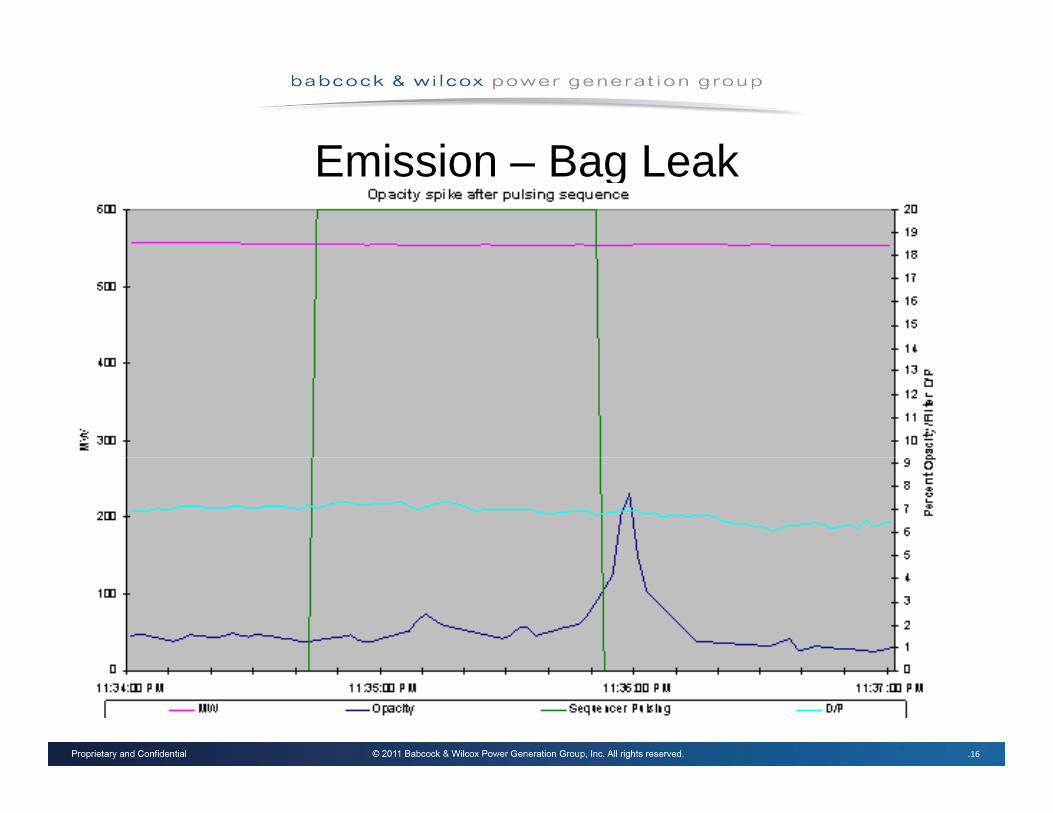
E i i B L kEmission – Bag Leak
.16

E i i b tiEmissions – some observations
Particle sizeParticle size
Lab versus actualLab versus actual
Locating leaksLocating leaks
.17

P f IPerformance Issues
Pressure DropPressure Drop
.18

General Equation Fabric Filter P DPressure Drop
The model is based upon “Fabric Filter - Baghouse I - Theory, D i d S l ti ” b J D M K d J H TDesign and Selection” by J.D. McKenna and J.H. Turner
The general equation is:The general equation is:
ΔP = SeV+KCV2t+ML
ΔP = pressure drop, in. w.c. unitsV = velocity of gas entering bag surface, ft/min
Se = residual drag in w c /(ft/min)Se = residual drag, in. w.c./(ft/min)K = specific cake coefficient, ([in. w.c.] * ft) / (lb * min)C = dust concentration times, lb/ft3
.19
t = time, minutes ML (mechanical loss)

B kd f P LBreakdown of Pressure Loss
PJFF overall dp = 6 inwcPJFF overall dp 6 inwc
Mechanical Loss – (manifolds dampers entranceMechanical Loss (manifolds, dampers, entrance and exit) = 2 inwc (typical value)
Residual drag – loss across the bag (permeability of new PPS 30 fpm @ .5 inwc (A/C of 3.5 fpm) dp = e S 30 p @ 5 c ( /C o 3 5 p ) dp0.06 inwc.
.20
Cake dp = 6inwc – 2 inwc - .06 inwc = 3.94 inwc

B P bilit (h i t l)Bag Permeability (horizontal)versus dp (vertical ) @ A/C 3.5 fpm
3.5
4
2.5
3
1.5
2
0.5
1
.21
00 5 10 15 20 25 30 35

P DPressure Drop
Loss in permeability over timeLoss in permeability over timeCommon to nearly all unitsExtreme - 11 months (6inwc -15inwc)Extreme - 11 months (6inwc -15inwc) Typical (PJ 3inwc (4yrs)
Event related Upsets – boiler tube leaksUpsets – boiler tube leaks
.22

P d hPressure drop changes
2
ML
BBag
Cake
1
.23
0 1 2 3 4 5 6

C St diCase Studies
.24

P L E l 1Pressure Loss Example 1
.25

P l E l 1Pressure loss Example 1
DP(inwc) Verus time (months)
10
12
( ) ( )
6
8
4
6DP(inwc) Verus time (months)
0
2
0 5 10 15 20 25 30
.26
0 5 10 15 20 25 30

E l 1 T 1 2Example 1 T=1,2
2
ML
BBag
Cake
1
.27
0 1 2 3 4 5 6

E l 1 T 1 24Example 1 T=1,24
2
ML
Bag
Cake
1
.28
0 1 2 3 4 5 6 7 8 9 10

E l 1Example 1
Findings:Findings:
Unit operates with dp control – off-line cleaningUnit operates with dp control off-line cleaning
Based upon rate of dp increase after one or twoBased upon rate of dp increase after one or two months –likely cleaned at maximum speed.
No obvious event related dp loss.
.29

P L E l 2Pressure Loss Example 2
Data available (unit PC fired with SDA and FF):Data available (unit PC fired with SDA and FF):Mw **Gas Flow **Gas Flow Gas Temp **Compartments open **Compartments open Dp **Cleaning SpeedCleaning SpeedTime** h ld t t d t h h t
.30
** held constant and not shown on chart

P L E l 2Pressure Loss Example 2
.31

E l 2Example 2
Conclusions:Conclusions:
Event during July caused fast cleaning frequencyEvent during July caused fast cleaning frequency which was recoverable.
A second event in September caused a fast cleaning frequency which was not recoverable. eque cy c as ot eco e ab e
.32

E l 3Example 3
Normal dp setting was 5.5 inwc.Normal dp setting was 5.5 inwc.
After 3 months of service dp 5 5 inwc cleaning 45After 3 months of service dp 5.5 inwc cleaning 45 minutes. At 10 minute cleaning speed dp was xx inwc.
After 12 months of service dp 5.5 inwc cleaning yyte o t s o se ce dp 5 5 c c ea g yyminutes. At 10 minutes cleaning speed dp was zzinwc.
.33

E l 3Example 3
What is annual rate of change in dp,What is annual rate of change in dp,
Method 1 - (zz-xx)Method 1 - (zz-xx)
Method 2 using pressure loss equations determineMethod 2 – using pressure loss equations determine the change in SE. (Se*V = dp). Most difficult to determine without good background data.dete e t out good bac g ou d data
.34
E l 3Example 3
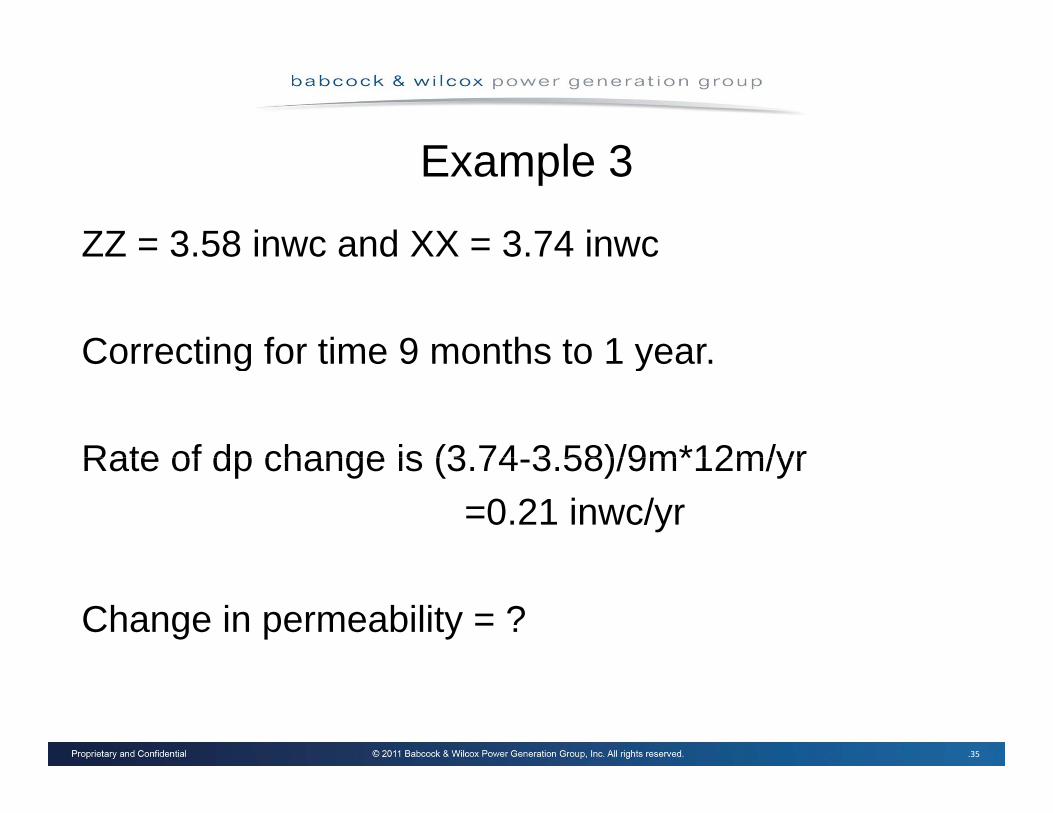
ZZ = 3.58 inwc and XX = 3.74 inwcZZ 3.58 inwc and XX 3.74 inwc
Correcting for time 9 months to 1 yearCorrecting for time 9 months to 1 year.
Rate of dp change is (3 74 3 58)/9m*12m/yrRate of dp change is (3.74-3.58)/9m 12m/yr=0.21 inwc/yr
Change in permeability = ?
.35

B P bilit (h i t l)Bag Permeability (horizontal)versus dp (vertical ) @ A/C 3.5 fpm
3.5
4
2.5
3
1.5
2
0.5
1
.36
00 5 10 15 20 25 30 35

E l 3Example 3
2
ML
BBag
Cake
1
.37
0 1 2 3 4 5 6

T ti f P bilitTesting of Permeability
Lab method – examination of air flow through a 6 inchLab method examination of air flow through a 6 inch diameter sample at 0.5 inwc.
Field Method – examination of air flow through the bag. g
.38

T b h t Fl Di t ib ti St dTubesheet Flow Distribution Study
During unit outage field permeability was examinedDuring unit outage field permeability was examined over a compartment. Grid 5x5 = 25 points.
Results –Maximum value <1 28 meanMaximum value 1.28 meanMinimum value > .71 meanSTD Deviation < 13%STD Deviation < 13%
.39

P D E l tiPressure Drop Evaluation
First Choice – look at operating dataFirst Choice look at operating data
Second Choice – field permeability data – most usefulSecond Choice field permeability data most useful in evaluating various materials over time.
Third choice - lab testing
.40

E l f ti fi ld t tiExample of comparative field testing100
708090
405060
Series1
102030
010
Polyester Pleated Nomex
.41
B lif P f IBag life versus Performance Issues
EmissionsEmissions
Pressure dropPressure drop
Maintenance CostMaintenance Cost
.42

B lif E i iBaglife - Emissions
PPS PPS+ PPSm ? seepagePPS PPS PPSm ? seepage
Condensable fraction ? Dp and cleaning rateCondensable fraction ? Dp and cleaning rate
Mercury PAC rate ?Mercury – PAC rate ?
Sorbent use ? (typical SDA 20% SO2 capture acrossSorbent use ? (typical SDA 20% SO2 capture across the PJFF)
.43

Baglife Emissions option Aag e ss o s opt odp maintained
2
ML
BBag
Cake
1
.44
0 1 2 3 4 5 6

Baglife Emissions option Bag e ss o s opt odp increased
22
ML
Bag
Cake
1
0 1 2 3 4 5 6
.45
O ti C tOperating Costs
Dp – loss of power for sale, higher fuel costs, higherDp loss of power for sale, higher fuel costs, higher sorbent costs
See previous 2 slides
.46

E i i l tiEmission evaluation
Opacity – monitor over timeOpacity monitor over time
PM – monitor annual testingPM monitor annual testing
.47

L b t tiLab testing
Permeability – usually done as received, afterPermeability usually done as received, after vacuuming, compared to new, (top middle bottom)
Weight –
Strength – mullen burst, tensile, elongation, flex testing, (can show little to no loss or extensive test g, (ca s o tt e to o oss o e te s eloss)
Microscopic examination – looking for penetration
.48
p g p

L b t tiLab testing
Visual examination – abrasion, cuts, stitchingVisual examination abrasion, cuts, stitching
Emission testing - ???? –valueEmission testing - ???? value
Report findingsReport – findings
.49

Case 1 - Low sulfur coal fired units without SO2 tcapture
PPS –operation <350F PJFF (life 2-5 years) –sensitive to temperature (winter – summer)p ( )
.50

Case 2 – Low Sulfur coal fired units with Dry FGD or CDSG o C S
PPS typical 3 yearsyp y
PPS+ 3 to 6 yearsPPS 3 to 6 years
PPSm ~ 5 yearsPPSm 5 years
.51
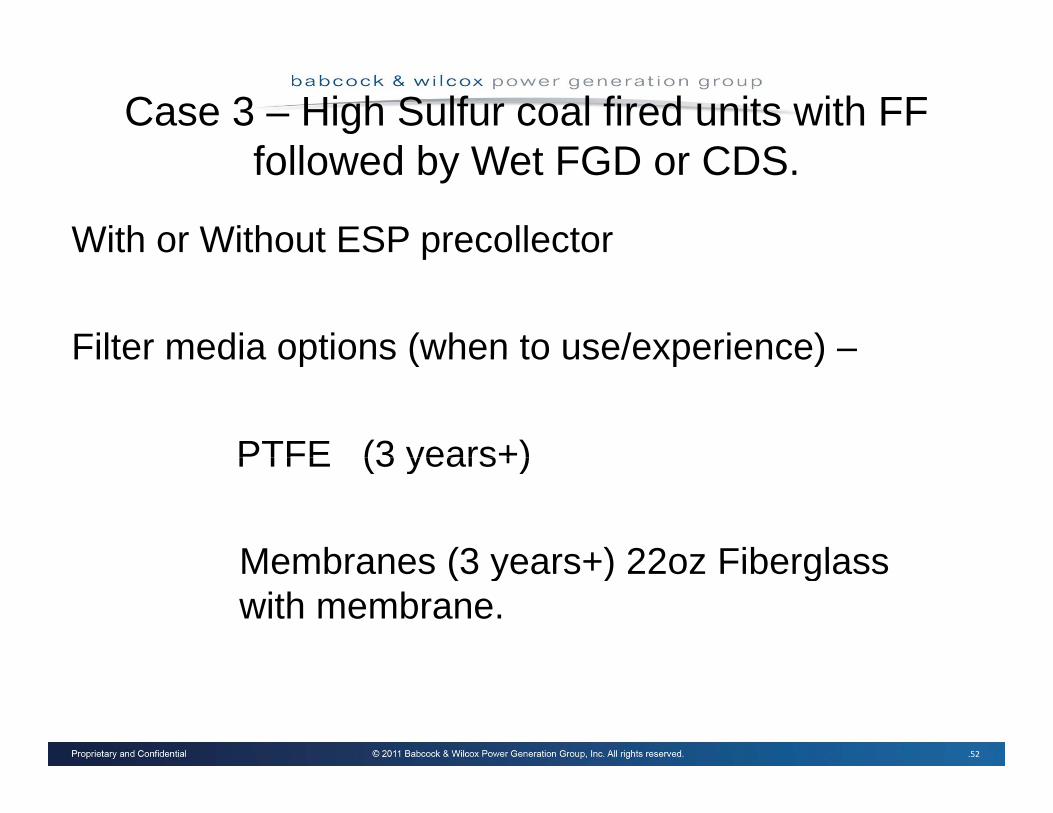
Case 3 – High Sulfur coal fired units with FF f ll d b W t FGD CDSfollowed by Wet FGD or CDS.
With or Without ESP precollectorp
Filter media options (when to use/experience) –Filter media options (when to use/experience)
PTFE (3 years+)PTFE (3 years+)
Membranes (3 years+) 22oz FiberglassMembranes (3 years+) 22oz Fiberglass with membrane.
.52

Case 3 – High Sulfur coal fired units with FF f ll d b W t FGD CDSfollowed by Wet FGD or CDS.
With or Without ESP precollectorp
Filter mediaFilter media
PPS PPS+ and PPSm – coupled with SO3PPS, PPS+ and PPSm – coupled with SO3 mitigation (Lime injection)
.53
SSummary
Selection of PPS type – test/evaluate all threeSelection of PPS type test/evaluate all three
Rely on historical operation data for bag permeabilityRely on historical operation data for bag permeability
Consider annual PM tests for maintenance predictionConsider annual PM tests for maintenance prediction
Conduct annual strength testsConduct annual strength tests
.54

Questions?Thank you.
.55