Embed Size (px)
Citation preview
University of Warwick institutional repository: http://go.warwick.ac.uk/wrap
This paper is made available online in accordance with publisher policies. Please scroll down to view the document itself. Please refer to the repository record for this item and our policy information available from the repository home page for further information.
To see the final version of this paper please visit the publisher’s website. Access to the published version may require a subscription.
Author(s): María Carmen Gallardo, Julia Manchado, Francisco Javier Romero, Jaime del Cerro, Ekhard K. H. Salje, Antoni Planes, Eduard Vives, Ricardo Romero and Marcelo Stipcich Article Title: Avalanche criticality in the martensitic transition of Cu67.64Zn16.71Al15.65 shape-memory alloy: A calorimetric and acoustic emission study
Year of publication: 2010 Link to published article: http://dx.doi.org/ 10.1103/PhysRevB.81.174102 Publisher statement: None
1
Avalanche criticality in the martensitic transition of a Cu-Zn-Al
shape-memory alloy. A calorimetric and acoustic emission study
María Carmen Gallardo, Julia Manchado, Francisco Javier Romero, Jaime del Cerro
Departamento de Física de la Materia Condensada, Universidad de Sevilla, PO Box
1065, E-41080 Sevilla, Andalucia, SPAIN
Ekhard K.H. Salje
Department of Earth Sciences, University of Cambridge, Downing Street, Cambridge
CB2 3EQ, UK
Antoni Planes
Departament d'Estructura i Constituents de la Matèria. Facultat de Física.
Universitat de Barcelona. Diagonal 647, E-08028 Barcelona, Catalonia
Eduard Vives
Department of Physics, University of Warwick, Coventry CV4 7AL, UK
Ricardo Romero and Marcelo Stipcich
IFIMAT. Universidad del Centro de la Provincia de Buenos Aires. Pinto 399. 7000
Tandil. Argentina.
PACS: 81.30.Kf, 65.40.-b, 64.60.av, 64.60.My
e-mail: [email protected]
2
Abstract
The first order diffusionless structural transition in Cu67.64Zn 16.71Al 15.65 is characterized
by jerky propagation of phase fronts related to the appearance of avalanches. In this
paper we describe a full analysis of this avalanche behavior using calorimetric heat flux
measurements and acoustic emission measurements. Two different propagation modes,
namely smooth front propagation and jerky avalanches, were observed in extremely
slow measurements with heating and cooling rates as low as a few 10-3
K/h. Avalanches
show criticality where each avalanche leads to a spike in the heat flux. Their statistical
analysis leads to a power law ( )(EP ~ E where P(E)dE is the probability to observe
an avalanche with energy E in an interval between E and E+dE) with an energy
exponent of 15.015.2 in excellent agreement with the results of acoustic
emission measurements.
Avalanches appear to be more common for heating rates faster than 5 10-3
K/h whereas
smooth front propagation occurs in all calorimetric measurements and (almost)
exclusively for slower heating rates. Repeated cooling runs were taken after a waiting
time of 1 month (and an intermediate heating run). Correlations between the avalanche
sequences of the two cooling runs were found for the strongest avalanche peaks but not
for the full sequence of avalanches. The memory effect is hence limited to strong
avalanches.
3
1. Introduction
The thermodynamic analysis of continuous phase transitions requires thermal
fluctuations even when the transitions occur under circumstances in which the mean
field description is not an approximation but strictly correct (such as in ferroelastic
transitions). The most direct experimental observation of thermal fluctuations in
continuous transitions, relates to the measurements of specific heat anomalies, which
either display critical phenomena [1-5] or mean field behavior [2][6-9] independently of
the nature and the characteristic bonding mechanism of the material.. This situation is
different in stepwise, first order transitions where the transition near the interface
between the high and low temperature phase is riddled with metastable states. If the co-
existence interval between the two phases is small it becomes difficult to explore such
metastabilities. Previous work relates mainly to oxides and fluorites with perovskite
structure where transitions such as in Ca doped KMnF3 show essentially a smooth
mean field behavior for both the continuous transitions (high Ca content) and the
discontinuous transition (low Ca content)[10-12]. It appears that the resolution of
experimental techniques is insufficient (so far) to observe metastable states in such
systems. On the other hand, when the co-existence interval is large, as in many
martensitic shape memory alloys, one observes that the transition behavior is dominated
by local transitions between metastable configurations which are not thermally activated
[13-17]. The energy landscape is rough and transitions between states can be initiated
by changes of conjugated fields such as stress, magnetic fields, electric field and so
forth. If the non-thermal excitations dominate the transition, the transition behavior is
termed athermal [18-21]. Athermal phase transformations are much more common
phenomenon than just encountered in martensitic phase transformations, they have also
4
been observed in minerals and ceramics [22-25]. While athermal transitions are
expected to be a rather common phenomenon they are also limited to a specific range of
external parameters under which they can be observed [18]. We will argue in this paper
that the cut-off below which no athermal transitions occur is below a lower limit for the
heating/cooling rate (< 5 10-3
K/h for Cu 67.64 Zn 16.71 Al 15.65 ) where the transition still
progresses but where no avalanches were found. At higher heating rates we see spikes
in the calorimetric response.
While the observation of specific heat anomalies is a very common technique in
(nearly) second order phase transitions the equivalent observations in strongly first
order transition are rather uncommon. The reason is that the observation at fast scanning
rates shows large, integrated peaks of the latent heat which mask the underlying fine
structure. This fine structure is only seen under relatively slow scanning rates and
consists of spikes which relate to sudden transfers between metastable states [26-29].
Even their theoretical description is not much advanced besides the result that such
spikes and avalanches are – over a large range in parameter space – critical and that the
analysis will follow power law behavior over 1-3 orders of magnitude. Computer
simulations have given some further insight into the character of the metastable states
while a full description depends sensitively on the size of the simulated cell [30-35]. In
particular, the role of dislocations [17] [36] has been invoked to describe the physical
origin of avalanches. Recent experimental work on CuAlBe [26] showed that
dislocations where indeed nucleated during the phase transformation which lead to
intense pinning of twin boundaries in the martensitic phase. Avalanches in the elastic
response were observed in the co-existence interval while a direct connection of the
dislocation density and the transformation mechanism remained elusive.
5
The importance of heat flow measurements is that they integrate over all trajectories
between metastable states and is, thus, an objective and unbiased observer of all
mechanisms which may play a role in the phase transformation. The only limitation is
that any measurement of caloric quantities requires that the time needed for the heat
flow is short compared with the characteristic time of the phase transformation. This is a
trivial requirement in displacive second order transitions where the characteristic time
of the transformation is determined by the soft mode. This situation becomes more
complicated in transitions of the order/disorder type where equilibrium states may be
obtained only after excessive times [37]. In stepwise transitions we find that the
characteristic times for athermal changes can be very long (in fact logarithmically long
in spin glasses) but still finite in martensites where the experimentally observed time
between larger avalanches is sufficiently long when the transition is thermally driven.
This requires that the characteristic time for the experimental observation of avalanches
has to be longer than the time required to induce such avalanches. Empirically we have
found that avalanche signals do not overlap and still produce measurable signals when
the heating/cooling time of the experiment is between 5 10-3
K/h and 0.1 K/h. On this
time scale we can distinguish between events which are clearly related to avalanches
and those which relate to a smooth background while acoustic emission experiments
analyze the avalanche part only. The intrinsic difficulty, even with calorimetric
measurements, remains that very small avalanches could form part of the background so
that some of the smooth part of the transition behavior may still contain avalanches
which were unresolved experimentally. However, changes of regimes between
macroscopically smooth and jagged behavior are clearly observed. It is the purpose of
this paper to give, for the first time, the results of heat flux and acoustic emission
measurement of the archetypal shape memory alloy Cu-Zn-Al.
6
2. Sample Preparation
The Cu-Zn-Al sample was prepared by alloying 99.99% purity copper, zinc and
aluminum. Small pieces with appropriate masses (weighted with a precision of 0.1 mg)
of each metal were cut and melted in a sealed quartz tube under a partial Ar atmosphere
in a resistive furnace. The melt was vigorously shaken several times in order to obtain a
homogeneous solution. After solidification, the alloy was homogenized at 1073 K for
about four days, and air-cooled to room temperature. The nominal composition of the
alloy was Cu (67.64 at%), Zn ( 16.71 at%) , Al (15.65 at%).
The Cu-based shape-memory alloys (SMAs) transforms from a high-temperature L21
(Fm3m) structure to several possible martensitic phases, depending on the composition.
For this composition the transition proceeds to a 18R (I2/m) phase.
From ingots, samples were cut with a low speed diamond saw. The slices were
subjected to an isothermal aging at 1173 K for 7500 s and subsequently air - cooled
to room temperature. This heat treatment ensures samples with a highly ordered state,
free from internal stresses and with minimum vacancy concentration. Moreover, this
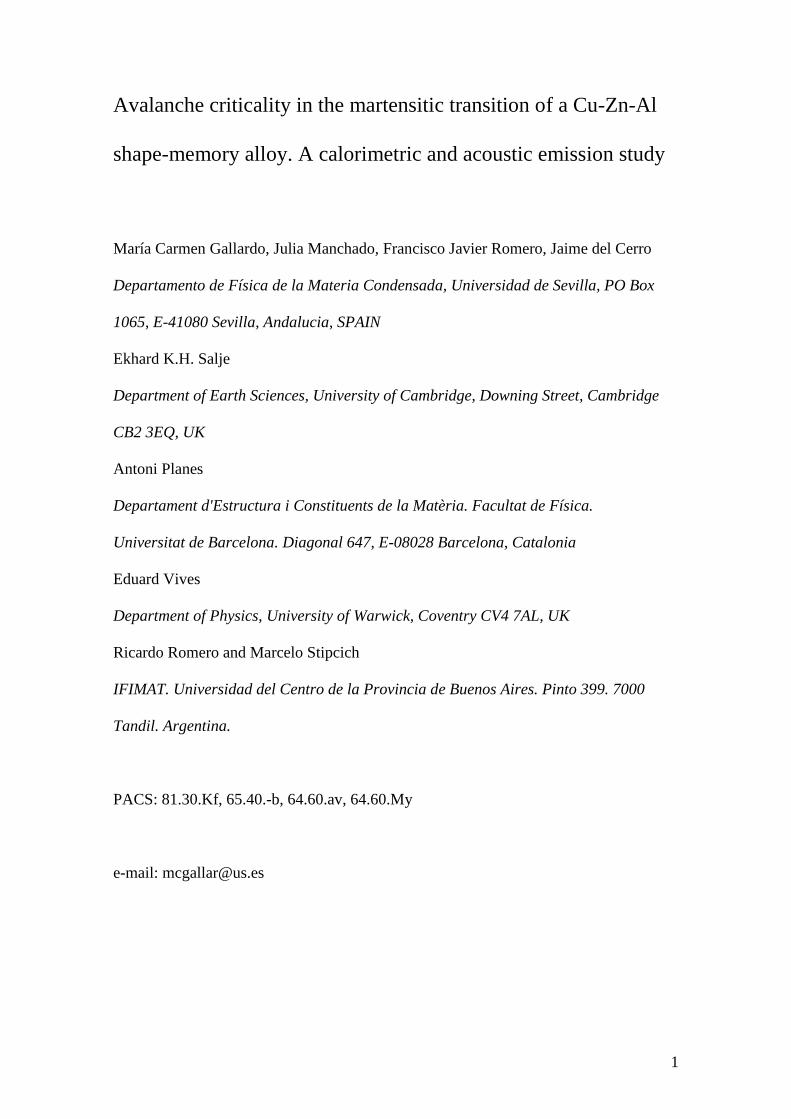
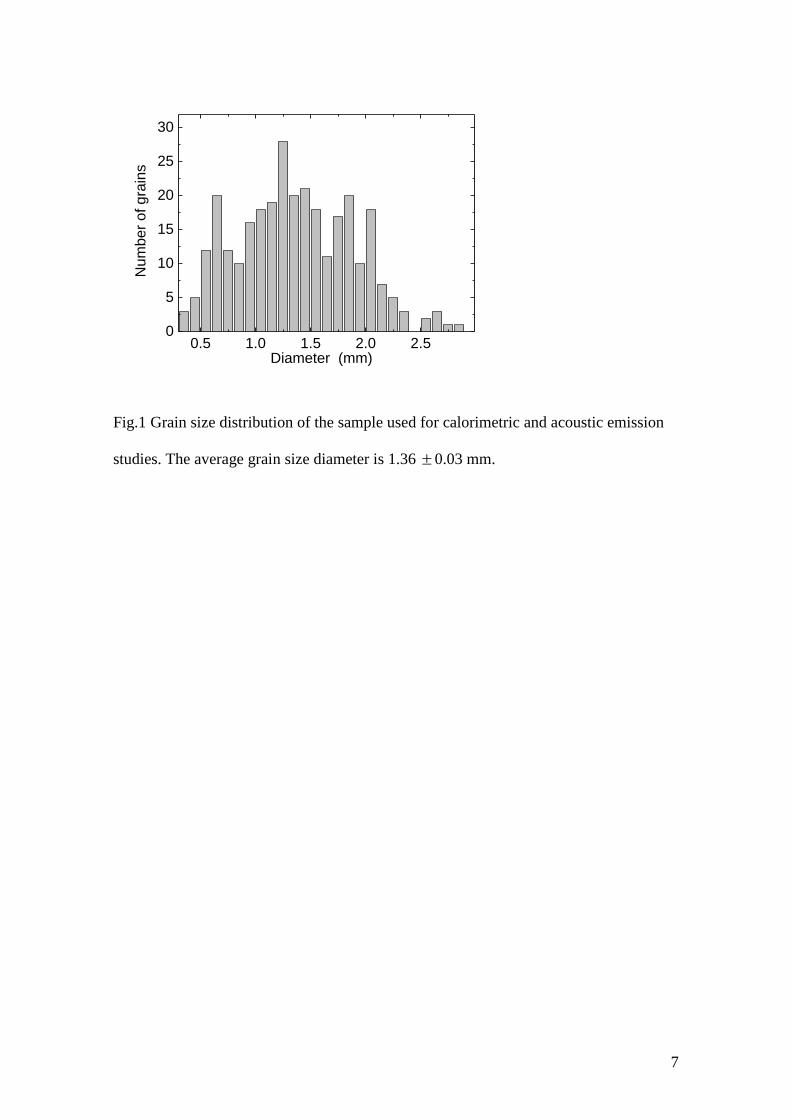
heat treatment resulted in a large grain size with average diameter of 1.36 mm (Fig.1).
The sample used in the calorimetric measurements had a flat surface of 0.94 cm2, a
thickness of 0.389 cm and a mass of 2.6503 g. The sample for AE measurements was
much smaller with dimensions of approx. 0.5 x 0.5 x 0.1 cm and a mass of 0.185 g.
7
0.5 1.0 1.5 2.0 2.50
5
10
15
20
25
30
Num
ber
of
gra
ins
Diameter (mm)
Fig.1 Grain size distribution of the sample used for calorimetric and acoustic emission
studies. The average grain size diameter is 1.36 0.03 mm.
8
3. Experimental methods
Measurements of heat flux and specific heat were performed using a high
resolution conduction calorimeter, which has been described in detail elsewhere [38].
The sample is pressed between two identical heat fluxmeters, which are made from 50
chromel-constantan thermocouples connected in series, with the wires placed in parallel
lines[39]. Two electrical resistance heaters are placed near the sample surface and the
fluxmeter. These heaters dissipate heat uniformly to the sample surface. The assembly is
placed in a cylindrical hole located axially in a bronze cylinder (10 kg) which serves as
heat sink and constitutes the calorimeter block. The block temperature is measured with
a commercial platinum thermometer (Leads and Northrup model 8164B). The block and
two surrounding radiation shields are placed into a hermetic outer case under vacuum
(10-7
torr). The assembly, surrounded by a coiled tube, is placed in a Dewar jar filled
with alcohol. The temperature of the alcohol bath is controlled by circulation of liquid
N2 through the coil. A Pt-100 thermometer and a Eurotherm 818 controller are used for
the temperature control.
The heat flux is evacuated through the fluxmeters and allows measurement of
heat flux better than 0.1 W . Due to the high thermal inertial of the calorimetric block,
the temperature changes are some 10-3
K/h with temperature fluctuations of the
calorimeter block smaller than 10-6
K.
A long-periodic series of square thermal pulses is superimposed on a heating or
cooling ramp. Integration of the electromotive force (emf) given by the fluxmeters
between steady states determines the thermal capacity of the sample [40].
The equipment also works as a differential thermal analysis (DTA) device. A
DTA trace is quasi-continuously measured (12.5 measurements per second) using the
9
same temperature scanning rate as applied during measurement of the specific heat.
The emf given by the fluxmeters is proportional to the heat flux, D the integral with
respect to a suitable base line is proportional to the excess enthalpy of the sample.
The value of the latent heat is obtained by integration of vD , where v is the
temperature scanning rate, with respect to an appropriate baseline. The sensitivity of this
method is estimated to be better than 5 mJ [41-46].
Acoustic emission (AE) measurements were carried out on a small square sample
(dimensions: 5x5x1 mm) cut from the same rod beside the sample used for calorimetric
measurements. AE was detected using a piezoelectric transducer, acoustically coupled
to the sample. The detected signal was preamplified (40 dB) and monitored by a PCI-2
acquisition system from Euro Physical Acoustics S.A., at a sampling rate of 2
MSamples/s. A 100 kHz-1 MHz bandwidth filter was used in order to reduce noise.
From the recorded signal, individual AE hits were defined by using a threshold of 45 dB.
When the signal crosses the threshold a hit starts. When the signal remains below the
threshold more than 100 s the hit ends. This is the so called Hit Detection Threshold,
HDT. The system allows a maximum duration of the detected signals of 10 ms. Hits
were recorded during cooling and heating ramps between 270 K and 215 K at rates in
the range 1 K/min to 0.5 K/min. The typical number of detected events in a ramp was
5000 during cooling and 17000 during heating. The experimental setup allows the
direct measurement of the energy associated with each individual hit by performing a
fast integration of the square of the signal. This measurement provides information
related to the recorded signals but its relation to the energy released by the source of AE
is, a priori, not reliably established.
10
4. Experimental Results
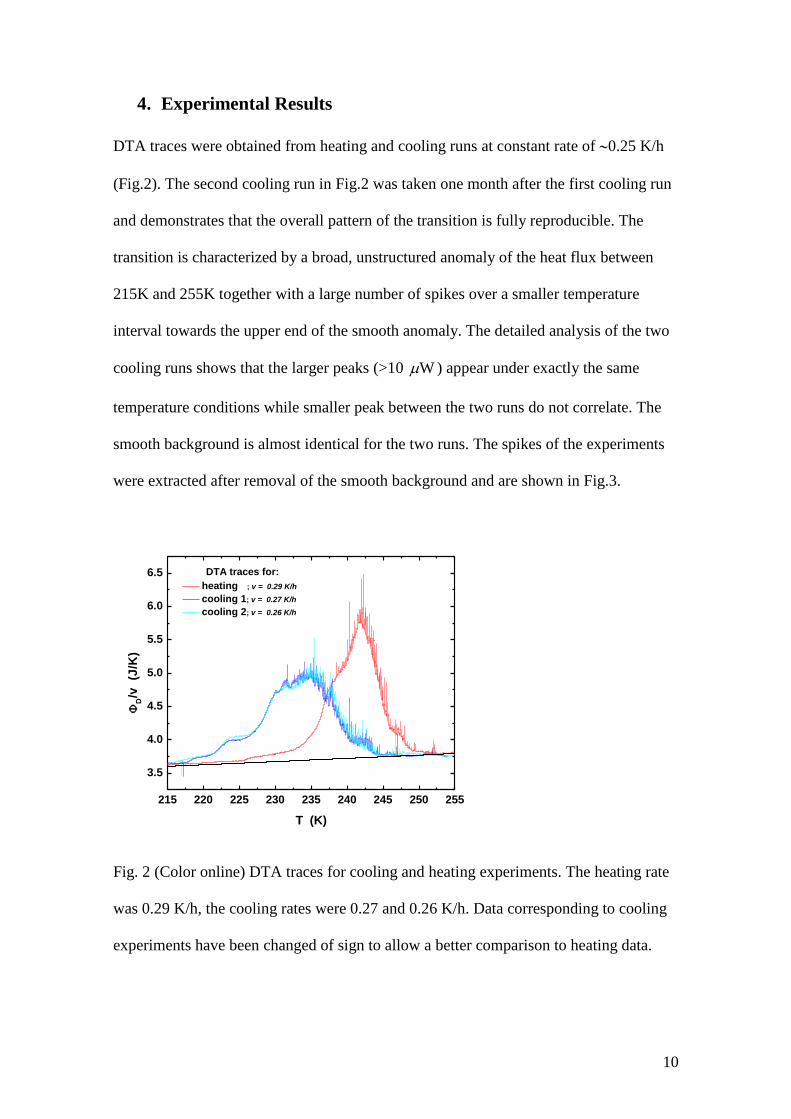
DTA traces were obtained from heating and cooling runs at constant rate of 0.25 K/h
(Fig.2). The second cooling run in Fig.2 was taken one month after the first cooling run
and demonstrates that the overall pattern of the transition is fully reproducible. The
transition is characterized by a broad, unstructured anomaly of the heat flux between
215K and 255K together with a large number of spikes over a smaller temperature
interval towards the upper end of the smooth anomaly. The detailed analysis of the two
cooling runs shows that the larger peaks (>10 W ) appear under exactly the same
temperature conditions while smaller peak between the two runs do not correlate. The
smooth background is almost identical for the two runs. The spikes of the experiments
were extracted after removal of the smooth background and are shown in Fig.3.
215 220 225 230 235 240 245 250 255
3.5
4.0
4.5
5.0
5.5
6.0
6.5
heating ; v = 0.29 K/h
cooling 1; v = 0.27 K/h
cooling 2; v = 0.26 K/h
D/v
(J
/K)
T (K)
DTA traces for:
Fig. 2 (Color online) DTA traces for cooling and heating experiments. The heating rate
was 0.29 K/h, the cooling rates were 0.27 and 0.26 K/h. Data corresponding to cooling
experiments have been changed of sign to allow a better comparison to heating data.
11
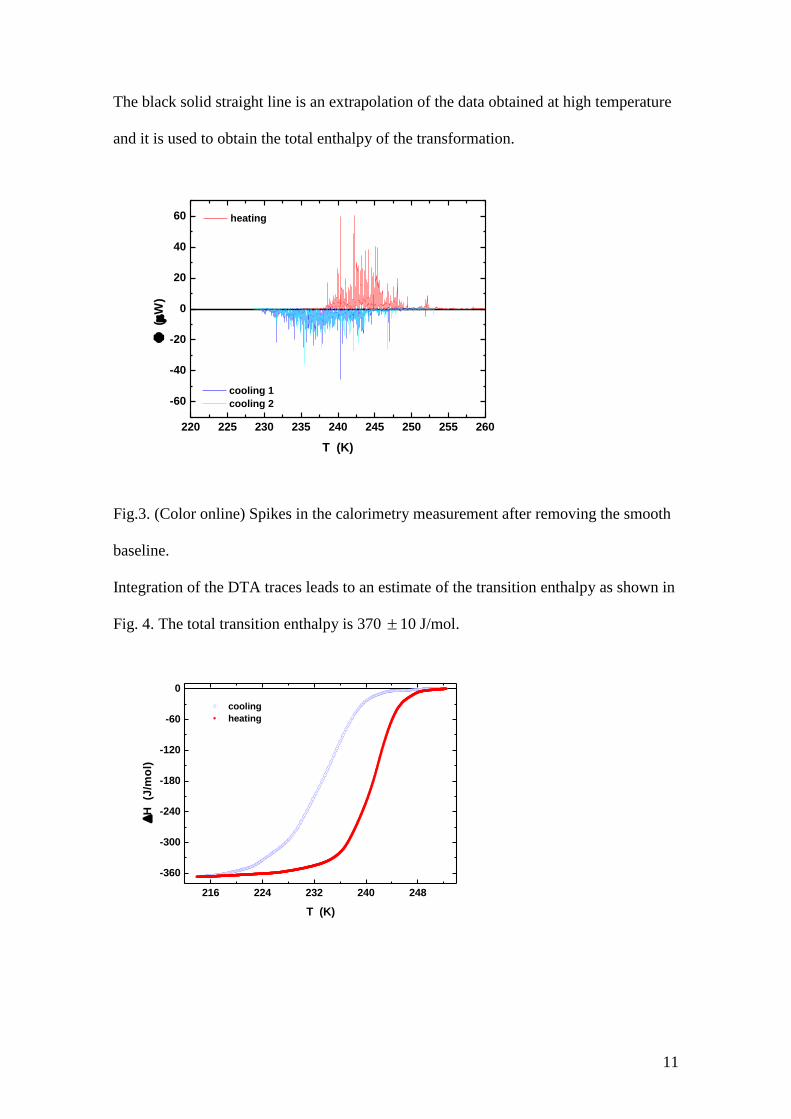
The black solid straight line is an extrapolation of the data obtained at high temperature
and it is used to obtain the total enthalpy of the transformation.
220 225 230 235 240 245 250 255 260
-60
-40
-20
0
20
40
60
cooling 1
cooling 2
(W
)
T (K)
heating
Fig.3. (Color online) Spikes in the calorimetry measurement after removing the smooth
baseline.
Integration of the DTA traces leads to an estimate of the transition enthalpy as shown in
Fig. 4. The total transition enthalpy is 370 10 J/mol.
216 224 232 240 248
-360
-300
-240
-180
-120
-60
0
cooling
heating
H
(J
/mo
l)
T (K)
12
Fig.4 (Color online) Integrated transition enthalpy for heating and cooling runs. The
total enthalpy change is, within experimental errors, identical for heating and cooling
experiments.
The latent heat has two contributions. The first is related to the smooth background
(between T1 = 215 K and T3 = 253 K) and the second arises from the spikes observed in
the range between T2 = 230 K (on cooling) and T3 which are superimposed to the
smooth background. It has been estimated that only 10% of the total excess heat in the
cooling experiment corresponds to the spikes shown in Fig.3. In order to analyze
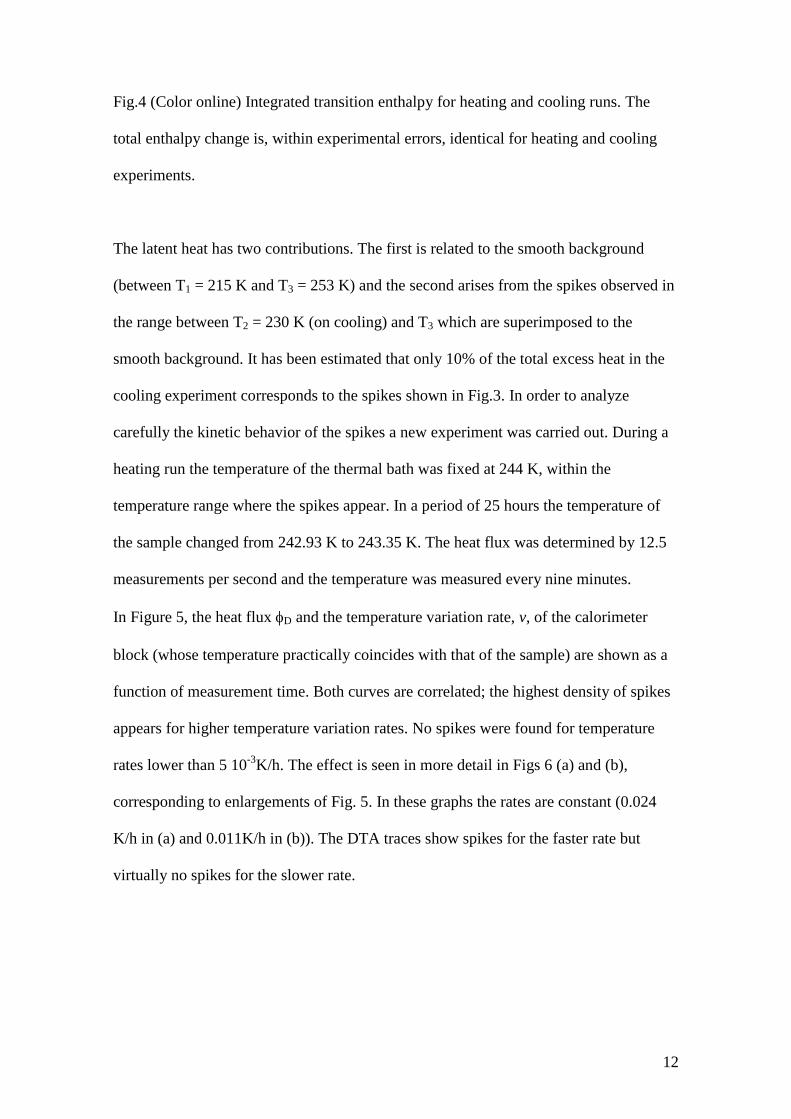
carefully the kinetic behavior of the spikes a new experiment was carried out. During a
heating run the temperature of the thermal bath was fixed at 244 K, within the
temperature range where the spikes appear. In a period of 25 hours the temperature of
the sample changed from 242.93 K to 243.35 K. The heat flux was determined by 12.5
measurements per second and the temperature was measured every nine minutes.
In Figure 5, the heat flux D and the temperature variation rate, v, of the calorimeter
block (whose temperature practically coincides with that of the sample) are shown as a
function of measurement time. Both curves are correlated; the highest density of spikes
appears for higher temperature variation rates. No spikes were found for temperature
rates lower than 5 10-3
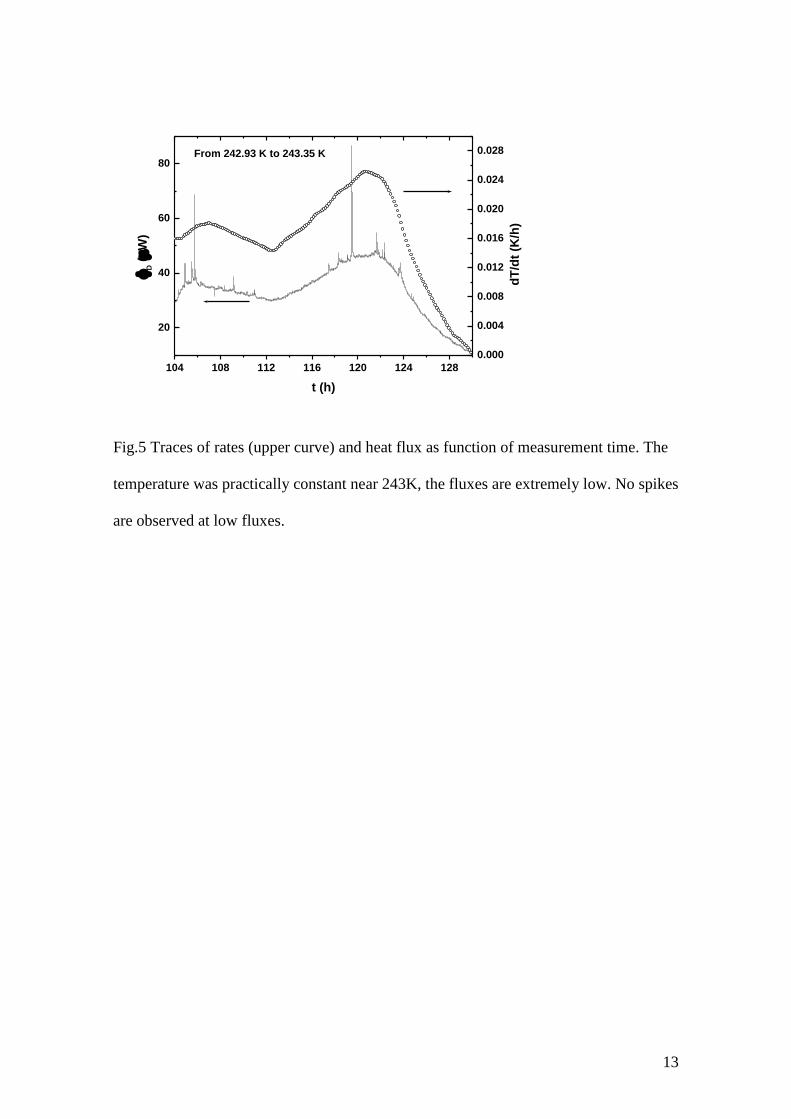
K/h. The effect is seen in more detail in Figs 6 (a) and (b),
corresponding to enlargements of Fig. 5. In these graphs the rates are constant (0.024
K/h in (a) and 0.011K/h in (b)). The DTA traces show spikes for the faster rate but
virtually no spikes for the slower rate.
13
104 108 112 116 120 124 128
20
40
60
80
D (
W)
t (h)
0.000
0.004
0.008
0.012
0.016
0.020
0.024
0.028From 242.93 K to 243.35 K
dT
/dt
(K/h
)
Fig.5 Traces of rates (upper curve) and heat flux as function of measurement time. The
temperature was practically constant near 243K, the fluxes are extremely low. No spikes
are observed at low fluxes.
14
121.0 121.2 121.4 121.6 121.8 122.045
50
55
60
(a)
D (
W)
t (h)
0.000
0.004
0.008
0.012
0.016
0.020
0.024
0.028
dT
/dt
(K/h
)
125.0 125.2 125.4 125.6 125.8 126.015
20
25
30
35
(b)
D (
W)
t (h)
0.000
0.004
0.008
0.012
0.016
0.020
0.024
0.028
dT
/dt
(K/h
)
Fig 6. DTA traces at constant temperature rates with spikes for the faster rate (a) and no
spikes for the slower rate (b).

15
We now report on the investigation of the phase transformation using the AE technique.
Fig. 7 shows the AE activity as a function of temperature. The acoustic activity is
represented by a histogram giving the number of hits in intervals of 0.04 K.
Fig.7. (Color online) Acoustic emission activity as a function of temperature for the
forward and reverse transitions
AE was found in a slightly smaller temperature interval as the spikes in the calorimetric
experiments (Fig.3), where spikes were observed at 230K. The cooling rate in the AE
experiment is faster than in the calorimeter so that the difference of 6K for the onset of
spikes may be due to kinetic effects or a feature of the very different masses of the two
samples. Extremely low rates were not used in the AE experiments so that we can not
tell whether the decay of the spikes at very low rates also occurs in AE. These data
confirm previous observations [47].
5. Avalanche statistics
We now turn to the discussion of the statistical analysis of the spikes in the calorimetric
and acoustic emission experiments. Inspection of Figs. 3 and 7 already leads to the
conclusion that both features have the same physical origin. It is understood that the AE
16
signals record avalanche behavior in Cu 67.64 Zn 16.71 Al 15.65 so that we can assume that
avalanches are also at the origin of the spikes in the calorimetric measurements. It needs
to be born in mind, however, that avalanches seen in calorimetry are vastly more
energetic than those seen in AE. If, as we will show, the statistical analysis is identical
for both experimental techniques it becomes clear that the absolute scales of the
avalanche amplitudes differ by several decades so that the full range of the power law
extends over several decades while each technique individually covers only about 1-3
decades
The height of each spike was determined with respect to the smooth variation of the
background, where the spikes are superimposed. Taking into account that the response
of the calorimetric device to a heat flux pulse in the sample is represented by a single
exponential decay whose time constant is larger than the characteristic time of the
avalanches, the height of the peaks is proportional to the energy of each pulse:
maxmax
t
tdt)t(E
In order to obtain the estimation of the power law exponents we have performed
Maximum Likelihood (ML) fits of a power-law probability density
min
)(
E
dEE
dEEdEEp
where besides the value of the lower cut-off, the exponent is the unique free fit
parameter. The expected dependence of with the cut-off Emin has been studied in
detail in Ref. [48]. One expects that the exponent increases when the cut-off is increased
while a plateau is seen at the best estimation of the exponent. The number of available
17
data is 17936 for heating AE runs, 4893 for cooling AE runs, 1862 for heating
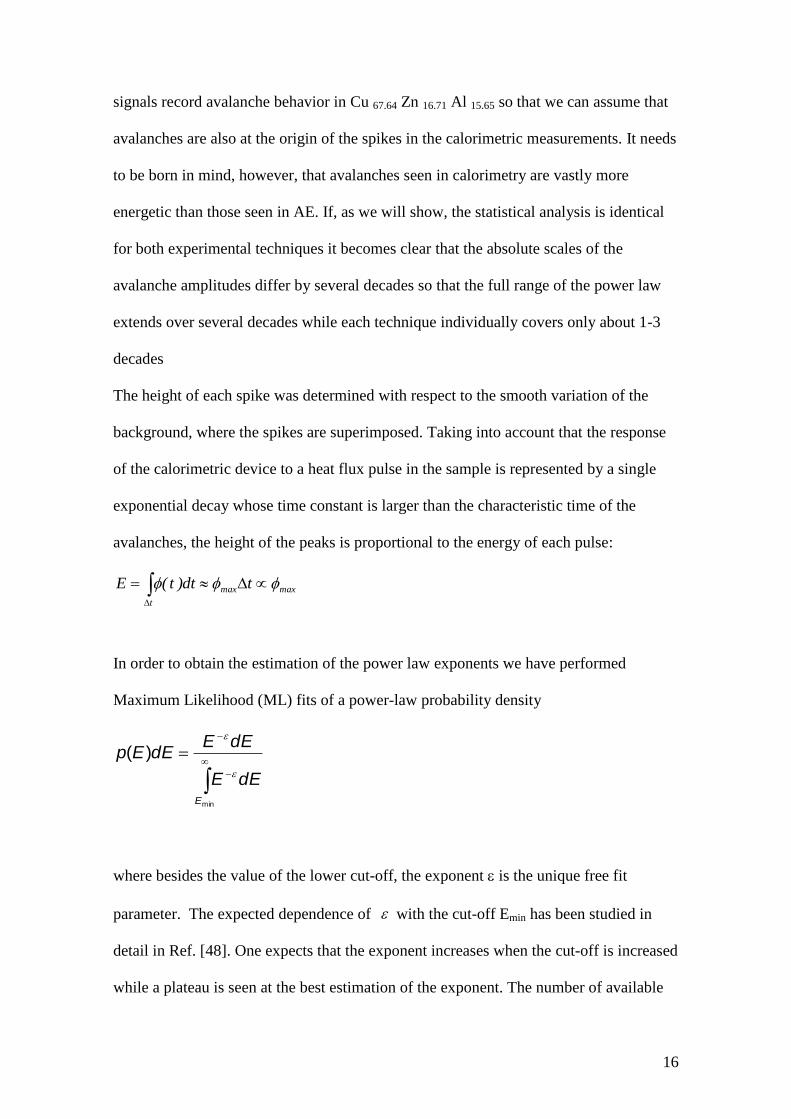
calorimetric run and 1896 for the cooling calorimetric runs. Fig. 8 shows the behavior
of the fitted exponent for the calorimetric (left) and AE data (right) corresponding to the
heating runs. The value of the cut-off for the calorimetric data, minmax , is shown in the
scale above and the value of the cut-off for the AE data is shown below.
The behavior is qualitatively similar to the one expected theoretically. Typical error
bars are also estimated by the ML analysis. The plateau in both cases is located around a
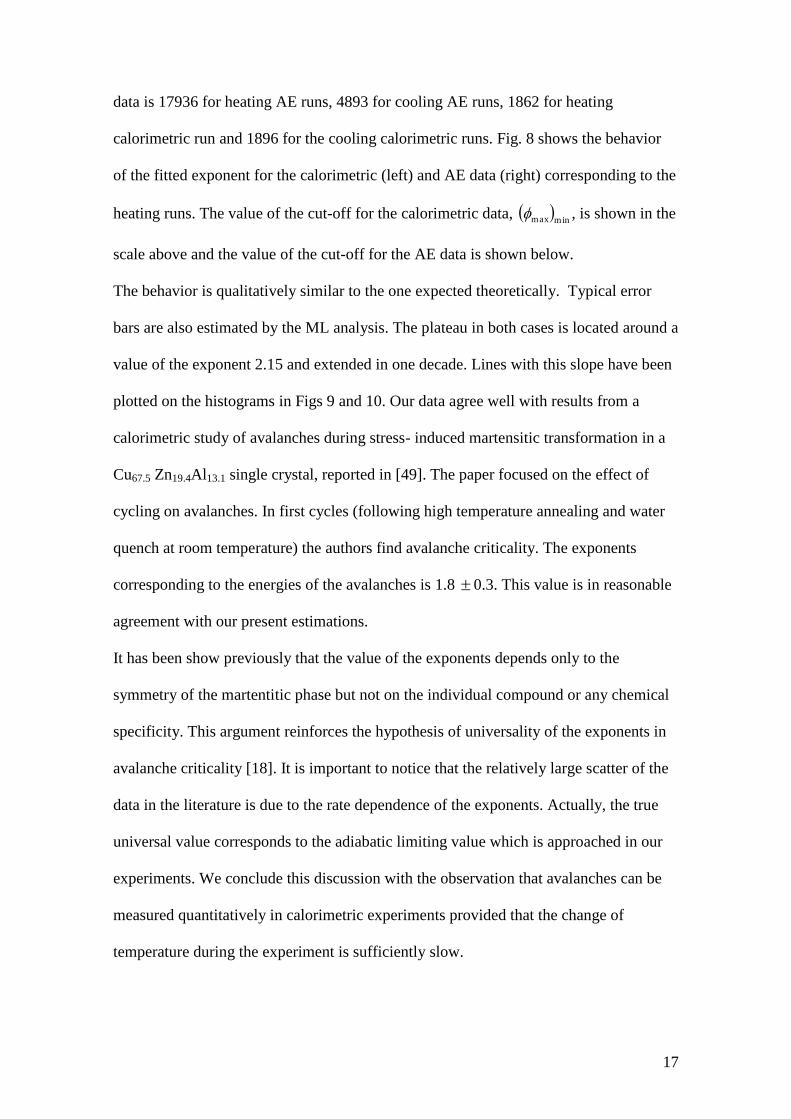
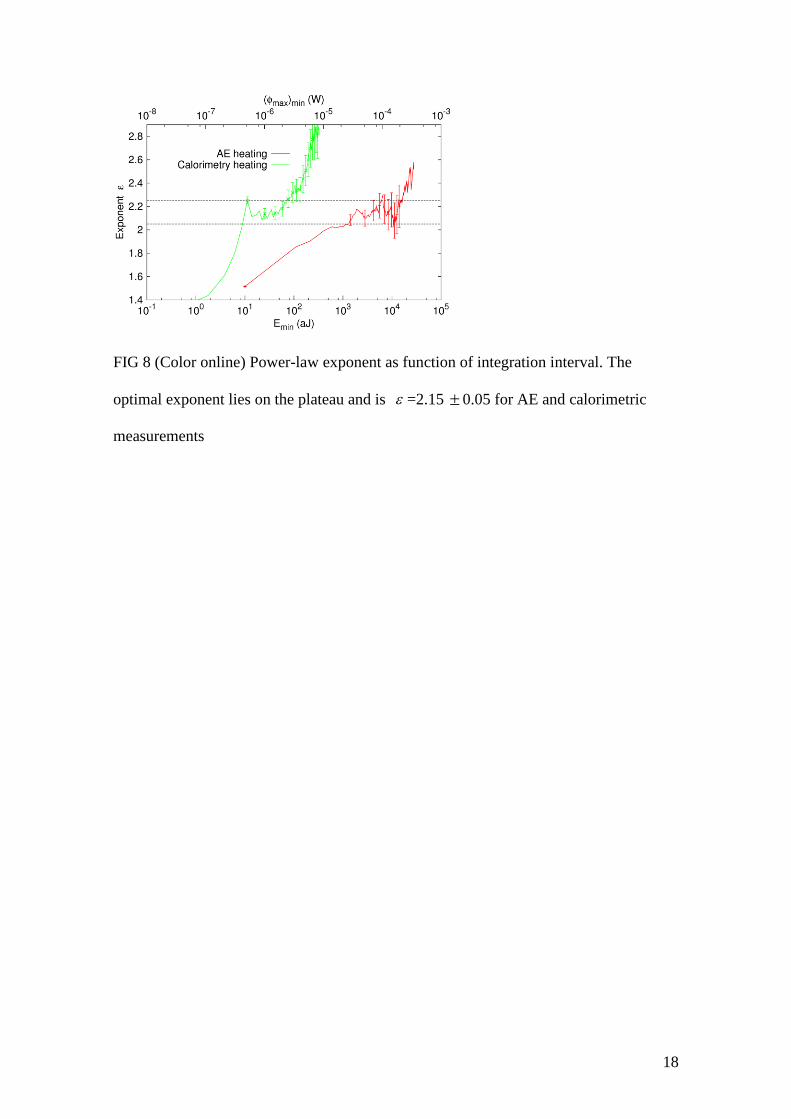
value of the exponent 2.15 and extended in one decade. Lines with this slope have been
plotted on the histograms in Figs 9 and 10. Our data agree well with results from a
calorimetric study of avalanches during stress- induced martensitic transformation in a
Cu67.5 Zn19.4Al13.1 single crystal, reported in [49]. The paper focused on the effect of
cycling on avalanches. In first cycles (following high temperature annealing and water
quench at room temperature) the authors find avalanche criticality. The exponents
corresponding to the energies of the avalanches is 1.8 0.3. This value is in reasonable
agreement with our present estimations.
It has been show previously that the value of the exponents depends only to the
symmetry of the martentitic phase but not on the individual compound or any chemical
specificity. This argument reinforces the hypothesis of universality of the exponents in
avalanche criticality [18]. It is important to notice that the relatively large scatter of the
data in the literature is due to the rate dependence of the exponents. Actually, the true
universal value corresponds to the adiabatic limiting value which is approached in our
experiments. We conclude this discussion with the observation that avalanches can be
measured quantitatively in calorimetric experiments provided that the change of
temperature during the experiment is sufficiently slow.
18
FIG 8 (Color online) Power-law exponent as function of integration interval. The
optimal exponent lies on the plateau and is =2.15 0.05 for AE and calorimetric
measurements
19
Fig. 9 (Color online) Statistical analysis of the AE observations. Data corresponding to
cooling experiments have been shifted one decade downwards in order to clarify the
picture.
100
101
102
10-2
10-1
100
101
102
103
Nu
mb
er
of
Pe
ak
s
max
(W)
cooling
heating
= 2.15
= 2.05
Fig.10 (Color online) Statistical analysis of the heating and cooling curves of the DTA
traces in Fig.2. Only the distribution of spikes (Fig.3) is seen in these graphs. Data
corresponding to cooling experiments have been shifted one decade downwards in order
to clarify the picture.
20
6. The ‘continuous’ heat flux
We now turn to the description of the smooth part of the DTA curves in Fig.2, i.e. those
enthalpic changes where significant avalanche contribution, such as shown Fig.3, are
small or do not exist. In this context it is irrelevant whether small avalanches are still
hidden inside the enthalpic change, the crux of the matter is that the statistics of the
transformation mechanism changes dramatically. It is also significant that previous
experimental results [47] did show some smooth background in AE while our present
results showed no AE activity between 216 K and 235 K where the calorimetric
changes are significant. Let us remind ourselves that AE originates from the sudden
progression of interfaces so that the change of statistics can be discussed in terms of
interface propagation. In fact, the change of progression of interfaces is well known for
the dynamics of twin boundaries in ferroelastic and ferroelectric materials when
external force fields are applied. Newton’s law would require that the movement of
interfaces under stress or electric fields has to be accelerated. Experimentally, this is
never the case, in fact all experimental observations show that the movement of the
interface is momentum driven, i.e. the interfaces propagate with constant speed which is
equivalent to the solution of the dynamic equation of an over damped system with no
effective mass [7]. The physical reason for this behavior is related to the dissipation of
energy during the interfacial movement either via phonons or via defects where
acceleration over small distances is brought to a standstill by defect pinning. The wall
then unpins either thermally or via the external force, accelerates again and gets again
pinned. This stop-and-go mechanism leads to macroscopically over damped, smooth
propagation of the interface (while ‘smoothness’ does not necessarily exist on an atomic
level when extrinsic defects are present). The same smooth behavior can be attributed to
the smooth enthalpic change seen in our experiments. In terms of the avalanche
21
statistics, this would mean that the average propagation distance of the phase front
becomes comparable with the distance of pinning centers [50-54].
The same multi-scaling argument can also be applied to the behavior of the macroscopic
Gibbs free energy of the phase transformation. Let us consider the behavior of the virgin
crystal as a first order transition with a Landau potential as in NiTiFe [21]. We then
expect the latent heat to be released inside the coexistence interval. Slow heating and
cooling experiments will change the microstructure and the pinning behavior, however.
This effect may lead to a local variation of the transition temperature well over and
above the coexistence interval (see local temperature approximation [55]). In stress
driven transitions [56] the transition temperature becomes an explicit function of stress.
Compactification then leads to a macroscopic behavior which is smooth with a steep
decay of the order parameter in the martensitic phase before the coexistence interval is
reached while heating [7].
Finally, we speculate on the limiting case of isothermal transitions in the limiting case
of vanishing heating or cooling rates. Our experiments with cooling rates below 5 10-3
K/h seem to imply that all fronts propagate smoothly while avalanches are seen only for
faster rates. The experiment was performed in a temperature regime where avalanches
are particularly plentiful so that we may be able to extrapolate these data for the entire
coexistence range. This observation is in basic agreement with the idea that phase fronts
require defects to become jerky and form avalanches. When the relaxation time of the
defects or their time to diffuse with the phase front becomes comparable with the
characteristic time of the front propagation, one would not expect avalanches to occur.
This may be exactly the case of our ‘slow’ experiment and is in full agreement with
previous observations in ferroelastic materials that slow elastic responses of crystals
show the diffusion rate of the defects while fast responses show pinning of the
22
interfaces by walls. If this interpretation is correct in case of Cu 67.64 Zn 16.71 Al 15.65 it
provides the rough estimate for the relaxation time of pinning centers. We take as the
temperature jump required to move a phase front as 10-3
K and the limiting rate of 10-3
K/h we obtain a characteristic time of 4 108 s. The average distance between pinning
centers may be guessed to be 10-8
m so that the diffusion coefficient has the order of
magnitude of 10-24
m/s2 which is in the correct order for self diffusion of Ti in TiAl
[57]. This would indicate that very slow movement of interfaces may, in fact, eliminate
the occurrence of avalanches in Cu 67.64 Zn 16.71 Al 15.65.
Acknowledgments
The calorimetric experiments have been supported in Seville by Project FIS2006-04045.
J. Manchado wishes to thank to Fundación Cámara for a research grant. We want to
thank also to Dr. J. Jiménez for his help in supporting the experimental system and to
Dr. J.M. Martín-Olalla for fruitful discussion in the calculation of power law
distributions. The work in Barcelona received financial support from Proj. nº MAT
2007-61200.
References
[1] R. Bausch, H. K. Janssen and H. Wagner, Z. Phys. B: Condens. Matter 24, 113
(1976).
[2] Pelissetto and E. Vicari, Phys. Rep. 368, 549 (2002).
[3] A. Vespignani and S. Zapperi, Phys. Rev. E 57, 6345 (1998).
[4] L. F. Cugliandolo and J. Kurchan, J. Phys. A: Math. Gen. 27, 5749 (1994).
23
[5] J. P. Sethna, K. Dahmen, S. Kartha, J. A. Krumhansl, B. W. Roberts and J. D.
Shore, Phys. Rev. Lett. 70, 3347 (1993).
[6] E. K. H. Salje, B. Wruck and H. Thomas, Z. Phys. B: Condens. Matter 82, 399
(1991).
[7] E. K. H. Salje, Phase Transitions in Ferroelastic and Co-elastic Crystals, second
edition, Cambridge University Press, Cambridge, UK, (1993); M. A. Carpenter, E.
K. H. Salje and A. Graeme-Barber, Eur. J. Mineral. 10, 621 (1998).
[8] E. K. H. Salje, M. C. Gallardo, J. Jiménez, F. J. Romero and J. del Cerro, J. Phys.:
Condens. Matter 10, 5535 (1998); S. A. Hayward, F. D. Morrison, S. A. T.
Redfern, E. K. H. Salje, J. F. Scott, K. S. Knight, S. Tarantino, A. M. Glazer, V.
Shuvaeva, P. Daniel, M. Zhang and M. A. Carpenter, Phys. Rev. B 72, 054110
(2005).
[9] J. C. Lashley, S. M. Shapiro, B. L. Winn, C. P. Opeil, M. E. Manley, A. Alatas,
W. Ratcliff, T. Park, R. A. Fisher, B. Mihaila, P. Riseborough, E. K. H. Salje and J.
L. Smith, Phys. Rev. Lett. 101, 135703 (2008).
[10] E. K. H. Salje, M. Zhang and H. L. Zhang, J. Phys.: Condens. Matter 21, 335402
(2009).
[11] F. J. Romero, M. C. Gallardo, S. A. Hayward, J. Jiménez, J. del Cerro and E. K.
H. Salje, J. Phys.: Condens. Matter 16, 2879 (2004).
[12] E. K. H. Salje and H. L. Zhang, J. Phys.: Condens. Matter 21, 035901 (2009);
W. Schranz, P. Sondergeld, A. V. Kityk and E. K. H. Salje, Phys. Rev. B 80,
094110 (2009).
[13] Shape memory alloys, edited by K. Otsuka and C. M. Wayman (Cambridge
University Press, Cambridge UK, 1998).
24
[14] S. Sreekala, R. Ahluwalia and G. Ananthakrishna, Phys. Rev. B 70, 224105
(2004).
[15] E. Vives, J. Ortin, L. Manosa, I. Rafols, R. Pérez-Magrane and A. Planes, Phys.
Rev. Lett. 72, 1694 (1994).
[16] A. Magni, G. Durin, S. Zapperi and J. P. Sethna J. Stat. Mech. P01020 (2009).
[17] F. J. Pérez-Reche, M. Stipcich, E. Vives, L. Manosa, A. Planes and M. Morin,
Phys. Rev. B 69, 064101 (2004).
[18] F. J. Pérez-Reche, E. Vives, L. Manosa and A. Planes, Phys. Rev. Lett. 87,
195701 (2001).
[19] F. J. Pérez-Reche, B. Tadic, L. Manosa, A. Planes and E. Vives, Phys. Rev. Lett.
93, 195701 (2004).
[20] J. E. Martin, R.A. Anderson and C. P. Tigges, J. Chem. Phys. 108, 3765 (1998).
[21] E. K. H. Salje, H. Zhang, A. Planes and X. Moya, J. Phys.: Condens. Matter 20,
275216 (2008); E. K. H. Salje, H. Zhang, D. Schryvers and B. Bartova, Appl.
Phys. Lett. 90, 221903 (2007).
[22] H. Zhang, E. K. H. Salje, D. Schryvers and B. Bartova, J. Phys.: Condens.
Matter 20, 055220 (2008).
[23] U. Sari, E. Guler, T. Kirindi and M. Dikici, J. Phys. Chem. Solids 70, 1226
(2009).
[24] M. Dijkstra, D. Frenkel and J. P. Hansen, J. Chem. Phys. 101, 3179 (1994).
[25] C. R. S. Da Silva, B. B. Karki, L. Stixrude and R. M. Wentzcovitch, Geophys.
Res. Lett. 26, 943 (1999); T. Tsuchiya, J. Tsuchiya, K. Umemoto and R. M.
Wentzcovitch, Geophys. Res. Lett. 31, L14603 (2004).
[26] E. K. H. Salje, H. Zhang, H. Idrissi, D. Schryvers, M. A. Carpenter, X. Moya
and A. Planes, Phys. Rev. B 80, 134114 (2009).
25
[27] E. K. H. Salje, J. Koppensteiner, M. Reinecker, W. Schranz, A. Planes, Appl.
Phys. Lett. 95, 231908 (2009).
[28] J. M. Delgado-Sánchez, J. M. Martín-Olalla, M. C. Gallardo, S. Ramos, M.
Koralewski and J. del Cerro, J. Phys.: Condens. Matter 17, 2645 (2005).
[29] S. A. Hayward, F. J. Romero, M. C. Gallardo, J. del Cerro, A. Gibaud and E. K.
H. Salje, J. Phys.: Condens. Matter 12, 1133 (2000).
[30] D. Sherrington in Statistical Physics, High Energy, Condensed Matter and
Mathematical Physics edited by M-L. Ge, C. H.Oh and K. K. Phua (World
Scientific, Singapore, 2008), p. 218; E. K. H. Salje, Phys. Chem. Miner. 15, 336
(1988); E. Salje and K. Parlinski, Supercond. Sci. Technol. 4, 93 (1991).
[31] K. Binder and J. D. Reger, Adv. Phys. 41, 547 (1992).
[32] J. R. L. de Almeida and D. J. Thouless, J. Phys. A: Math. Gen. 11, 983 (1978).
[33] F. Ritort and P. Sollich, Adv. Phys. 52, 219 (2003).
[34] J. P. Sethna, K. A. Dahmen and C. R. Myers, Nature 410, 242 (2001).
[35] P. Lloveras, T. Castan, M. Porta, A. Planes and A. Saxena, Phys. Rev. B 80,
054107 (2009).
[36] F. J. Pérez-Reche, L. Truskinovsky and G. Zanzotto, Phys. Rev. Lett. 101,
230601 (2008).
[37] M. Zhang, B. Wruck, A. G. Barber, E. K. H. Salje and M. A. Carpenter, Am.
Mineral. 81, 92 (1996).
[38] M. C. Gallardo, J. Jiménez and J. del Cerro, Rev. Sci. Instrum. 66, 528 (1995).
[39] J. Jiménez, E. Rojas and M. Zamora, J. Appl. Phys. 56, 3353 (1984).
[40] J. del Cerro, J. Therm. Anal. 34, 335 (1998).
[41] J. del Cerro, J. M. Martín-Olalla and F. J. Romero, Thermochim. Acta 149, 401
(2003).
26
[42] J. del Cerro, F. J. Romero, M. C. Gallardo, S. A. Hayward and J. Jiménez
Thermochim. Acta 343, 89 (2000).
[43] F. J. Romero, M.C. Gallardo, A. Czarnecka, M. Koralewski and J. Del Cerro, J.
Therm. Anal. Calorim. 87, 355 (2007).
[44] F. J. Romero, M. C. Gallardo, J. Jiménez, A. Czarnecka, M. Koralewski and J.
del Cerro, J. Phys.: Condens. Matter 16, 7637 (2004).
[45] J. Manchado, F. J. Romero, M. C. Gallardo, J. del Cerro, T. W. Darling, P. A.
Taylor, A. Buckley and M. A. Carpenter, J. Phys.: Condens. Matter 21, 295903
(2009).
[46] F. J. Romero, J. Jiménez and J. del Cerro, J. Magn. Magn. Mater. 280, 257
(2004).
[47] A. Planes, J. L. Macqueron, M. Morin and G. Guenin, Phys. Status Solidi A 66,
717 (1981).
[48] A. Clauset, C. Rohilla-Shalizi and M. E .J. Newman, SIAM Review 51, 661
(2009).
[49] L. Carrillo and J. Ortín, Phys. Rev. B 56, 11508 (1997).
[50] S. A. Hayward and E. K. H. Salje, Am. Mineral. 81, 1332 (1996); E. K. H. Salje,
Eur. J. Mineral. 7, 791 (1995); E. K. H. Salje, U. Bismayer, B. Wruck, and J.
Hensler, Phase Transitions 35, 61 (1991).
[51] Q. Bronchart, Y. Le Bouar and A. Finel, Phys. Rev. Lett. 100, 015702 (2008);
D. Rodney, Y. Le Bouar and A. Finel, Acta Mater. 51, 170 (2003).
[52] V. Lecomte, S. E. Barnes, J. P. Eckmann, and T. Giamarchi, Phys. Rev. B 80,
054413 (2009).
[53] Q. Pang, J. M. Zhang, K. W. Xu, and V. Ji, Appl. Surf. Sci. 225, 8145 (2009); L.
Goncalves-Ferreira, S. A. T. Redfern, E. Artacho and E. K. H. Salje, Phys. Rev.
27
Lett. 101, 097602 (2008); E. K. H. Salje, H. L. Zhang, Phase Transitions 82, 452
(2009); K. R. Locherer, S. A. Hayward, P. J. Hirst, J. Chrosch, M. Yeadon, J. S.
Abell and E. K. H. Salje, Philos. Trans. R. Soc. London, Ser. A 354, 2815 (1996).
[54] A. Agronin, Y. Rosenwaks, and G. Rosenman, Appl. Phys. Lett. 88, 072911
(2006)
[55] M. A. Krivoglaz, Soviet Physics JET – USSR 21, 204 (1965).
[56] E. K. H. Salje, Phys. Rep. 215, 49 (1992); E. Bonnot, E. Vives, L. Manosa, A.
Planes and R. Romero, Phys. Rev. B 78, 094104 (2008).
[57] C. Herzig, T. Przeorski, Y. Mishin, Intermetallics 7, 389 (1999)


![Premium Catalogue...PREMIUM CONNECTIONS CATALOGUE INTRODUCTION TenarisHydril SMYS [ksi] MARTENSITIC MODIFIED MARTENSITIC SUPER MARTENSITIC TN 80Cr13 TN 85Cr13 Martensitic Stainless](https://img.pdfslide.net/doc/110x75/6017b8e739d10b0116239e29/premium-catalogue-premium-connections-catalogue-introduction-tenarishydril-smys.jpg)