Embed Size (px)
Citation preview

Write Back Dashboards
Paul Grill, InfoSol Inc.

Why?
• Business Intelligence is traditionally Read Only
• Recent Dresner survey/study on BI customers showed a growing segment (20%) implementing BI applications with update capability
• Trend towards BI applications as opposed to BI reports and dashboards
2
What is a BI Dashboard?
• An interactive viewer to visualize and analyze your data?
• Too many BI tools and products termed as “dashboards”
– SAP only has one product called Dashboards (more commonly known as Xcelsius) but a slew of products that they promote as Dashboards
– BI Dashboards no longer restricted to just displaying KPI’s for executives
– Not the tool or product that is
important, it is the solution
• It is time to
See Beyond Dashboards
3
Usages of Write Back Dashboards
• Saving Scenarios
• Capturing and Sharing Comments
• Adding Forecasts
• Simple Data input
• Surveys
• Capturing and Sharing Data
4
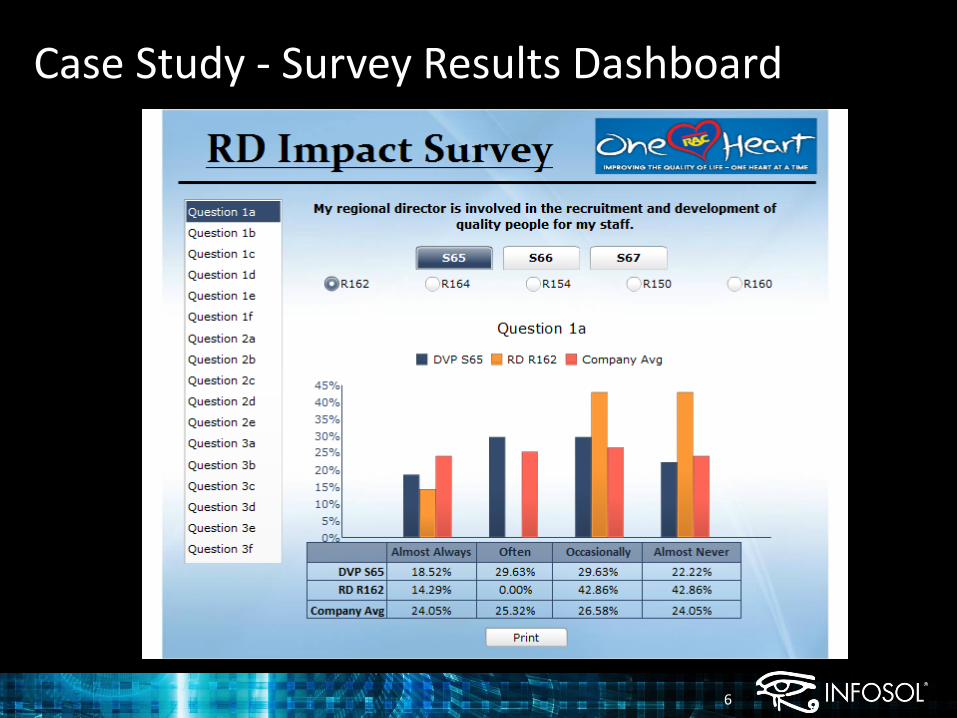
Case Study - Survey Results Dashboard
6

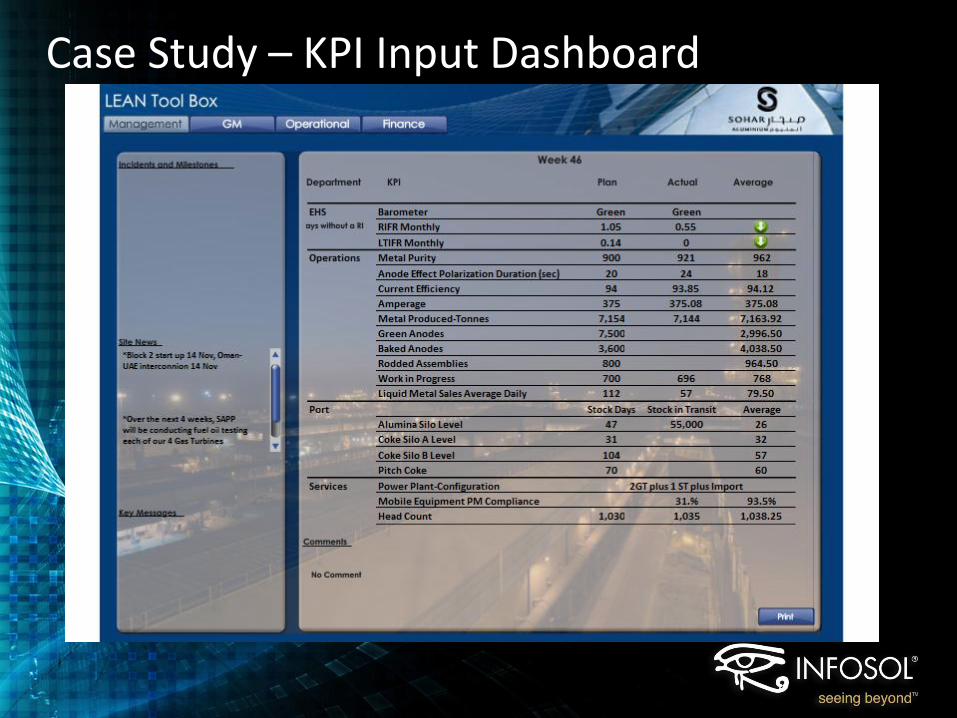
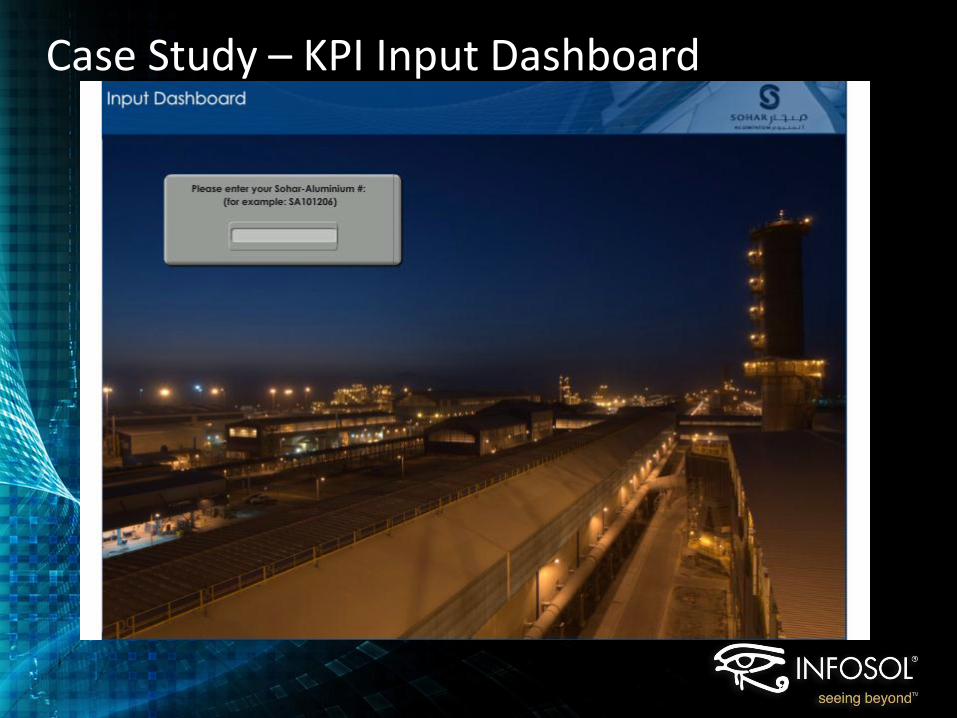
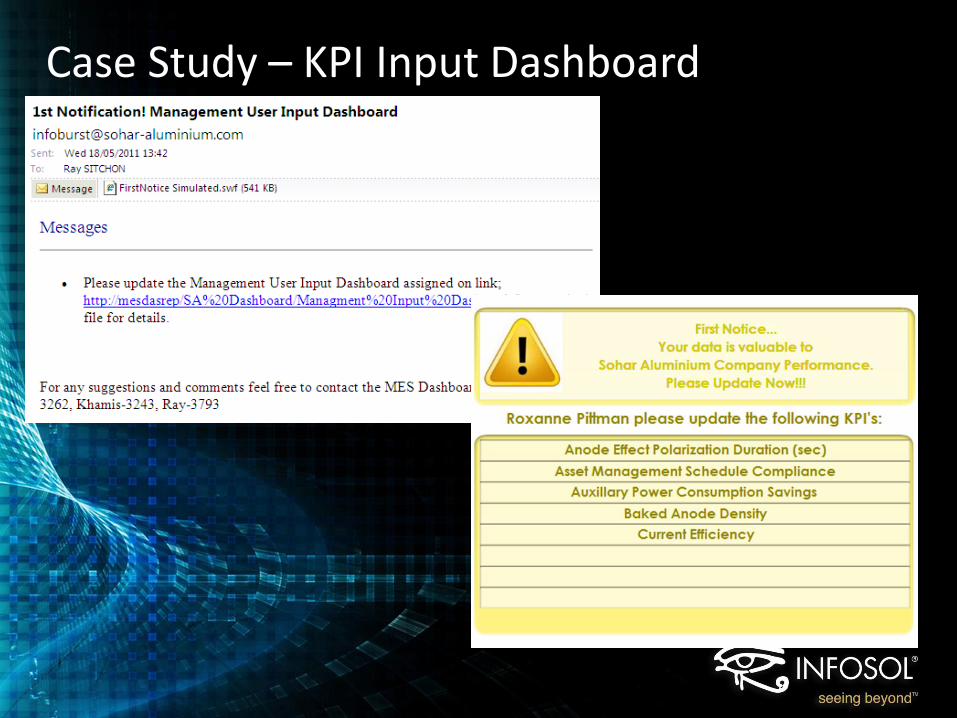
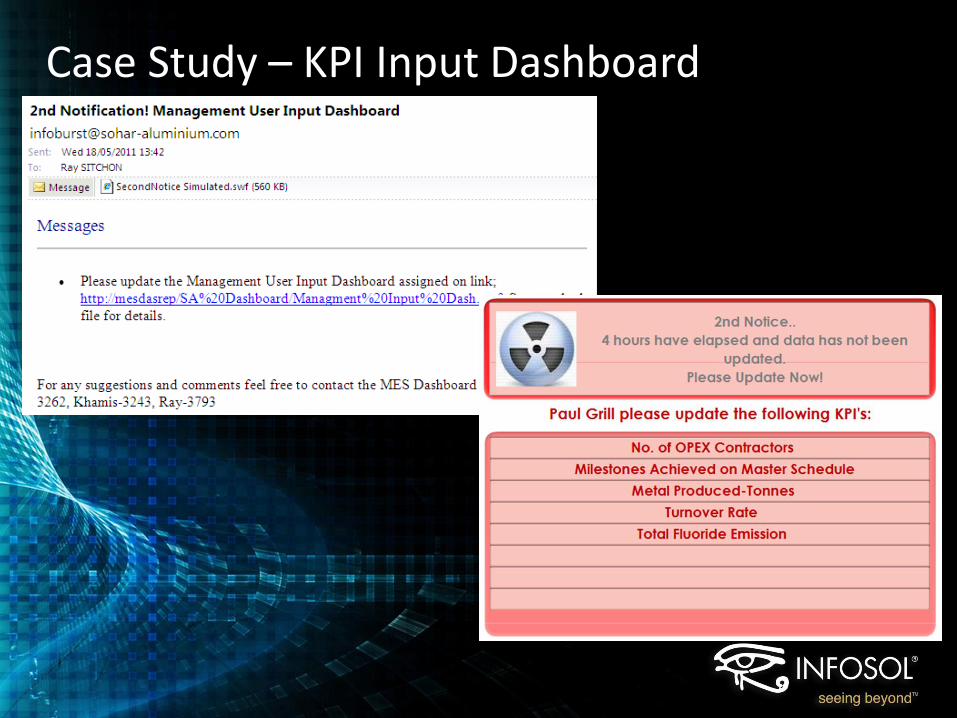
Case Study – KPI Input Dashboard
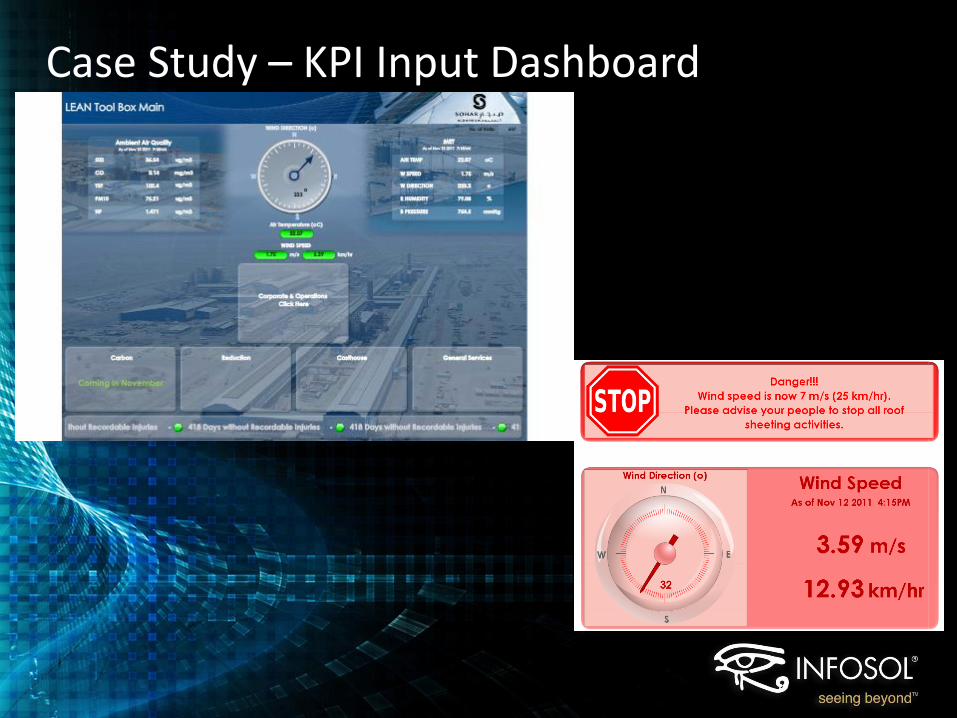
Case Study – KPI Input Dashboard
• Needed to replace inaccurate, labor-intensive manual process for collecting key operational metrics for weekly management meeting and comparing actual against target.
• In addition they wanted to replace charts that were posted around the entire company where these numbers were rolled up on a daily, weekly, monthly basis to show how they were progressing towards annual company objectives
Case Study – KPI Input Dashboard
Case Study – KPI Input Dashboard
Case Study – KPI Input Dashboard
Case Study – KPI Input Dashboard
Case Study – KPI Input Dashboard
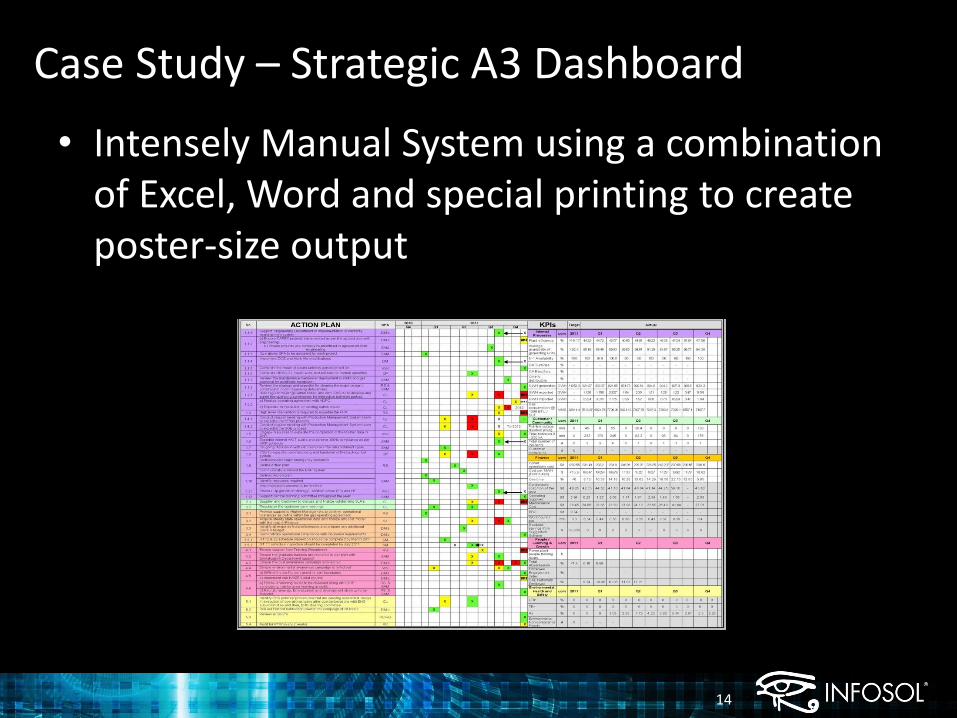
Case Study – Strategic A3 Dashboard
• Intensely Manual System using a combination of Excel, Word and special printing to create poster-size output
14
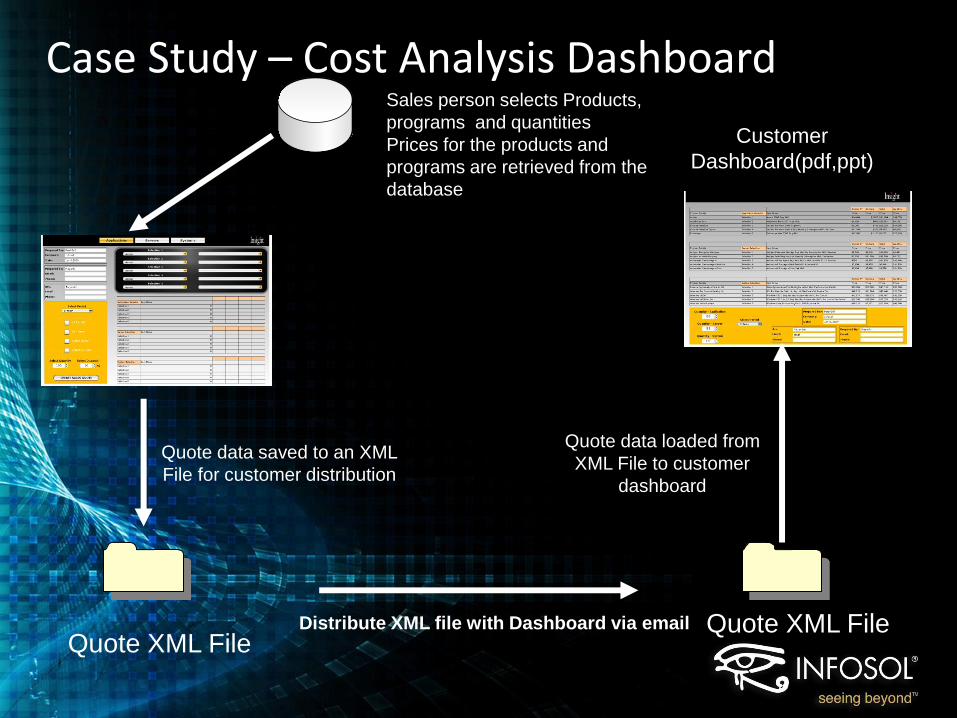
Case Study – Cost Analysis Dashboard
Customer
Dashboard(pdf,ppt)
Quote XML File Quote XML File Distribute XML file with Dashboard via email
Sales person selects Products,
programs and quantities
Prices for the products and
programs are retrieved from the
database
Quote data saved to an XML
File for customer distribution
Quote data loaded from
XML File to customer
dashboard
16
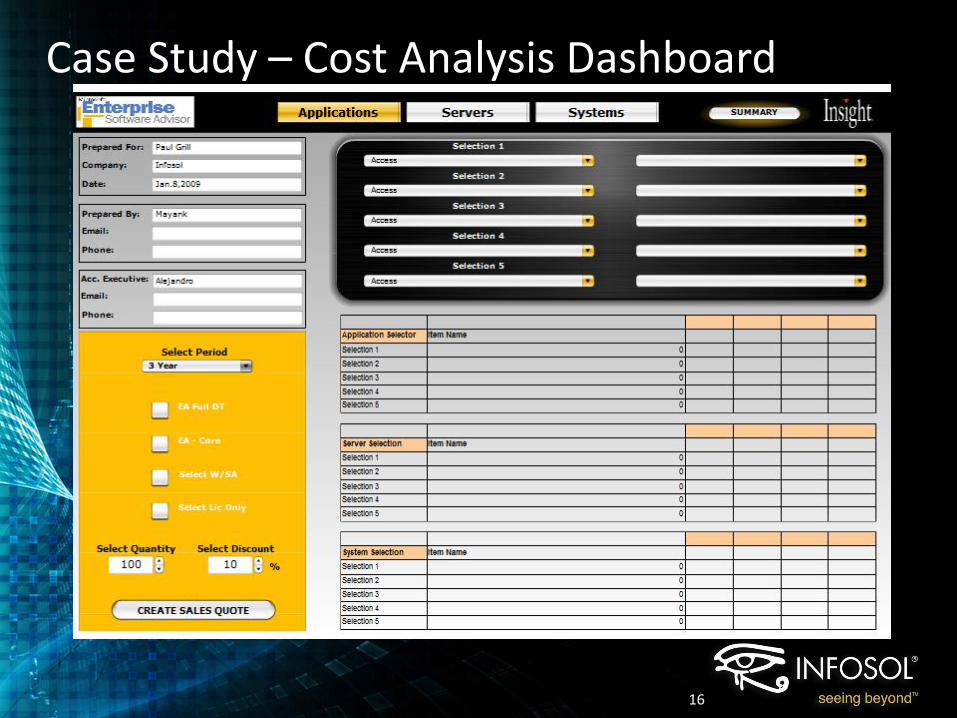
Case Study – Cost Analysis Dashboard
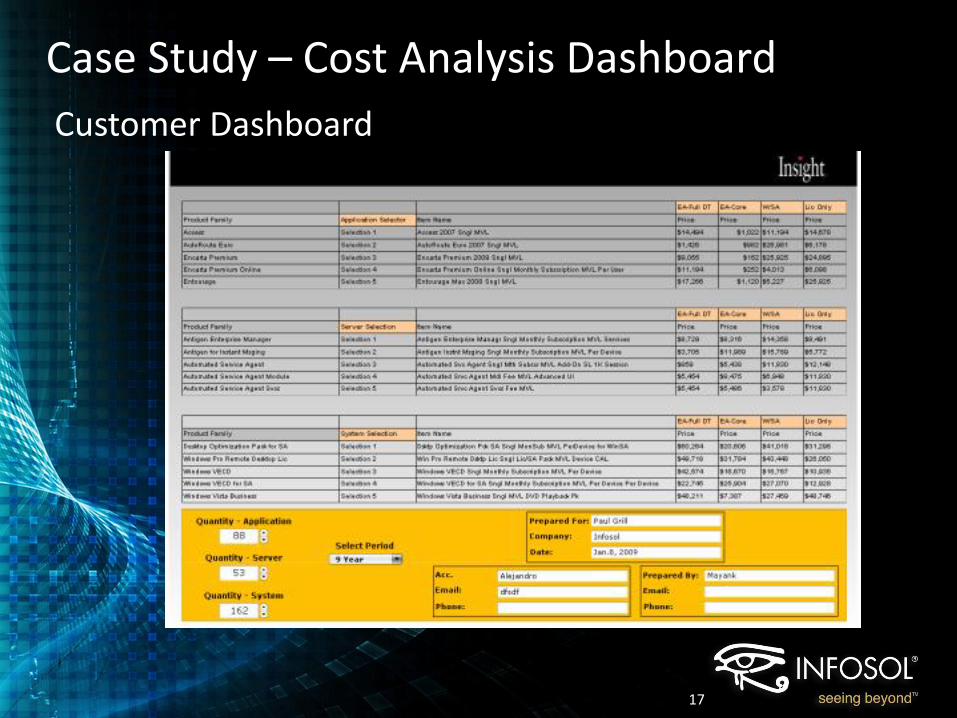
17
Case Study – Cost Analysis Dashboard
Customer Dashboard
Capture and Print Options in Xcelsius
18

Paul Grill [email protected]