Embed Size (px)
Citation preview
Wrong-Way Driving
Special Investigation Report
NTSB/SIR-12/01 PB2012-917003
National
Transportation
Safety Board
NTSB/SIR-12/01 PB2012-917003
Notation 8453 Adopted December 11, 2012
Highway Special Investigation Report
Wrong-Way Driving
National
Transportation
Safety Board
490 L’Enfant Plaza, SW
Washington, DC 20594
National Transportation Safety Board. 2012. Wrong-Way Driving. Highway Special Investigation
Report NTSB/SIR-12/01. Washington, DC.
Abstract: This special investigation report looks at one of the most serious types of highway
accidents—collisions involving vehicles traveling the wrong way on high-speed divided
highways. The goal of this investigative project is to identify relevant safety recommendations to
prevent wrong-way collisions on such highways and access ramps. The investigations included
in the report take a focused view of the driver and highway issues affecting wrong-way
collisions. The report addresses the following safety issues concerning wrong-way driving:
driver impairment, primarily from alcohol use, with consideration of older driver issues and
possible drug involvement; the need to establish, through traffic control devices and highway
design, distinctly different views for motorists approaching entrance and exit ramps; monitoring
and intervention programs for wrong-way collisions; and in-vehicle driver support systems.
The report contains safety recommendations issued to the Federal Highway Administration; the
National Highway Traffic Safety Administration; the states, the District of Columbia, and Puerto
Rico; the American Association of State Highway and Transportation Officials; the Automotive
Coalition for Traffic Safety, Inc.; the International Association of Chiefs of Police; the National
Sheriffs’ Association; SAE International; the Alliance of Automobile Manufacturers; Global
Automakers; and the Consumer Electronics Association.
The National Transportation Safety Board (NTSB) is an independent federal agency dedicated to promoting
aviation, railroad, highway, marine, and pipeline safety. Established in 1967, the agency is mandated by Congress
through the Independent Safety Board Act of 1974 to investigate transportation accidents, determine the probable
causes of the accidents, issue safety recommendations, study transportation safety issues, and evaluate the safety
effectiveness of government agencies involved in transportation. The NTSB makes public its actions and decisions
through accident reports, safety studies, special investigation reports, safety recommendations, and statistical
reviews.
Recent publications are available in their entirety on the Internet at http://www.ntsb.gov. Other information about
available publications also may be obtained from the website or by contacting:
National Transportation Safety Board
Records Management Division, CIO-40
490 L’Enfant Plaza, SW
Washington, DC 20594
(800) 877-6799 or (202) 314-6551
Copies of NTSB publications may be purchased from the National Technical Information Service. To purchase this
publication, order product number PB2012-917003 from:
National Technical Information Service
5301 Shawnee Road
Alexandria, VA 22312
(800) 553-6847 or (703) 605-6000
http://www.ntis.gov/
The Independent Safety Board Act, as codified at 49 U.S.C. Section 1154(b), precludes the admission into evidence
or use of NTSB reports related to an incident or accident in a civil action for damages resulting from a matter
mentioned in the report.
NOTE: This report was reissued on February 8, 2013, with corrections to pages 38 and 39.
NTSB Highway Special Investigation Report
i
Contents
Figures ........................................................................................................................................... iii
Tables ..............................................................................................................................................v
Acronyms and Abbreviations ..................................................................................................... vi
Introduction ................................................................................................................................. vii
1. Wrong-Way Collisions ..............................................................................................................1 1.1 Definition of Wrong-Way Driving ............................................................................................1 1.2 Severity of Wrong-Way Collisions ............................................................................................1 1.3 History of Efforts Concerning Wrong-Way Collisions .............................................................2
1.3.1 NTSB Investigations of Wrong-Way Collisions .............................................................2 1.3.2 Federal/State Efforts ........................................................................................................4
1.4 Data Summary ...........................................................................................................................6 1.4.1 Fatality Analysis Reporting System Data ........................................................................6 1.4.2 Data Limitations ............................................................................................................11
2. NTSB Investigations ................................................................................................................12 2.1 Baker, California ......................................................................................................................14
2.2 Dulles, Virginia ........................................................................................................................15 2.3 Carrollton, Kentucky................................................................................................................16
2.4 Arlington, Texas ......................................................................................................................17 2.5 Dallas, Texas ............................................................................................................................19 2.6 Fountain, Colorado ..................................................................................................................22
2.7 Beloit, Wisconsin .....................................................................................................................23 2.8 Carlisle, Pennsylvania ..............................................................................................................26
2.9 Fernley, Nevada .......................................................................................................................28
3. Characterization of Wrong-Way Driving ..............................................................................30
4. Countermeasures .....................................................................................................................32 4.1 Driver .......................................................................................................................................32
4.1.1 Alcohol Impairment .......................................................................................................32 4.1.2 Older Drivers .................................................................................................................37 4.1.3 Drug Impairment ...........................................................................................................39
4.2 Highways .................................................................................................................................41 4.2.1 Signage and Pavement Markings...................................................................................41 4.2.2 Interchange and Ramp Designs .....................................................................................47
NTSB Highway Special Investigation Report
ii
4.2.3 Wrong-Way Monitoring Programs ................................................................................50
4.2.4 Law Enforcement Intervention Practices .......................................................................51 4.3 Wrong-Way Navigation Alerts on Vehicles ............................................................................52
5. Conclusions ...............................................................................................................................55 5.1 Findings....................................................................................................................................55
6. Recommendations ....................................................................................................................57
7. Appendix: Diagrams of Situations Preceding Eight Wrong-Way Collisions Investigated
by the NTSB..................................................................................................................................60
NTSB Highway Special Investigation Report
iii
Figures
Figure 1. Postaccident view of the vehicles from the Fountain, Colorado, wrong-way
collision ............................................................................................................................................2
Figure 2. FARS data indicating drivers involved in fatal wrong-way collisions on divided
highways who showed indications of alcohol use; comparison between wrong-way and
right-way driver drinking data (2004–2009) ....................................................................................8
Figure 3. NTSB analysis of FARS data (2004–2009) showing reported BAC levels of
wrong-way drivers ...........................................................................................................................9
Figure 4. Ages of drivers involved in fatal wrong-way collisions on divided highways;
comparison between wrong-way and right-way driver ages (2004–2009) ....................................10
Figure 5. Likely wrong-way driver entry point for the Arlington, Texas, collision, with
signage locations marked ...............................................................................................................19
Figure 6. Damage to wrong-way vehicle from the Dallas, Texas, collision .................................20
Figure 7. Mounting height of wrong-way signs on frontage road adjacent to US Highway 75
in Dallas, Texas ..............................................................................................................................21
Figure 8. End of exit ramp 122, possible wrong-way driver entry point for the Fountain,
Colorado, collision .........................................................................................................................23
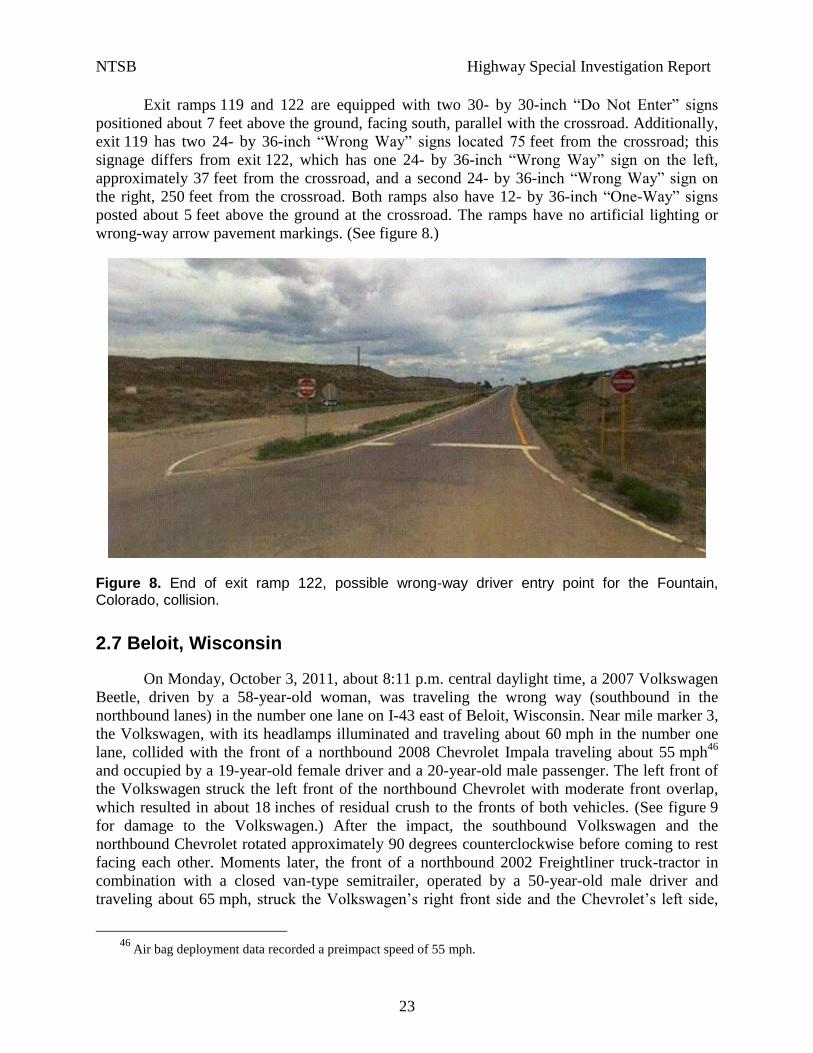
Figure 9. Damage to the wrong-way vehicle from the Beloit, Wisconsin, collision ....................24
Figure 10. Possible wrong-way driver entry location for the Beloit, Wisconsin, collision ..........25
Figure 11. Diagram of Carlisle, Pennsylvania, collision ..............................................................26
Figure 12. Approaching the wrong-way driver entry point for the Carlisle, Pennsylvania,
collision ..........................................................................................................................................28
Figure 13. Likely wrong-way driver entry point for Fernley, Nevada, collision ..........................29
Figure 14. Three signs required, as a minimum, at exit ramps intersecting with a crossroad ......42
Figure 15. Required and optional signing and pavement markings ..............................................43
Figure 16. Example of channelization methods for a paired controlled-access highway ramp
location, including a painted island and a left-turn marking extension from the crossroad ..........43
Figure 17. Double-posted “Do Not Enter” and “Wrong Way” signs on an exit ramp .................46
NTSB Highway Special Investigation Report
iv
Figure 18. Common interchange designs ......................................................................................47
Figure A-1. Highway and vehicle elements of Baker, California, wrong-way collision ..............60
Figure A-2. Highway and vehicle elements of Dulles, Virginia, wrong-way collision ................61
Figure A-3. Highway and vehicle elements of Carrollton, Kentucky, wrong-way collision .......62
Figure A-4. Highway and vehicle elements of Arlington, Texas, wrong-way collision ..............63
Figure A-5. Highway and vehicle elements of Dallas, Texas, wrong-way collision ....................64
Figure A-6. Highway and vehicle elements of Fountain, Colorado, wrong-way collision ..........65
Figure A-7. Highway and vehicle elements of Beloit, Wisconsin, wrong-way collision .............66
Figure A-8. Highway and vehicle elements of Fernley, Nevada, wrong-way collision ...............67
NTSB Highway Special Investigation Report
v
Tables
Table 1. NTSB-identified wrong-way movement research conducted by states ............................5
Table 2. FARS fatal wrong-way collision data (2004–2009) .........................................................7
Table 3. Wrong-way collisions investigated by the NTSB ...........................................................12
Table 4. Factors concerning the wrong-way collisions investigated by the NTSB ......................12
Table 5. Factors concerning the wrong-way drivers in the wrong-way collisions investigated
by the NTSB ..................................................................................................................................13
NTSB Highway Special Investigation Report
vi
Acronyms and Abbreviations
AASHO American Association of State Highway Officials
AASHTO American Association of State Highway and Transportation Officials
ACTS Automotive Coalition for Traffic Safety, Inc.
BAC blood alcohol concentration
Caltrans California Department of Transportation
DADSS Driver Alcohol Detection System for Safety
DOT US Department of Transportation
DUI driving under the influence
DWI driving while intoxicated (or impaired)
FARS Fatality Analysis and Reporting System
FHWA Federal Highway Administration
GIS geographic information system
GPS global positioning system
HSIP Highway Safety Improvement Program
I Interstate
LED light-emitting diode
MAP-21 Moving Ahead for Progress in the 21st Century Act
mph miles per hour
MUTCD Manual on Uniform Traffic Control Devices
NCHRP National Cooperative Highway Research Program
NHTSA National Highway Traffic Safety Administration
NTSB National Transportation Safety Board
OUI operating under the influence
SHSP Strategic Highway Safety Plan
SUV sport utility vehicle
TSR Mobileye Traffic Sign Recognition
NTSB Highway Special Investigation Report
vii
Introduction
This special investigation report looks at one of the most serious types of accidents that
occur on our highways: these are collisions involving vehicles traveling the wrong way on
high-speed divided highways. The goal of this investigative project is to identify relevant safety
recommendations to prevent wrong-way collisions on such highways and access ramps. The
investigations included in this report take a focused view of the driver and highway issues
affecting wrong-way collisions.1
The report is organized into four sections. Section 1, “Wrong-Way Collisions,” defines
the problem, examines the National Transportation Safety Board (NTSB) history with these
types of collisions and generally surveys the data and research concerning wrong-way driving
collisions. Section 2, “NTSB Investigations,” summarizes nine NTSB wrong-way collision
investigations. Section 3, “Characterization of Wrong-Way Driving,” considers the components
of wrong-way collisions and uses data, research, and NTSB investigative work to summarize
these types of collisions. Section 4, “Countermeasures,” provides recommendations to address
wrong-way collisions. Those countermeasures are organized to address the following safety
issues:
Driver impairment, primarily from alcohol use, with consideration of older driver
issues and possible drug involvement
The need to establish—through traffic control devices and highway design—
distinctly different views for motorists approaching entrance and exit ramps
Monitoring and intervention programs for wrong-way collisions
In-vehicle driver support systems
As a result of this investigation, the NTSB is issuing safety recommendations to the
Federal Highway Administration; the National Highway Traffic Safety Administration; the
states, the Commonwealth of Puerto Rico, and the District of Columbia; the American
Association of State Highway and Transportation Officials; the Automotive Coalition for Traffic
Safety, Inc.; the International Association of Chiefs of Police; the National Sheriffs’ Association;
SAE International; the Alliance of Automobile Manufacturers; Global Automakers; and the
Consumer Electronics Association.
1 These investigations, however, were not conducted to examine the full range of accident issues, such as
survival factors, emergency response, or the mechanical condition of the vehicle.
NTSB Highway Special Investigation Report
1
1. Wrong-Way Collisions
1.1 Definition of Wrong-Way Driving
Wrong-way driving, for the purposes of this report, is vehicular movement along a travel
lane in a direction opposing the legal flow of traffic on high-speed divided highways or access
ramps.1 The report’s consideration of wrong-way travel is restricted to such controlled-access
highways, including entrance and exit ramps.2 It does not include wrong-way movements that
result from median crossover encroachments.3
1.2 Severity of Wrong-Way Collisions
The interest of the National Transportation Safety Board (NTSB) in the issue of
wrong-way driving stems primarily from the severity of these types of events. Wrong-way
collisions occur relatively infrequently, accounting for only about 3 percent of accidents on
high-speed divided highways,4 but they are much more likely to result in fatal and serious
injuries than are other types of highway accidents. The severity of an accident is understood in
terms of the crash dynamics. The vast majority of wrong-way collisions on controlled-access
highways are head-on events.5
A substantial body of state research, conducted primarily by state departments of
transportation over decades, supports the fact that wrong-way collisions tend to have higher
fatality rates than other accidents. A study in Virginia found the fatality rate for wrong-way
collisions on controlled-access highways to be 27 times that of other types of accidents.6 The
California Department of Transportation (Caltrans) found a fatality rate 12 times greater
1 This definition was used by T. N. Tamburri and D. J. Theobald, Wrong-Way Driving (Phase II)
(Sacramento, CA: California Department of Public Works, Division of Highways, 1965). 2 According to the Federal Highway Administration (FHWA), US high-speed divided highways comprise the
following types of roads: “freeways,” which are divided arterial highways designed for the unimpeded flow of large
traffic volumes (access to a freeway is rigorously controlled and intersection grade separations are required);
“expressways,” which are controlled-access, divided arterial highways for through traffic, the intersections of which
are usually separated from other roadways by differing grades; and “interstate highways,” which are divided arterial
highways for through traffic with full or partial control of access and grade separations at major intersections. As far
as possible, for purposes of simplicity throughout this report, the term “controlled-access highway” is used to refer
generically to all these types of US high-speed divided highways. 3
For a discussion of median crossover events, see Truck-Tractor Semitrailer Median Crossover Collision With
15-Passenger Van, Munfordville, Kentucky, March 26, 2010, Highway Accident Report NTSB/HAR-11/02
(Washington, DC: National Transportation Safety Board, 2011). 4 The NTSB analysis of Fatality Analysis and Reporting System (FARS) data for 2004–2009 discussed later in
this report found that, on average, there were 261 fatal wrong-way crashes out of 9,393 all types of crashes on
high-speed, divided highways. 5 Based on NTSB analysis of FARS data, about 82 percent of such wrong-way events involve front-to-front
collisions, typically with one or both vehicles traveling at highway speed. For wrong-way events that involve more
than two vehicles, collisions may not be front to front. 6 N. K. Vaswani, Measures for Preventing Wrong-Way Entries on Highways, Report Number VHRC 72-R41
(Charlottesville, VA: Virginia Highway Research Council, 1973).
NTSB Highway Special Investigation Report
2
compared to all other accidents on controlled-access highways.7 A study in Michigan found that
22 percent of wrong-way collisions were fatal, compared to 0.3 percent for all highway accidents
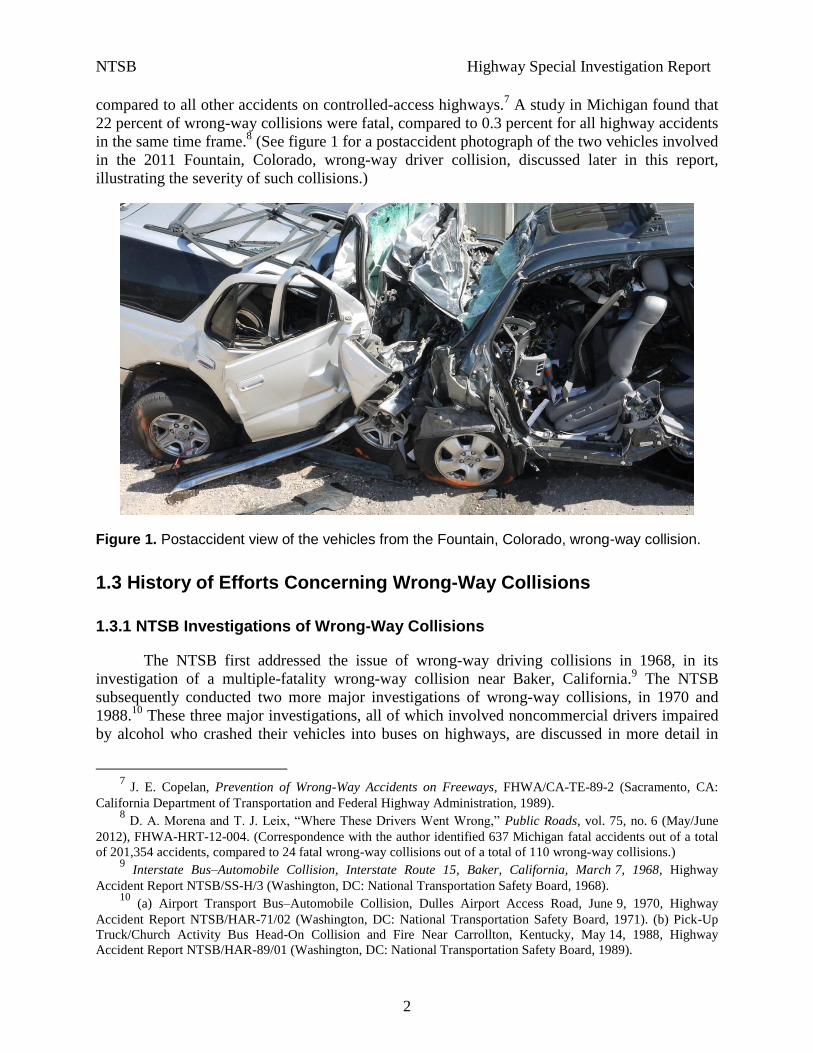
in the same time frame.8 (See figure 1 for a postaccident photograph of the two vehicles involved
in the 2011 Fountain, Colorado, wrong-way driver collision, discussed later in this report,
illustrating the severity of such collisions.)
Figure 1. Postaccident view of the vehicles from the Fountain, Colorado, wrong-way collision.
1.3 History of Efforts Concerning Wrong-Way Collisions
1.3.1 NTSB Investigations of Wrong-Way Collisions
The NTSB first addressed the issue of wrong-way driving collisions in 1968, in its
investigation of a multiple-fatality wrong-way collision near Baker, California.9 The NTSB
subsequently conducted two more major investigations of wrong-way collisions, in 1970 and
1988.10
These three major investigations, all of which involved noncommercial drivers impaired
by alcohol who crashed their vehicles into buses on highways, are discussed in more detail in
7
J. E. Copelan, Prevention of Wrong-Way Accidents on Freeways, FHWA/CA-TE-89-2 (Sacramento, CA:
California Department of Transportation and Federal Highway Administration, 1989). 8 D. A. Morena and T. J. Leix, “Where These Drivers Went Wrong,” Public Roads, vol. 75, no. 6 (May/June
2012), FHWA-HRT-12-004. (Correspondence with the author identified 637 Michigan fatal accidents out of a total
of 201,354 accidents, compared to 24 fatal wrong-way collisions out of a total of 110 wrong-way collisions.) 9 Interstate Bus–Automobile Collision, Interstate Route 15, Baker, California, March 7, 1968, Highway
Accident Report NTSB/SS-H/3 (Washington, DC: National Transportation Safety Board, 1968). 10
(a) Airport Transport Bus–Automobile Collision, Dulles Airport Access Road, June 9, 1970, Highway
Accident Report NTSB/HAR-71/02 (Washington, DC: National Transportation Safety Board, 1971). (b) Pick-Up
Truck/Church Activity Bus Head-On Collision and Fire Near Carrollton, Kentucky, May 14, 1988, Highway
Accident Report NTSB/HAR-89/01 (Washington, DC: National Transportation Safety Board, 1989).
NTSB Highway Special Investigation Report
3
section 2 (“NTSB Investigations”) of this report. As a result of the three investigations, the
NTSB issued 30 recommendations, about half of which focused on drivers impaired by alcohol
and countermeasures for wrong-way drivers.11
All these recommendations (the most recent of
which is 24 years old) have been closed, and the majority have been closed in an acceptable
manner. Because this type of collision continues to occur, the NTSB recently undertook a set of
investigations to better understand wrong-way driving events and explore further
countermeasures and new technologies to prevent these dangerous collisions. Section 2 of this
report also discusses these six NTSB investigations, conducted on collisions that occurred
between August and October 2011.
The NTSB also has investigated interstate median crossover accidents, which are often
considered in conjunction with wrong-way driving.12
As has been noted, however, the NTSB
does not include this type of event in the report because many of the countermeasures for median
crossovers differ from those that might prevent wrong-way driving. For the same reason, the
report does not consider wrong-way collisions on two-lane highways.
Because a substantial proportion of wrong-way drivers are impaired by alcohol (see data
in section 1.4.1), the NTSB’s history of addressing alcohol impairment is relevant to this report.
The NTSB has investigated many cases involving drivers impaired by alcohol, and the topic has
been the focus of several studies.13
In 1984, the NTSB published a safety study on repeat
offender drunk drivers, which identified these drivers as a serious safety problem.14
As a result of
a 1990 NTSB safety study15
that examined drug and alcohol use among fatally injured heavy
truck drivers, the NTSB made several recommendations to the US Department of Transportation
(DOT) and the states; the recommendations focused on standardizing postaccident toxicological
specimen collection, testing, and reporting, as well as on increasing the toxicological data in
national databases by enacting legislation to require testing of all drivers involved in fatal
11
From the Baker, California, report (NTSB/SS-H/3), Safety Recommendations H-68-24 through -27 called for
wrong-way traffic movement research and uniform traffic control device improvements, as well as the development
of a program to protect highway users from drinking drivers. From the Dulles, Virginia, accident report
(NTSB/HAR-71/02), Safety Recommendations H-71-5 through -8 called for general review and implementation of
improved wrong-way traffic prevention measures, demonstration projects on wrong-way mediation efforts, and
improved signage and guardrails to address wrong-way movements. From the Carrollton, Kentucky, accident report
(NTSB/HAR-89/01), Safety Recommendations H-89-2 and H-89-7 through -14 addressed drunk driving legislation;
signage to prevent wrong-way movements; and preventing, deterring, and publicizing the risks of impaired driving. 12
(a) NTSB/HAR-11/02. (b) Median Crossover, Collision, and Fire, US Highway 75, Sherman, Texas,
September 20, 2004, Highway Accident Brief NTSB/HAB-10/01 (Washington, DC: National Transportation Safety
Board, 2010). (c) Passenger Vehicle Median Crossover and Head-On Collision With Another Passenger Vehicle,
Linden, New Jersey, May 1, 2003, Highway Accident Report NTSB/HAR-06/02 (Washington, DC: National
Transportation Safety Board, 2006). (d) Motorcoach Median Crossover and Collision with Sport Utility Vehicle,
Hewitt, Texas, February 14, 2003, Highway Accident Report NTSB/HAR-05/02 (Washington, DC: National
Transportation Safety Board, 2005). 13
Drivers impaired by alcohol, for the purposes of this report, are defined according to the legal definition of
blood alcohol content by weight of 0.08 percent or higher. 14
Deficiencies in Enforcement, Judicial, and Treatment Programs Related to Repeat Offender Drunk Drivers,
Safety Study NTSB/SS-84/04 (Washington, DC: National Transportation Safety Board, 1984). 15
Fatigue, Alcohol, Other Drugs, and Medical Factors in Fatal-to-the-Driver Heavy Truck Crashes (vol. 1),
Safety Study NTSB/SS-90/01 (Washington, DC: National Transportation Safety Board, 1990).
NTSB Highway Special Investigation Report
4
commercial truck crashes.16
In 2000, the NTSB conducted a review of the issue in a report on
hard core drinking drivers.17
The NTSB’s most recent major activity concerning impaired drivers
was a 2012 public forum, Reaching Zero: Actions to Eliminate Substance-Impaired Driving,
which resulted in recommendations concerning driver alcohol testing and reporting.18
The NTSB has considered a second impairment issue associated with wrong-way drivers,
impairment due to medical conditions. In 2004, an NTSB report on medical oversight of
noncommercial drivers followed a March 2003 public hearing on the same subject.19
Medical
issues and aging driver performance were also the subjects of an NTSB 2010 public forum,
Safety, Mobility, and Aging Drivers.20
Although age is not a determinate of driving performance,
aging is associated with both an increase in medical issues and the use of prescription
medications to treat those conditions.
1.3.2 Federal/State Efforts
Research on wrong-way driving has a long history, beginning almost with the
construction of the Interstate Highway System. The 1968 NTSB report on the Baker, California,
collision acknowledged FHWA support of research into “remedial measures to avert or redirect
wrong-way traffic movements at expressways, freeways, and multilane divided highway ingress
and egress points.”21
Safety Recommendation H-68-24 from the Baker report called for the
FHWA research effort to be expanded.
Research to quantify the frequency of, determine the causal factors of, and evaluate
countermeasures for preventing wrong-way movements on highways began in the early 1960s.
By 1967, a special American Association of State Highway Officials (AASHO)22
traffic safety
committee recommended a review of existing highways, as well as efforts to avert or redirect
wrong-way traffic.23
Most research in the intervening decades has been conducted by state and
local jurisdictions. In 2008, AASHTO published volume 20 of National Cooperative Highway
Research Program (NCHRP) Report 500, Guide for Reducing Head-on Crashes on Freeways, to
address goal 18 of its Strategic Highway Safety Plan, which is to reduce head-on and
cross-median crashes.
16
Safety Recommendations H-90-11 and H-90-13 through -15 to the DOT, Safety Recommendation H-90-16
to NHTSA, and Safety Recommendation H-90-43 to the states. 17
Actions to Reduce Fatalities, Injuries, and Crashes Involving the Hard Core Drinking Driver, Safety Report
NTSB/SR-00/01 (Washington, DC: National Transportation Safety Board, 2000). 18
See http://www.ntsb.gov/news/events/2012/Substance_Impaired_Driving/index.html, accessed September 4,
2012. 19
Medical Oversight of Noncommercial Drivers, Special Investigation Report NTSB/SIR-04/01
(Washington, DC: National Transportation Safety Board, 2004). 20
See http://www.ntsb.gov/news/events/2010/aging_drivers/index.html, accessed September 4, 2012. 21
NTSB/SS-H/3, p. 6. 22
AASHO was founded on December 12, 1914. The organization changed its name to the American
Association of State Highway and Transportation Officials (AASHTO) on November 13, 1973. 23
Highway Design and Operational Practices Related to Highway Safety (Washington, DC: Traffic Safety
Committee, American Association of State Highway Officials, 1967).
NTSB Highway Special Investigation Report
5
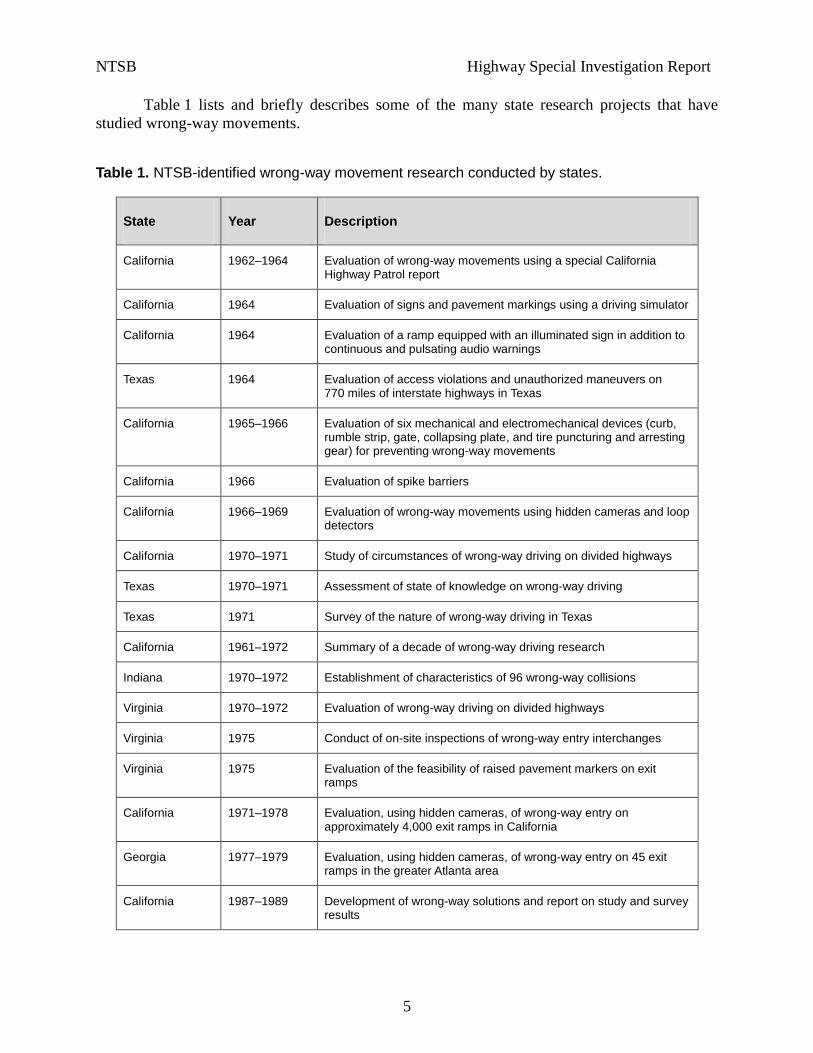
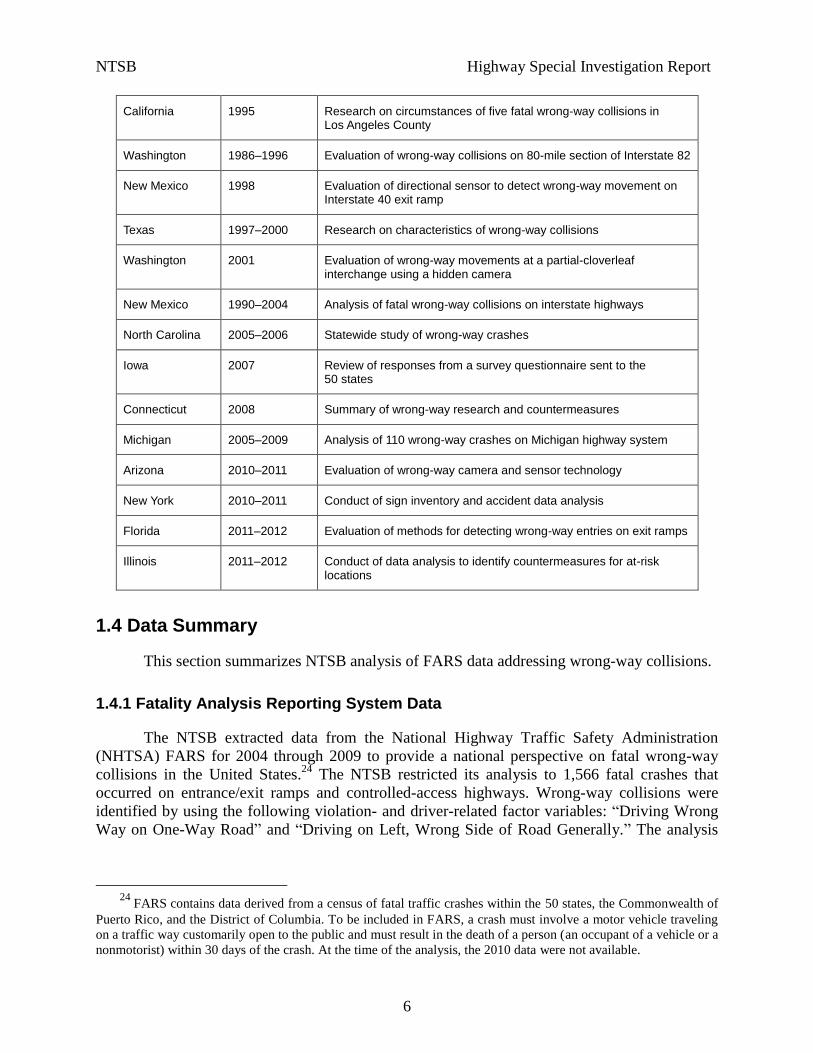
Table 1 lists and briefly describes some of the many state research projects that have
studied wrong-way movements.
Table 1. NTSB-identified wrong-way movement research conducted by states.
State Year Description
California 1962–1964 Evaluation of wrong-way movements using a special California Highway Patrol report
California 1964 Evaluation of signs and pavement markings using a driving simulator
California 1964 Evaluation of a ramp equipped with an illuminated sign in addition to continuous and pulsating audio warnings
Texas 1964 Evaluation of access violations and unauthorized maneuvers on 770 miles of interstate highways in Texas
California 1965–1966 Evaluation of six mechanical and electromechanical devices (curb, rumble strip, gate, collapsing plate, and tire puncturing and arresting gear) for preventing wrong-way movements
California 1966 Evaluation of spike barriers
California 1966–1969 Evaluation of wrong-way movements using hidden cameras and loop detectors
California 1970–1971 Study of circumstances of wrong-way driving on divided highways
Texas 1970–1971 Assessment of state of knowledge on wrong-way driving
Texas 1971 Survey of the nature of wrong-way driving in Texas
California 1961–1972 Summary of a decade of wrong-way driving research
Indiana 1970–1972 Establishment of characteristics of 96 wrong-way collisions
Virginia 1970–1972 Evaluation of wrong-way driving on divided highways
Virginia 1975 Conduct of on-site inspections of wrong-way entry interchanges
Virginia 1975 Evaluation of the feasibility of raised pavement markers on exit ramps
California 1971–1978 Evaluation, using hidden cameras, of wrong-way entry on approximately 4,000 exit ramps in California
Georgia 1977–1979 Evaluation, using hidden cameras, of wrong-way entry on 45 exit ramps in the greater Atlanta area
California 1987–1989 Development of wrong-way solutions and report on study and survey results
NTSB Highway Special Investigation Report
6
California 1995 Research on circumstances of five fatal wrong-way collisions in Los Angeles County
Washington 1986–1996 Evaluation of wrong-way collisions on 80-mile section of Interstate 82
New Mexico 1998 Evaluation of directional sensor to detect wrong-way movement on Interstate 40 exit ramp
Texas 1997–2000 Research on characteristics of wrong-way collisions
Washington 2001 Evaluation of wrong-way movements at a partial-cloverleaf interchange using a hidden camera
New Mexico 1990–2004 Analysis of fatal wrong-way collisions on interstate highways
North Carolina 2005–2006 Statewide study of wrong-way crashes
Iowa 2007 Review of responses from a survey questionnaire sent to the 50 states
Connecticut 2008 Summary of wrong-way research and countermeasures
Michigan 2005–2009 Analysis of 110 wrong-way crashes on Michigan highway system
Arizona 2010–2011 Evaluation of wrong-way camera and sensor technology
New York 2010–2011 Conduct of sign inventory and accident data analysis
Florida 2011–2012 Evaluation of methods for detecting wrong-way entries on exit ramps
Illinois 2011–2012 Conduct of data analysis to identify countermeasures for at-risk locations
1.4 Data Summary
This section summarizes NTSB analysis of FARS data addressing wrong-way collisions.
1.4.1 Fatality Analysis Reporting System Data
The NTSB extracted data from the National Highway Traffic Safety Administration
(NHTSA) FARS for 2004 through 2009 to provide a national perspective on fatal wrong-way
collisions in the United States.24
The NTSB restricted its analysis to 1,566 fatal crashes that
occurred on entrance/exit ramps and controlled-access highways. Wrong-way collisions were
identified by using the following violation- and driver-related factor variables: “Driving Wrong
Way on One-Way Road” and “Driving on Left, Wrong Side of Road Generally.” The analysis
24
FARS contains data derived from a census of fatal traffic crashes within the 50 states, the Commonwealth of
Puerto Rico, and the District of Columbia. To be included in FARS, a crash must involve a motor vehicle traveling
on a traffic way customarily open to the public and must result in the death of a person (an occupant of a vehicle or a
nonmotorist) within 30 days of the crash. At the time of the analysis, the 2010 data were not available.
NTSB Highway Special Investigation Report
7
excluded wrong-way collisions that resulted from a vehicle encroaching into the opposite lanes
of travel after crossing through the median.
On average, about 360 lives are lost each year in about 260 fatal wrong-way collisions.
The number of fatal wrong-way collisions has been essentially unchanged for the 6 years of data
analyzed. (See table 2 for FARS data on fatal wrong-way collisions from 2004 through 2009.)
Table 2. FARS fatal wrong-way collision data (2004–2009).
Year All Fatal Crashes
Fatal Crashes on Divided Highways
Wrong-Way Fatal Crashes on Divided Highways
Wrong-Way Fatal Crashes as Percentage of Fatal Crashes on Divided Highways
Wrong-Way Crash Fatalities
2004 38,444 9,915 279 2.81% 393
2005 39,252 10,262 247 2.41% 328
2006 38,648 10,085 268 2.66% 369
2007 37,435 9,612 266 2.77% 370
2008 34,172 8,752 263 3.01% 357
2009 30,862 7,729 243 3.14% 322
Total 218,813 54,789 1,566 --- 2,139
Mean 36,469 9,393 261 2.80% 357
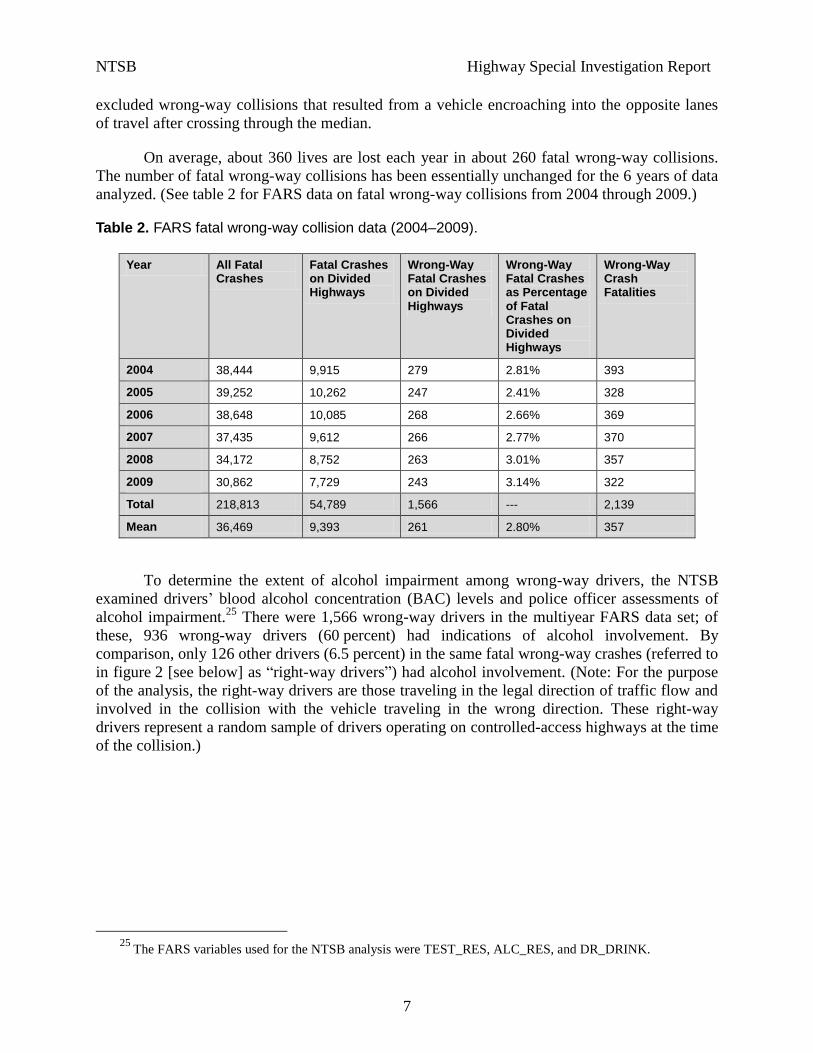
To determine the extent of alcohol impairment among wrong-way drivers, the NTSB
examined drivers’ blood alcohol concentration (BAC) levels and police officer assessments of
alcohol impairment.25
There were 1,566 wrong-way drivers in the multiyear FARS data set; of
these, 936 wrong-way drivers (60 percent) had indications of alcohol involvement. By
comparison, only 126 other drivers (6.5 percent) in the same fatal wrong-way crashes (referred to
in figure 2 [see below] as “right-way drivers”) had alcohol involvement. (Note: For the purpose
of the analysis, the right-way drivers are those traveling in the legal direction of traffic flow and
involved in the collision with the vehicle traveling in the wrong direction. These right-way
drivers represent a random sample of drivers operating on controlled-access highways at the time
of the collision.)
25
The FARS variables used for the NTSB analysis were TEST_RES, ALC_RES, and DR_DRINK.
NTSB Highway Special Investigation Report
8
Figure 2. FARS data indicating drivers involved in fatal wrong-way collisions on divided highways who showed indications of alcohol use; comparison between wrong-way and right-way driver drinking data (2004–2009). (Note: The larger number of right-way drivers reflects the fact that a wrong-way driver may collide with more than one vehicle.)
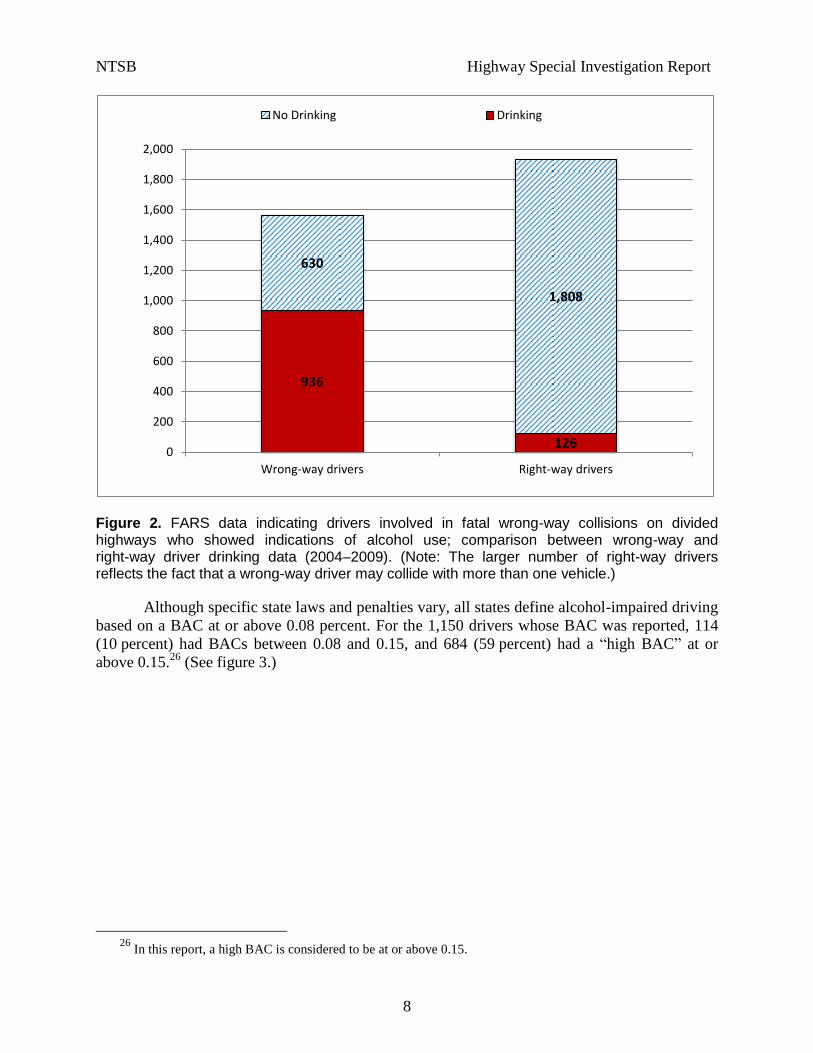
Although specific state laws and penalties vary, all states define alcohol-impaired driving
based on a BAC at or above 0.08 percent. For the 1,150 drivers whose BAC was reported, 114
(10 percent) had BACs between 0.08 and 0.15, and 684 (59 percent) had a “high BAC” at or
above 0.15.26
(See figure 3.)
26
In this report, a high BAC is considered to be at or above 0.15.
936
126
630
1,808
0
200
400
600
800
1,000
1,200
1,400
1,600
1,800
2,000
Wrong-way drivers Right-way drivers
No Drinking Drinking
NTSB Highway Special Investigation Report
9
Figure 3. NTSB analysis of FARS data (2004–2009) showing reported BAC levels of wrong-way drivers.
The FARS data further showed that 9 percent of wrong-way drivers had been convicted
of driving while intoxicated or impaired (DWI) within the 3 years prior to the wrong-way
collision, compared to 3.2 percent for a matched control group of right-way drivers.27
The NTSB also compared the ages of wrong-way drivers with the ages of right-way
drivers involved in the same collisions. The chart below shows drivers grouped by age. (See
figure 4.)
27
The specific criminal offenses pertaining to driving while impaired by alcohol vary across jurisdictions and
can include such terms as “driving under the influence of alcohol or drugs (DUI),” “operating under the influence of
alcohol or drugs (OUI),” or “driving while intoxicated.” In this report, the term “driving while intoxicated (DWI)” is
used to capture all types of alcohol-impaired offenses.
NTSB Highway Special Investigation Report
10
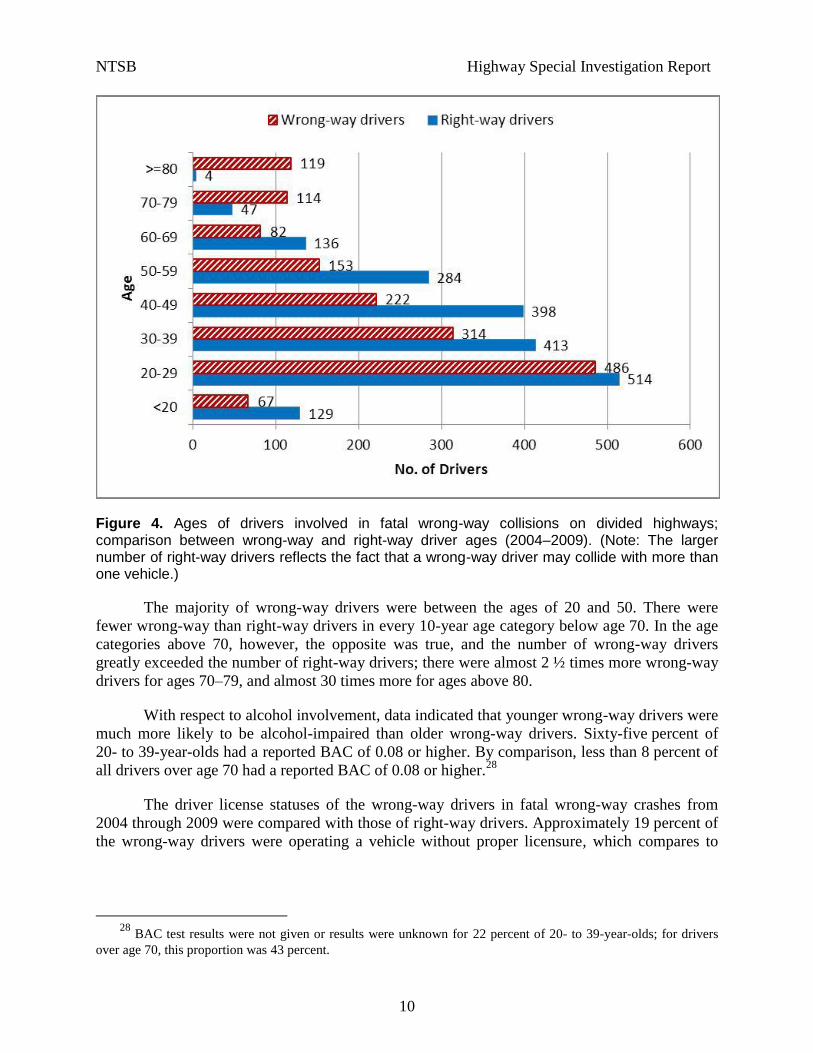
Figure 4. Ages of drivers involved in fatal wrong-way collisions on divided highways; comparison between wrong-way and right-way driver ages (2004–2009). (Note: The larger number of right-way drivers reflects the fact that a wrong-way driver may collide with more than one vehicle.)
The majority of wrong-way drivers were between the ages of 20 and 50. There were
fewer wrong-way than right-way drivers in every 10-year age category below age 70. In the age
categories above 70, however, the opposite was true, and the number of wrong-way drivers
greatly exceeded the number of right-way drivers; there were almost 2 ½ times more wrong-way
drivers for ages 70–79, and almost 30 times more for ages above 80.
With respect to alcohol involvement, data indicated that younger wrong-way drivers were
much more likely to be alcohol-impaired than older wrong-way drivers. Sixty-five percent of
20- to 39-year-olds had a reported BAC of 0.08 or higher. By comparison, less than 8 percent of
all drivers over age 70 had a reported BAC of 0.08 or higher.28
The driver license statuses of the wrong-way drivers in fatal wrong-way crashes from
2004 through 2009 were compared with those of right-way drivers. Approximately 19 percent of
the wrong-way drivers were operating a vehicle without proper licensure, which compares to
28
BAC test results were not given or results were unknown for 22 percent of 20- to 39-year-olds; for drivers
over age 70, this proportion was 43 percent.
NTSB Highway Special Investigation Report
11
6 percent of the right-way drivers involved in these crashes.29
Similar findings were made in a
California study conducted in the 1960s; in addition, wrong-way drivers were found to have
received considerably more driving violation and felony convictions than the average motorist
and to have been involved in more collisions of all types.30
NTSB analysis indicated that approximately 78 percent of wrong-way collisions occurred
between 6:00 p.m. and 6:00 a.m. (Specifically, 12 percent occurred between 6:00 and 9:00 p.m.,
18 percent between 9:00 p.m. and midnight, 31 percent between midnight and 3:00 a.m., and
17 percent between 3:00 and 6:00 a.m.) Approximately 57 percent of the collisions occurred on
the weekends. (Specifically, 14 percent of the wrong-way collisions occurred on Fridays,
21 percent on Saturdays, and 22 percent on Sundays.)
1.4.2 Data Limitations
Wrong-way collisions are often analytically considered in conjunction with median
crossover crashes because the two types of accidents can be difficult to separate. Wrong-way and
cross-median crashes do not have clear data definitions.31
Distinguishing between such accidents
requires the use of multiple variables. It is also difficult to determine whether a wrong-way
collision preceded by a median crossover was intentional or resulted from a driver’s inability to
maintain control of the vehicle.
Collision records contain an incomplete set of alcohol and drug test results. In 2010, only
23 states reported BAC test status for more than 80 percent of drivers killed in crashes; in
2 states (Alabama and Iowa), reporting rates were under 25 percent. Additionally, the national
reporting rate for surviving drivers in fatal crashes (30 percent in 2010) remains low.32
Another difficulty in understanding wrong-way driving events is a lack of exposure data.
Although there is a relatively complete sample of fatal outcome accidents, there are only limited,
small-scale, or short time-frame studies of the frequency of wrong-way events.
29
Specifically, 7 percent of the wrong-way drivers were unlicensed, 8 percent were operating with a suspended
license, 2 percent were operating with a revoked license, and 2 percent were operating with an expired license. Less
than 1 percent were operating with a cancelled or denied license. 30
T. N. Tamburri and P. R. Lowden, Interim Report on Wrong-Way Driving (Phase III): Driver
Characteristics, Effectiveness of Remedial Measures, and Effect of Ramp Type (Sacramento, CA: California
Department of Public Works, Division of Highways, 1968). 31
A safety recommendation to add crash data elements and standard definitions for cross-median crashes to the
Model Minimum Uniform Crash Criteria resulted from the NTSB’s investigation of a 2010 accident in
Munfordville, Kentucky (NTSB/HAR-11/02). 32
Traffic Safety Facts: 2010 Data, State Alcohol-Impaired Driving Estimates, DOT HS 811 612 (Washington,
DC: National Highway Traffic Safety Administration, April 2012).
NTSB Highway Special Investigation Report
12
2. NTSB Investigations
The NTSB has conducted three major investigations of wrong-way collisions: they took
place on March 7, 1968, near Baker, California; on June 9, 1970, near Dulles, Virginia; and on
May 14, 1988, near Carrollton, Kentucky.33
All three collisions involved passenger vehicles that
struck buses; consequently, the numbers of injuries associated with those events were relatively
high. In addition, from August to October 2011, the NTSB conducted six investigations in
support of this report. (See table 3.)
Table 3. Wrong-way collisions investigated by the NTSB.
Location Date Fatalities Injuries Vehicles Involved
Baker, CA March 7, 1968 20 11 Passenger Vehicle, Motorcoach
Dulles, VA June 9, 1970 2 14 Passenger Vehicle, Motorcoach
Carrollton, KY May 14, 1988 27 35 Passenger Vehicles (2), Church Activity Bus
Arlington, TX Aug. 11, 2011 0 2 Passenger Vehicles (2), Tractor-Trailer
Dallas, TX Aug. 12, 2011 0 2 Passenger Vehicles (2)
Fountain, CO Sept. 24, 2011 3 0 Passenger Vehicles (2), Tractor/Doubles
Beloit, WI Oct. 3, 2011 2 2 Passenger Vehicles (3), Tractor-Trailer
Carlisle, PA Oct. 6, 2011 1 0 Passenger Vehicle, Tractor-Trailer
Fernley, NV Oct. 14, 2011 2 1 Passenger Vehicles (2)
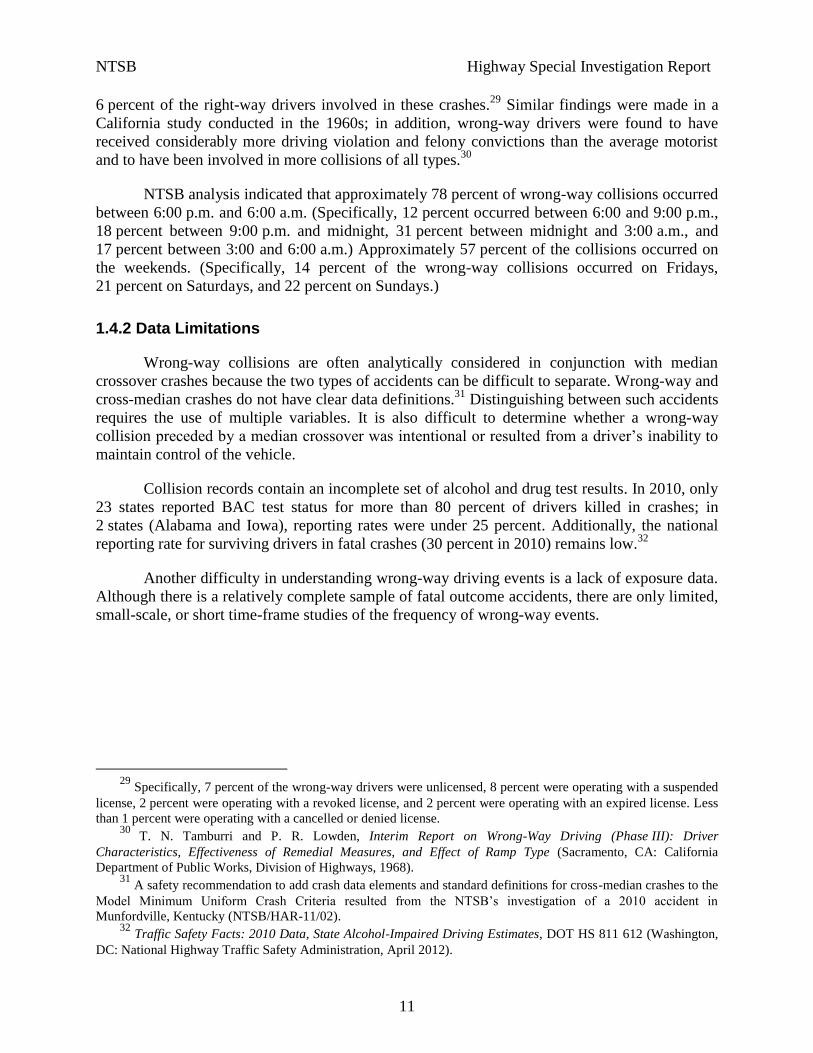
The wrong-way collisions investigated by the NTSB resulted in 57 fatalities and
minor-to-severe injuries to 67 vehicle occupants. The collisions involved 16 passenger vehicles,
2 motorcoaches, 1 church activity bus, and 4 heavy combination vehicles. Table 4 below lists
several factors of interest about these nine collisions.
Table 4. Factors concerning the wrong-way collisions investigated by the NTSB.
Location Day of Week
Time Occurred in Darkness
Lane in Which Collision Occurred
Baker, CA Thursday 3:50 p.m. No 1
Dulles, VA Tuesday 4:40 p.m. No 1
Carrollton, KY Saturday 10:55 p.m. Yes 1
Arlington, TX Thursday 1:36 a.m. Yes 3
Dallas, TX Friday 2:00 a.m. Yes 1
Fountain, CO Saturday 12:50 a.m. Yes 1
Beloit, WI Monday 8:11 p.m. Yes* 1
Carlisle, PA Thursday 2:52 p.m. No 2
Fernley, NV Friday 10:30 p.m. Yes 1
*The Beloit accident took place before daylight savings time ended for 2011 (on November 6, 2011). Consequently, it may not have been fully dark when the Beloit accident occurred.
33
See NTSB/SS-H/3, NTSB/HAR-71/02, and NTSB/HAR-89/01.
NTSB Highway Special Investigation Report
13
Six collisions occurred during twilight and nighttime hours between 8:00 p.m. and
3:00 a.m. when visibility would have been affected by darkness; the remaining three occurred
between 2:00 p.m. and 5:00 p.m. in daylight. Seven occurred on Thursday, Friday, or Saturday.
Seven of the nine wrong-way collisions took place in the number one lane.34
The
tendency of wrong-way collisions to take place in this lane is so common that many jurisdictions
train their police not to travel in the number one lane late at night because they have found
wrong-way vehicles are most often encountered in that lane.35
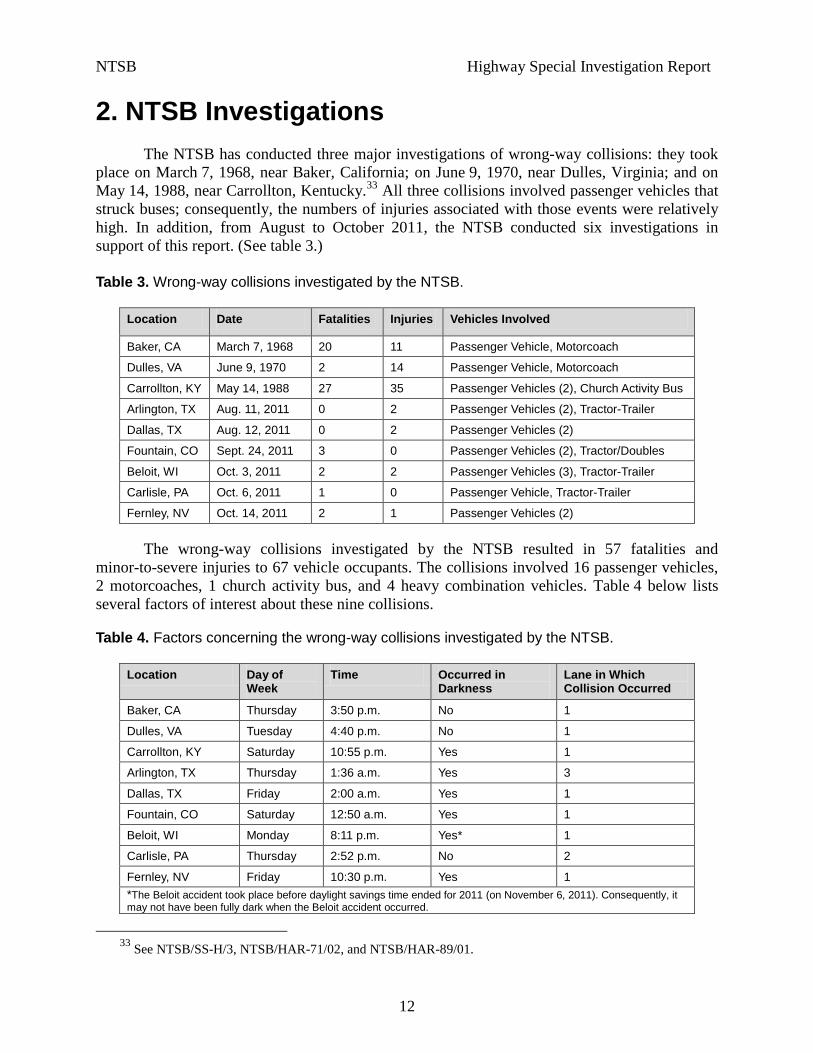
Table 5 below provides information on the wrong-way drivers involved in the collisions
investigated by the NTSB.
Table 5. Factors concerning the wrong-way drivers in the wrong-way collisions investigated by the NTSB.
Location Driver Gender
Driver Age
Driver BAC
Driver Injury Level
Miles to Driver’s Residence
Driver’s License Status
Baker, CA M 39 0.15 Fatal 3 Expired
Dulles, VA M 48 0.21 Fatal Unknown Valid
Carrollton, KY M 35 0.26 Serious Unknown Valid
Arlington, TX F 22 0.18 Serious 22 Valid
Dallas, TX M 31 0.21 Serious 13 Unlicensed
Fountain, CO M 36 0.25 Fatal 29 Valid
Beloit, WI F 58 0.00 Fatal 57 Valid
Carlisle, PA F 87 0.00 Fatal* 12 Valid
Fernley, NV M 58 0.19 Fatal 36 Valid
*Died 23 days after the collision.
These collisions involved three female and six male wrong-way drivers, ranging in age
from 22 to 87. Six wrong-way drivers died as a result of the collisions, and the remaining three
sustained serious injuries. The wrong-way drivers for whom residence was known lived
relatively near the collision sites, at distances of 3 to 57 miles. Six of the nine wrong-way drivers
had a BAC more than twice the legal limit of 0.08. (Two may have been confused due to a
medical condition.) One driver was unlicensed, one had an expired driver’s license, and seven
had valid driver’s licenses.
34
In this report, lanes are counted from the median outward; that is, the number one lane is the travel lane
nearest the median, etc. The number one lane is typically considered the passing or fast lane in the normal direction
of travel. 35
The California Highway Patrol Enforcement Driving Guide (Highway Patrol Guide 70.14), chapter 5,
advises: “When driving on a freeway or divided highway at night, consider wrong-way drivers, most of whom are
either under the influence of alcohol/drugs or confused. In either case, impaired drivers will usually be found in the
left lane, which is perceived as the right lane. When cresting an overpass or rounding a curve at legal speeds, there
may be a closing rate of 110 mph or 165 feet per second between your car and the impaired driver’s car. At this
speed, the only chance would be to instantly swerve the vehicle; braking would be futile. The only real defense
against the wrong-way driver is to watch well ahead. When the line of sight is reduced because of the highway
configuration, the odds are better driving in the right lanes.”
NTSB Highway Special Investigation Report
14
The entry point for wrong-way movements cannot always be determined, either because
the driver died as a result of the collision or was too impaired to remember how the event
unfolded; often, no reliable witness could identify the entry point. Of the six investigations
conducted in 2011 by the NTSB, only one wrong-way entry location could be determined with
certainty; three entry points could be established with some likelihood; and in two cases, the
entry point could be narrowed to a limited set of options. This lack of certainty about entry point
is also encountered in police records of wrong-way events.
(For purposes of reader orientation, see the appendix for diagrams of the Baker,
California; Dulles, Virginia; Carrollton, Kentucky; Arlington, Texas; Dallas, Texas; Fountain,
Colorado; Beloit, Wisconsin; and Fernley, Nevada, collision situations. These diagrams are not
to scale and are provided only to assist readers in visualizing the circumstances directly
preceding each accident. [Note: A diagram of the Carlisle, Pennsylvania, collision is provided as
figure 11 within text because it differs from the other accidents discussed below in that it
occurred immediately adjacent to the known point of wrong-way entry, the exit ramp.])
2.1 Baker, California
On Thursday, March 7, 1968, about 3:50 p.m. Pacific standard time, a 1964 Chevrolet
Impala driven by a 39-year-old man was traveling the wrong way (westbound in the eastbound
lanes) at a witness-estimated speed of 70 miles per hour (mph) in the number one lane on
Interstate 15 (I-15), approximately 3 miles east of California Route 127 near Baker, California. A
1966 Challenger MC 5A motorcoach, operated by a 41-year-old male driver and carrying
30 passengers, was traveling 60–65 mph eastbound on I-15. The motorcoach entered the number
one lane to overtake a slower eastbound pickup truck and recreational trailer in the right lane.
Approximately 450 to 600 feet before impact, the eastbound motorcoach driver became aware of
the westbound Chevrolet, made a hard brake application, and steered strongly to the left as the
Chevrolet driver braked and steered sharply to the right in the moments before impact. The
motorcoach, traveling at an estimated speed of 20–30 mph, and the Chevrolet, traveling at
52 mph, collided at an oblique angle on the paved left shoulder, After the impact, the motorcoach
rotated counterclockwise, overturned, and erupted in flames; the Chevrolet was pushed backward
and rotated clockwise before coming to rest adjacent to the motorcoach. The collision caused the
death of the Chevrolet driver and 19 motorcoach passengers, as well as injuries ranging from
minor to serious for the motorcoach driver and 11 passengers.36
The Chevrolet driver held an expired Montana driver’s license. Based on a conservative
metabolic rate applied to a blood specimen (contaminated with other body fluids) obtained
during an autopsy conducted 48 hours after the collision, the Chevrolet driver had a computed
BAC of 0.15.37
The collision occurred on a section of I-15 that runs east and west from Los Angeles,
California, to Las Vegas, Nevada. The four-lane controlled-access highway had a posted speed
limit of 70 mph. It was predominantly straight with two 12-foot-wide travel lanes in each
36
NTSB/SS-H/3. 37
The chemical analysis determined that the specimen had a BAC of 0.09 by weight and 21 percent carbon
monoxide saturation.
NTSB Highway Special Investigation Report
15
direction separated by a 78-foot-wide sandy median; each direction had a 10-foot-wide paved
right shoulder and a 2-foot-wide paved left shoulder.
The investigation indicated that at some point east of the town of Baker, the Chevrolet
driver reversed his direction of travel to westbound in the wrong direction on the eastbound
lanes. Investigators determined that the driver probably entered the highway at the Baker
interchange. The Baker exit ramp was equipped with “Do Not Enter” and “Wrong Way” signs,
as well as directional pavement arrows.
2.2 Dulles, Virginia
On Tuesday, June 9, 1970, about 4:40 p.m. eastern daylight time, a 1965 Mercury sedan
driven by a 48-year-old man was traveling approximately 65 mph the wrong way (westbound in
the eastbound lanes) in the number one lane of the Dulles Airport Access Road. Meanwhile, an
eastbound 41-passenger 1967 GMC model 4107 Greyhound Airport Service motorcoach,
operated by a 35-year-old male driver and occupied by eight passengers, was traveling about
65 mph in the number one lane, passing an eastbound 1969 Ford Econoline van in the number
two lane. The Ford van was driven by a 33-year-old man and occupied by five passengers. Just
before impact, both eastbound drivers took evasive action; the van driver braked and veered onto
the right shoulder, and the motorcoach driver braked and steered toward the median. About
584 feet east of the Virginia Route 7 exit ramp to Tysons Corner, the westbound Mercury struck
the right front of the eastbound motorcoach, which had slowed to approximately 50 mph. The
Mercury collided with the motorcoach in the number one lane. After impact, the Mercury rotated
counterclockwise about 180 degrees and struck the left front corner of the eastbound van before
coming to rest facing east, approximately 130 feet from the point of impact, on the eastbound
right paved shoulder of the Dulles Airport Access Road. After disengaging from the westbound
Mercury, the eastbound motorcoach continued east on the left paved shoulder before coming to
rest upright and facing east approximately 278 feet from the point of impact. The collision
caused the death of the Mercury driver and one motorcoach passenger. The motorcoach and van
drivers and 12 passengers received minor-to-severe injuries.38
Toxicology results of the blood specimen from the Mercury driver indicated a BAC of
0.21. Although no evidence from available background information indicated that the collision
was a self-destructive act, the medical examiner listed suicide as the official cause of death. The
Mercury driver held a valid Pennsylvania driver’s license, despite his residing in Maryland for
3 years. According to his spouse, on the day the collision occurred, he left home at 7:30 a.m. in a
positive state of mind to seek work as a carpenter (he was unemployed). His spouse further
stated that they were not experiencing financial difficulty or domestic problems and that he did
not drink alcohol such that it interfered with his work or home life.
The Dulles Airport Access Road was a four-lane expressway that had a maximum posted
speed limit of 65 mph and extended east from Dulles International Airport to Virginia Route 123
near McLean, Virginia. The roadway had two 12-foot-wide travel lanes in each direction,
separated by a 64-foot-wide median. Each direction of travel had a 12-foot-wide paved right
shoulder and a 3-foot-wide paved left shoulder.
38
NTSB/HAR-71/02.
NTSB Highway Special Investigation Report
16
Based on a review of possible actions by the driver, NTSB investigators determined that
the wrong-way movement was initiated when the Mercury driver executed a U-turn in an
uncurbed gore area after he merged onto the Dulles Airport Access Road from I-495
southbound.39
At the time of the collision, there were no traffic control devices indicating
one-way movement at the I-495 interchange; subsequently, such devices were installed to deter
wrong-way entry in the vicinity of the collision. (Signage and other traffic control devices are
discussed in detail in section 4.2.1 of this report.)
2.3 Carrollton, Kentucky
On Saturday, May 14, 1988, about 10:55 p.m. eastern daylight time, a 1987 Toyota
four-wheel-drive pickup truck, driven by a 35-year-old man, was traveling about 52–61 mph the
wrong way (northbound in the southbound lanes) in the number one lane on I-71, approximately
4.5 miles south of Carrollton, Kentucky. Near mile marker 40, the northbound Toyota collided
with a southbound 66-passenger 1977 church activity bus traveling about 54 mph. The bus was
occupied by a 36-year-old male driver, 3 adults, and 63 children ranging in age from 10 to 18.
Just prior to impact, the bus driver braked and steered the bus left, toward the median, in an
attempt to avoid a collision with the Toyota pickup truck.
After the frontal offset impact occurred, the Toyota rotated clockwise and its left rear
corner struck the left rear door of a southbound four-door Cadillac DeVille sedan occupied by a
34-year-old driver and a passenger. During the collision sequence, the fuel tank on the church
activity bus was punctured, and a fire ensued. The fire engulfed the entire bus. The bus driver
and 26 bus passengers died as a result of the crash. Thirty-four bus passengers sustained
minor-to-critical injuries, and six bus passengers were not injured. The Toyota pickup driver
sustained serious injuries, and the Cadillac’s occupants were not injured.40
The Toyota pickup driver held a valid Kentucky driver’s license with no restrictions and
an endorsement for operating a motorcycle. Toxicology tests indicated that he had a BAC of 0.26
about 1.5 hours after the collision; based on a conservative estimated elimination rate of 0.015
per hour, his BAC may have been higher than 0.28 at the time of the collision. The driver had a
history of intoxicated driving. On March 24, 1984, he was stopped for failing to dim his
vehicle’s headlamps and charged with DWI after a breathalyzer test returned a reading of
0.16 BAC. On April 19, 1984, he pled guilty to DWI and was referred by the court to attend
alcohol education treatment, which consisted of three 3-hour classroom sessions. As a result of
the Carrollton collision, the Toyota pickup driver received a 16-year prison sentence after being
convicted of 27 counts of second-degree manslaughter, 16 counts of second-degree assault,
27 counts of wanton endangerment, and 1 count of driving under the influence of alcohol.41
39
A gore area is the location between the main roadway and the ramp just beyond where the ramp branches
from the roadway. 40
NTSB/HAR-89/01. 41
See “Drunken Driver Lives in Obscurity: 15 Years Ago Today, He Killed 27 Riders on Church Bus,”
Cincinnati Enquirer, May 4, 2003, http://www.enquirer.com/editions/2003/05/14/loc_mahoney.html, accessed
September 4, 2012.
NTSB Highway Special Investigation Report
17
I-71 was a four-lane expressway with a maximum posted speed limit of 65 mph running
north–south from Cleveland, Ohio, to Louisville, Kentucky. The expressway consisted of two
12-foot-wide travel lanes in each direction separated by a 60-foot-wide sloped grass median;
each direction of travel had a 10-foot-wide paved right shoulder and a 3-foot-wide paved left
shoulder.
Before the collision, a witness southbound on I-71 observed a northbound Toyota pickup
change its direction of travel near mile marker 51 by traversing through the grass median to
proceed southbound on I-71. At mile marker 43, the witness exited I-71 for a stop and then
resumed traveling southbound on I-71. At mile marker 39, the witness observed the same Toyota
vehicle traveling the wrong way (northbound in the southbound lanes) in the number one (left)
lane. The witness tried but failed to get the attention of the Toyota driver (by activating his
vehicle’s horn and flashing its headlamps), so the witness exited I-71 to notify the police. It is
not known how the Toyota pickup driver changed direction again after being sighted by the
witness while traversing the median. After the witness reported the second sighting, the Toyota
continued traveling the wrong way for approximately 1.5 miles before colliding with the church
activity bus in the number one lane.
Interchanges in the vicinity were marked with “Do Not Enter” and “Wrong Way” signs,
turn prohibition signs at ramps, and “No U-Turn” signs in the paved portions of the median strip
(for emergency vehicle turnarounds). “One Way” signs and pavement markings, as specified in
the Manual on Uniform Traffic Control Devices (MUTCD), were not present near the
interchanges.
2.4 Arlington, Texas
On Thursday, August 11, 2011, about 1:36 a.m. central daylight time, a 2005 Chevrolet
Equinox sport utility vehicle (SUV) driven by a 22-year-old woman traveling the wrong way
(eastbound in the westbound lanes) in the number three lane on I-20 in Arlington, Tarrant
County, Texas, was involved in collisions with two westbound vehicles.42
When the collision
sequence began, the eastbound SUV was traveling over 100 mph with headlamps illuminated.43
The left side of the SUV sideswiped the left side of a westbound 2003 Toyota Camry sedan,
which was driven by a 58-year-old man who steered strongly to the right before impact. The
Toyota came to a controlled stop on the right shoulder. Subsequently, the right front corner of the
SUV struck the right front corner of a westbound 2007 International 9400 truck-tractor
semitrailer, which was operated by a 37-year-old male driver who steered strongly to the left
before impact. After the combination vehicle was struck, its truck-tractor rotated approximately
120 degrees clockwise, collided with a median guardrail, and came to rest facing southeast on
the median shoulder; the semitrailer came to rest facing southwest across the shoulder and two
travel lanes. The SUV disengaged from the combination vehicle and struck a bridge rail before
coming to rest facing east on the right shoulder. The collision resulted in serious injuries to the
SUV driver, minor injuries to the combination vehicle driver, and no injuries to the Toyota
driver.
42
The number three lane is the third lane from the median. 43
Airbag control module deployment data recorded a preimpact speed of 104 mph.
NTSB Highway Special Investigation Report
18
The SUV driver held a valid class “C” Texas driver’s license with a restriction to wear
corrective lenses; the license would expire in September 2012. Her driving record included a
speeding violation in January 2007 and no prior accidents. Toxicology tests from a blood
specimen drawn approximately 4 hours after the collision indicated a BAC of 0.18; based on a
conservative estimated elimination rate of 0.015 per hour, her BAC may have been higher than
0.24 at the time of the collision. She told police that she had been drinking after work at a bar
and had no memory of her route of travel before the collision. Police and NTSB investigators
were unable to determine where she had been drinking.
The collision occurred on an urban section of I-20 that runs nominally east and west with
four asphalt travel lanes in each direction separated by a continuous median barrier; the posted
speed limit was 60 mph. The roadway has 12-foot-wide travel lanes delineated by broken white
lines every 30 feet and raised bidirectional reflective pavement markers that reflect white light to
motorists traveling in the correct direction and red light to those traveling in the wrong direction.
The roadway has 10-foot-wide paved right and 8-foot-wide paved left shoulders. In the vicinity
of the collision, there is no roadway lighting, and the highway is relatively straight. Two
previous noninjury wrong-way collisions were reported on I-20 in Tarrant County between 2007
and 2010.
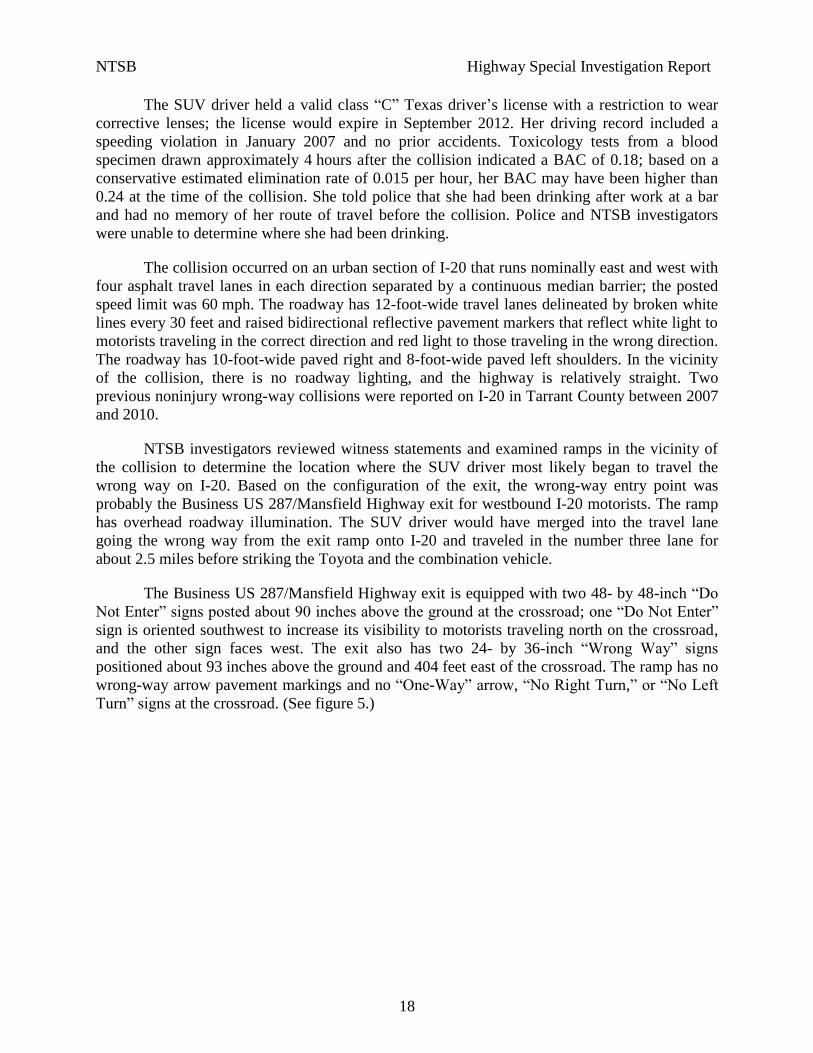
NTSB investigators reviewed witness statements and examined ramps in the vicinity of
the collision to determine the location where the SUV driver most likely began to travel the
wrong way on I-20. Based on the configuration of the exit, the wrong-way entry point was
probably the Business US 287/Mansfield Highway exit for westbound I-20 motorists. The ramp
has overhead roadway illumination. The SUV driver would have merged into the travel lane
going the wrong way from the exit ramp onto I-20 and traveled in the number three lane for
about 2.5 miles before striking the Toyota and the combination vehicle.
The Business US 287/Mansfield Highway exit is equipped with two 48- by 48-inch “Do
Not Enter” signs posted about 90 inches above the ground at the crossroad; one “Do Not Enter”
sign is oriented southwest to increase its visibility to motorists traveling north on the crossroad,
and the other sign faces west. The exit also has two 24- by 36-inch “Wrong Way” signs
positioned about 93 inches above the ground and 404 feet east of the crossroad. The ramp has no
wrong-way arrow pavement markings and no “One-Way” arrow, “No Right Turn,” or “No Left
Turn” signs at the crossroad. (See figure 5.)
NTSB Highway Special Investigation Report
19
Figure 5. Likely wrong-way driver entry point for the Arlington, Texas, collision, with signage locations marked. Green arrow indicates direction of the wrong-way vehicle's travel.
2.5 Dallas, Texas
On Friday, August 12, 2011, about 2:00 a.m. central daylight time, a 1994 Lincoln
Mark VIII coupe driven by a 31-year-old man was involved in a frontal offset collision while
traveling the wrong way (northbound in the southbound lanes) in the number one lane on
US Highway 75 in Dallas, Texas. Southbound witnesses indicated that the Lincoln was traveling
about 80 mph and, despite the darkness, only its parking lights were illuminated. Approximately
600 feet south of the Forest Lane interchange on Highway 75, the left front of the Lincoln struck
the left front of a southbound 2005 Honda Civic, which was driven by a 21-year-old woman and
traveling at a witness-estimated speed of 60 mph. The impact of the faster, heavier Lincoln
reversed the direction of the Honda, and the Honda rotated counterclockwise approximately
90 degrees before coming to rest facing east. The Lincoln rotated counterclockwise
approximately 30 degrees and came to rest facing northwest on the median shoulder. Both
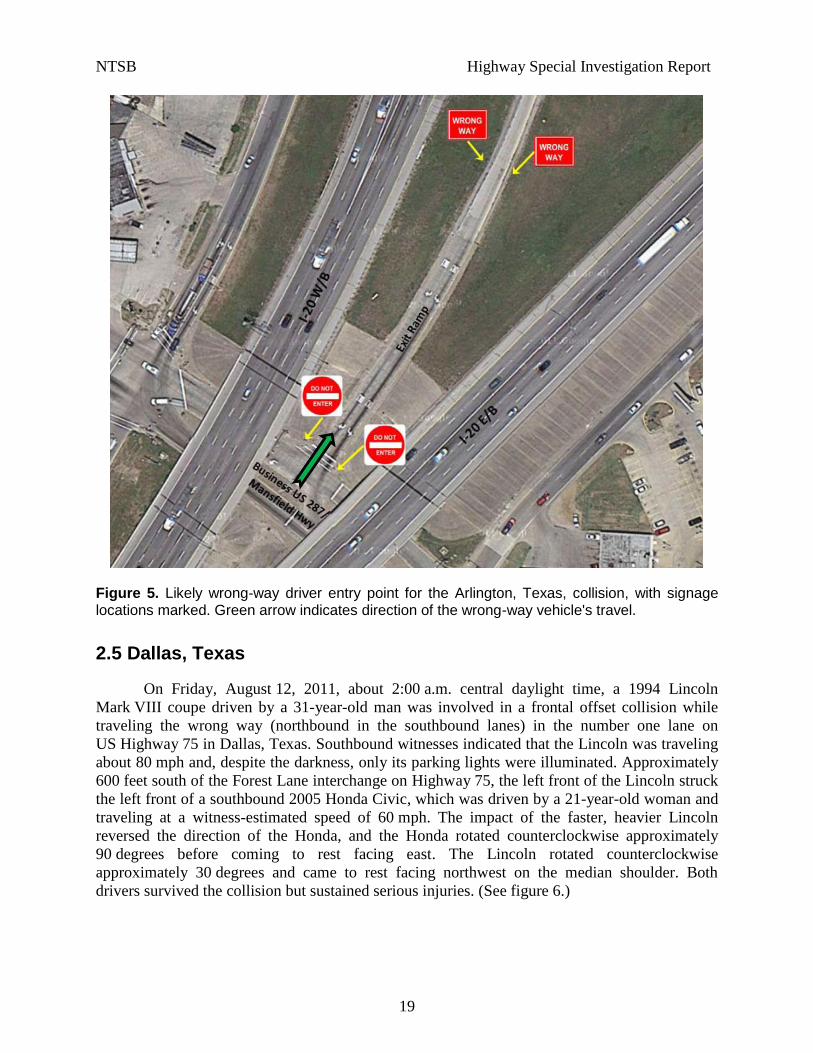
drivers survived the collision but sustained serious injuries. (See figure 6.)
NTSB Highway Special Investigation Report
20
Figure 6. Damage to wrong-way vehicle from the Dallas, Texas, collision.
The Lincoln driver was unlicensed at the time of the collision. He was first issued a
Texas driver’s license on June 10, 1999. Court records revealed that he was arrested for DWI in
2004, and information from the Texas Department of Public Safety indicated that he was also
arrested for DWI on October 17, 2008, in Irving, Texas, at which time he refused to provide a
breath test. The driver was found guilty of the 2008 DWI offense, which was adjudicated on
July 12, 2011—just a month before the collision—and he was placed on probation. Postaccident
toxicology tests run on the Lincoln driver for medical purposes indicated a BAC of 0.21. The
driver also tested positive for morphine. Doctor’s notes indicated that the driver had no memory
of the collision. The driver was arrested and charged with felony intoxication and assault by a
motor vehicle.
US Highway 75 is a 10-lane highway with a 32-inch continuous concrete barrier that
separates the four through lanes from an 11-foot-wide merge lane. The 12-foot-wide asphalt
through lanes are delineated by broken white 10-foot-long lines every 30 feet and bidirectional
pavement reflectors at 40-foot intervals. The reflectors reflect white light to motorists traveling
in the correct direction and red light to those traveling in the wrong direction. The approximately
9-foot-wide paved left shoulder is delineated from the travel lane by a continuous solid yellow
line, and the approximately 10-foot-wide paved right shoulder is delineated by a continuous solid
NTSB Highway Special Investigation Report
21
white line. Two lamps are mounted on 75-foot-high poles every 200 feet along the median to
provide roadway lighting.
NTSB investigators conducted interviews and inspected exit ramps to determine where
the Lincoln driver began to travel the wrong way—northbound in the southbound lanes of
Highway 75. They contacted the Texas Department of Transportation (Dallas District) to
determine whether the wrong-way vehicle might have been captured on one of about 300 traffic
cameras in Dallas County; it was not. Interview information identified several ramps along a
6-mile stretch of the North Central Expressway where the Lincoln could have entered
Highway 75 traveling the wrong way. In each instance, the Lincoln driver would have first
traveled the wrong way (northbound in the southbound lanes) several hundred feet on the North
Central Expressway to access and then drive the wrong way on Highway 75. The North Central
Expressway has multiple lanes that provide travel in one direction only (north or south) on each
side of Highway 75.
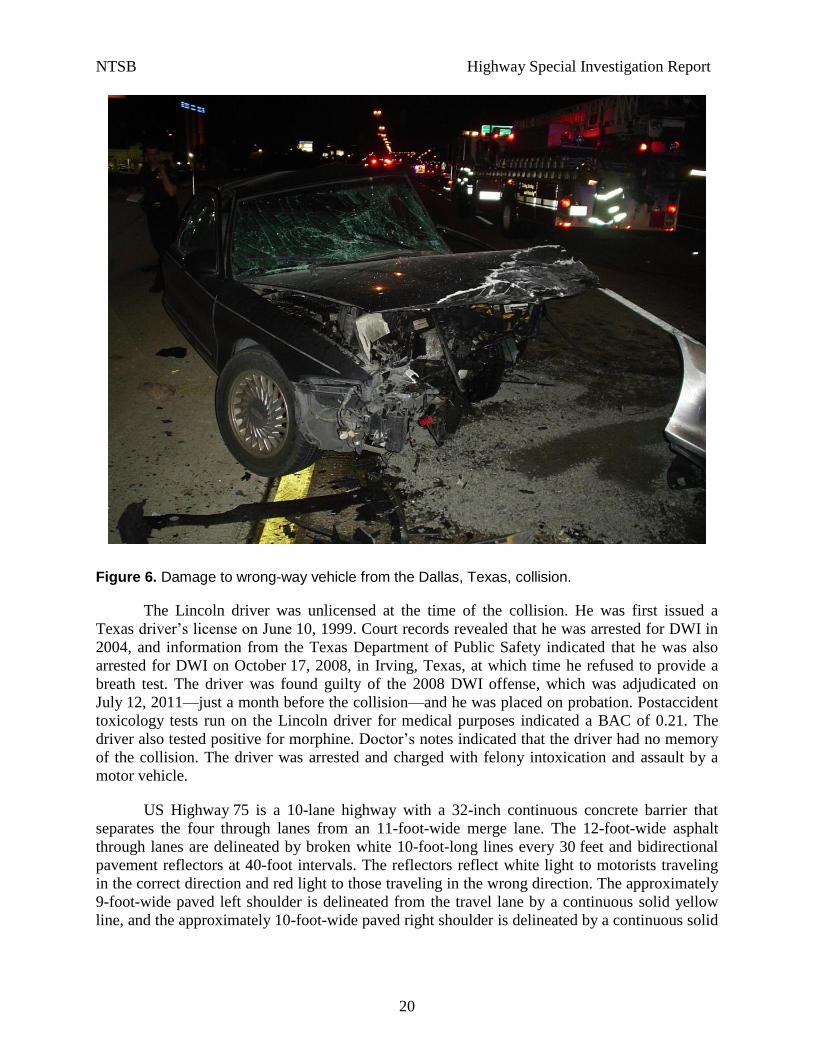
Investigators examined exit ramps in the vicinity of the collision site that channel
vehicles from southbound Highway 75 to southbound North Central Expressway. The exit ramps
are equipped with four 30- by 30-inch “Do Not Enter” signs positioned approximately 7 feet
above the ground, facing south, parallel with the crossroad. The first two “Do Not Enter” signs
are located about 25 feet north of the crossroad, and the two additional “Do Not Enter” signs are
located about 600 feet farther north. In addition, two 24- by 36-inch “Wrong Way” signs are
located 200 feet from the crossroad and elevated about 17 feet above the ground.44
(See figure 7.)
Figure 7. Mounting height of wrong-way signs on frontage road adjacent to US Highway 75 in Dallas, Texas.
44
Section 2A.18 of the MUTCD indicates that 17 feet is the minimum height for overhead signs.
NTSB Highway Special Investigation Report
22
Pavement markings near the crossroad include a white-painted 12-inch-wide stop bar and
left and right turn directional pavement arrows. No wrong-way arrow pavement markings are
located on the North Central Expressway or the Highway 75 exit ramps, and the crossroads do
not have any “No Right Turn” or “No Left Turn” signs.
2.6 Fountain, Colorado
On Saturday, September 24, 2011, about 12:50 a.m. central daylight time, a 2001 Toyota
Four Runner SUV, which was driven by a 36-year-old man and traveling about 70 mph the
wrong way (northbound in the southbound lanes) in the number one lane on I-25 near Fountain,
Colorado, was involved in a full frontal collision with a 2005 Acura MDX SUV. The Acura was
occupied by a 38-year-old male driver and a 36-year-old female passenger and was traveling
southbound about 70 mph in the number one lane.45
In the number two lane of I-25, an unknown
distance behind the southbound Acura, a 2005 International truck-tractor in combination with a
set of double trailers driven by a 41-year-old man was traveling southbound about 60 mph. After
the impact, the fronts of the Toyota and the Acura remained fused together, and the two vehicles
traveled as a single unit south for about 20 feet before rotating clockwise and coming to rest. The
collision between the Toyota and Acura caused the Toyota’s spare tire to detach and collide with
the combination vehicle as it traveled by the wreckage on the right shoulder. The Toyota and
Acura drivers and the Acura passenger died as a result of the collision. The combination vehicle
driver was not injured.
The Colorado Department of Motor Vehicles indicated that the Toyota driver held a valid
noncommercial Colorado driver’s license with an expiration date in July 2016. His driver’s
license contained no restrictions or endorsements, and his driver’s record had no documented
history. Toxicology test results from a blood specimen drawn about 7 hours after the collision
revealed a BAC of 0.25; the specimen tested negative for drugs.
The collision occurred near mile marker 131 on a straight section of I-25 that extends
north and south in El Paso County with a posted speed limit of 75 mph. The two lanes in each
direction are separated by a grass-covered median approximately 60 feet wide. The 12-foot-wide
asphalt lanes are delineated by broken white lines; the left 4-foot-wide paved shoulder is
delineated from the left travel lane with a solid yellow line, and the 10-foot-wide paved right
shoulder is delineated from the right lane with a solid white line. A continuous rumble strip is
located on both shoulders.
The police accident file, 911 call records, and dispatch logs indicated that the first report
of a wrong-way vehicle on I-25 near mile marker 122 was received at 12:48 a.m.; a second call
received about 12:50 a.m. reported a wrong-way vehicle near mile marker 125; and a third call,
also received about 12:50 a.m., reported a wrong-way vehicle near mile marker 128. Based on
this information, the Toyota most likely began to travel the wrong way on I-25 by entering exit
ramp 119 or 122; it then traveled approximately 10 miles before it collided with the Acura.
45
A state trooper investigating the collision received conflicting statements from two witnesses and the
combination vehicle driver about whether the headlamps on the Toyota were illuminated before the collision.
NTSB Highway Special Investigation Report
23
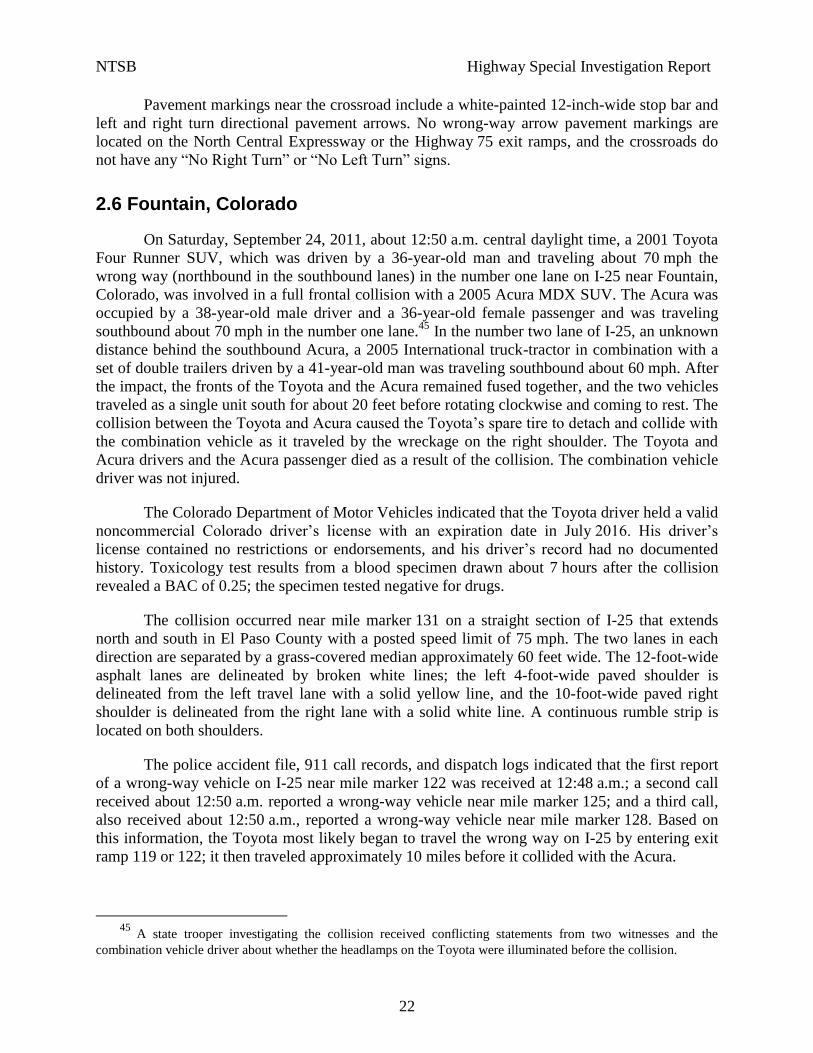
Exit ramps 119 and 122 are equipped with two 30- by 30-inch “Do Not Enter” signs
positioned about 7 feet above the ground, facing south, parallel with the crossroad. Additionally,
exit 119 has two 24- by 36-inch “Wrong Way” signs located 75 feet from the crossroad; this
signage differs from exit 122, which has one 24- by 36-inch “Wrong Way” sign on the left,
approximately 37 feet from the crossroad, and a second 24- by 36-inch “Wrong Way” sign on
the right, 250 feet from the crossroad. Both ramps also have 12- by 36-inch “One-Way” signs
posted about 5 feet above the ground at the crossroad. The ramps have no artificial lighting or
wrong-way arrow pavement markings. (See figure 8.)
Figure 8. End of exit ramp 122, possible wrong-way driver entry point for the Fountain, Colorado, collision.
2.7 Beloit, Wisconsin
On Monday, October 3, 2011, about 8:11 p.m. central daylight time, a 2007 Volkswagen
Beetle, driven by a 58-year-old woman, was traveling the wrong way (southbound in the
northbound lanes) in the number one lane on I-43 east of Beloit, Wisconsin. Near mile marker 3,
the Volkswagen, with its headlamps illuminated and traveling about 60 mph in the number one
lane, collided with the front of a northbound 2008 Chevrolet Impala traveling about 55 mph46
and occupied by a 19-year-old female driver and a 20-year-old male passenger. The left front of
the Volkswagen struck the left front of the northbound Chevrolet with moderate front overlap,
which resulted in about 18 inches of residual crush to the fronts of both vehicles. (See figure 9
for damage to the Volkswagen.) After the impact, the southbound Volkswagen and the
northbound Chevrolet rotated approximately 90 degrees counterclockwise before coming to rest
facing each other. Moments later, the front of a northbound 2002 Freightliner truck-tractor in
combination with a closed van-type semitrailer, operated by a 50-year-old male driver and
traveling about 65 mph, struck the Volkswagen’s right front side and the Chevrolet’s left side,
46
Air bag deployment data recorded a preimpact speed of 55 mph.
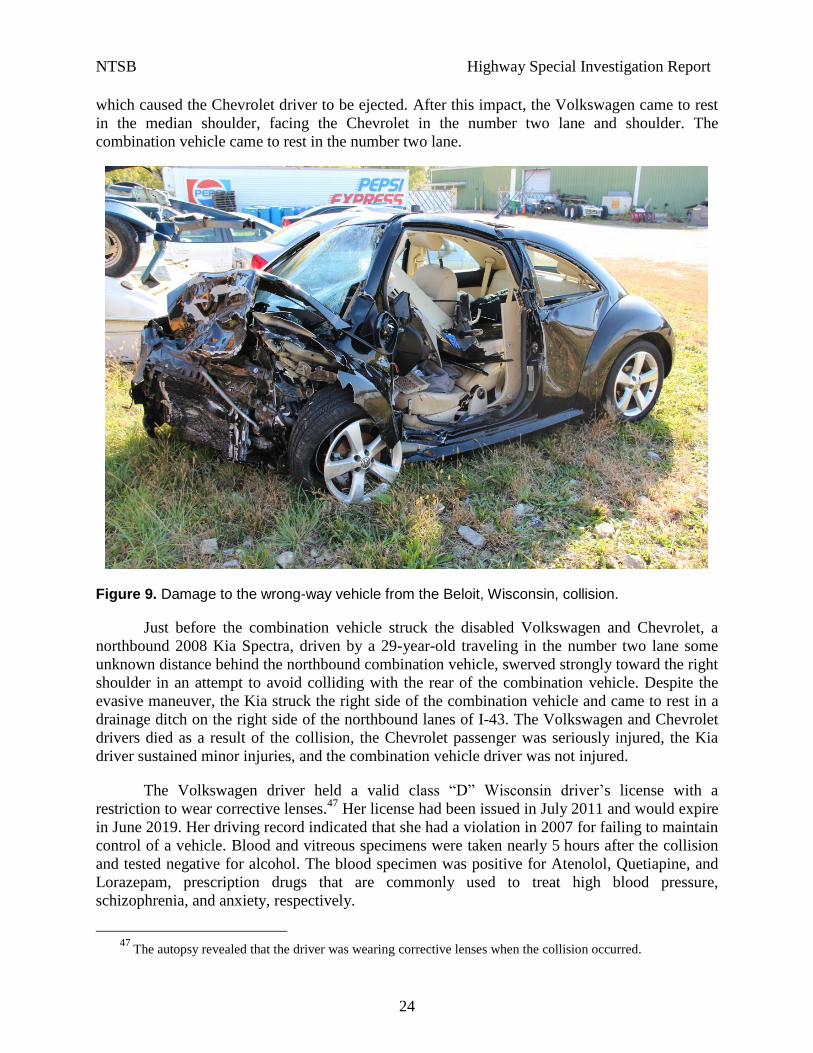
NTSB Highway Special Investigation Report
24
which caused the Chevrolet driver to be ejected. After this impact, the Volkswagen came to rest
in the median shoulder, facing the Chevrolet in the number two lane and shoulder. The
combination vehicle came to rest in the number two lane.
Figure 9. Damage to the wrong-way vehicle from the Beloit, Wisconsin, collision.
Just before the combination vehicle struck the disabled Volkswagen and Chevrolet, a
northbound 2008 Kia Spectra, driven by a 29-year-old traveling in the number two lane some
unknown distance behind the northbound combination vehicle, swerved strongly toward the right
shoulder in an attempt to avoid colliding with the rear of the combination vehicle. Despite the
evasive maneuver, the Kia struck the right side of the combination vehicle and came to rest in a
drainage ditch on the right side of the northbound lanes of I-43. The Volkswagen and Chevrolet
drivers died as a result of the collision, the Chevrolet passenger was seriously injured, the Kia
driver sustained minor injuries, and the combination vehicle driver was not injured.
The Volkswagen driver held a valid class “D” Wisconsin driver’s license with a
restriction to wear corrective lenses.47
Her license had been issued in July 2011 and would expire
in June 2019. Her driving record indicated that she had a violation in 2007 for failing to maintain
control of a vehicle. Blood and vitreous specimens were taken nearly 5 hours after the collision
and tested negative for alcohol. The blood specimen was positive for Atenolol, Quetiapine, and
Lorazepam, prescription drugs that are commonly used to treat high blood pressure,
schizophrenia, and anxiety, respectively.
47
The autopsy revealed that the driver was wearing corrective lenses when the collision occurred.
NTSB Highway Special Investigation Report
25
In the vicinity of the collision, I-43 is a rural four-lane limited-access highway with two
asphalt lanes in each direction separated by a 30-foot-wide depressed earthen median. The travel
lanes are 12 feet wide and delineated by broken white lines. The paved left shoulder is
approximately 2.5 feet wide and delineated from the left lane by a solid yellow line, and the
paved right shoulder is about 10 feet wide and delineated from the right lane by a solid white
line. Continuous rumble strips are located on both shoulders, and the roadway is straight. I-43
had no roadway lighting at the collision location.
Based on witness statements and examination of entry and exit ramps in the area of the
collision, NTSB investigators determined that the most likely wrong-way entry point was the exit
ramp at State Route 140, which is about 3 miles from the collision site. However, investigators
could not rule out the possibility that the Volkswagen began to travel the wrong way on I-43 by
executing a U-turn or traversing the median.
The exit ramp for State Route 140 is equipped with a single “Do Not Enter” sign facing
south on the right side of the ramp and two “Wrong Way” signs farther south and on each side of
the ramp. There are “No Right Turn” and “No Left Turn” signs posted in each direction on the
crossroad to warn drivers on State Route 140 against inadvertently entering the exit ramp. The
ramp has no roadway lighting or wrong-way arrow pavement markings. (See figure 10.)
Figure 10. Possible wrong-way driver entry location for the Beloit, Wisconsin, collision.
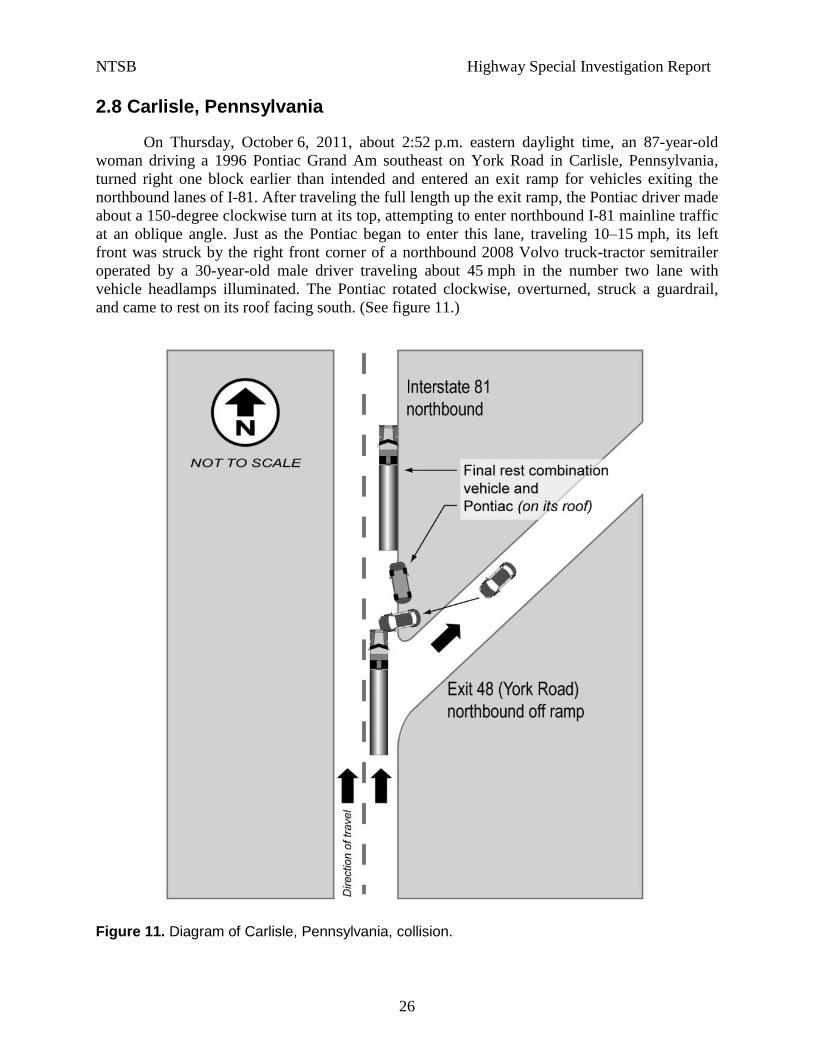
NTSB Highway Special Investigation Report
26
2.8 Carlisle, Pennsylvania
On Thursday, October 6, 2011, about 2:52 p.m. eastern daylight time, an 87-year-old
woman driving a 1996 Pontiac Grand Am southeast on York Road in Carlisle, Pennsylvania,
turned right one block earlier than intended and entered an exit ramp for vehicles exiting the
northbound lanes of I-81. After traveling the full length up the exit ramp, the Pontiac driver made
about a 150-degree clockwise turn at its top, attempting to enter northbound I-81 mainline traffic
at an oblique angle. Just as the Pontiac began to enter this lane, traveling 10–15 mph, its left
front was struck by the right front corner of a northbound 2008 Volvo truck-tractor semitrailer
operated by a 30-year-old male driver traveling about 45 mph in the number two lane with
vehicle headlamps illuminated. The Pontiac rotated clockwise, overturned, struck a guardrail,
and came to rest on its roof facing south. (See figure 11.)
Figure 11. Diagram of Carlisle, Pennsylvania, collision.
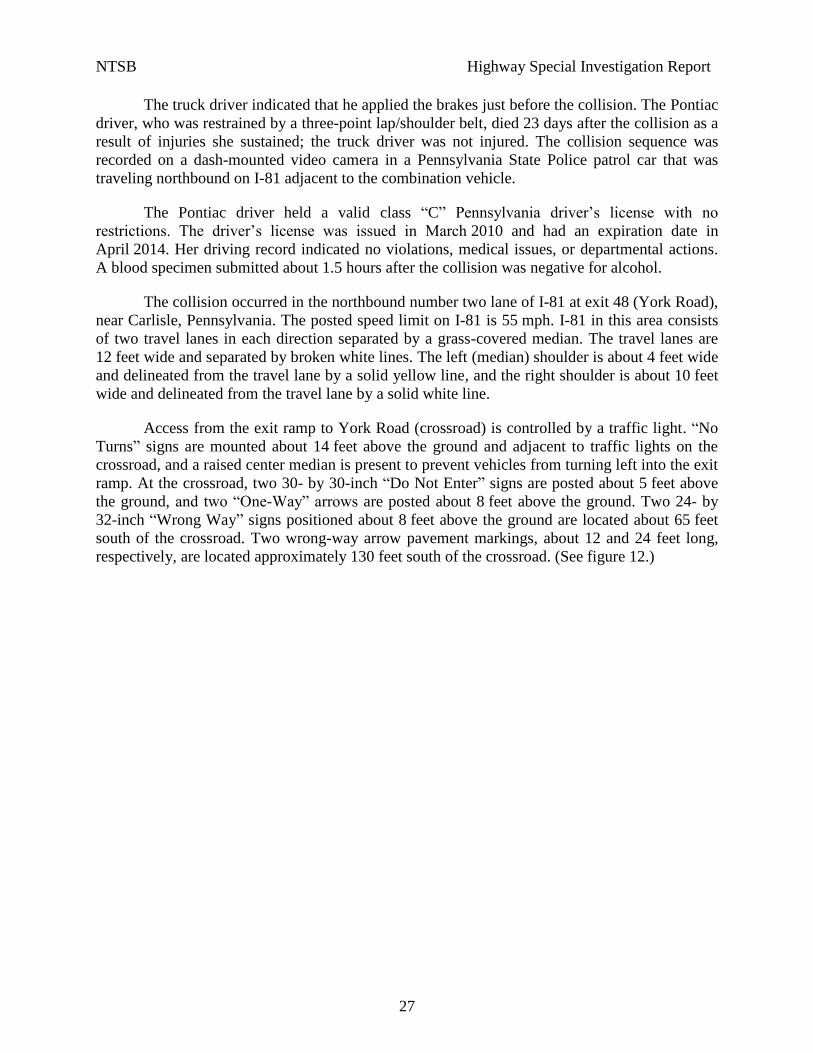
NTSB Highway Special Investigation Report
27
The truck driver indicated that he applied the brakes just before the collision. The Pontiac
driver, who was restrained by a three-point lap/shoulder belt, died 23 days after the collision as a
result of injuries she sustained; the truck driver was not injured. The collision sequence was
recorded on a dash-mounted video camera in a Pennsylvania State Police patrol car that was
traveling northbound on I-81 adjacent to the combination vehicle.
The Pontiac driver held a valid class “C” Pennsylvania driver’s license with no
restrictions. The driver’s license was issued in March 2010 and had an expiration date in
April 2014. Her driving record indicated no violations, medical issues, or departmental actions.
A blood specimen submitted about 1.5 hours after the collision was negative for alcohol.
The collision occurred in the northbound number two lane of I-81 at exit 48 (York Road),
near Carlisle, Pennsylvania. The posted speed limit on I-81 is 55 mph. I-81 in this area consists
of two travel lanes in each direction separated by a grass-covered median. The travel lanes are
12 feet wide and separated by broken white lines. The left (median) shoulder is about 4 feet wide
and delineated from the travel lane by a solid yellow line, and the right shoulder is about 10 feet
wide and delineated from the travel lane by a solid white line.
Access from the exit ramp to York Road (crossroad) is controlled by a traffic light. “No
Turns” signs are mounted about 14 feet above the ground and adjacent to traffic lights on the
crossroad, and a raised center median is present to prevent vehicles from turning left into the exit
ramp. At the crossroad, two 30- by 30-inch “Do Not Enter” signs are posted about 5 feet above
the ground, and two “One-Way” arrows are posted about 8 feet above the ground. Two 24- by
32-inch “Wrong Way” signs positioned about 8 feet above the ground are located about 65 feet
south of the crossroad. Two wrong-way arrow pavement markings, about 12 and 24 feet long,
respectively, are located approximately 130 feet south of the crossroad. (See figure 12.)
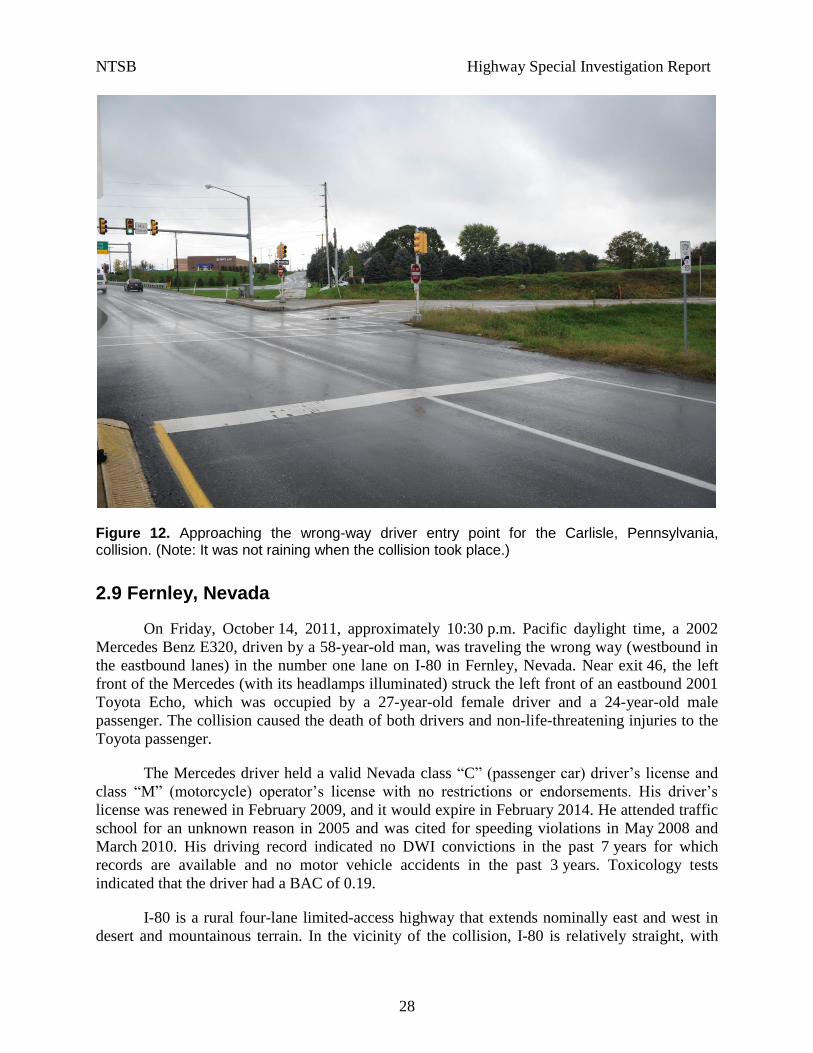
NTSB Highway Special Investigation Report
28
Figure 12. Approaching the wrong-way driver entry point for the Carlisle, Pennsylvania, collision. (Note: It was not raining when the collision took place.)
2.9 Fernley, Nevada
On Friday, October 14, 2011, approximately 10:30 p.m. Pacific daylight time, a 2002
Mercedes Benz E320, driven by a 58-year-old man, was traveling the wrong way (westbound in
the eastbound lanes) in the number one lane on I-80 in Fernley, Nevada. Near exit 46, the left
front of the Mercedes (with its headlamps illuminated) struck the left front of an eastbound 2001
Toyota Echo, which was occupied by a 27-year-old female driver and a 24-year-old male
passenger. The collision caused the death of both drivers and non-life-threatening injuries to the
Toyota passenger.
The Mercedes driver held a valid Nevada class “C” (passenger car) driver’s license and
class “M” (motorcycle) operator’s license with no restrictions or endorsements. His driver’s
license was renewed in February 2009, and it would expire in February 2014. He attended traffic
school for an unknown reason in 2005 and was cited for speeding violations in May 2008 and
March 2010. His driving record indicated no DWI convictions in the past 7 years for which
records are available and no motor vehicle accidents in the past 3 years. Toxicology tests
indicated that the driver had a BAC of 0.19.
I-80 is a rural four-lane limited-access highway that extends nominally east and west in
desert and mountainous terrain. In the vicinity of the collision, I-80 is relatively straight, with
NTSB Highway Special Investigation Report
29
two lanes in each direction separated by a 78-foot-wide depressed grass-covered median. The
12-foot-wide travel lanes are delineated by broken white lines; the paved left shoulder is
delineated from the left travel lane by a solid yellow line; and the paved right shoulder is
delineated by a solid white line. Continuous rumble strips are located on each shoulder.
Delineator posts displaying retroreflective markers about 3 feet above the ground are positioned
every 200 feet; when illuminated by vehicle headlamps, the markers reflect white light on the
right side of I-80 and yellow light on the left side. Roadway lighting is provided at exit ramps
and nearby buildings but not in the immediate vicinity of the collision site.
The Nevada State Patrol determined that the Mercedes began to travel the wrong way on
I-80 by entering exit 48, about 2 miles east of the collision scene. The ramp intersects with State
Route 343 and is equipped with the following warning signage: two 36- by 36-inch “Do Not
Enter” signs and “One-Way” arrow signs about 6 feet above the ground; two 42- by 30-inch
“Wrong Way” signs about 6 feet above the ground and 100 feet west of the crossroad; and a “No
Right Turn” sign on State Route 343 to warn southbound vehicle drivers against inadvertently
entering the ramp. (See figure 13 below.)
Figure 13. Likely wrong-way driver entry point for Fernley, Nevada, collision.
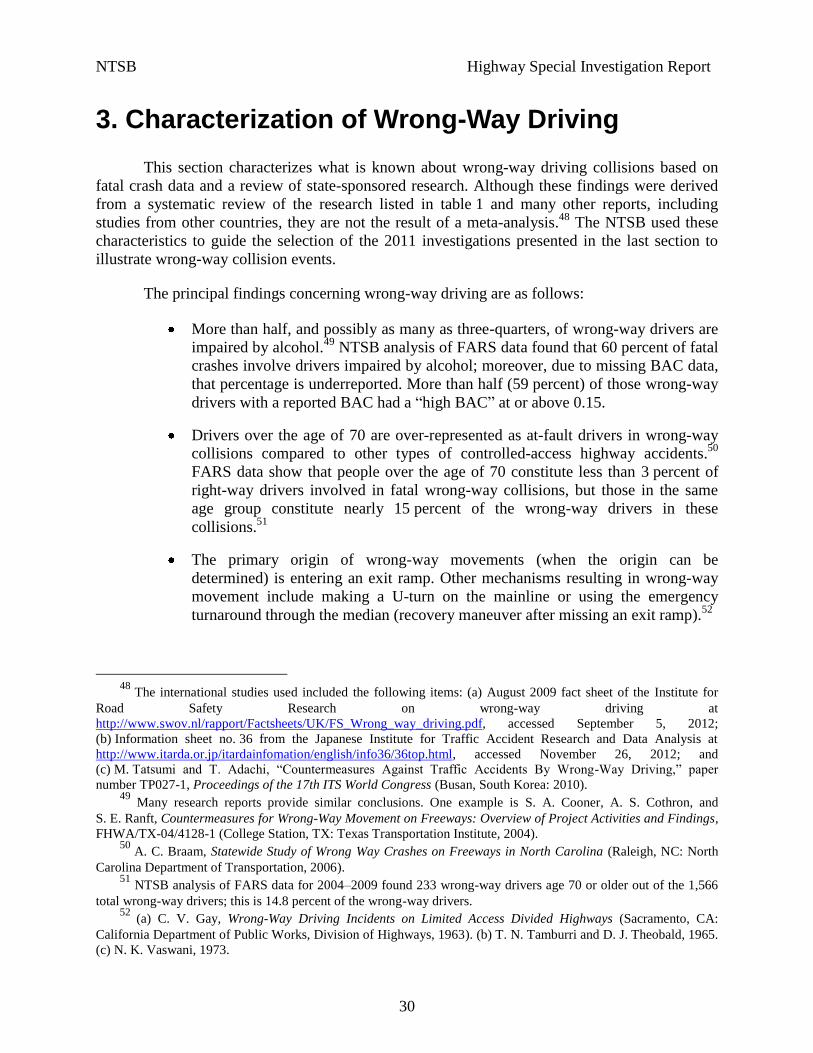
NTSB Highway Special Investigation Report
30
3. Characterization of Wrong-Way Driving
This section characterizes what is known about wrong-way driving collisions based on
fatal crash data and a review of state-sponsored research. Although these findings were derived
from a systematic review of the research listed in table 1 and many other reports, including
studies from other countries, they are not the result of a meta-analysis.48
The NTSB used these
characteristics to guide the selection of the 2011 investigations presented in the last section to
illustrate wrong-way collision events.
The principal findings concerning wrong-way driving are as follows:
More than half, and possibly as many as three-quarters, of wrong-way drivers are
impaired by alcohol.49
NTSB analysis of FARS data found that 60 percent of fatal
crashes involve drivers impaired by alcohol; moreover, due to missing BAC data,
that percentage is underreported. More than half (59 percent) of those wrong-way
drivers with a reported BAC had a “high BAC” at or above 0.15.
Drivers over the age of 70 are over-represented as at-fault drivers in wrong-way
collisions compared to other types of controlled-access highway accidents.50
FARS data show that people over the age of 70 constitute less than 3 percent of
right-way drivers involved in fatal wrong-way collisions, but those in the same
age group constitute nearly 15 percent of the wrong-way drivers in these
collisions.51
The primary origin of wrong-way movements (when the origin can be
determined) is entering an exit ramp. Other mechanisms resulting in wrong-way
movement include making a U-turn on the mainline or using the emergency
turnaround through the median (recovery maneuver after missing an exit ramp).52
48
The international studies used included the following items: (a) August 2009 fact sheet of the Institute for
Road Safety Research on wrong-way driving at
http://www.swov.nl/rapport/Factsheets/UK/FS_Wrong_way_driving.pdf, accessed September 5, 2012;
(b) Information sheet no. 36 from the Japanese Institute for Traffic Accident Research and Data Analysis at
http://www.itarda.or.jp/itardainfomation/english/info36/36top.html, accessed November 26, 2012; and
(c) M. Tatsumi and T. Adachi, “Countermeasures Against Traffic Accidents By Wrong-Way Driving,” paper
number TP027-1, Proceedings of the 17th ITS World Congress (Busan, South Korea: 2010). 49
Many research reports provide similar conclusions. One example is S. A. Cooner, A. S. Cothron, and
S. E. Ranft, Countermeasures for Wrong-Way Movement on Freeways: Overview of Project Activities and Findings,
FHWA/TX-04/4128-1 (College Station, TX: Texas Transportation Institute, 2004). 50
A. C. Braam, Statewide Study of Wrong Way Crashes on Freeways in North Carolina (Raleigh, NC: North
Carolina Department of Transportation, 2006). 51
NTSB analysis of FARS data for 2004–2009 found 233 wrong-way drivers age 70 or older out of the 1,566
total wrong-way drivers; this is 14.8 percent of the wrong-way drivers. 52
(a) C. V. Gay, Wrong-Way Driving Incidents on Limited Access Divided Highways (Sacramento, CA:
California Department of Public Works, Division of Highways, 1963). (b) T. N. Tamburri and D. J. Theobald, 1965.
(c) N. K. Vaswani, 1973.
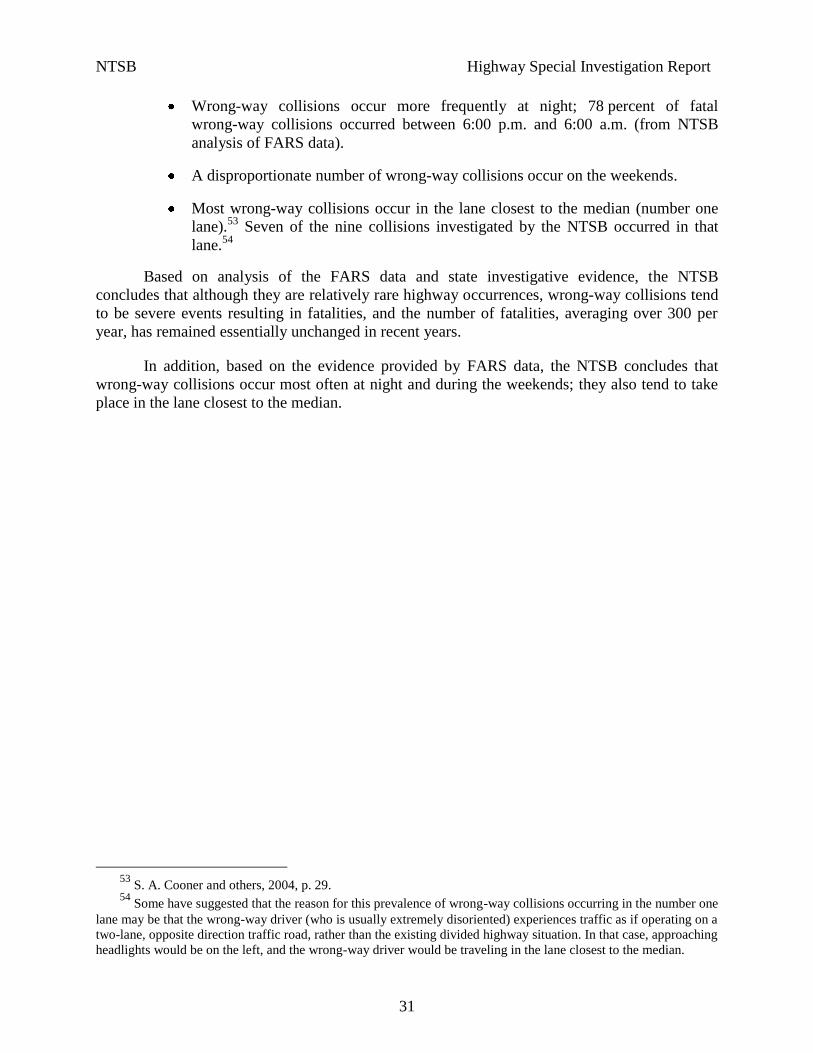
NTSB Highway Special Investigation Report
31
Wrong-way collisions occur more frequently at night; 78 percent of fatal
wrong-way collisions occurred between 6:00 p.m. and 6:00 a.m. (from NTSB
analysis of FARS data).
A disproportionate number of wrong-way collisions occur on the weekends.
Most wrong-way collisions occur in the lane closest to the median (number one
lane).53
Seven of the nine collisions investigated by the NTSB occurred in that
lane.54
Based on analysis of the FARS data and state investigative evidence, the NTSB
concludes that although they are relatively rare highway occurrences, wrong-way collisions tend
to be severe events resulting in fatalities, and the number of fatalities, averaging over 300 per
year, has remained essentially unchanged in recent years.
In addition, based on the evidence provided by FARS data, the NTSB concludes that
wrong-way collisions occur most often at night and during the weekends; they also tend to take
place in the lane closest to the median.
53
S. A. Cooner and others, 2004, p. 29. 54
Some have suggested that the reason for this prevalence of wrong-way collisions occurring in the number one
lane may be that the wrong-way driver (who is usually extremely disoriented) experiences traffic as if operating on a
two-lane, opposite direction traffic road, rather than the existing divided highway situation. In that case, approaching
headlights would be on the left, and the wrong-way driver would be traveling in the lane closest to the median.
NTSB Highway Special Investigation Report
32
4. Countermeasures
This section addresses countermeasures to wrong-way driving targeted to the driver,
highway traffic control devices and infrastructure, and vehicle safety systems.
4.1 Driver
4.1.1 Alcohol Impairment
Investigators identified driver impairment by alcohol as a leading factor in wrong-way
driving collisions. Seven of the nine wrong-way drivers in the NTSB investigations covered in
this report had BACs of 0.15 or higher. NTSB analysis of FARS data for 2004–2009 found that
of the 1,566 wrong-way drivers in fatal crashes, 60 percent (936 drivers) were classified as
drinking.55
Of the 1,150 wrong-way drivers involved in fatal collisions with known BAC
results,56
about 59 percent (684 drivers) had high BAC levels—at or above 0.15. By contrast, of
all drivers involved in fatal crashes on US public roads during the same time period, about
22 percent had BACs reported at or above 0.15.
State research consistently points to alcohol impairment as a major cause of wrong-way
driving. Approximately 52 percent of the wrong-way drivers in California from 2005 through
2009 were DWI.57
In Texas, 61 percent of wrong-way drivers involved in 323 wrong-way
collisions from 1997 to 2000 were driving under the influence of alcohol and/or drugs.58
According to a study conducted from 2005 to 2009 in Michigan, 60 percent of wrong-way
drivers in the state were under the influence of alcohol or drugs.59
A study performed in the early
1970s by Purdue University found that 54.6 percent of wrong-way collisions on divided
highways involved a driver impaired by alcohol.60
A review of wrong-way collisions that
occurred in Virginia from January 1978 to May 1980 indicated that 72 percent of drivers
traveling in the wrong direction had been drinking.61
Alcohol was found to be a major
contributing factor in fatal wrong-way collisions on controlled-access highways in New Mexico
from 1990 to 2004;62
about 63 percent of the wrong-way drivers had a BAC above the legal
limit.63
The NTSB concludes that driving while impaired by alcohol is the primary cause of
55
A driver is classified as drinking if there is positive BAC data or police-reported alcohol involvement. 56
No BAC was reported for about 27 percent of wrong-way drivers involved in fatal wrong-way collisions. 57
Wrong-Way Collision Statistics (2005–2009), Wrong-Way Monitoring Program Memorandum, California
Department of Transportation, March 25, 2011. 58
S. A. Cooner and others, 2004.
59 D. A. Morena and T. J. Leix, 2012.
60 P. N. Scifres and R. C. Loutzenheiser, Wrong-Way Movements on Divided Highways, Technical Paper
FHWA/IN/JHRP-75/13, Joint Highway Research Project (West Lafayette, IN: Indiana Department of Transportation
and Purdue University, 1975). 61
N. K. Vaswani, 1973. 62
The BAC limit in New Mexico decreased from 0.10 to 0.08 in January 1994. 63
S. L. Lathrop and others, “Fatal Wrong-Way Collisions on New Mexico’s Interstate Highways (1990–
2004),” Journal of Forensic Sciences, vol. 55, no. 2 (March 2010).
NTSB Highway Special Investigation Report
33
wrong-way driving collisions; more than 60 percent of wrong-way collisions are caused by
drivers impaired by alcohol.
Fatal motor vehicle accidents have steadily declined over the past decade, but the number
of fatal wrong-way collisions has remained essentially unchanged, averaging about 360 lives lost
per year in about 260 fatal wrong-way collisions. Moreover, although the total number of
highway deaths has fallen, the percentage of deaths caused by drivers impaired by alcohol has
remained unchanged over the past decade. In 2010, a total of 10,228 people died in accidents
involving drivers impaired by alcohol, accounting for 31 percent of all motor vehicle traffic
fatalities in the United States.64
In 2000, a total of 12,892 people died in accidents involving
drivers impaired by alcohol, accounting for 31 percent of all motor vehicle traffic fatalities.65
The
NTSB concludes that alcohol impairment continues to be present in about one-third of all fatal
highway accidents, resulting in more than 10,000 deaths per year. The NTSB further concludes
that new countermeasures to alcohol-impaired driving, as well as renewed emphasis at the
federal, state, and local level, are needed.
The NTSB has issued more than 120 safety recommendations addressing impaired
driving since 1968, and the issue area “Eliminate Substance-Impaired Driving” is currently an
advocacy priority on the NTSB’s Most Wanted List. In 2000, the NTSB issued its most recent
report on alcohol-impaired driving, focusing on a subset of drinking drivers referred to as “hard
core drinking drivers.”66
Recognizing that more work is needed to eliminate substance-impaired driving, in
May 2012, the NTSB held a forum to identify the most effective, scientifically based actions
needed to “reach zero” accidents resulting from substance-impaired driving. Numerous impaired
driving countermeasures were discussed at the forum, including laws, enforcement strategies,
adjudication programs, substance treatment programs, alcohol detection technologies, and
educational campaigns. Presenters discussed the merits and drawbacks of various
countermeasures, as well as the challenges to reducing impaired driving. As an outcome of the
forum, the NTSB began an initiative focusing on alcohol-impaired driving countermeasures.
Alcohol Ignition Interlock Devices. A review of FARS data for 2004–2009 showed that
drivers with previous impaired driving convictions were overrepresented in fatal wrong-way
collisions. Specifically, 9 percent of wrong-way drivers had been convicted of DWI within the
3 years previous to the wrong-way collision, which was nearly three times higher than a matched
control group of drivers.67
In two of the nine wrong-way driving investigations completed by the
NTSB, the drivers were identified as repeat offenders with at least one prior DWI conviction.
64
Per NHTSA publication DOT HS 811 606, total fatalities for 2010 were 32,885. 65
Alcohol Involvement in Fatal Crashes 2000, DOT HS 809 419 (Washington, DC: National Center for
Statistics and Analysis, National Highway Traffic Safety Administration, March 2002). [Note: In 2000, BAC laws
set 0.10 as the legal limit, compared to 0.08 in 2010.] 66
Actions to Reduce Fatalities, Injuries, and Crashes Involving the Hard Core Drinking Driver, Safety Report
NTSB/SR-00/01 (Washington, DC: National Transportation Safety Board, 2000). 67
Drivers of vehicles struck by wrong-way drivers offer a random sample of comparable drivers (similar in
time of day, type of road, etc.). These “partner” drivers had a previous DWI conviction rate of 3.2 percent.
NTSB Highway Special Investigation Report
34
Repeat offenders have long been recognized as a significant safety risk. In 2010,
alcohol-impaired drivers in fatal crashes were four times more likely to have a prior conviction
for DWI than non-alcohol-impaired drivers.68
For drivers who persist in driving after drinking
following a DWI conviction, vehicle-based systems that render vehicles inoperable by drivers
who have consumed alcohol may be the most effective approach to avoid DWI recurrence and
associated accidents.
An alcohol ignition interlock is a device that is connected to the ignition circuit of a
vehicle and prevents the engine from starting until a breath sample has been provided, analyzed
for ethanol content, and determined to be lower than prescribed limits. Many systems require
additional breath samples at intervals during the driving task (running retests). In the United
States, ignition interlocks have historically been viewed as a sanction for repeat or high-BAC
offenders;69
however, in recent years, the movement has been toward mandating ignition
interlocks for first-time offenders. Additionally, automakers have begun to develop interlock
systems for passenger vehicles.70
In Europe, commercial truck and bus operators have
voluntarily adopted such systems as a means of complying with company alcohol policies.71
Research evaluation of ignition interlock programs over the last two decades has found
that ignition interlock devices are effective in reducing recidivism among DWI offenders.72
Most
studies have not found continued reduced recidivism after the device has been removed;
however, one study that randomly assigned offenders either to an interlock or to a control
program found a 36 percent reduction in recidivism for the 2-year period after the interlocks
were removed.73
A recent study examined the effectiveness of laws that require alcohol interlock
installations for first-time offenders as well as repeat or high-BAC offenders; it found an
68
DOT HS 811 606. 69
For example, in 2000, the NTSB recommended such systems, among other countermeasures, for “hard core
drinking drivers,” a population defined as including both repeat and high-BAC offenders (Safety
Recommendation H-00-26). 70
R. Jurnecka, “Nissan developing built in breathalyzer system,” Motor Trend blogpost, July 24, 2007, see
http://blogs.motortrend.com/nissan-developing-builtin-breathalyzer-system-929.html and
http://green.autoblog.com/2007/09/03/volvos-fuel-cell-alcoguard-breathalyzer-says-blow-5-seconds, both accessed
September 27, 2012. 71
European Transport Safety Council, “Drink Driving: Towards Zero Tolerance,”
http://www.etsc.eu/documents/Drink_Driving_Towards_Zero_Tolerance.pdf, accessed September 27, 2012. 72
(a) C. Willis, S. Lybrand, and N. Bellamy, “Alcohol Ignition Interlock Programs for Reducing Drink Driving
Recidivism (Review),” The Cochrane Database of Systematic Reviews, issue 1, 2009. (b) A. S. Tippetts and
R. B. Voas, “The Effectiveness of the West Virginia Interlock Program,” Journal of Traffic Medicine, vol. 26
(1998), pp. 19–24. (c) L. Vezina, “The Quebec Alcohol Interlock Program: Impact on Recidivism and Crashes.” In
D. R. Mayhew and C. Dussault (eds.), Alcohol, Drugs and Traffic Safety–T2002, Proceedings of the 16th
International Conference on Alcohol, Drugs and Traffic Safety, Montreal, August 4–9, 2002 (Quebec, Canada:
Societé de l’Assurance Automobile du Quebec, 2002), pp. 97–104. (d) J. H. Coben and G. L. Larkin, “Effectiveness
of Ignition Interlock Devices in Reducing Drunk Driving Recidivism,” American Journal of Preventive Medicine,
vol. 16 (1999), pp. 81–87. 73
K. H. Beck and others, “Effects of Ignition Interlock License Restrictions on Drivers With Multiple Alcohol
Offenses: A Randomized Trial in Maryland,” American Journal of Public Health, vol. 89, no. 11, (1999), pp. 1696–
1700.
NTSB Highway Special Investigation Report
35
additional benefit in reducing repeat DWI offenses.74
Similarly, according to one estimate, if all
drivers with at least one alcohol-impaired driving conviction within the 3 years prior to the
accident used zero-BAC interlock devices, approximately 1,100 deaths could have been
prevented in 1 year.75
The NTSB concludes that the installation of alcohol ignition interlocks on
the vehicles of all DWI offenders would reduce accidents caused by alcohol-impaired drivers.
A 2009 NHTSA report provides information about strategies that policymakers and
safety advocates may use to maximize the likelihood that individuals who are ordered to install
interlocks comply with the law.76
Strategies found to be likely to increase compliance include
establishing an offender monitoring program, funding the installation of ignition interlock
systems when necessary, and presenting the ignition interlock as an alternative to a more
restrictive penalty, such as house arrest or transdermal monitoring.77
All states have some form of interlock program for DWI offenders.78
However, as of
November 2012, only 17 states (and four California counties) required mandatory interlock
installation for all DWI first offenders.79
The Moving Ahead for Progress in the 21st Century Act
(MAP-21), enacted in 2012, directs the DOT to award special grants to states that adopt and
implement laws requiring ignition interlocks for all DWI offenders. As a result, states that do not
currently have all-offender interlock mandates now have an added incentive to enact such laws.
Neither the Commonwealth of Puerto Rico nor the District of Columbia requires mandatory
interlock installation for all DWI offenders. Therefore, the NTSB recommends that the
Commonwealth of Puerto Rico, the District of Columbia, and the 33 states that do not currently
require the use of alcohol ignition interlock devices for all individuals convicted of DWI offenses
enact such laws.
New In-Vehicle Alcohol Detection Technologies. Although ignition interlocks are an
effective countermeasure to address convicted DWI offenders, most fatal accidents caused by
alcohol-impaired drivers involve drivers with no prior DWI convictions. A passive safety device
would be particularly beneficial when dealing with such drivers.
Active safety approaches require an individual to take action. An example of an active
safety approach is the seat belt; drivers must secure their belts each time they get into the vehicle
74
A. T. McCartt and others, Washington State’s Alcohol Ignition Interlock Law: Effects on Recidivism Among
First DUI Offenders (Arlington, VA: Insurance Institute for Highway Safety, 2012). 75
A. K. Lund and others, “Contribution of Alcohol-Impaired Driving to Motor Vehicle Crash Deaths in 2005,”
8th
Ignition Interlock Symposium, Seattle, Washington (2007). 76
K. Sprattler, Ignition Interlocks–What You Need to Know: A Toolkit for Policymakers, Highway Safety
Professionals, and Advocates, DOT HS 811 246 (Washington, DC: National Highway Traffic Safety
Administration, 2009). 77
Transdermal monitoring refers to testing for alcohol that is excreted through the skin; such monitoring is
typically accomplished by means of a bracelet or anklet. 78
Based on a review of Governors Highway Safety Association information. 79
The states that do not have such mandatory interlock installation laws are Alabama, California, Delaware,
Florida, Georgia, Idaho, Indiana, Iowa, Kentucky, Maine, Maryland, Massachusetts, Michigan, Minnesota,
Mississippi, Montana, Nevada, New Hampshire, New Jersey, North Carolina, North Dakota, Ohio, Oklahoma,
Pennsylvania, Rhode Island, South Carolina, South Dakota, Tennessee, Texas, Vermont, West Virginia, Wisconsin,
and Wyoming.

NTSB Highway Special Investigation Report
36
for the device to be effective. Passive safety devices are generally provided by system design;
they are put in place and go into effect without the individual having to activate them—for
example, air bags are a passive safety device. The success of active safety approaches requires
broad public acceptance and motivation on the part of the traveling public; passive approaches,
however, once widely circulated, take effect without any need for individual decision-making
each time used. As such, passive safety approaches have a more certain safety outcome.
Some auto manufacturers are researching and developing in-vehicle alcohol detection
devices as a passive safety measure aimed at preventing alcohol-impaired drivers from operating
their vehicles. Such systems would identify alcohol without requiring any action on the part of
the driver. If the system detects alcohol above the legal limit, it prevents the vehicle from
starting.
Researchers and auto manufacturers recognize that, to be acceptable to the broader
driving public, in-vehicle alcohol detection technologies must be unobtrusive, reliable, and
durable; must require only minimal maintenance; and must not interfere with the driving task.80
In February 2008, thirteen motor vehicle manufacturers affiliated with the Automotive Coalition
for Traffic Safety, Inc. (ACTS), entered into a 5-year cooperative agreement with NHTSA to
explore the feasibility, potential benefits, and public policy challenges associated with
widespread use of in-vehicle technology for preventing alcohol-impaired driving. A promising
technology, the Driver Alcohol Detection System for Safety (DADSS), is being developed under
this agreement.
The multistage DADSS program includes developing working prototypes for two types
of sensor-based systems—one based on breath and one based on touch (phase I). The
breath-based system is being developed by Autoliv, a Swedish maker of automobile safety
systems; the system will use multiple sensors to measure the alcohol content of the driver’s
exhaled breath inside the vehicle. The touch-based device, developed by Takata, a Japanese
supplier of auto safety systems, and New Mexico-based TruTouch Technologies, will use tissue
spectroscopy for estimating a driver’s BAC from the skin’s infrared light absorption.81
Phase I has been completed. Phase II involves installing the technology in a
demonstration vehicle by mid-2013. Congress has recognized the value of this approach to
alcohol-impaired driving, and MAP-21 provides funding for research and development of
DADSS phase II.82
A workable driver alcohol detection system must be fast, accurate, precise, and suitable
for the driving environment. Moreover, it must be capable of distinguishing between the
vehicle’s driver and any passengers. To meet these requirements, DADSS is being vigorously
80
S. A. Ferguson and others, “Driver Alcohol Detection System for Safety (DADSS)―A Non-Regulatory
Approach in the Development and Deployment of Vehicle Safety Technology to Reduce Alcohol-Impaired
Driving,” Paper 09-0464, 21st International Technical Conference on the Enhanced Safety of Vehicles, Stuttgart,
Germany (2009). 81
“Tough Criteria in Race to Build New Interlock,” Insurance Institute for Highway Safety, Status Report,
vol. 46, no. 10 (November 17, 2011). 82
See Section 31103 of MAP-21, amending 23 U.S.C. § 403(h), which in general provides funding for
in-vehicle alcohol detection device research.
NTSB Highway Special Investigation Report
37
tested to ensure that it can withstand wide variations in temperature, vibration, humidity, dust,
and electromagnetic radiation. The NTSB recognizes the many hurdles that DADSS must
overcome before widespread fleet deployment is viable. To ensure system performance and
driver trust in the system, extensive testing is necessary. Integration of DADSS, as optional
equipment, into new vehicles is not anticipated until well after 2020.83
The NTSB encourages
NHTSA and its automotive partners to look for ways to accelerate progress without
compromising the criteria for practical system development.
In addition to solving the technical and engineering challenges of DADSS, usability
aspects, driver education, and public policy issues will have to be addressed. The DADSS
program has held focus groups to begin to survey driver opinions about the technology. The
NTSB applauds the effort and encourages NHTSA and its program partners to identify the
elements necessary to understand driver preferences and concerns and to promote public
acceptance of this important safety system. The NTSB concludes that the DADSS program is
working to solve both technical and practical challenges to make it an acceptable alcohol
detection system for widespread implementation in the US vehicle fleet. The NTSB recommends
that NHTSA and ACTS work together to accelerate widespread implementation of DADSS
technology by (1) defining usability testing that will guide driver interface design and
(2) implementing a communication program that will direct driver education and promote public
acceptance.
4.1.2 Older Drivers
The NTSB’s FARS analysis determined that drivers over the age of 70 are
over-represented in fatal wrong-way crashes. Figure 4 in section 1 of this report shows the ages
of wrong-way drivers involved in fatal collisions (2004–2009) and, as a comparative sample,
looks at right-way drivers who were involved in those collisions. The bar chart shows that
right-way drivers over the age of 70 represent less than 3 percent of all right-way drivers
involved in fatal wrong-way collisions, while wrong-way drivers over the age of 70 account for
about 15 percent of the wrong-way drivers involved in such collisions.
States have had similar research results. A study of wrong-way collisions in Texas
conducted from 1997 to 2000 found that drivers over the age of 65 had a higher involvement in
wrong-way collisions (almost 13 percent) compared to other types of accidents.84
Similarly, a
North Carolina study found that drivers age 65 and older were over-represented in wrong-way
collisions, with 17 percent of wrong-way collisions on controlled-access highways from 2000 to
2005 involving an older driver, compared to 5 percent for all controlled-access highway
crashes.85
A 2011 wrong-way driving collision in Carlisle, Pennsylvania, occurred when an
87-year-old woman traveled the wrong direction on an exit ramp and then attempted a significant
83
“Ambitious Drunk Driving Prevention Research Program Moves Forward,” DADSS press release,
November 1, 2011. See http://www.dadss.org, accessed September 12, 2012. 84
S. A. Cooner and others, 2004. 85
A. C. Braam, 2006.
NTSB Highway Special Investigation Report
38
turn maneuver to rectify her error. During the turn, the elderly woman was involved in a collision
with a truck-tractor semitrailer.
The loss of functional abilities through normal aging is well documented. Because people
age differently, chronological age alone is a poor indicator of a driver’s functional status.
However, across the population, steady declines in visual acuity and contrast sensitivity,
attention and perceptual processes, and memory and cognition are reliably associated with
advancing age. Even without considering the accelerating rates of disease and pathology—and,
of particular concern to driving, dementia—that are evidenced in older persons, at some point,
most older persons are likely to experience an impairing condition serious enough to
significantly elevate their risk of accident.86
In a 2004 special investigation, the NTSB examined the medical oversight of
noncommercial drivers and concluded that many medical conditions are associated with
increased driving risk and are incompatible with the unrestricted operation of motor vehicles.87
Researchers who estimate the increased risk of accidents for medically high-risk drivers have
recommended that licensing authorities place greater emphasis on neurological and episodic
conditions that result in a higher risk of accidents or that affect a greater number of drivers.88
Driver licensing processes, medical evaluations, and State Medical Review Boards are designed,
to varying degrees, to address the issue of medically at-risk drivers.
Older drivers are an expanding demographic group, and the trend shows that they are
retaining their driver’s licenses longer. By 2025, about 20 percent of the driving population will
be age 65 or older.89
In 2009, about 84 percent of the population over the age of 70 had a driver’s
license. This compares to 74 percent of those age 70 and older who had licenses in 2000, and
66 percent in 1990. NHTSA has developed a proposed guideline on older drivers to address this
growing segment of the driver population.90
NHTSA’s Highway Safety Program Guideline
No. 13—Older Driver Safety would encourage each state, in cooperation with its political
subdivisions and other stakeholders, to include a comprehensive approach to older driver safety
in its highway safety program, with the intention of reducing older driver accidents, fatalities,
and injuries. The proposed guideline recommends that states include the following elements in
their highway safety programs: driver licensing and medical review of at-risk drivers, education
for the medical and law enforcement community, and roadway design for older driver safety.
With the implementation of MAP-21 on October 1, 2012, NHTSA and the FHWA are
86
Model Driver Screening and Evaluation Program: Guidelines for Motor Vehicle Administrators,
DOT HS 809 581 (Washington, DC: National Highway Traffic Safety Administration, 2003). 87
NTSB/SIR-04/01. 88
(a) T. D. Koepsell and others, “Medical Conditions and Motor Vehicle Collision Injuries in Older Adults,”
Journal of the American Geriatric Society, vol. 42, no. 7 (1994), pp. 695–700. (b) G. McGwin and others,
“Relations Among Chronic Medical Conditions, Medications, and Automobile Crashes in the Elderly:
A Population-Based Case-Control Study,” American Journal of Epidemiology, vol. 152, no. 5 (2000), pp. 424–431.
(c) C. Owsley, G. McGwin, and K. Ball, “Vision Impairment, Eye Disease, and Injurious Motor Vehicle Crashes in
the Elderly,” Ophthalmic Epidemiology, vol. 5, no. 2 (1998), pp. 101–113. 89
I. Cheung and A. T. McCartt, Declines in Fatal Crashes of Older Drivers: Changes in Crash Risk and
Survivability (Arlington, VA: Insurance Institute for Highway Safety, 2010). 90
See Amendments to Highway Safety Program Guidelines, docket number NHTSA-2012-0081, Federal
Register, vol. 77, no. 119 (June 20, 2012).
NTSB Highway Special Investigation Report
39
developing related guidance for the states. Based on this guidance, states are encouraged to
address driver licensing and medical review of at-risk drivers, medical and law enforcement
personnel education, and collaboration with social services and transportation service providers.
Safety provisions in MAP-21 call for states to coordinate their highway safety plans with
the Strategic Highway Safety Plan (SHSP) funded through the FHWA. Specifically, MAP-21
directs states to determine if fatalities and serious injuries per capita for road users over age 65
increase during a 2-year period;91
if so, states must include strategies in subsequent SHSPs based
on consideration of aging driver handbook recommendations.92
The NTSB concludes, given that
older drivers are over-represented in wrong-way collisions, efforts are needed to reduce the
involvement of older drivers in wrong-way collisions. The NTSB recommends that NHTSA
work with the FHWA to (1) identify efforts to reduce the involvement of older drivers in
wrong-way collisions and (2) publish the findings in a report that includes consideration of SHSP
countermeasures that have been effective. The NTSB further recommends that the 50 states, the
Commonwealth of Puerto Rico, and the District of Columbia develop comprehensive highway
safety programs for older drivers that incorporate, at a minimum, the program elements outlined
in NHTSA Highway Safety Program Guideline No. 13—Older Driver Safety.
4.1.3 Drug Impairment
The previous sections have discussed alcohol-impaired drivers and drivers over age 70
with some degree of certainty—two groups that can be reliably identified based on BAC testing
and police records of driver age. The data concerning drug involvement in wrong-way collisions
are neither so clear nor so available. Drivers impaired by alcohol and older drivers have a higher
likelihood of drug use than the general population, albeit for very different reasons. This section
discusses drug involvement in wrong-way collisions based on a correlation of these two driving
groups to higher use of drugs rather than on direct association to the cause of wrong-way
collisions. Because (1) driver testing for use of drugs—whether illicit, prescribed, or
over-the-counter—occurs less frequently than testing for use of alcohol, (2) laws and practices
for drug testing vary by state, and (3) the degree of impairment differs for different drugs and
doses, the NTSB does not have sufficient data to constitute a full understanding of drivers
impaired by drugs. However, the wrong-way collision picture would be incomplete if drug use
by wrong-way drivers were not raised.
Data compiled by NHTSA from FARS indicate that 63 percent of the 21,798 drivers who
died in motor vehicle crashes in 2009 were tested for drugs.93
According to NHTSA, from 2005
through 2009, the proportion of drivers killed in crashes who tested positive for drugs (illicit,
prescription, and over-the-counter) rose from 13 to 18 percent over that 5-year period.94
The
types of drugs recorded in FARS include illicit drugs, legally prescribed drugs, and
91
Title 23 U.S.C. §148(g)(2), as added by Section 1112 of MAP-21. 92
See Highway Design Handbook for Older Drivers and Pedestrians, FHWA-RD-01-103 (Washington, DC:
Federal Highway Administration, 2001). 93
Drug Involvement of Fatally Injured Drivers, Traffic Safety Facts, DOT HS 811 415 (Washington, DC:
National Highway Traffic Safety Administration, 2010). 94
Ibid. The 3,952 fatally injured drivers who tested positive for drugs in 2009 represent one-third of the fatally
injured drivers tested and for whom results were known.
NTSB Highway Special Investigation Report
40
over-the-counter medicines. Medications that have known effects on the central nervous system;
blood sugar levels; blood pressure; and perceptual functions, such as vision, have the potential to
interfere with driving skills.95
Adverse drug events leading to hospitalization are more common among older adults,
reflecting their increased use of prescription medications, as well as the differences in the way
that older people may metabolize medications. The Centers for Disease Control and Prevention
analysis of drug use data for 2007–2008 found that 76 percent of Americans age 60 and over
used two or more prescription drugs in the past month; 88 percent used at least one.96
Older
people are more likely to take drugs, and they are more likely to take more than one drug.97
The
side effects of normal doses of drugs that are particularly relevant to older drivers include
dizziness, drowsiness, tremors, rigidity, confusion, hypoglycemia, hypotension, and blurred
vision.98
Some states have enacted per se laws to make it illegal to operate a motor vehicle if there
is any detectable level of a prohibited drug or its metabolites in the driver’s blood. Other states
have established laws that define “drugged driving” as driving when a drug renders a driver
incapable of driving safely or causes a driver to be impaired.99
A recent NHTSA project
conducted by the Pacific Institute for Research and Evaluation could not determine whether
per se drug laws had an effect on arrests or conviction patterns because states were not able to
provide comprehensive driver arrest or conviction data.100
The NTSB concludes that available
data are inadequate to determine the extent of drug involvement in wrong-way driving. To
improve the availability of such data, in a recent safety recommendation letter concerning
alcohol-impaired driving, the NTSB issued the following safety recommendation to NHTSA:
Develop and disseminate to appropriate state officials a common standard of practice for
drug toxicology testing, including (1) the circumstances under which tests should be
conducted, (2) a minimum set of drugs for which to test, and (3) cutoff values for
reporting the results. (H-12-33)
Implementation of this recommendation will assist in determining the extent of the drugged
driver problem, which is a prerequisite for developing means of addressing it effectively.
95
A. A. LeRoy, D. Pharm, and M. L. Morse, Multiple Medications and Vehicle Crashes: Analysis of
Databases, DOT HS 810 858 (Washington, DC: National Highway Traffic Safety Administration, 2008). 96
“Prescription Drug Use Continues to Increase: US Prescription Drug Data for 2007–2008,” National Center
for Health Statistics Data Brief No. 42, September 2010. See http://www.cdc.gov/nchs/data/databriefs/db42.pdf,
accessed October 26, 2012. 97
D. Loughran, S. Seabury, and L. Zakaras, What Risk Do Older Drivers Pose to Traffic Safety? (Santa
Monica, CA: Rand Institute for Civil Justice, 2007). 98
“Older Commercial Drivers: Do They Pose a Safety Risk?,” CTBSSP Synthesis 18 (Washington, DC:
Transportation Research Board, 2010). 99
DrugFacts: Drugged Driving, National Institute on Drug Abuse, December 2010. See
http://www.drugabuse.gov/publications/drugfacts/drugged-driving, accessed September 12, 2012. 100
Drug Per Se Laws: A Review of Their Use in the States, NHTSA Traffic Tech No. 393 (Washington, DC:
National Highway Traffic Safety Administration, September 2010). See
www.nhtsa.gov/staticfiles/traffic_tech/tt393.pdf, accessed September 12, 2012.
NTSB Highway Special Investigation Report
41
4.2 Highways
For many decades, it has been known that the most common initiating event for
wrong-way movements on controlled-access highways is entering the mainline traffic lanes via
an exit ramp.101
The investigations conducted by the NTSB associated with this report confirmed
that erroneous entry onto exit ramps frequently caused wrong-way events. Some highway
designs are more likely to be problematic or to confuse drivers, resulting in wrong-way
movements. Monitoring of wrong-way collisions can help identify problematic designs and
indicate which locations are more likely to have wrong-way movements.
This section discusses highway signage and traffic control devices that are designed to
direct motorists onto controlled-access highway entrance ramps and discourage wrong-way
movement onto exit ramps. Factors of interest include the following: poor visibility due to road
geometrics;102
inadequate traffic control treatments to guide motorists at interchanges and lack of
“positive” signing techniques;103
and absence of artificial lighting, particularly during the hours
of darkness.
Many state and local jurisdictions have, over the years, undertaken initiatives to monitor
problematic intersections. This section also discusses wrong-way movement monitoring and
possible intervention actions by law enforcement personnel.
4.2.1 Signage and Pavement Markings
The FHWA’s MUTCD sets the national standard for the use of traffic signs, signals,
markings, and other devices. Traffic control devices and information about their use are
categorized within the MUTCD as follows: “Standards,” “Guidance,” “Options,” or “Support.”
The category of Standards concerns items that are mandatory and required (MUTCD language
concerning Standards typically states that they “shall” be used, etc.); the category of Guidance
addresses recommended practices; the category of Options addresses permissible conditions
(MUTCD language states that they “may” be used, etc.); and the category of Support provides
informational context. The different MUTCD categories for traffic control devices reflect a need
to set driver expectations based on a consistent depiction of such devices (i.e., all stop signs must
look alike) as well as a recognition of the many traffic situations that require the application of
engineering judgment due to unique configurations of roadways or traffic patterns.
The MUTCD requires exit ramps that intersect with a crossroad to be equipped, at a
minimum, with a single “One Way” sign (R6-1) visible to motorists traveling in each direction of
travel on the crossroad, a single “Do Not Enter” sign (R5-1) mounted on the right side of a ramp
101
C. V. Gay, 1963. 102
N. K. Vaswani, Poor Visibility, A Common Cause of Wrong-Way Driving, VHTRC 76-R14 (Charlottesville,
VA: Virginia Highway and Transportation Research Council, 1975). 103
N. K. Vaswani, 1973.
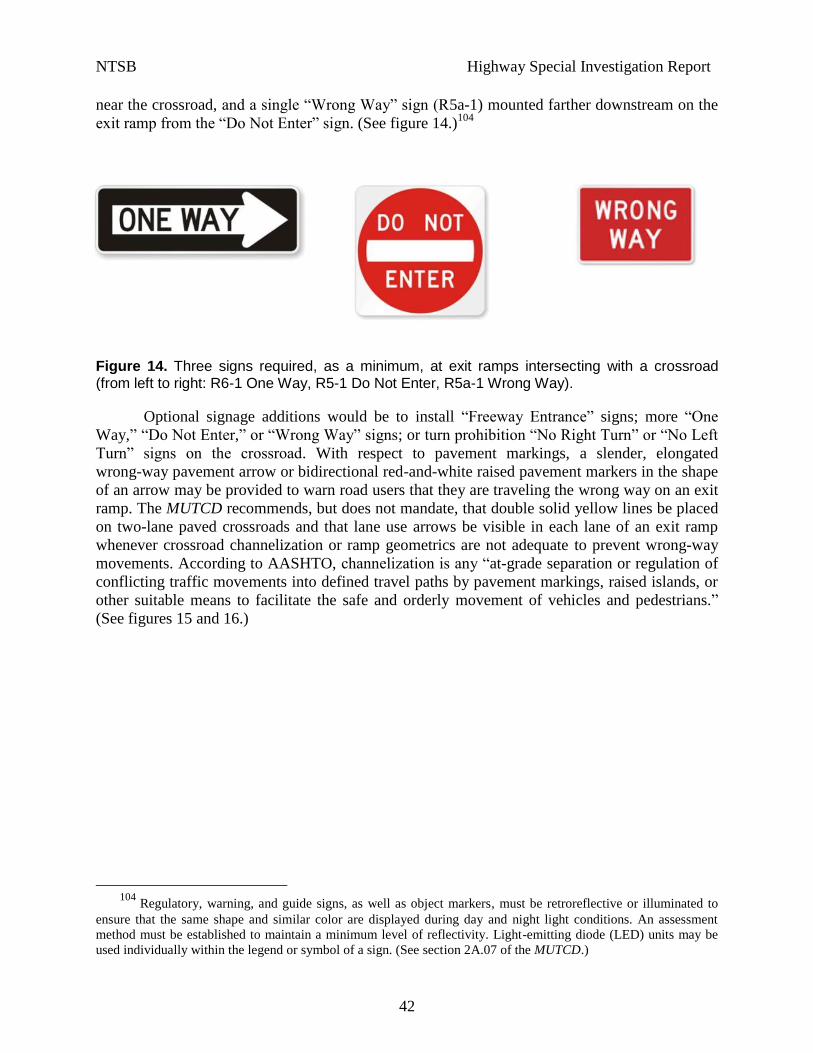
NTSB Highway Special Investigation Report
42
near the crossroad, and a single “Wrong Way” sign (R5a-1) mounted farther downstream on the
exit ramp from the “Do Not Enter” sign. (See figure 14.)104
Figure 14. Three signs required, as a minimum, at exit ramps intersecting with a crossroad (from left to right: R6-1 One Way, R5-1 Do Not Enter, R5a-1 Wrong Way).
Optional signage additions would be to install “Freeway Entrance” signs; more “One
Way,” “Do Not Enter,” or “Wrong Way” signs; or turn prohibition “No Right Turn” or “No Left
Turn” signs on the crossroad. With respect to pavement markings, a slender, elongated
wrong-way pavement arrow or bidirectional red-and-white raised pavement markers in the shape
of an arrow may be provided to warn road users that they are traveling the wrong way on an exit
ramp. The MUTCD recommends, but does not mandate, that double solid yellow lines be placed
on two-lane paved crossroads and that lane use arrows be visible in each lane of an exit ramp
whenever crossroad channelization or ramp geometrics are not adequate to prevent wrong-way
movements. According to AASHTO, channelization is any “at-grade separation or regulation of
conflicting traffic movements into defined travel paths by pavement markings, raised islands, or
other suitable means to facilitate the safe and orderly movement of vehicles and pedestrians.”
(See figures 15 and 16.)
104
Regulatory, warning, and guide signs, as well as object markers, must be retroreflective or illuminated to
ensure that the same shape and similar color are displayed during day and night light conditions. An assessment
method must be established to maintain a minimum level of reflectivity. Light-emitting diode (LED) units may be
used individually within the legend or symbol of a sign. (See section 2A.07 of the MUTCD.)
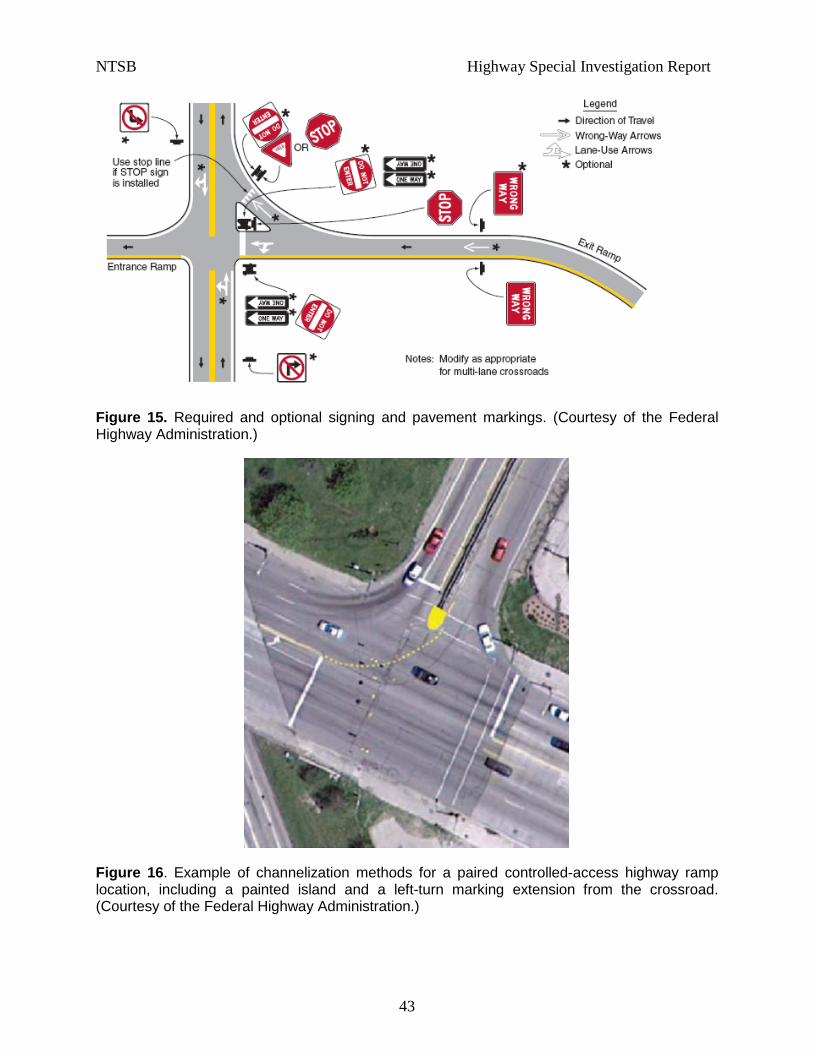
NTSB Highway Special Investigation Report
43
Figure 15. Required and optional signing and pavement markings. (Courtesy of the Federal Highway Administration.)
Figure 16. Example of channelization methods for a paired controlled-access highway ramp location, including a painted island and a left-turn marking extension from the crossroad. (Courtesy of the Federal Highway Administration.)
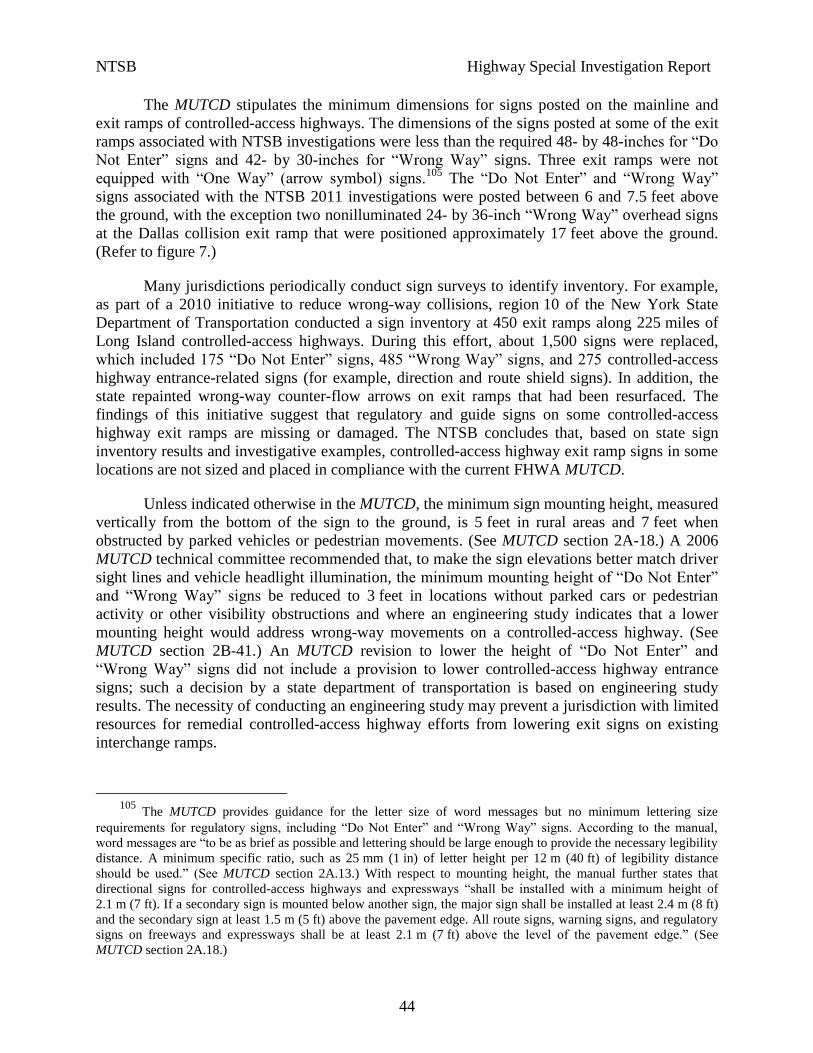
NTSB Highway Special Investigation Report
44
The MUTCD stipulates the minimum dimensions for signs posted on the mainline and
exit ramps of controlled-access highways. The dimensions of the signs posted at some of the exit
ramps associated with NTSB investigations were less than the required 48- by 48-inches for “Do
Not Enter” signs and 42- by 30-inches for “Wrong Way” signs. Three exit ramps were not
equipped with “One Way” (arrow symbol) signs.105
The “Do Not Enter” and “Wrong Way”
signs associated with the NTSB 2011 investigations were posted between 6 and 7.5 feet above
the ground, with the exception two nonilluminated 24- by 36-inch “Wrong Way” overhead signs
at the Dallas collision exit ramp that were positioned approximately 17 feet above the ground.
(Refer to figure 7.)
Many jurisdictions periodically conduct sign surveys to identify inventory. For example,
as part of a 2010 initiative to reduce wrong-way collisions, region 10 of the New York State
Department of Transportation conducted a sign inventory at 450 exit ramps along 225 miles of
Long Island controlled-access highways. During this effort, about 1,500 signs were replaced,
which included 175 “Do Not Enter” signs, 485 “Wrong Way” signs, and 275 controlled-access
highway entrance-related signs (for example, direction and route shield signs). In addition, the
state repainted wrong-way counter-flow arrows on exit ramps that had been resurfaced. The
findings of this initiative suggest that regulatory and guide signs on some controlled-access
highway exit ramps are missing or damaged. The NTSB concludes that, based on state sign
inventory results and investigative examples, controlled-access highway exit ramp signs in some
locations are not sized and placed in compliance with the current FHWA MUTCD.
Unless indicated otherwise in the MUTCD, the minimum sign mounting height, measured
vertically from the bottom of the sign to the ground, is 5 feet in rural areas and 7 feet when
obstructed by parked vehicles or pedestrian movements. (See MUTCD section 2A-18.) A 2006
MUTCD technical committee recommended that, to make the sign elevations better match driver
sight lines and vehicle headlight illumination, the minimum mounting height of “Do Not Enter”
and “Wrong Way” signs be reduced to 3 feet in locations without parked cars or pedestrian
activity or other visibility obstructions and where an engineering study indicates that a lower
mounting height would address wrong-way movements on a controlled-access highway. (See
MUTCD section 2B-41.) An MUTCD revision to lower the height of “Do Not Enter” and
“Wrong Way” signs did not include a provision to lower controlled-access highway entrance
signs; such a decision by a state department of transportation is based on engineering study
results. The necessity of conducting an engineering study may prevent a jurisdiction with limited
resources for remedial controlled-access highway efforts from lowering exit signs on existing
interchange ramps.
105
The MUTCD provides guidance for the letter size of word messages but no minimum lettering size
requirements for regulatory signs, including “Do Not Enter” and “Wrong Way” signs. According to the manual,
word messages are “to be as brief as possible and lettering should be large enough to provide the necessary legibility
distance. A minimum specific ratio, such as 25 mm (1 in) of letter height per 12 m (40 ft) of legibility distance
should be used.” (See MUTCD section 2A.13.) With respect to mounting height, the manual further states that
directional signs for controlled-access highways and expressways “shall be installed with a minimum height of
2.1 m (7 ft). If a secondary sign is mounted below another sign, the major sign shall be installed at least 2.4 m (8 ft)
and the secondary sign at least 1.5 m (5 ft) above the pavement edge. All route signs, warning signs, and regulatory
signs on freeways and expressways shall be at least 2.1 m (7 ft) above the level of the pavement edge.” (See
MUTCD section 2A.18.)
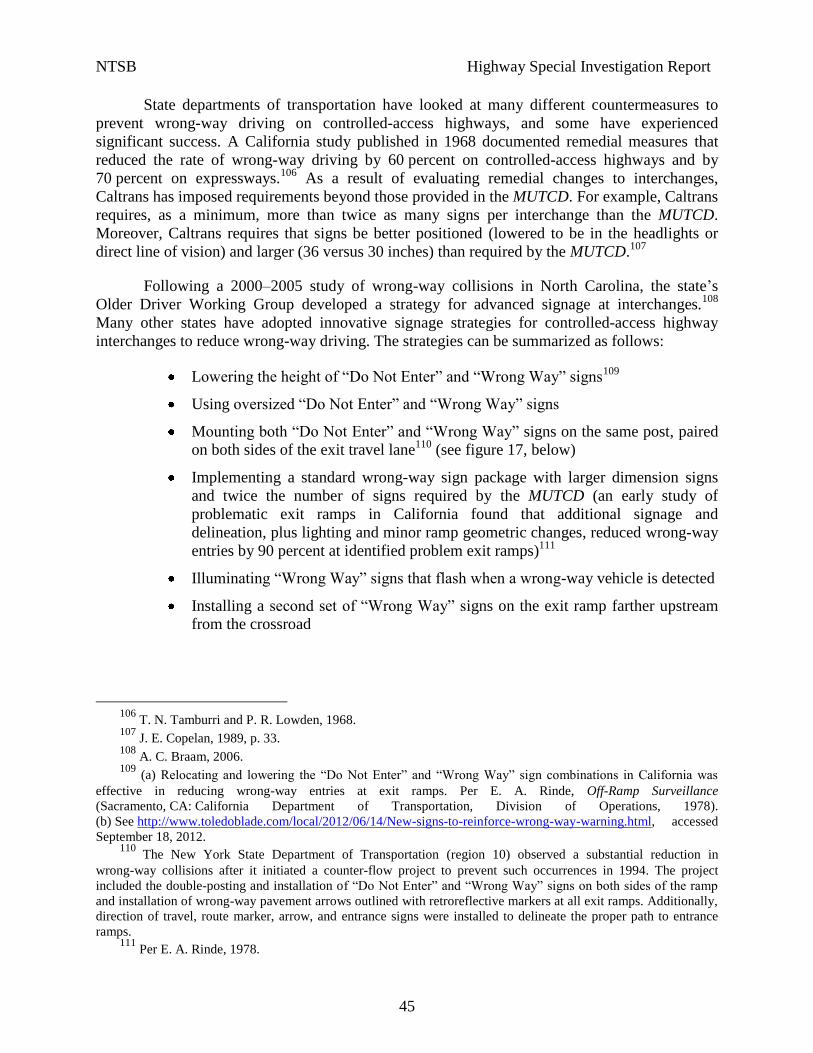
NTSB Highway Special Investigation Report
45
State departments of transportation have looked at many different countermeasures to
prevent wrong-way driving on controlled-access highways, and some have experienced
significant success. A California study published in 1968 documented remedial measures that
reduced the rate of wrong-way driving by 60 percent on controlled-access highways and by
70 percent on expressways.106
As a result of evaluating remedial changes to interchanges,
Caltrans has imposed requirements beyond those provided in the MUTCD. For example, Caltrans
requires, as a minimum, more than twice as many signs per interchange than the MUTCD.
Moreover, Caltrans requires that signs be better positioned (lowered to be in the headlights or
direct line of vision) and larger (36 versus 30 inches) than required by the MUTCD.107
Following a 2000–2005 study of wrong-way collisions in North Carolina, the state’s
Older Driver Working Group developed a strategy for advanced signage at interchanges.108
Many other states have adopted innovative signage strategies for controlled-access highway
interchanges to reduce wrong-way driving. The strategies can be summarized as follows:
Lowering the height of “Do Not Enter” and “Wrong Way” signs109
Using oversized “Do Not Enter” and “Wrong Way” signs
Mounting both “Do Not Enter” and “Wrong Way” signs on the same post, paired
on both sides of the exit travel lane110
(see figure 17, below)
Implementing a standard wrong-way sign package with larger dimension signs
and twice the number of signs required by the MUTCD (an early study of
problematic exit ramps in California found that additional signage and
delineation, plus lighting and minor ramp geometric changes, reduced wrong-way
entries by 90 percent at identified problem exit ramps)111
Illuminating “Wrong Way” signs that flash when a wrong-way vehicle is detected
Installing a second set of “Wrong Way” signs on the exit ramp farther upstream
from the crossroad
106
T. N. Tamburri and P. R. Lowden, 1968. 107
J. E. Copelan, 1989, p. 33. 108
A. C. Braam, 2006. 109
(a) Relocating and lowering the “Do Not Enter” and “Wrong Way” sign combinations in California was
effective in reducing wrong-way entries at exit ramps. Per E. A. Rinde, Off-Ramp Surveillance
(Sacramento, CA: California Department of Transportation, Division of Operations, 1978).
(b) See http://www.toledoblade.com/local/2012/06/14/New-signs-to-reinforce-wrong-way-warning.html, accessed
September 18, 2012. 110
The New York State Department of Transportation (region 10) observed a substantial reduction in
wrong-way collisions after it initiated a counter-flow project to prevent such occurrences in 1994. The project
included the double-posting and installation of “Do Not Enter” and “Wrong Way” signs on both sides of the ramp
and installation of wrong-way pavement arrows outlined with retroreflective markers at all exit ramps. Additionally,
direction of travel, route marker, arrow, and entrance signs were installed to delineate the proper path to entrance
ramps. 111
Per E. A. Rinde, 1978.
NTSB Highway Special Investigation Report
46
Posting controlled-access highway entrance signs on each side of entrance
ramps112
Applying red retroreflective tape to the vertical posts of exit ramp signs
Installing red delineators on each side of exit ramps
Installing LED-illuminated in-pavement markers or delineators parallel with the
stop bar at the crossroad end of exit ramps
Installing trailblazing lines or reflective markers that channel travel in an arc to
guide motorists making a left turn from the crossroad into an entrance ramp, to
keep them from inadvertently entering an exit ramp113
Figure 17. Double-posted “Do Not Enter” and “Wrong Way” signs on an exit ramp. (Courtesy of the New York State Department of Transportation).
Because the vast majority of wrong-way movements occur when a driver mistakenly
enters an exit ramp, keeping drivers from entering exit ramps would prevent most wrong-way
movements. Enabling motorists to clearly distinguish between entrance and exit ramps is critical
to preventing wrong-way entry. Better signage could help differentiate between entrance and exit
ramps. Signage efforts should include establishing minimum lettering size and optimum
dimension, placement, and mounting height.
Lighting is another important consideration. For signage to be visible at night, lighting
must be adequate. Controlled-access highway lighting system configurations include continuous
and partial interchange lighting. Lighting may be placed in the merging traffic and gore areas,
along ramps, by loops, on the roadway through interchanges, and in various other locations.
112
The MUTCD makes it optional to install a freeway entrance sign (D13-3) or a freeway entrance with
downward pointing diagonal arrow sign (D13-3a) near the crossroad to guide road users to an expressway or
freeway entrance ramp. (See section 2D-46 of the MUTCD.) The FHWA Highway Design Handbook for Older
Drivers and Pedestrians recommends the consistent use of 48- by 30-inch guide sign panels with the legend
“Freeway Entrance,” using a minimum letter height of 8 inches for positive guidance. 113
D. A. Morena and T. J. Leix, 2012.
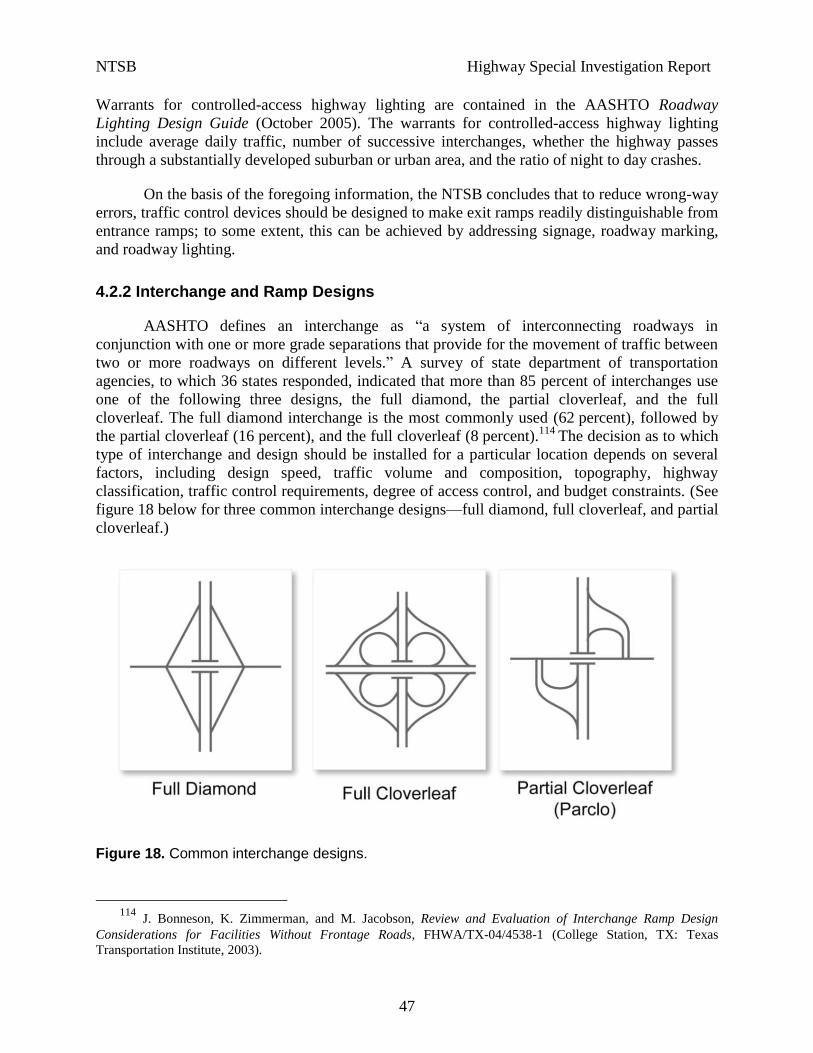
NTSB Highway Special Investigation Report
47
Warrants for controlled-access highway lighting are contained in the AASHTO Roadway
Lighting Design Guide (October 2005). The warrants for controlled-access highway lighting
include average daily traffic, number of successive interchanges, whether the highway passes
through a substantially developed suburban or urban area, and the ratio of night to day crashes.
On the basis of the foregoing information, the NTSB concludes that to reduce wrong-way
errors, traffic control devices should be designed to make exit ramps readily distinguishable from
entrance ramps; to some extent, this can be achieved by addressing signage, roadway marking,
and roadway lighting.
4.2.2 Interchange and Ramp Designs
AASHTO defines an interchange as “a system of interconnecting roadways in
conjunction with one or more grade separations that provide for the movement of traffic between
two or more roadways on different levels.” A survey of state department of transportation
agencies, to which 36 states responded, indicated that more than 85 percent of interchanges use
one of the following three designs, the full diamond, the partial cloverleaf, and the full
cloverleaf. The full diamond interchange is the most commonly used (62 percent), followed by
the partial cloverleaf (16 percent), and the full cloverleaf (8 percent).114
The decision as to which
type of interchange and design should be installed for a particular location depends on several
factors, including design speed, traffic volume and composition, topography, highway
classification, traffic control requirements, degree of access control, and budget constraints. (See
figure 18 below for three common interchange designs—full diamond, full cloverleaf, and partial
cloverleaf.)
Figure 18. Common interchange designs.
114
J. Bonneson, K. Zimmerman, and M. Jacobson, Review and Evaluation of Interchange Ramp Design
Considerations for Facilities Without Frontage Roads, FHWA/TX-04/4538-1 (College Station, TX: Texas
Transportation Institute, 2003).
NTSB Highway Special Investigation Report
48
Full diamond and partial cloverleaf designs have entrance and exit ramps that meet the
crossroad at grade at a nearly perpendicular angle. Cloverleaf entrance and exit ramps have
shallow diverging angles. State research concerning wrong-way driving over the past four
decades has examined interchange design elements and their implications for wrong-way
movement and made the following determinations:
Full, four-quadrant cloverleaf ramps have the lowest wrong-way entry rate, and
left-hand exit ramps have the highest.115
Partial interchanges have twice the wrong-way entry rate of full interchanges.116
Partial interchange designs have been associated with wrong-way driving.117
High rates of wrong-way entry occur at incomplete interchanges and loop exit
ramps with crossroad terminals adjacent to the entrance ramp.118
Exit ramps that terminate at two-way streets have high wrong-way entry rates.119
Interchanges with short sight distances at their decision points have a
disproportionate number of wrong-way movements, and wrong-way collisions
occur more often in urban than rural areas.120
Exit ramps with rounded corners tend to encourage rather than deter wrong-way
movements.121
(Because rounded corners provide less of a distinction between the
roadway and the ramp than sharp corners, they may mislead drivers into
continuing along their current path of travel so that they mistakenly enter the exit
ramp.)
Wrong-way movement countermeasures are typically implemented by state departments
of transportation. Signing, marking improvements, and lighting are relatively low-cost
countermeasures that can be implemented quickly and inexpensively. Geometric changes and
infrastructure redesigns, however, require engineering analysis, planning, and additional
resources. Consequently, such design changes are often difficult to accomplish, although limited
design modifications, such as traffic channelization, are often feasible.
Changes to ramp geometrics may include requiring exit ramps on partial interchanges to
intersect with crossroads at an obtuse rather than a 90-degree angle, using sharp rather than
115
A. Lew, Final Report on Wrong-Way Driving (Phase III): Driver Characteristics, Effectiveness of Remedial
Measures, and Effect of Ramp Type (Sacramento, CA: California Division of Highways, 1971). 116
T. N. Tamburri and P. R. Lowden, 1968. 117
(a) D. A. Morena and T. J. Leix, 2012. (b) S. Moler, “Stop. You’re Going the Wrong Way!,” Public Roads,
vol. 66, no. 2, Federal Highway Administration (2002). (c) E. A. Rinde, 1978. (d) C. L. Richard, Analysis of Wrong
Way Incidents on Michigan Freeways, HRR 279 (Lansing, MI: Michigan Department of State Highways, 1969).
(e) N. K. Vaswani, 1973. 118
P. S. Parsonson and J. R. Marks, Wrong-Way Traffic Movements on Freeway Ramps, GDOT Research
Project Number 7703, Final Report (Atlanta, GA: Georgia Department of Transportation, 1979). 119
T. N. Tamburri and P. R. Lowden, 1968. 120
J. E. Copelan, 1989. 121
N. K. Vaswani, 1973.
NTSB Highway Special Investigation Report
49
rounded corner radii at the opening of exit ramps to discourage wrong-way entry, and preventing
local roads from connecting with exit ramps. Channelization may be accomplished by installing
nontraversable medians (except at turn points) on undivided crossroads for preventing wrong-
way entry at interchanges or curb-return designs to discourage left turns into exit ramps. States
have also found that eliminating two-way frontage roads and modifying exit ramps using curbs
and islands to reduce the opening width can reduce the occurrence of wrong-way movements.122
The NTSB concludes that interchange design can influence the likelihood of wrong-way
incursions, and states have experience with design changes that have proven effective in
reducing wrong-way movements.
Research sponsored by AASHTO resulted in volume 20 of NCHRP Report 500.123
This
guide provides strategies that can be used to reduce head-on crashes on controlled-access
highways.124
The guide focuses predominantly on median crossover accidents but contains
limited guidance to address head-on crashes resulting from wrong-way travel. The guide
identifies strategy 18.2 B4—“Implement Channelization, Signing and Striping Improvements at
Interchanges Susceptible to Wrong-Way Movements.” The guide contains no “proven” methods
for the strategy, but it lists some as “tried” and others as “experimental.”
Since the 1960s, state departments of transportation have been making roadside safety
enhancements to interchanges to discourage wrong-way entry. Caltrans developed an 11-page
checklist for evaluating interchanges suspected of having a high concentration of wrong-way
collisions. The checklist prompts users to confirm the presence of the minimum required number
of signs and pavement markings and to indicate if left turn movements from the crossroad to
access exit ramps are confusing or if channelization is required to discourage wrong-way entries.
The checklist also contains options for resolving wrong-way entry problems and diagrams that
illustrate where signs should be located on various interchanges. The Texas Department of
Transportation developed a four-step wrong-way entry analysis procedure based on
modifications to the California checklist for use by its engineers and field crews. NCHRP 500,
volume 20, appendix 5, contains a checklist produced by the Texas Transportation Institute
based on one originally developed by Caltrans.
The NTSB concludes that individual state efforts have identified effective wrong-way
driving countermeasures, but there is limited federal guidance for the use of proven strategies to
prevent wrong-way driving. Therefore, the NTSB recommends that the FHWA develop an
assessment tool that the states can use to select appropriate countermeasures for problematic
controlled-access highway locations that is based on a review of (1) state research concerning
wrong-way driving and (2) countermeasures found to be effective by the states in reducing the
instances of wrong-way driving. Further, the NTSB recommends that the FHWA develop and
distribute to the states a manual they can use as a resource document when implementing
122
C. J. Messer, J. D. Friebele, and C. L. Dudek, A Qualitative Analysis of Wrong-Way Driving in Texas,
Preliminary Research Report Number 139-6 (College Station, TX: Texas Transportation Institute, 1971). 123
A Guide for Reducing Head-On Crashes on Freeways, NCHRP Report 500, vol. 20 (Washington, DC:
Transportation Research Board, 2008). NCHRP Project 17-18(3) is developing a series of guides to assist state and
local agencies in reducing injuries and fatalities in targeted areas. Volume 20 of NCHRP Report 500 addresses
goal 18, reducing head-on across-median crashes. 124
Volume 4 of NCHRP Report 500 is A Guide for Addressing Head-On Collisions; it focuses on rural roads,
undivided two lane roads, and intersections.
NTSB Highway Special Investigation Report
50
strategies and countermeasures to reduce the instances of drivers traveling the wrong way on
divided highways. At a minimum, such a manual should provide solutions that would (1) prevent
drivers from entering an access ramp that would allow them to travel in the wrong direction on a
divided highway, (2) alert drivers to their error should they enter a ramp while traveling in the
wrong direction, (3) allow drivers to correct for traveling in the wrong direction while on an
access ramp, and (4) alert drivers to their error if they are traveling the wrong way on a divided
highway. In addition, the NTSB recommends that the FHWA revise the MUTCD as required to
address issues of signage and channelization to reduce instances of, and warn drivers of,
wrong-way movements. The NTSB further recommends that AASHTO revise A Policy on
Geometric Design of Highways and Streets as required to address issues of ramp design and
pavement channelization in ways that will reduce instances of drivers traveling in the wrong
direction as they enter access ramps.
4.2.3 Wrong-Way Monitoring Programs
States must overcome several challenges before taking strategic measures to reduce
wrong-way collisions on controlled-access highways. For example, the readily accessible
quantity and quality of wrong-way collision data are generally limited;125
technical expertise and
advanced tools, such as a geographic information system (GIS), for accurately plotting and
analyzing data may be limited at the local level; and the support necessary to justify the resource
expenditure for taking a proactive approach to prevent wrong-way collisions may not be
available. However, periodic review of wrong-way collisions would provide an objective
measure of whether countermeasures are warranted.
Some states have undertaken projects to monitor wrong-way drivers on controlled-access
highways. California and Georgia used wrong-way counter and camera units in the 1970s; and
from 1986 to 1996, Washington State evaluated the use of induction loops and digital video
cameras as well as electromagnetic sensors embedded in the pavement at an exit ramp.126
In
1985, California established a wrong-way monitoring program to obtain information on the
location, severity, time of day, direction of travel, and driver sobriety for wrong-way
collisions.127
This continuing program periodically queries California accident data to identify
concentrations of wrong-way collisions; conducts investigations in the vicinity of wrong-way
collisions and ramps suspected of causing wrong-way entries; and, if warranted, makes changes
in roadway geometry, channelization, and other features.128
The Arizona Department of
Transportation received a grant in 2010 to evaluate camera and sensor technology for preventing
wrong-way movements.129
Detection hardware was installed in October 2008 at 14 wrong-way sites in Houston,
Texas, and various other locations along a 10-mile section of the tollway mainline that
125
The accident reporting forms used by law enforcement agencies may not indicate whether the accident was
a wrong-way collision, may not provide an accurate location of the wrong-way event, and may fail to identify the
wrong-way entry point or how a vehicle began to travel the wrong direction on a controlled-access highway. 126
(a) E. A. Rinde, 1978. (b) P. S. Parsonson and J. R. Marks, 1979. (c) S. Moler, 2002. 127
J. E. Copelan, 1989. 128
Telephone conversation between NTSB investigator and Caltrans representative, March 13, 2012. 129
See http://rip.trb.org/browse/dproject.asp?n=26107, accessed September 18, 2012.
NTSB Highway Special Investigation Report
51
communicates via a fiber-optic network and is monitored in real time 24 hours a day, 7 days a
week, at the Harris County Toll Road Authority Incident Management Center.130
The North
Texas Tollway Authority formed a wrong-way driver task force in June 2009 to study a rise in
wrong-way driving collisions on the Dallas North Tollway. The task force recommended
conducting a pilot test of a wrong-way detection and alerter system using reliable technology in
smart inductive loops on North Texas Tollway Authority network infrastructure as well as
studying video detection systems.131
In 2012, automated systems with embedded pavement
sensors for detecting wrong-way movements on exit ramps and cameras to permit traffic
command center monitoring of wrong-way vehicles on the mainline were installed along
15 miles of US 281 in San Antonio, Texas.132
Police-reported accident data are usually the guiding indicators of whether a location has
an unusual concentration of wrong-way collisions. The FHWA Highway Safety Improvement
Program (HSIP) includes a project to monitor wrong-way collisions and identify locations with
concentrations of wrong-way collisions on controlled-access highways. It includes a wrong-way
study warrant based on total collision and fatal collision rates. The minimum collision criteria are
a total wrong-way collision rate of 0.5 for an event of any severity per mile per year and a
minimum of three wrong-way collisions for a 5-year period, or a fatal wrong-way collision rate
of 0.12 per mile per year and a minimum of three wrong-way collisions for a 5-year period.133
The NTSB concludes that wrong-way monitoring programs provide an effective means of
identifying wrong-way collision trends. Therefore, the NTSB recommends that the FHWA
develop a HSIP policy memorandum for use by state department of transportation agencies to
establish wrong-way monitoring programs.
4.2.4 Law Enforcement Intervention Practices
When a wrong-way driver is reported, law enforcement options for intervention are
limited and often dangerous to the police officers responding and to other drivers on the
controlled-access highway. Where possible, roadway command centers may use variable
message signs to warn other motorists of a wrong-way driver while notifying law enforcement
agencies. Stopping methods available to respond to wrong-way vehicle events are similar to
those used in police pursuits; law enforcement options for events on controlled-access highways
include the following: driving parallel with the wrong-way vehicle while traveling in the
130
“Wrong Way Detection System Prevents Accidents, Improves Safety,” ITS International May/June 2010.
See http://www.itsinternational.com/sections/cost-benefit-analysis/features/wrong-way-detection-system-prevents-
accidents-improves-safety/, accessed November 28, 2012. 131
Keeping NTTA Roadways Safe: Wrong-Way Driver Task Force Staff Analysis, North Texas Tollway
Authority (September 23, 2009). 132
The San Antonio Wrong Way Driver Initiative is a coordinated effort by the FHWA, Texas Department of
Transportation, Texas Transportation Institute, city of San Antonio Public Works Department, San Antonio Police
Department, and Bexar County Sheriff’s Office for preventing wrong-way collisions along a portion of US 281 by
documenting all reported wrong-way movements, identifying high-risk locations, using sensors and cameras for
detecting wrong-way entries at 32 ramps, monitoring the movement of wrong-way vehicles, using dynamic message
signs to warn right-way motorists of wrong-way vehicles, and taking a strategic approach using portable stop-sticks
to prevent wrong-way collisions. 133
See http://www.ce.siue.edu/faculty/hzhou/ww/HSIP-CH-4-2008.pdf, accessed September 18, 2012. This
metric of a wrong-way criteria warrant was used earlier by the state of California.
NTSB Highway Special Investigation Report
52
opposite lane (with the flow of traffic) and attempting to gain the driver’s attention with
emergency lights, siren, and spotlights; deploying tire deflation or entangler stopping systems;
conducting a traffic break to reduce the closing speed; using a patrol car to serve as a stationary
or moving roadblock; employing patrol car contact to execute a pursuit intervention technique
maneuver;134
or pinning a wrong-way vehicle against a continuous median barrier.135
These
methods are dangerous and may result in accidents involving the police officers and other
motorists on the roadway, as well as the wrong-way driver. The NTSB therefore concludes that
most of the methods available to stop a wrong-way vehicle involve a high degree of risk and may
put law enforcement officers and other motorists in jeopardy. Therefore, the NTSB recommends
that the International Association of Chiefs of Police and the National Sheriffs’ Association work
together to develop a best practices document to provide guidance to law enforcement officers
summoned to respond to a wrong-way movement on a divided highway.
4.3 Wrong-Way Navigation Alerts on Vehicles
Progress is being made on in-vehicle technology to warn of wrong-way movements.
Nissan Motor Company has partnered with West Nippon Expressway Company to develop a
Wrong-Way Alert Program. A new computer application and detailed map data in the vehicle’s
navigation system, combined with global positioning system (GPS) data, provide drivers with
audio and visual warnings when the system detects that the vehicle is going the wrong way at
controlled-access highway ramps or interchanges. The program was available in the 2011 Fuga
hybrid sold in Japan and will be available on other models in the future.
In May 2011, Toyota announced that it would begin offering an optional Wrong-Way
Alert System on vehicles sold in Japan to provide drivers with an on-screen warning and voice
alert when the vehicle is traveling against the flow of traffic. Toyota has indicated that it will be
offering the system in the future in the United States. The Toyota system was made possible by
advances in communications-based map-updating technology and by pinpoint
position-recognition technology that obtains information from GPS, gyro-sensors that identify
vehicle direction, and other sensors for determining accurate vehicle movement.136
In 2007, BMW developed a prototype driver assistance system that used the vehicle’s
navigation system to identify when a driver is about to inadvertently travel in the wrong
direction. With this prototype system, when a wrong-way movement is detected, the driver is
alerted by audible and visual indications on the vehicle instrument cluster or heads-up display.137
134
A pursuit intervention technique maneuver uses the front corner of a patrol car to contact but not ram the rear corner of a fleeing vehicle to cause it to rotate and become immobilized long enough to apprehend the violator.
135 S. Ashley, “Reducing the Risks of Police Pursuit, Journal of the Police Policy Studies Council (2004).
136 “Wrong-Way Drivers Get Some Help from Toyota,” Inside Line, May 31, 2011. See
http://www.insideline.com/toyota/wrong-way-drivers-get-some-help-from-toyota.html, accessed May 14, 2012. 137
“Wrong-Way Driver Information: Advance Warning of Drivers Heading in the Wrong Direction,” BMW
Group Research and Technology, Media Information, November 2007.
NTSB Highway Special Investigation Report
53
The project is currently inactive, although BMW is considering the possible development of a
wrong-way driver assistance system and reactivation of the demonstration vehicle.138
Mobileye Traffic Sign Recognition (TSR) has been available since 2008 on BMW 7
series vehicles as a vision and satellite navigation fusion system. The technology was developed
as a support for drivers to help them maintain vehicle speed within the posted legal limit and
obey local traffic instructions. TSR systems recognize and interpret various fixed roadside traffic
signs and overhead variable LED signs using vision-only information; therefore, the systems
may not recognize signs obscured by other vehicles or objects. The Mobileye TSR algorithm and
camera-based object recognition are currently capable of detecting targets within a lateral
distance of approximately 33 feet and a vertical distance of 23 feet at vehicle speeds up to
155 mph; the system could be enhanced by incorporating it with digital map data from a
navigation system.139
Available navigation systems can recognize when a motor vehicle is entering an exit
ramp on a controlled-access divided highway. Drivers who use GPS navigation systems are
accustomed to the system “recalculating” when they make an off-route maneuver. For situations
involving wrong-way traffic movement, GPS systems could inform the driver of a turn into
oncoming traffic. Although this information concerning driver error would be useful in all cases,
informing drivers of entry into an interchange exit ramp would constitute one of the simplest use
cases. The direction of travel on ramps is not subject to change as is the case with urban streets,
and, in most instances, exit ramps do not have opposite directions of travel located on the same
road segment. The NTSB concludes that providing navigation system alerts that inform drivers
of wrong-way movements onto controlled-access highway exit ramps before they reach mainline
traffic could enhance safety.
GPS providers currently develop proprietary routable data networks. GPS providers must
develop user interface messaging and standards for providing navigation alerts. For example,
manufacturers will need to provide system override features that allow for wrong-way travel
during construction. Also, many drivers rely on a hand-held GPS instead of, or in addition to,
in-vehicle navigation systems. The NTSB concludes that for wrong-way navigation alert systems
to be reliable and effective, GPS providers must follow consistent human factors policies in
messaging and alerting.
To ensure that original equipment automotive GPS manufacturers, aftermarket
automotive GPS manufacturers, and hand-held GPS device manufacturers follow consistent
messaging that is intuitively understood to be a warning, an industry group, such as the SAE
International’s Safety and Human Factors Steering Committee, should develop standards for
GPS alerts. Therefore, the NTSB recommends that SAE International work with the Alliance of
Automobile Manufacturers, Global Automakers, and the Consumer Electronics Association, as
well as other major GPS industry representatives and stakeholders, to develop standards for GPS
wrong-way navigation alerts. The NTSB also recommends that the Alliance of Automobile
Manufacturers, Global Automakers, and the Consumer Electronics Association inform their
138
NTSB investigator’s telephone conversation with a representative of Safety Engineering & Intelligent
Transportation Systems, BMW of North America LLC, on December 8, 2011. 139
See http://www.mobileye.com/technology/applications/traffic-sign-detection/, accessed September 19, 2012.

NTSB Highway Special Investigation Report
54
members of the benefits of incorporating wrong-way navigation alerts into GPS navigation
systems.
NTSB Highway Special Investigation Report
55
5. Conclusions
5.1 Findings
1. Although they are relatively rare highway occurrences, wrong-way collisions tend to be
severe events resulting in fatalities, and the number of fatalities, averaging over 300 per
year, has remained essentially unchanged in recent years.
2. Wrong-way collisions occur most often at night and during the weekends; they also tend
to take place in the lane closest to the median.
3. Driving while impaired by alcohol is the primary cause of wrong-way driving collisions;
more than 60 percent of wrong-way collisions are caused by drivers impaired by alcohol.
4. Alcohol impairment continues to be present in about one-third of all fatal highway
accidents, resulting in more than 10,000 deaths per year.
5. New countermeasures to alcohol-impaired driving, as well as renewed emphasis at the
federal, state, and local level, are needed.
6. The installation of alcohol ignition interlocks on the vehicles of all driving while
intoxicated (DWI) offenders would reduce accidents caused by alcohol-impaired drivers.
7. The Driver Alcohol Detection System for Safety (DADSS) program is working to solve
both technical and practical challenges to make it an acceptable alcohol detection system
for widespread implementation in the US vehicle fleet.
8. Given that older drivers are over-represented in wrong-way collisions, efforts are needed
to reduce the involvement of older drivers in wrong-way collisions.
9. Available data are inadequate to determine the extent of drug involvement in wrong-way
driving.
10. Based on state sign inventory results and investigative examples, controlled-access
highway exit ramp signs in some locations are not sized and placed in compliance with
the current Federal Highway Administration Manual on Uniform Traffic Control
Devices.
11. To reduce wrong-way errors, traffic control devices should be designed to make exit
ramps readily distinguishable from entrance ramps; to some extent, this can be achieved
by addressing signage, roadway marking, and roadway lighting.
12. Interchange design can influence the likelihood of wrong-way incursions, and states have
experience with design changes that have proven effective in reducing wrong-way
movements.
NTSB Highway Special Investigation Report
56
13. Individual state efforts have identified effective wrong-way driving countermeasures, but
there is limited federal guidance for the use of proven strategies to prevent wrong-way
driving.
14. Wrong-way monitoring programs provide an effective means of identifying wrong-way
collision trends.
15. Most of the methods available to stop a wrong-way vehicle involve a high degree of risk
and may put law enforcement officers and other motorists in jeopardy.
16. Providing navigation system alerts that inform drivers of wrong-way movements onto
controlled-access highway exit ramps before they reach mainline traffic could enhance
safety.
17. For wrong-way navigation alert systems to be reliable and effective, global positioning
system (GPS) providers must follow consistent human factors policies in messaging and
alerting.
NTSB Highway Special Investigation Report
57
6. Recommendations
As a result of this special investigation, the National Transportation Safety Board makes
the following safety recommendations:
To the Federal Highway Administration:
Work with the National Highway Traffic Safety Administration to (1) identify
efforts to reduce the involvement of older drivers in wrong-way collisions and
(2) publish the findings in a report that includes consideration of Strategic
Highway Safety Plan countermeasures that have been effective. (H-12-38)
Develop an assessment tool that the states can use to select appropriate
countermeasures for problematic controlled-access highway locations that is
based on a review of (1) state research concerning wrong-way driving and
(2) countermeasures found to be effective by the states in reducing the
instances of wrong-way driving. (H-12-39)
Develop and distribute to the states a manual they can use as a resource
document when implementing strategies and countermeasures to reduce the
instances of drivers traveling the wrong way on divided highways. At a
minimum, such a manual should provide solutions that would (1) prevent
drivers from entering an access ramp that would allow them to travel in the
wrong direction on a divided highway, (2) alert drivers to their error should
they enter a ramp while traveling in the wrong direction, (3) allow drivers to
correct for traveling in the wrong direction while on an access ramp, and
(4) alert drivers to their error if they are traveling the wrong way on a divided
highway. (H-12-40)
Revise the Manual on Uniform Traffic Control Devices as required to address
issues of signage and channelization to reduce instances of, and warn drivers
of, wrong-way movements. (H-12-41)
Develop a Highway Safety Improvement Program policy memorandum for
use by state department of transportation agencies to establish wrong-way
monitoring programs. (H-12-42)
To the National Highway Traffic Safety Administration:
Work with the Automotive Coalition for Traffic Safety, Inc., to accelerate
widespread implementation of Driver Alcohol Detection System for Safety
(DADSS) technology by (1) defining usability testing that will guide driver
interface design and (2) implementing a communication program that will
direct driver education and promote public acceptance. (H-12-43)
NTSB Highway Special Investigation Report
58
Work with the Federal Highway Administration to (1) identify efforts to
reduce the involvement of older drivers in wrong-way collisions and
(2) publish the findings in a report that includes consideration of Strategic
Highway Safety Plan countermeasures that have been effective. (H-12-44)
To the 33 states that do not mandate the use of alcohol ignition interlock devices for
all driving while intoxicated (DWI) offenders, the Commonwealth of Puerto Rico,
and the District of Columbia:
Enact laws to require the use of alcohol ignition interlock devices for all
individuals convicted of driving while intoxicated (DWI) offenses. (H-12-45)
To the 50 states, the Commonwealth of Puerto Rico, and the District of Columbia:
Develop a comprehensive highway safety program for older drivers that
incorporates, at a minimum, the program elements outlined in National
Highway Traffic Safety Administration Highway Safety Program Guideline
No. 13—Older Driver Safety. (H-12-46)
To the American Association of State Highway and Transportation Officials:
Revise A Policy on Geometric Design of Highways and Streets as required to
address issues of ramp design and pavement channelization in ways that will
reduce instances of drivers traveling in the wrong direction as they enter
access ramps. (H-12-47)
To the Automotive Coalition for Traffic Safety, Inc.:
Work with the National Highway Traffic Safety Administration to accelerate
widespread implementation of Driver Alcohol Detection System for Safety
(DADSS) technology by (1) defining usability testing that will guide driver
interface design and (2) implementing a communication program that will
direct driver education and promote public acceptance. (H-12-48)
To the International Association of Chiefs of Police:
Work with the National Sheriffs’ Association to develop a best practices
document to provide guidance to law enforcement officers summoned to
respond to a wrong-way movement on a divided highway. (H-12-49)
To the National Sheriffs’ Association:
Work with the International Association of Chiefs of Police to develop a best
practices document to provide guidance to law enforcement officers
summoned to respond to a wrong-way movement on a divided highway.
(H-12-50)
NTSB Highway Special Investigation Report
59
To SAE International:
Work with the Alliance of Automobile Manufacturers, Global Automakers,
and the Consumer Electronics Association, as well as other major global
positioning system (GPS) industry representatives and stakeholders, to
develop standards for GPS wrong-way navigation alerts. (H-12-51)
To the Alliance of Automobile Manufacturers, Global Automakers, and the
Consumer Electronics Association:
Work with SAE International to develop standards for global positioning
system (GPS) wrong-way navigation alerts. (H-12-52)
Inform your members of the benefits of incorporating wrong-way navigation
alerts into global positioning system (GPS) navigation systems. (H-12-53)
BY THE NATIONAL TRANSPORTATION SAFETY BOARD
DEBORAH A. P. HERSMAN ROBERT L. SUMWALT Chairman Member
CHRISTOPHER A. HART MARK R. ROSEKIND Vice Chairman Member
EARL F. WEENER
Member
Adopted: December 11, 2012
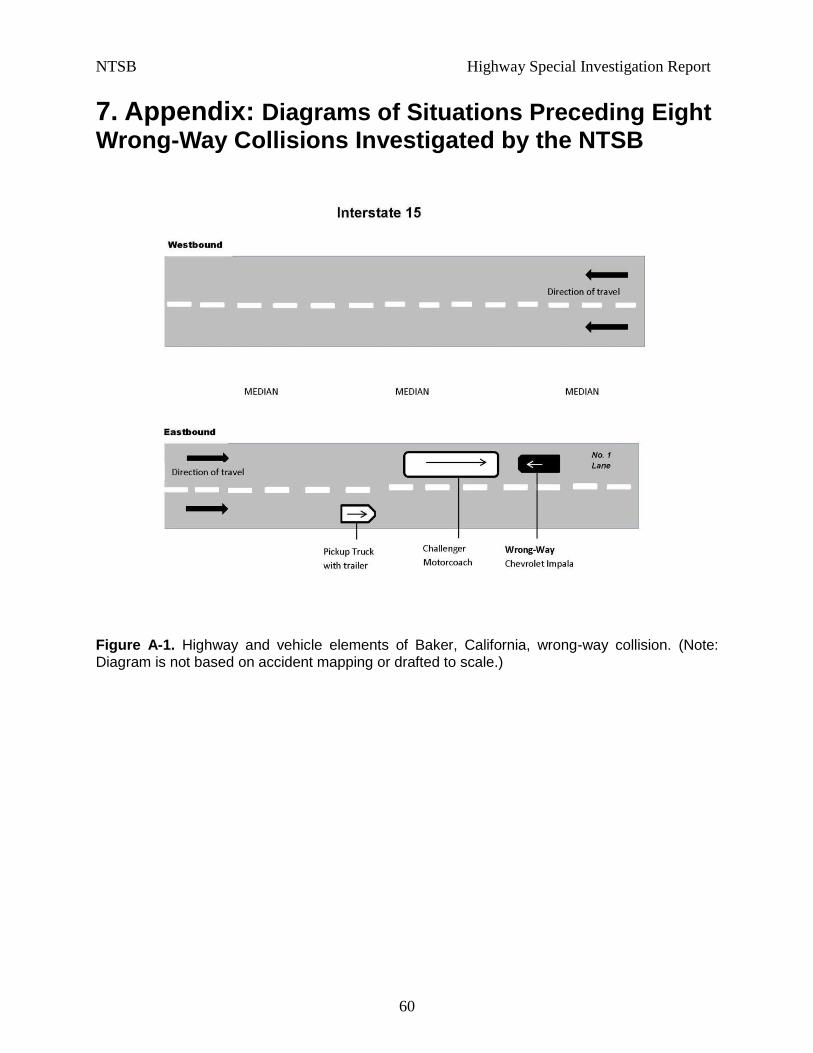
NTSB Highway Special Investigation Report
60
7. Appendix: Diagrams of Situations Preceding Eight Wrong-Way Collisions Investigated by the NTSB
Figure A-1. Highway and vehicle elements of Baker, California, wrong-way collision. (Note: Diagram is not based on accident mapping or drafted to scale.)
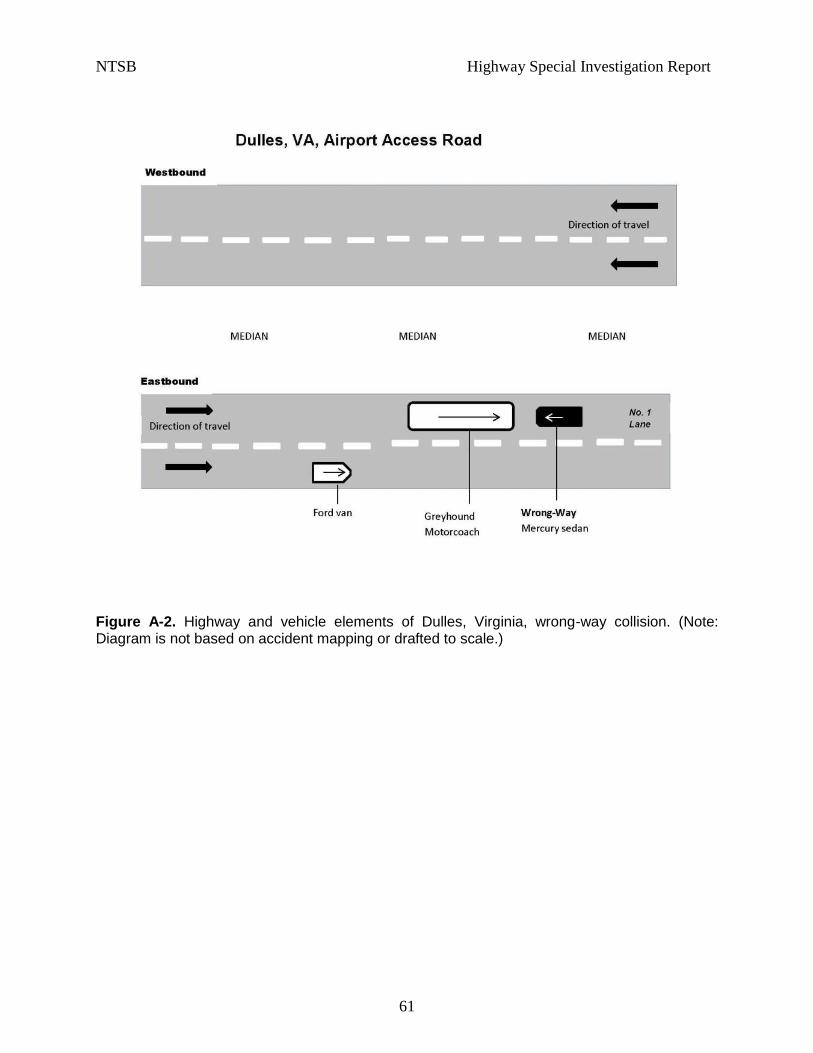
NTSB Highway Special Investigation Report
61
Figure A-2. Highway and vehicle elements of Dulles, Virginia, wrong-way collision. (Note: Diagram is not based on accident mapping or drafted to scale.)
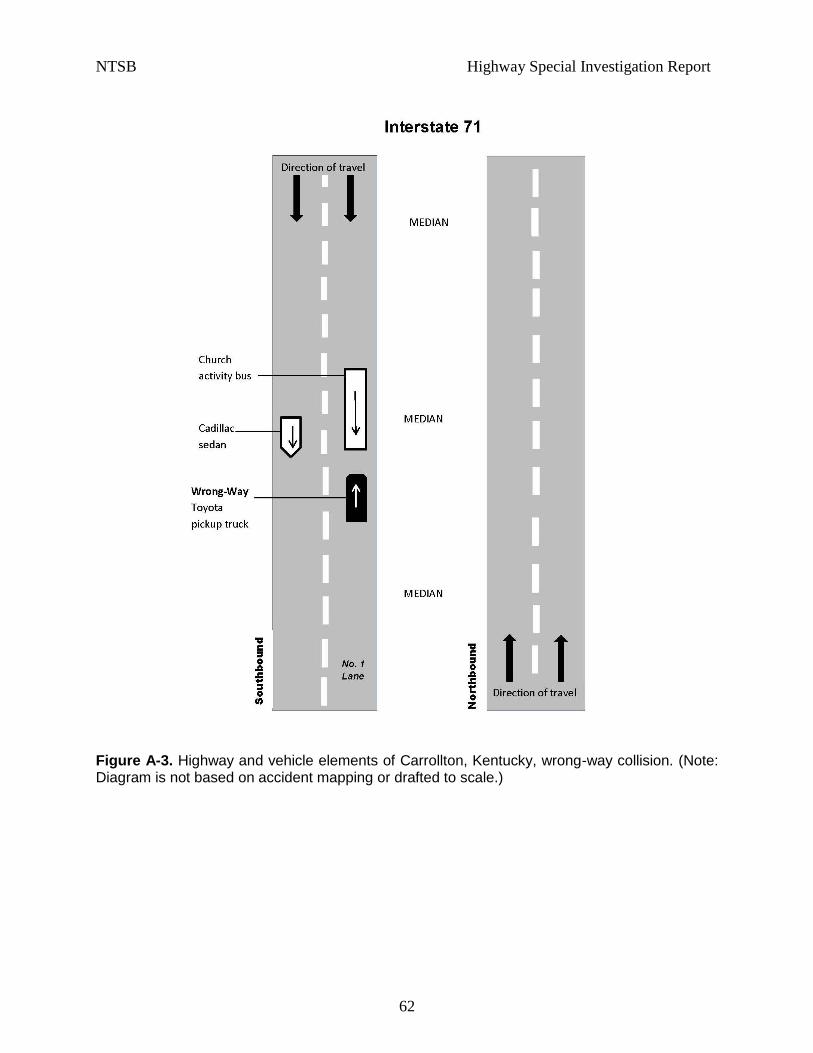
NTSB Highway Special Investigation Report
62
Figure A-3. Highway and vehicle elements of Carrollton, Kentucky, wrong-way collision. (Note: Diagram is not based on accident mapping or drafted to scale.)
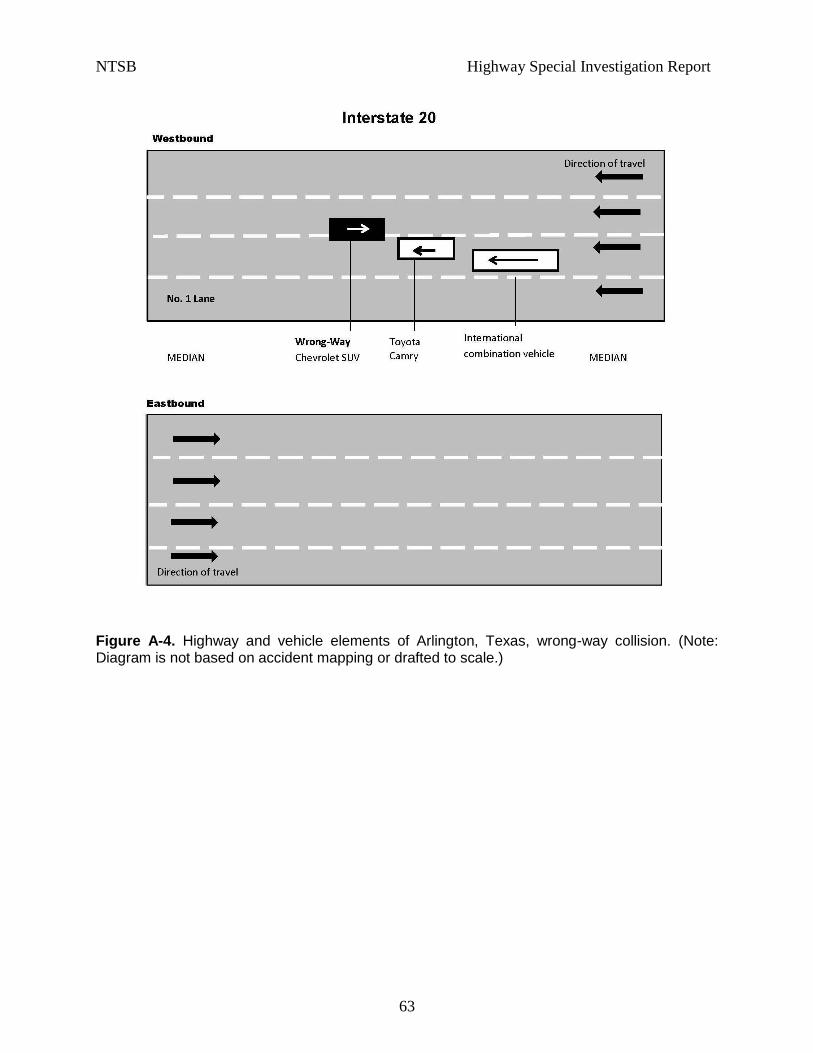
NTSB Highway Special Investigation Report
63
Figure A-4. Highway and vehicle elements of Arlington, Texas, wrong-way collision. (Note: Diagram is not based on accident mapping or drafted to scale.)
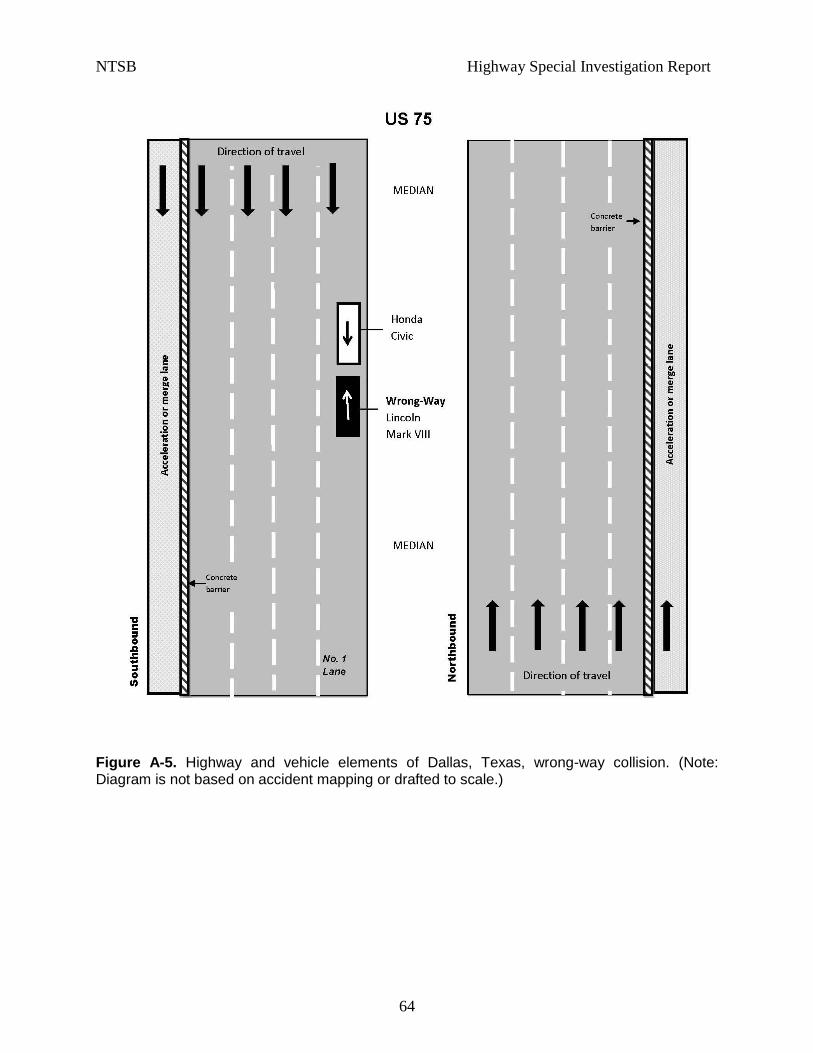
NTSB Highway Special Investigation Report
64
Figure A-5. Highway and vehicle elements of Dallas, Texas, wrong-way collision. (Note: Diagram is not based on accident mapping or drafted to scale.)
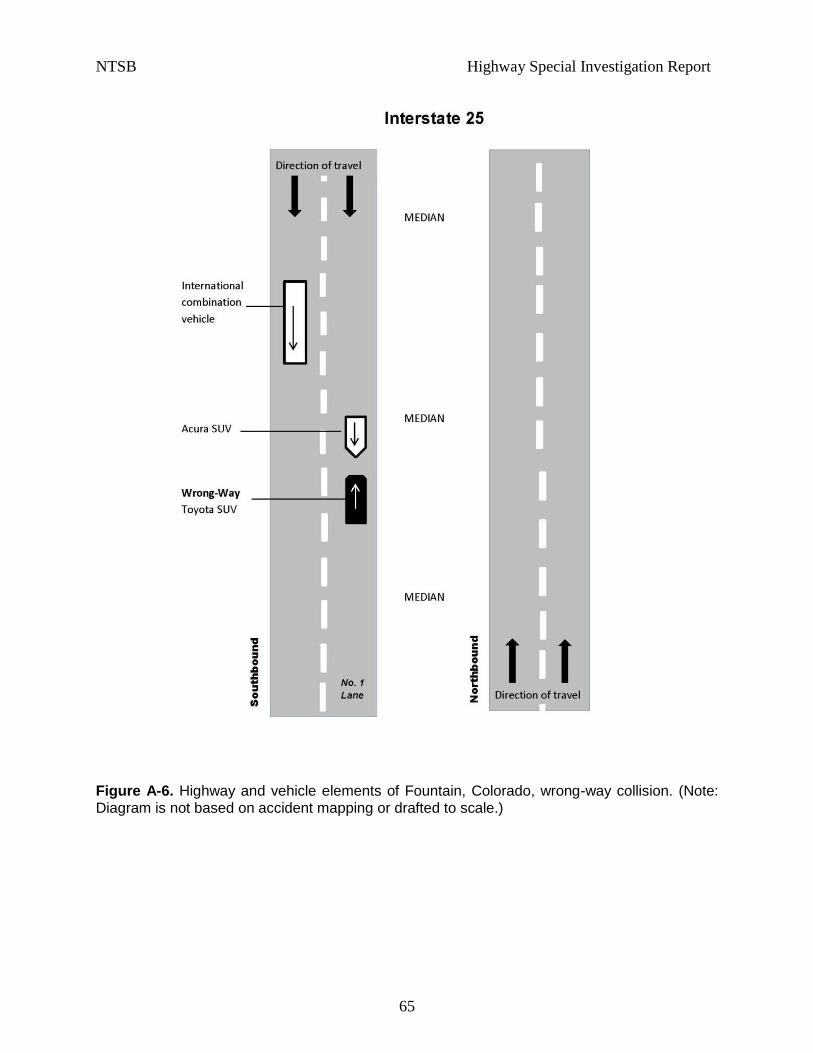
NTSB Highway Special Investigation Report
65
Figure A-6. Highway and vehicle elements of Fountain, Colorado, wrong-way collision. (Note: Diagram is not based on accident mapping or drafted to scale.)
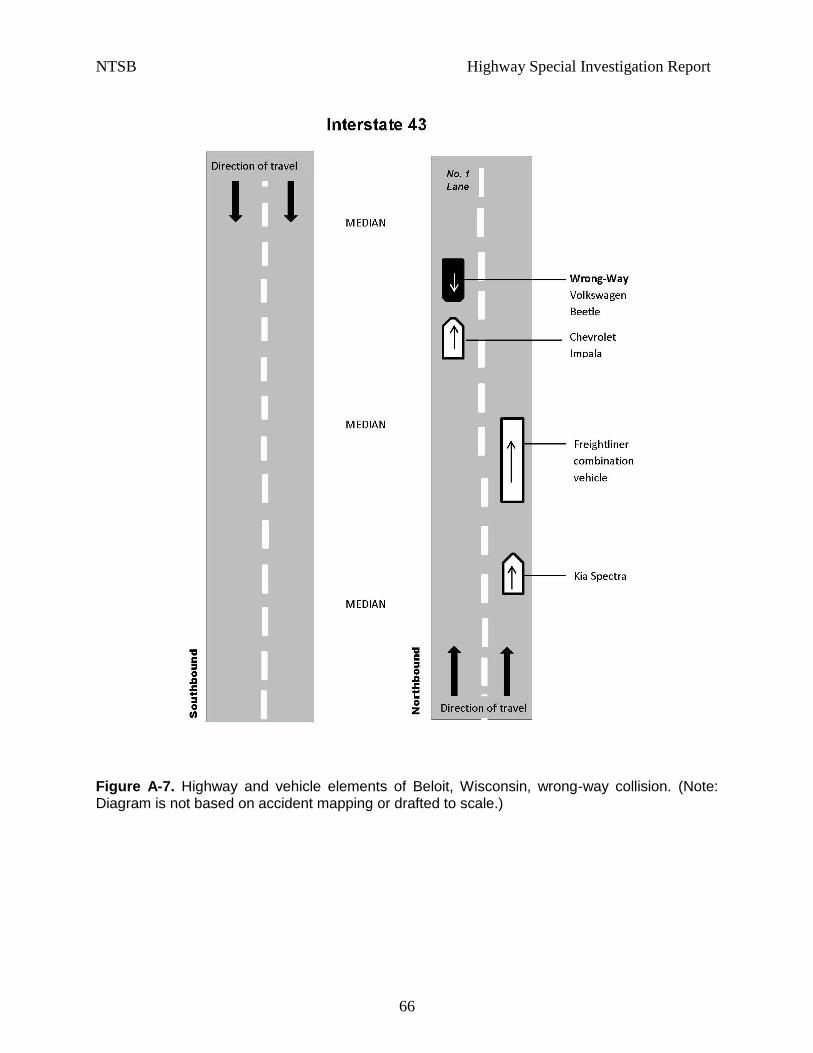
NTSB Highway Special Investigation Report
66
Figure A-7. Highway and vehicle elements of Beloit, Wisconsin, wrong-way collision. (Note: Diagram is not based on accident mapping or drafted to scale.)
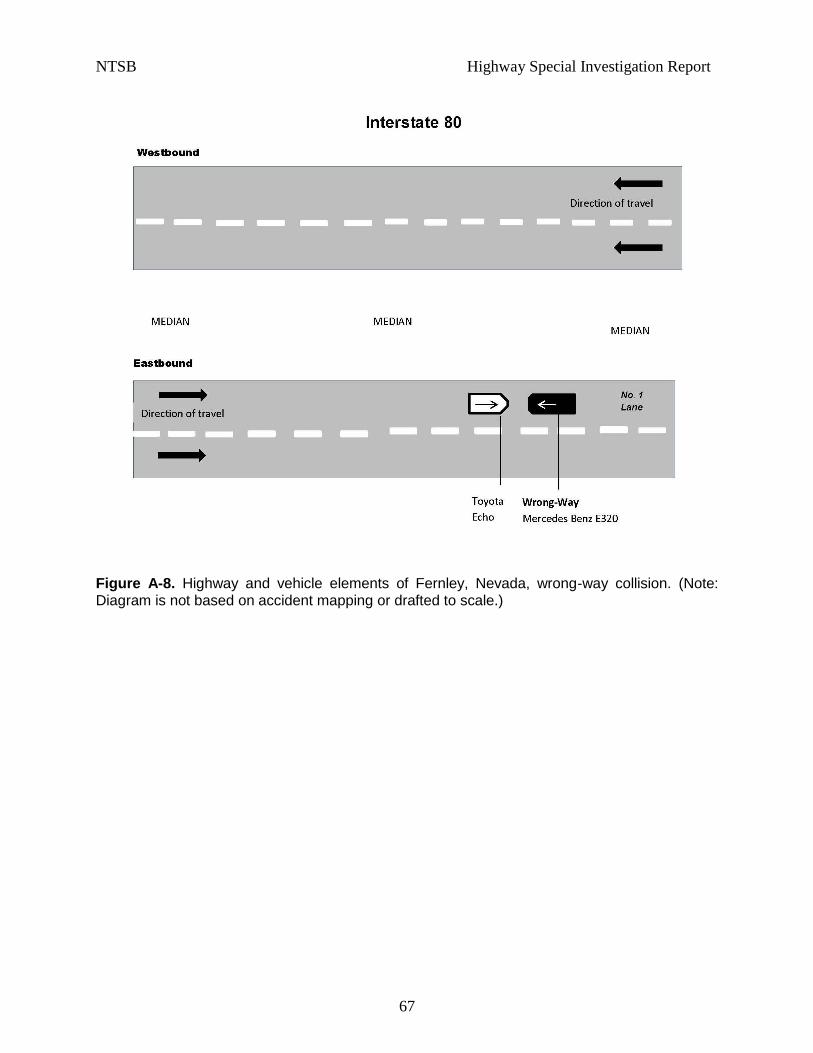
NTSB Highway Special Investigation Report
67
Figure A-8. Highway and vehicle elements of Fernley, Nevada, wrong-way collision. (Note: Diagram is not based on accident mapping or drafted to scale.)