Embed Size (px)
Citation preview
W?S 3 '?Sq
POLICY RESEARCH WORKING PAPER 2954
Never Too Late to Get Together Again
Turning the Czech and Slovak Customs Unioninto a Stepping Stone to EU Integration
Bartlomiej Kaminski
Beata Smarzynska
The World Bank
Development Research Group
Trade
January 2003
Pub
lic D
iscl
osur
e A
utho
rized
Pub
lic D
iscl
osur
e A
utho
rized
Pub
lic D
iscl
osur
e A
utho
rized
Pub
lic D
iscl
osur
e A
utho
rized
Pub
lic D
iscl
osur
e A
utho
rized
Pub
lic D
iscl
osur
e A
utho
rized
Pub
lic D
iscl
osur
e A
utho
rized
Pub
lic D
iscl
osur
e A
utho
rized

POLIcy RESEARCH WORKING PAPER 2954
Abstract
The Czech and Slovak Customs Union (CSCU), which borders is over and that integration within the CSCU,came into effect in January 1993, differs from regular similar in depth and scope to that existing within the
regional trading arrangements as its goal was to minimize European Union (EU), would be a desirable policy
the economic cost of a decline in economic ties between objective. By deepening integration, both the Czech and
its members rather than to set in motion the mechanism Slovak Republics would be better prepared to handle
of integration. The creation of the CSCU ensured a challenges associated with the EU accession. Such a
smooth and conflict-free break up of Czechoslovakia and regulatory realignment would also lower border costsresulted in divergence in regulatory regimes of the two and behind-the-border barriers to trade and result in a
republics. This study argues that the process of mutual more attractive investment environment in both
adjustment triggered by the emergence of national countries.
This paper-a product of Trade, Development Research Group-is part of a larger effort in the group to study the effects
of regional trading arrangements. Copies of the paper are available free from the World Bank, 1818 H Street NW,Washington, DC 20433. Please contact Paulina Flewitt, room MC3-333, telephone 202-473-2724, fax 202-522-1159,email address [email protected]. Policy Research Working Papers are also posted on the Web at http://
econ.worldbank.org. The authors may be contacted at [email protected] or [email protected] 2003. (19 pages)
The Policy Research Workig Paper Seoes dissem bates the findRgs of work in progress to encourage the exchange of Ideas aboutdevelopmnent Issues An objective of the series Is to get the findings out quickly, even If the presentations are less than fully polished. Thepapers carry the names of the authors and sho uld be cited accordnZigly. The findings, Interpretations, and conclusions expressed in thispaper are entirely those of the atithors. They do not necessarnly represenit the viewv of the World Bank, its Executive Directors, or thecountries they represent
Produced by the Research Advisory Staff

Never Too Late to Get Together Again:
Turning the Czech and Slovak Customs Union into a
Stepping Stone to EU Integrationby
Bartlomiej Kaminski* and Beata Smarzynska'
* University of Maryland, College Park: [email protected]
' World Bank, 1818 H St NW, Washington D.C, 20433, email: [email protected].
The authors would like to thank Francis Ng for assistance with the statistical analysis and Marcelo Bisogno,Paul Brenton, Bernard Funck and David Tarr for helpful suggestions.


1. IntroductionThe Czech and Slovak Customs Union (CSCU), which came into effect in January 1993,
differed from most regional trading arrangements observed in other parts of the world in oneimportant respect. Its goal was to minimize the economic cost of unavoidable decline in mutualeconomic ties between its members rather than to set in motion the mechanism of integration. Thecreation of the CSCU was part of a broader package of agreements and arrangements to ensure asmooth and conflict-free break up of Czechoslovakia. As we will argue in this paper, thisobjective has been largely attained. Moreover, different political dynamics and the pace ofstructural reforms have provided further impetus to divergence in regulatory regimes, albeitsignificantly weakened by the shared objective of aligning with the acquis communautaire-thenecessary condition for membership in the EU.
Although the EU began accession negotiations with Slovakia later than with the CzechRepublic, Slovakia appears to have caught up in terms of progress made in negotiations, but notin compliance. Two measures indicate the progress achieved so far in preparations for fullmembership-the number of "negotiation chapters" closed and envisaged transitional periods. Onboth counts, Slovakia seems to be on a par with the Czech Republic. Both countries continuenegotiating the same two chapters-agriculture (chapter 7) and financial and budgetaryprovisions (chapter 29). Slovakia closed the remaining 28, as did the Czech Republic, albeit twochapters may yet to be reopen (chapter 30 on institutions and chapter 9 on transport). Countryassessments of the compliance with the acquis suggest, however, that the Czech Republic is moreadvanced of the two countries (EU 2002b and c).
Issues that will be subject to transitional periods, because either a candidate country orthe EU is not ready to assume all obligations, are also roughly similar. More importantly, they areunlikely to constitute a barrier to the establishment of a single market within the CSCU.Temporary restraints on one of four freedoms have been requested by the EU (a transitionalperiod of up to five years for freedom of movement of persons) and they are similar for both theCzech Republic and Slovakia. It is also interesting to note that both countries requestedtransitional periods for implementing common VAT and excise tax rates in the same domains.'
This study shall conclude that the accession to the EU provides strong arguments in favorof reversing the process of disintegration and proceeding with 'deepening' of the ties within theCSCU and turning it into a stepping stone for integration into the EU. Such a 'deepening' wouldbe particularly beneficial to the Slovak Republic, from whose perspective the study examines thisquestion.
This paper is structured as follows. The next section contains a brief discussion ofhistorical background and the response of Slovak trade first to the dissolution of the Council ofMutual Economic Assistance and then to the dissolution of Czechoslovakia. Section 2 examinesin details developments in the volume, composition and factor content of trade between theSlovak and Czech Republics. Section 3 focuses on policies pursued within the customs union andargues that a deeper coordination within the CSCU would aid Slovakia's integration into the EU.The final section concludes.
' These include reduced VAT rates on heating and construction (Slovakia's request also includes electricityand gas), VAT turnover threshold for SMEs, lower excise duty rates on cigarettes, and special exciseregime for fruit growers' distillation for personal consumption (EC 2002a)

2
1.1 Historical BackgroundCzechoslovakia began its journey back to capitalism following the 1989 velvet revolution
with a mixed bag of initial conditions in terms of assets and liabilities. Domestic balances andvery low international indebtedness were clearly assets. So was political determination to breakdecisively with central planning. This assured strong support to move swiftly to a new economicregime. After a yearlong preparatory work, the authorities launched a radical stabilization-cum-transformation program on 1 January 1991. Its major components included a sharp reduction indirect subsidies, an overhaul of the tax system, and the liberalization of prices, foreign trade andexchange rate regimes.
Czechoslovakia had one of the least reformed systems of central planning among Councilof Mutual Economic Assistance (CMEA) members in 1989 (Kaminski 1994). The scope ofcentral controls over economy was vast. In contrast to Hungary or Poland, where a significantshift of economic decision-making responsibility to enterprises prior to the collapse of centralplanning had produced cadres of managers better equipped to cope with challenges of moving toa demand-constrained economy, Czechoslovak enterprise managers were ill-prepared to newtasks. They had little, if any, direct contacts with Western clients, and were used to execute ordersrather than autonomously seek solutions. Slovakia seemed to be particularly poorly prepared, asthroughout the 1970's there were significant investrnents in Slovakia in heavy, energy- andcapital-intensive industries with little prospects for survival once cross subsidies, including cheapenergy, were removed.
Yet, assets seemed to have prevailed over liabilities. Despite the separation and changesin the original mix of structural reform measures adopted by the then Czechoslovak federalgovernment, the Slovak economy rebounded strongly the third year into the transition (1993). Itsstabilization-growth pattern did not diverge from the performnance of other successful reformersamong Central European Economies (CEECs2) in the early 1990s. Like in other transitioneconomies, inflation had initially followed an inverted-U shape. Exports facilitated bygeographical proximity and liberalized access to EU markets had driven economic recovery.Unexpectedly, the split of Czechoslovakia into the Czech Republic and Slovakia, which went intoeffect on 1 January 1993, coincided with the beginning of economic recovery.
1.2 Trade ReorientationIn contrast to other Central European economies, two shocks, i.e., those of the dissolution
of both the CMEA and Czechoslovakia have shaped Slovak trade performnance. Both seem tohave contributed to Slovak surge in exports to third markets, mainly the EU, and to dramaticreorientation of its imports.
The dismantling of central planning has brought about a massive shift in trade away fromthe former CMEA. Due to the contraction in former CMEA import demand and the gradual shiftto convertible currencies in their trade transactions in the late 1980s and in the 1990-91 period,Czechoslovak exporters had already been losing preferential access to these markets. This put anend to the dual environment for the Czechoslovak trade activity: one subject to market forces andanother nurtured by preferential intra-CMEA arrangements providing an undemanding outlet forCzechoslovak manufactures.
As it turned out, a considerable proportion of these manufactures, considered "soft"products unmarketable in the West, was successfully redirected to new markets. Between 1989and 1991 the value of Czechoslovak exports to the European Union increased by 60 percent,
2 CEECs include Bulgaria, Czech Republic, Estonia, Hungary, Latvia, Lithuania, Poland, Romania, SlovakRepublic, and Slovenia.

3
while exports to CMEA economies fell by around 53 percent over the same period. The exportshare of the former CMEA fell from 45 to 20 percent. A considerable portion of these exportswas shifted from the CMEA to markets in highly developed economies-the EU in general andGermany in particular. The share of the EU almost doubled increasing from 26 to 46 percent overthis period (World Bank 1999). By 1991 the EU replaced the CMEA, and Germany replaced theformer Soviet Union as Czechoslovakia's major trading partners.
Although due to the lack of disaggregated data before the split, it is impossible toattribute this performance to respective republics, it seems that Slovakia's pattern did not divergesignificantly from that observed prior to the dissolution of Czechoslovakia. Its exportperformance was strong and driven by reorientation towards the EU especially sharp in the early1990s. The value of total exports increased from US$ 3.5 billion in 1992 to US$ 11.9 billion in2001, growing on average 17 percent per year. Imports in terms of value grew at roughly thesame average rate of 18 percent per year-they fell 15 percent in 1999, but subsequently stronglyrebounded in 2000 and 2001 (Table 1).
Table 1: Dynamics of Slovak Exports and Imports over 1993-2001 (annual changes in %)
1 1993 1994 1995 1996 1997 1998 1999 2000 2001Total exports 56% 23% 28% 3% 9% 11% -6% 18% 7%Total imports 63% 4% 33% 25% 7% 11% -15% 15% 16%Exports to the EU n.a. 42% 37% 14% 25% 32% 0% 18%Imports from the EU n.a. 19% 38% 32% 27% 28% -12% 9%Source: Based on Slovakia' data as reported to the UN COMTRADE database and Survey of Europe 2002, UNEconomic Commission for Europe, New York and Geneva, 2002 for the estimates of values of total exports andimports in 1992 and 2001.
Trade with the EU has shaped Slovak geographical pattern of trade. EU-oriented exportsgrew faster than total exports through 1993-99. Except in 1999, the rates of growth were in adouble-digit range. In consequence, the share of the EU increased from 35 percent to 59 percentbetween 1994 and 2000 (Table 2). The increase on the import side was smaller but also quitesignificant from 33 to 49 percent over the same period of time. Slovakia's geographical tradepattern has three other features setting it apart from other CEECs. First, its exports to CEECs,excluding the Czech Republic, expanded with the share growing from 10 percent in 1994 to 13percent in 2000, while the share of CEECs-oriented exports in total exports of other CEECs hasremained at single-digit levels. Imports, however, remained stagnant, i.e., grew in line with thegrowth in total imports.
Second, trade with its customs union partner, the Czech Republic dramatically contractedsuggesting that the 1993 dissolution of the Czech and Slovak Federation amounted to a severeshock. It seems, however, that both imports and exports have already bottomed out. Third, stillintense trade with the Czech Republic explains why its share of trade with the EU (around 55%)remains about 10 percentage points lower than that of "Luxembourg" group (around two-thirds). 3
3The countries that made the fastest progress in transition-the Czech Republic, Estonia, Hungary, Polandand Slovenia-were already invited in July 1997 to begin accession negotiations (these started in March1998), whereas "late" or slower reformers-Bulgaria, Latvia, Lithuania, Romania and the SlovakRepublic-joined the former in December 1999. This first-also including Cyprus-is often called the"Luxembourg Group," whereas the second is often referred to as the "Helsinki Group." The latter alsoincludes Malta.

4
Table 2: Geographic Distribution of Slovak Foreign Trade, 1994-2000
Country 1994 1995 1996 1997 1998 1999 2000
Export Value ($ million)
European Union 2,343 3,208 3,645 4,539 5,970 5,977 7,024CEEC-1O (excl. Czech R.) 662 956 1,033 1,174 1,349 1,205 1,566Czech Rep. 2,502 3,024 2,738 2,455 2,179 1,820 2,068TOTAL 6,690 8,577 8,824 9,634 10,718 10,057 11,885
Export Share (in %)
European Union 35 37 41 47 56 59 59
CEEC-10 (excl. Czech R.) 10 11 12 12 13 12 13CzechRep. 37 35 31 25 20 18 17Other 18 16 16 15 11 10 10
Import Value ($ million)
European Union 2,213 3,049 4,030 5,136 6,553 5,753 6,245
CEEC-10(excl.CzechR) 321 511 573 629 757 677 784Czech Rep. 1,958 2,434 2,682 2,503 2,402 1,857 1,880TOTAL 6,611 8,770 10,936 11,727 13,071 11,131 12,774
Import Share (in %)
European Union 33 35 37 44 50 52 49
CEEC-10 (excl. Czech R.) 5 6 5 5 6 6 6Czech Rep. 30 28 25 21 18 17 15Other 32 32 33 29 26 26 30
Source: Based on Slovakia as a reporter from UN COMTRADE Statistics.
Overall, Slovak trade remains geographically highly concentrated with the EU togetherwith accession countries and EFTA absorbing around 90 percent of Slovak exports and providingalmost three-quarters of Slovak imports. Hence, the scope of change was rather dramatic butmainly boiling down to the expansion in trade with the EU and contraction in trade with the otherpart of what used to be Czechoslovakia.
2. Features of Czech-Slovak Trade following the Velvet Divorce:Has the contraction in mutual trade bottomed out?
Economic considerations alone would suggest a lowering of the mutual trade after thedissolution of Czechoslovakia. Trade that used to flow within a single state would be pulledtowards richer neighboring economies-Austria and Germany-once the state border was erectedregardless of the customs union or even the monetary union.4 Moreover, this trade would bemuch more important to Slovakia than the Czech Republic, simply because the latter is larger andmore developed. Therefore, one would expect that trade between the two countries would befalling after the split, as it would gradually reflect economic realities underpinning this exchange.Furthermore, the transition to from supply- to demand-constrained with cross-subsidiesartificially sustaining otherwise not competitive firms would further depress output, as was thecase throughout former centrally planned economies during the initial stages of transition. Hence,in addition to the emergence of economic borders, industrial realignment triggered by the collapseof central planning was bound to play an important role.
4 The monetary union between the Czech Republic and Slovakia was short-lived extending over a period ofless than three months.

5
2.1. Contraction in Trade: its current significanceSubsequent developments have confirned the expectations of a precipitous decline and
change in Slovak foreign trade patterns. The rapid contraction in Slovak trade with the CzechRepublic accompanied an impressive overall foreign trade performance that put Slovakia in thesame league as bold reformers from Central Europe (the Czech Republic, Hungary, Poland).However, as noted above, the emergence of Slovak Republic as a sovereign state -or moreprecisely the establishment of state borders with the Czech Republic-profoundly depressed thetrade between these two economies. Three observations are noteworthy. First, the contraction inmutual trade was dramatic in both relative and absolute terns. Following the 'velvet divorce' ofthe Czechoslovak federation on 1 January 1993 the trade between the two new sovereign statesimmediately fell as compared with their respective 'domestic' sales in 1992. Czech exports toSlovakia declined 24 percent, and imports from Slovakia 26 percent in 1993 (ECE 1994, p. 96).The share of mutual trade in their respective totals was falling each year over 1993-00 on bothexport and import side (Table 3).5 The value of both exports and imports was lower in 2000 thanin 1993,6 although both Slovak exports and imports from the Czech Republic increased in tennsof value in 2000 over 1999. Yet, the share of the Czech Republic in Slovakia's trade kept fallingin 2001 and the first quarter of 2002 according to the official Slovak trade statistics.
Table 3: The Share of Slovak Republic in Czech Exports and Imports and the share ofCzech Republic in Slovak Exports and Imports, 1993-2001 (in percent)
1994 1995 1996 1997 1998 1999 2000 2001 Memo: Index1 l2001,1994=100
Czech RepublicShare in exports 16 14 14 13 11 8 7 7 44Share in imports 14 12 10 8 7 6 5 5 36
Slovak RepublicShare in exports 37 35 31 31 21 18 17 17 47Share in imports 30 27 25 22 19 17 15 15 49Source: Direction of Trade Statistics Yearbook, IMP, Washington D C., various issues, and official govemment website http://www.statistics.sk/webdata/english/tab/fot/iaeO1.htm
Second, although the contraction in respective shares of exports was almost identical (i.e.,they stood in 2001 at 44 percent for the Czech Republic and 47 percent for Slovakia of the 1994level), Slovakia has remained more dependent on trade with the Czech Republic than vice versa.The share of Slovakia in Czech imports declined significantly more than the share of the CzechRepublic in Slovak imports. For the more developed Czech Republic, trading with Slovakia wasinitially less important and currently accounts for around six percent.
Third, not surprisingly, the customs union arrangement between the two countries couldprevent neither relative nor absolute contraction in trade. It could not result in trade expansion, asis usually the case with preferential trading agreements. The creation of two states led to theemergence of new obstacles to trade including separate currencies, administrative proceduresrequired to control origin of traded goods as well as 'creeping-in' different technical standards.Quick disappearance of a monetary union exacerbated the decline in trade. So did the devaluationof the Slovak koruna against the Czech koruna as well as establishment of a complicated payment
5 No official estimates are available for 1993. According to an unofficial estimate, the value of Czechexports fell around 40% and that of Czech imports from Slovakia around 30%. See PlanEcon (1994).
6 The value of Slovak exports was 18 percent lower in 2000 than that in 1993 and the value of imports 4percent lower.

6
system.' Slovakia, confronted with what was then regarded as an unsustainable deficit, erectedother barriers to imports from the Czech Republic including import taxes, quotas on imports ofnon-alcoholic beverages and beer, and burdensome technical certification procedures. If anything,the developments in their mutual trade have clearly demonstrated that even free trade falls wellshort of assuring the level of interaction occurring among firms operating within the same stateboundaries and using the same currency. Yet, as we shall argue below, the case can now be madefor closer policy-induced integration within the pan-European framework.
Since Czech markets still absorb almost one-fifth of Slovak exports (after Germnany thesecond largest purchaser of Slovak goods), an important question is whether the fall in theirrelative importance will continue. The most recent data for the first quarter of 2002 indicate thefall in the value of exports to the Czech Republic of almost 14 percent following two years ofpositive growth rates in 2000 and 2001. It should be noted, however, that its exports to Germany,its largest trading partner, also fell significantly by 10 percent. Hence, this may be a temporaryphenomenon rather than a reversal of the trend. Without a more detailed analysis of thecomposition of this trade, however, no firm answer can be offered.
2.2. Emerging patterns of Czech-Slovak tradeHow has Czech-Slovak trade evolved since the velvet divorce? First, let us note that
Slovak exports to the Czech Republic have become less concentrated. Both the number ofproducts accounting for less than one percent of Slovak Czech-oriented exports and their share intotal exports to the Czech Republic have significantly expanded (Table 4). This would suggestthat (a) exports have become more diversified and less vulnerable to swings in Czech importdemand; and (b) small firms are major agents of this trade.
Table 4: Diversification of Slovak Exports to Czech Republic, 1994-2000
Product (SITC 4-digit, rev. 1) 1994 1995 1996 1997 1998 1999 2000
No. of products with an export share to Czech Rep. 24 24 19 26 23 23 19of at least 1%Total export share of products to Czech Rep. of at 46 43 35 52 47 48 35least 1% (in %) 46_ 43_ 35_ 52_ 47_ 48_ 35Total export value of products to Czech Rep. of at 1,141 1,312 947 1,274 1,033 872 713least 1% share ($ million) _ _ _ _ _ _ _ _ _ _ _ _ _ _ _ _ _ _ _ _ _ _ _ _ _
Memo:ltotal export value of products to Czech Rep. 1,360 1,550 1,614 1,180 1,146 947 1,015Below 1% ($ m illion) _ _ _ _ _ _ _ _ _ _ _ _ _ _ _ _ _ _ _ _ _ _ _ _ _
Source: Derived from Slovak foreign trade data as reported to the UN COMTRADE database.
Second, despite growing diversification in Slovak Czech-destined- exports, Slovak firmsremain dominant suppliers in a number of markets. Slovak exports with a share in total Czechimports exceeding 50 percent account for a quarter of total Slovak exports to the Czech Republic,and those with the share exceeding one-third for 30 percent of these exports. The largest exportitem in terms of volume (US$ 192 million in 2000) among four-digit SITC. Rev. 2 products witha 59 percent share in Czech imports is residual fuel oils (SITC. 3324), followed by iron steelmedium plates (SITC. 6742)-the value of US $68 million yielded the share of 51 percent inCzech imports (see Annex Table 1).
This simultaneous diversification combined with concentration and strong presence ofexporters of a significant number of products in Czech markets (46 four-digit SITC products havea 30 percent or higher share in total Czech imports) appears to point to a dual picture that hasemerged in Czech-Slovak trade. On the one hand, there are large firms that have already
7 For more details see ECE (1994).
7
undergone restructuring likely with foreign investments and, on the other hand, there are agrowing number of small firms trading with their equivalents across the border.
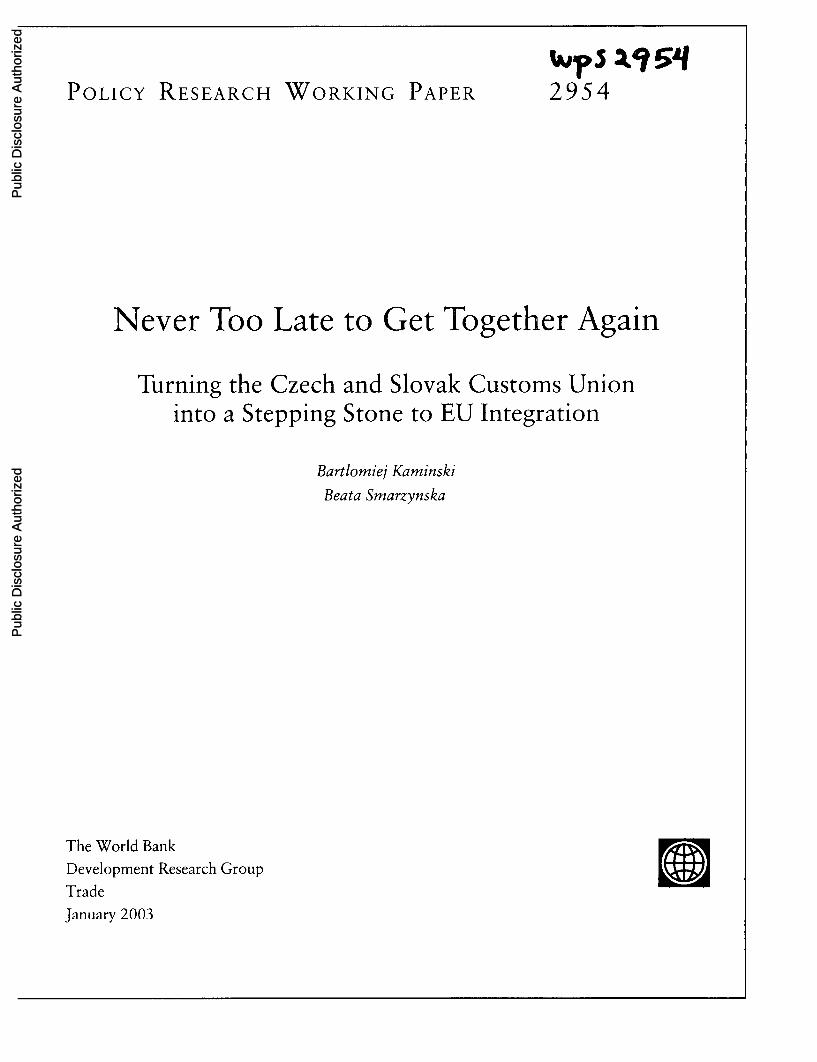
Table 5: Shares and Specialization Indices of Slovak Exports to Czech Republic, 1994-00
Product (SITC Rev. 1) 1994 1995 1996 1997 1998 1999 2000
Share in Slovak Total Czech-Destined ExportsAll Manufactures (5+6+7+8-68) 79.4 77.9 66 2 79.6 78.0 71.9 69.6Chemical Elements (51) 3.8 3.2 2.4 3.1 3.0 2.9 3.3Leather Goods (61) 0.6 0.4 0.3 0.3 0.3 0.2 0.3Wood Manufactured (63) 0.8 0.8 0.6 0.6 0.5 0 5 0.5Textiles, Yam and Fabric (65) 4.7 4.2 3.9 3.6 3.7 3.2 3.1Iron and Steel (67) 14.3 16.2 5.8 15.2 17.1 11.9 15.3Metal Manufactured (69) 3.3 3.4 3.5 3.3 3.7 3.6 3.1N4on-ElectricMachinery(71) 8.2 7.1 7.3 7.1 6.8 66 5.6Electrical Machinery (72) 7.0 6.2 5.3 6.8 6.5 5.6 4.7Transport Equipment (73) 5.8 5.7 6.6 8.8 6.2 5.6 5.3Fumiture (81) 1.6 1.5 1.4 1.1 0 8 0.8 0 6Clothing (84) 1.6 1.3 1.4 1.6 1.6 1.7 1.9Footwear (85) 1.0 * 1.0 1.3 0 7 0.6 0 6 0.4Scientific Instruments (86) 1.2 0.9 0.9 0.7 0.7 0 7 0.5All Goods (0 to 9) 100.0 100.0 100.0 100.0 100.0 100.0 100.0
Export Specialization IndexAll Manufactures (5+6+7+8-68) 1.1 1.0 0 8 1 0 1.0 0 9 0.9Chemical Elements (51) 1.3 1.3 1.1 1.4 1.5 1.6 1.9Leather Goods (61) 1.3 0.5 0.4 0.6 0 5 0 4 0.5Wood Manufactured (63) 1.7 1.6 1.1 1.1 0 8 0 9 0.9Textiles, Yam andFabric(65) 2.3 1.1 1.1 1.0 0.9 08 08Iron and Steel (67) 3.7 3.2 1 4 3.6 3.5 2.9 3.5Metal Manufactured (69) 1.2 1.1 1 0 10 1.0 1.0 0.8Non-Electric Machinery (71) 0.4 0.4 0.4 0 5 0 4 0.4 0.4Electrical Machinery (72) 0.7 0.5 0.4 0.5 0.4 0.4 0.3Transport Equipment (73) 1.0 0.9 0.9 1.0 0 7 0 6 0 6Furniture (81) 1.3 1.4 1.3 1.0 0 6 0 6 0.6Clothing (84) 1.0 0.7 0.7 1.0 1.1 1 1 1.4Footwear (85) 1.5 2 0 2.1 1.2 1.3 1.3 1.0Scientific Instruments (86) 0.4 0 3 0.3 0.3 0.3 0.3 0.2
Note: Export Specialization Index is calculated as a ratio of shares of Slovak exports to Czech to the shares the Czechextemal imports.Source: UN COMTRADE Statistics.
Third, there has been a shift towards agricultural products and raw materials in theSlovak export basket to the Czech Republic demonstrating a huge geographical reorientation inthe Czech import demand for manufactures away from Slovakia. The share of manufactures fellfrom 79 in 1994 to 70 percent in 2000. The only two product groups that increased their share inCzech imports are iron and steel (SITC. 67) and clothing (SITC. 84). Together with chemicalelements (SITC. 51), these are the only manufactured products that appear to have comparativeadvantage in Czech markets, i.e., export specialization indices exceeded unity (see Table 5above).8 This contrasts sharply with a situation in 1994 when Slovak manufactures outperformed
8 The Export Specialization Index (ESI) is a slightly modified Balassa's Revealed Comparative AdvantageIndex. The difference is that ESI relates to the ratio of the share of a product in Slovak EU-oriented exports

8
suppliers from other countries across all but three product categories shown in Table 5-non-electric and electric machinery (SITC. 72 and 73) and scientific instruments (SITC. 86).Interestingly, it does not necessarily imply the loss of competitiveness in these products ininternational markets, as their share in EU imports increased over the same period of time (seeKaminski and Smarzynska 2002, Annex Table 3).
Fourth, Slovakia's Czech-directed export basket has simultaneously shifted towards lessprocessed goods. As can be seen from Table 6 presenting the composition of Slovakia's tradewith the Czech Republic over 1995-2000 in terms of the 'end-use' categories of the US Bureau ofEconomic Analysis,9 the combined share of foods, feeds and beverages, and industrial suppliesand materials-a good proxy for low processed goods-has been on the increase since 1996.
Table 6: Slovak Trade with Czech Republic by End-Use Product Category, 1995-2000
As percent As Annual Rate ofof Slovak percent of Growth (in %o)
Product (SITC Rev. 1) 1995 1996 1997 1998 1999 2000 Total trade Czech 1999- 1997- 1995-in 2000 total trade 2000 2000 96
_ _ _ _ _ _ _ _ _ _ _ _ _ _ _ _ _ _ _ _ _ _ _ _ _ _ _ _ _ _ _ _ _ _ _ _ _ _ _ _ _ _ _ _ _ _ _in 2 0 0 0 _ _ _ _ _ _ _ _
Export Composition (in O/o)Food, feed and 7.2 6.5 6.7 8.1 9.2 7.7 1.3 10.0 -5.0 -1.1 -18.6beveragesIndustrial supply 12.1 12 7 13.5 13.7 18.7 22.4 3.9 9.3 36 1 11 7 -5.2materialsCapital goods, 14.0 13.5 14.7 14.2 13.4 11.5 2.0 2.3 -2.5 -13.1 -12.7excluding autoCars and auto 5.0 5.6 7.9 5.2 4.5 42 0 7 3.7 7.4 -23.4 3 0partsConsumer goods 61.7 61.7 57.2 58.7 54.3 54.3 9 4 8.7 13.6 -72 -9 5All goods ($ million) 3024 2737 2454 2179 1819 2067 17.4 6.4 13.6 -5.6 -9.5
Import Composition (in %)
Food, feed and 10.6 10.1 10.7 12.0 14.2 13.0 1.9 204 -7.2 -2 9 4.8beveragesIndustrial supply 13.3 11.3 10.9 9 9 9.8 10.6 1.6 9.3 93 -9.9 -6.7materialsCapital goods, 16.7 16.4 17.8 15.3 14 7 15.4 2.3 3.5 5 9 -13.4 8.4excluding autoCars and auto 7.3 10.5 12.8 13.2 13 5 12.7 1.9 5.3 -4.8 -9.3 59 1PartsConsumer goods 52.1 51.7 47.8 49.5 47.7 48.2 7.1 7.1 2.3 -8 8 9.2All goods ($ million) 2,434 2,682 2,503 2,402 1,857 1,880 14.7 6.5 1.2 -9.1 101Note End-use product categories are defined as Food, feed & beverages (SITC 0+1+22+4); Industrial Supply materials(SITC 2+3+68-22); Capital goods, excluding cars (SITC 7-732-733); Cars and auto parts (SITC 732+733) andConsumer goods (SITC 5+6+8+9-68).Source: Based on Slovakia as reporter from UN COMTRADE Statistics.
Their share rose from 19 to 30 percent over this period. The expansion in exports of industrialmaterials in 1998-2000, whose value increased 50 percent from US$ 298 million to US$ 462million, was the major force behind this increase in the share of less processed goods. It isinteresting to note that the share of processed goods in Slovak imports from the Czech Republic
to the share of this product in EU-external imports rather than its share in world exports. A value for thisindex below unity indicates a comparative disadvantage in EU markets, and above unity specialization in EUmarkets.
9 This allows identification of products by their use by buyers rather than in terms of their positions inproduction process. For a more detailed discussion, see (Kaminski and Smarzynska, 2002, Section 3).

9
has remained flat. But had it not been for a significant increase in the share of automotive parts inSlovak imports (from 7 to 13 percent), it would have displayed similar tendency as that in Slovakexports.
A good illustration of the disappearance of division of labor within industrial sectors istrade within the automotive network. As can be seen from data in Annex Table 2, there was amassive reorientation of this trade away from Czech to EU markets. This was not a redirection, asboth Czech and Slovak automotive sectors underwent restructuring carried out by multinationalcorporations (MNCs), mainly by Volkswagen. Both became veritable powerhouses of the CentralEuropean automotive sector accounting for almost 50 percent of the aggregate output of CEEC-10 and more than half of their exports.' 0 Czech Republic became the largest and Slovakia thethird largest producer among them. Yet, restructured firms tumed to other sources of supply,mainly in the EU but also domestically. The share of parts and components originating in the EUin Slovak total imports automotive parts and components increased from 36 percent in 1995 to 92percent in 2000, while the share of Czech suppliers fell from 51 percent to 4.2 percent over thesame period. The same happened on the side of exports with one exception, Slovak exports ofinternal combustion engines to the Czech Republic significantly expanded.
It thus appears that the existence of internal borders-even under customs unionarrangements-has affected outsourcing strategies pursued by the major automotive foreigninvestor in both countries-Volkswagen Group. Otherwise, it is difficult to explain why so manylocal Czech firms have become integral part of the supplier chain of Volkswagen and few, if anyamong Slovak firms provide inputs Volkswagen in the Czech Republic." The economic borderwas not a barrier on the demand side for a finished product, however. Consider that in contrast toparts, trade in final product, i.e., cars and trucks has not followed the same pattern with Czechproducers of passenger cars even recording a significant increase in their share of cars importedinto Slovakia.
Fifth, low share of products representing lines of production characterized by low valueadded, high natural resource-intensiveness and simple technologies depict the mutual trade. Thisshould come as no surprise considering, as noted above, a significant presence of small firms inthis trade. Their commodity trade pattern reflects significant endowment in highly skilled labor inboth countries. Table 7 presents estimates of commodity groups divided into four groups thatreflect distinct relative factor intensities, i.e., natural resource-intensive products, unskilled labor-intensive products, capital-intensive products and skilled labor-intensive products.'2 As can beseen from data in Table 7, the combined share of unskilled labor intensive and natural resourcebased products in Slovak Czech-destined exports expanded between 1996 and 1999, and thenprecipitously fell in 2000. Interestingly, the share of these products, albeit also displayingvolatility, in Slovak imports from the Czech Republic was at a similar level. Skilled labor-intensive products account for a dominant share of their mutual trade.
'° Derived from data in "Revue Elargissement, Special Automobile," Revue Regionale, Dossier No. 25 -September 2002.
" Such a situation may be also partially due to slower development of automotive part industry in Slovakia.
12 The goodness 'of results obtained hinges critically on the quality of a classification used to examineexport baskets over time by factor mix. There are woeful difficulties to define and measure factor intensitywith which trade theorists have long wrestled. The advantage of this classification is that all industries aretaken into account and an industry appears only in one classification. Its weakness is that some industriesmay be intensive in terms of more than one factor. Although this may clearly distort the results, one mayidentify on this basis broad lines of change occurring in export offer over time. For more details, seeKaminski and Smarzynska (2001).

10
Table 7: Factor Intensity of Slovak Trade with the Czech Republic, 1995-200
Factor Intensity 1995 1996 1997 1998 1999 2000Annual Growth
Exports to Czech Rep. ($ million) In 2000 (%)Natural Resources 580 480 628 594 604 394 -34.8
Unskilled Labor 367 326 268 224 180 200 10.9
Capital intensive 759 662 636 543 435 452 4.0SkilledLabor 1,076 695 921 817 599 682 13.9
Index in 2000Composition of Exports to Czech Rep. (%) (1995=100)
Natural Resources 20.8 22.2 25 6 27.3 33.2 22.8 112.5
Unskilled Labor 13.2 15.1 10.9 10.3 9.9 11 6 90.3
Capital intensive 27.3 30.6 25.9 24.9 23.9 26 2 98.6
Skilled Labor 38.7 32.1 37.5 37.5 32.9 39.5 105.0
Index in 2000
Export Specialization Index (1998=100)Natural Resources 0.8 0.8 1.1 1.3 1.7 1.0 76.3Unskilled Labor 1.1 1.1 0.9 0.9 0.8 1.0 117.2Capital intensive 0.7 0.6 0.7 0.6 0.6 0.6 106.0
Skilled Labor 1.6 1.1 1.5 1.4 1.3 1.6 109.7
Annual Growth
Composition of Imports from Czech Rep. (%) In 2000 (%)Natural Resources 25.3 22.9 24.3 25.1 27.5 26.7 -2.6
Unskilled Labor 11.9 11.3 11.7 12 5 11.6 12.1 4.5Capital intensive 27.5 26.0 25.5 22.9 23.7 24.6 4.2
Skilled Labor 34.6 32.2 38.5 39.5 37.1 36.6 -0.9
Note: Export Specialization Index is calculated as a ratio of shares of Slovak exports to the EU to the shares of the EUexternal imports.Source Computations based on Slovak data as reported to UN COMTRADE database.
Calculations of Slovak export specialization indices in Czech markets show that skilledlabor is in relative abundance in Slovakia. Slovak firms specializing in skilled labor intensiveproducts have been at a strong comparative advantage in Czech markets vis-A-vis other exporters,as the values of this index were consistently well above unity over the 1990s. Exporters ofunskilled labor intensive products regained their export specialization in 2000 after a weakerperformance over 1997-99. The growth in share of agricultural products has been responsible forimprovement in competitive position of natural resource based products between 1995-99(followed by a drop in 2000), albeit, as we not below, not only. Last but not least, Slovakproducers of capital intensive products have been at a comrrparative disadvantage in Czechmarkets.
2.3. Concluding ObservationsThe analysis provides empirical support to two observations. First, the process of mutual
adjustment triggered by the emergence of national borders seems to be over. Provided thatcommitment to align their respective regulatory structures with the acquis remains strong in bothcountries, no new barriers to their mutual trade will emerge. To the contrary, many barrierserected over the last decade will disappear as both countries converge toward the acquis. Hence,the trade is rather unlikely to continue its downward course.

Second, the continuing importance of resource intensive exports does not strike one assurprising for two reasons-Czech markets offer agricultural producers the best conditions inaccess among Slovak preferential partners and there appears to be little of intra-industry tradedriven by production fragmentation. One wanders whether the dismantling of internal economicborders between the Czech Republic and Slovakia, as will be discussed in the next section, wouldnot provide a boost to this trade.
3. CSCU as a Stepping Stone to EU IntegrationSince the Agreement establishing the customs union went into effect, a close
coordination of foreign and customs policies has been maintained in both multilateral andbilateral forums. A new common external tariff (CET) had duties that were applicable in theformer Czechoslovakia on December 31, 1992, holding intact all concessions granted earlier bythe former Czechoslovakia to GATT contracting parties during pre-Uruguay's rounds ofmultilateral trade negotiations. 3 The two countries jointly negotiated during the Uruguay Roundand their final schedules were almost the same.'4 They also jointly became participants of theWTO Information Technology Agreement in 1997 and eliminated tariffs on informationtechnology imports as of January 1, 2002. Last but not least, the Council of the Customs Union,consisting of an equal number of Czech and Slovak representatives, has pursued commoncommercial policy towards third countries. It has made sure that the same legal norms would beadopted regarding rules of origin, customs procedures, statistics, intellectual property,countervailing and antidumping.
Membership in a customs union has two major potential advantages over a free tradearea. First and foremost, it does not require implementing very costly rules of origin amongmembers, as all products entering the customs union are subject to the CET and other taxes andcharges collected by customs. Second, the advantage of a customs union is that it offers theopportunity of completely removing border formalities. This significantly cuts transaction costs,as the cost of inefficient customs clearance procedures often exceeds tariffs."5
The CSCU capitalizes on the first advantage, but has failed to exploit the second. Article1.3 of the Agreement establishing the customs union stipulates that "... customs clearance shallbe effected on a common state and customs frontier between the Czech Republic and the SlovakRepublic." In consequence, the flow of trade between two countries is not unfettered. It is subjectto customs controls. Imports from, for instance, the Czech Republic cannot be sold in Slovakia
13 Czechoslovakia was one among 23 countries that signed the GATT in 1947. Despite the obviousirrelevance of GATT codes for a country institutionally committed to the state monopoly over foreigntrade, Czechoslovakia actively participated in the Tokyo Round of multilateral negotiations. Its positivelegacy, i.e., once communism collapsed, was low tariff rates and other commitments to GATT disciplinesliberalizing market access.
14 Since the customs union agreement did not allow for a free flow of trade originating in third countries,the value of imports from developing countries on GSP basis as well as the volume of imports eligible forin-quotas rates have varied between two countries. So have import limits on products subject to non-automatic import licensing.
15 In the mid-1990s, customs clearance transaction in countries of Middle East and North Africa requiredbetween 25 and 35 stages taking several weeks (Hoekman and Kostecki 2001). But even efficient customsclearance procedures impose significant cost. For instance, shipping goods across the U.S.-Canadianborder-that is, between countries which are part of the same free trade area (NAFTA) and have well-operating customs procedures-is equivalent to adding 2,700 kilometers in transport costs (Engel andRogers 1996).

12
unless the Slovak Customs clear them. From this point of view, internal arrangements are similarto those in a free trade area. All products crossing the border must have a certificate of origin.
Internal border has allowed the Agreement to withstand pressures stemming fromdifferences in their respective economic policies over the 1993-98 period. During that time theCzech Republic moved fast to bring its economic regime in line with the acquis communautaire,whereas Slovak progress in that area was stalled. Internal economic border has allowed for aconsiderable discretion in decisions affecting imports. For instance, Czech exports of consumerproducts to Slovakia faced a temporary import surcharge of 10 percent in 1995-96, reduced to 7percent in 1997 and 5 percent in 1998. Slovak exports faced extra barriers when the Czechgovernment introduced import deposits in 1997.16
While all these measures could be justified on the grounds of balance-of-payments crisesfaced in different times by respective countries, narrow interest groups captured trade policies inboth countries and, in addition, the Slovak authorities resorted to technical barriers to trade.' Thepolicy-capture resulted in providing protection to narrow groups of domestic producers throughquantitative restrictions. The Czech Republic limits imports of sugar and isoglucose, whereasSlovakia restricts imports of non-alcoholic beverages and sugar. In September 1997 the Slovakauthorities introduced a requirement that imported products obtain an obligatory technicalcertification subject to specific regulations and Slovak technical norms (Besik 1998). This haserected a serious barrier to trade, as the procedures on imports of foodstuff, for instance, becamesubject to burdensome procedures only removed in January 2001 (FIAS 2001). Indeed, in theabsence of harmonization in technical standards or principles of taxation including tax rates,borders have to be maintained, albeit with simpler border procedures.
The internal economic border had to be maintained also when there was a real prospect ofthe Czech Republic acceding earlier to the EU than the Slovak Republic. While the CzechRepublic together with Estonia, Hungary, Poland and Slovenia, were invited in July 1997 tobegin accession negotiations (which started in March 1998), the Slovak Republic joined in onlyafter the EU Helsinki Summit in December 1999. This was a much welcome outcome, as separateaccessions of the CSCU members would raise a number of hair-splitting legal issues, if the twocountries wanted to maintain the existing arrangement. Had there been no internal economicborder, it would have had to be established.
Since the European Commission has changed its initial position and included Slovakiaamong the first-wave entrants to the EU, the wisdom of maintaining an internal economic borderneeds to be re-examined. As mentioned above, no matter how efficient customs controls are,traders incur significant transaction costs. Borders generate transaction costs that fragmentmarkets. The elimination of internal economic borders would create a larger integrated market (atleast in terms of the movement of goods) offering economies of scale. The prospect of accessioncombined with earlier opportunity of tapping benefits of larger markets as well as the achievedlevel of integration driven by the EU accession provide powerful arguments in favor of a fasteralignment with the acquis through closer cooperation within the CSCU.
Before turning to institutional and regulatory alignment driven by the EU-accessionprocess, it is worth noting that two standard arguments in favor of maintaining internal economic
16 On April 27, 1997, the Czech Government obliged importers to deposit 20 percent of the invoice value ofa transaction for six months at no-interest. This measure, which was revoked on August 21, 1997, appliedto 30 percent of Czech imports (Drabek 1998).
17 With a bit of stretching, these are allowed under Article 11 of the Agreement on "... grounds of publicmorals, public interest or public security, the protection of human health or life, life and health of animalsor plants..."
13
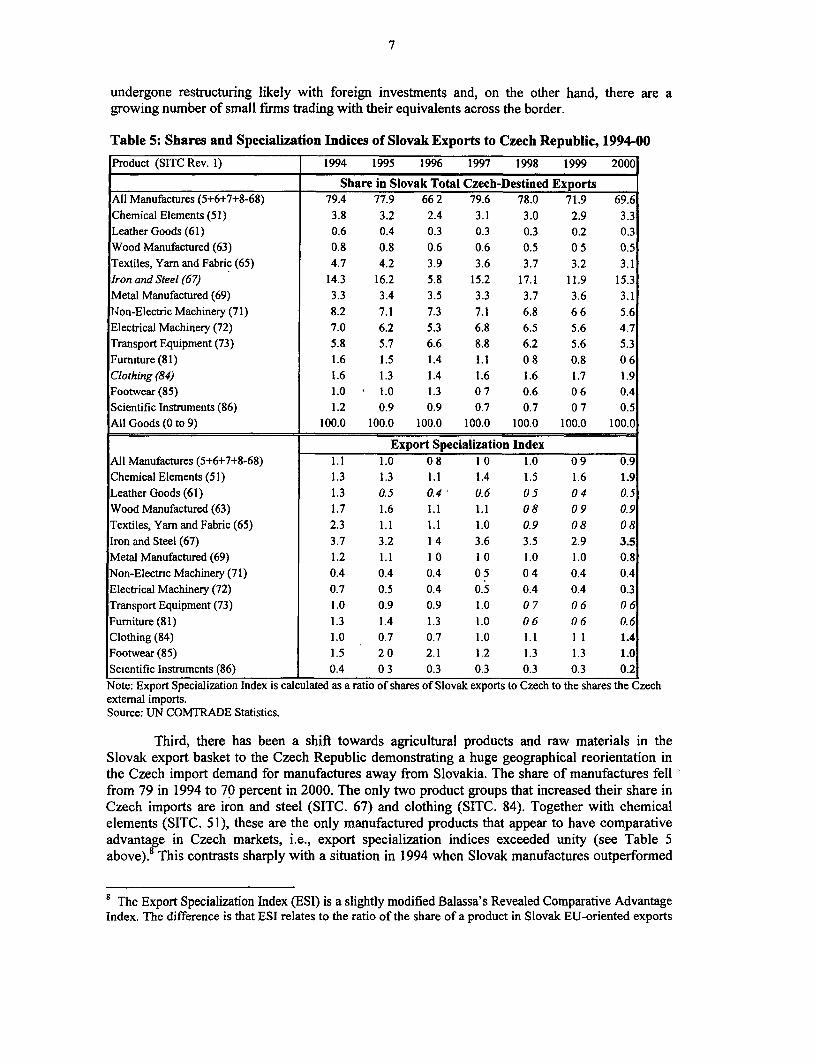
borders within a customs union-lack of trust in customs and different tax rates-do not seem toapply to the CSCU. Differences in the quality of customs administration, rules and rates oftaxation, procedures in customs valuations as well as fear of conflicts over allotment of customsrevenue are not critical. According to independent external assessments, both countries have amodem and well-run customs administration, which also augur well for proper distribution ofcustoms revenue between two countries. Both countries observe the rules of the WTO CustomsValuation Agreement requiring that members levy customs duties on an imported good'stransaction value rather than on some reference price constructed by the goverrunent. Bothcountries maintain accurate and up-to-date computer databases of prices that they use to detectfraudulent invoicing. Different tax rates could be addressed in negotiations between the twogovernments.
Institutional and regulatory evolution driven by the accession has led to the growingoverlap in regulatory regimes of both countries especially in areas pertinent to external economicinteraction. Differences in derogations and transitional periods that have been negotiated by theCzech Republic and Slovak Republic with the EU are minor.18 In fact, transitional periodsrequested by both countries do not differ with respect to four freedoms of movement (goods,services, capital, people) underlying the European "Single Market." They could apply fully "fourfreedoms" within the CSCU even before the transitional period of up to five years for freedom ofmovement of persons, requested by the EU, expires. Moving to a single market would not putstrains on their trade relationships, as similar provisions as in the European AssociationAgreement of which both countries are signatories already cover a number of areas relevant fromthe point of view of deeper integration. Both countries are part of the Pan-European CumulationAgreement and thereby of a single European free trading bloc for manufactures. In other words,trade in manufactures between the Czech Republic and Slovakia is governed by the same rules aswith other CEFTA, EU and EFTA countries. They all adhere not only to the same preferentialrules of origin as stipulated by the Pan-European Cumulation Agreement, but also to the samenon-preferential rules of origin based on the system used by the EU in 1993. Last but not least,there are no significant technical baniers to trade in the CSCU as both countries concludednegotiations on Protocol to the Europe Agreement on Conformity Assessment (PECA).'9 Bothhave incorporated in their respective regulations the EC Directives with the transposition level inthe Czech Republic reaching 100 percent and in Slovakia 99 percent (EC 2002c).20 For thesereasons alone, border customs controls within the CSCU would seem to be redundant.
However, there are two areas in which there are differences in alignment to the acquis interms of enforcement-technical standards and intellectual property rights. As for the forner, theCzech Republic has made greater strides towards EU membership. It not only signed PECA (asopposed to Slovakia's initialization of it) but also established administrative capacity to meet theacquis. The Czech Republic has functioning market surveillance services, as demonstrated by thefact that the EC has given satisfactory marks the Czech Trade Inspectorate for marketsurveillance of industrial products. EU CE marking is accepted there, while Slovakia is yet tofollow suite in spite of having the legal enforcement basis since April 2002. Last but not least,Slovakia is yet to introduce "... the checks for conformity with the rules on product safety on
18 For the current (as of September 2002) status of progress in accession negotiations, see EC 2002a.
'9 PECA deal with products for which technical regulations have been already harmonized within the EU(Brenton 2002). These products amounted to around one-third of industrial value added in the EU in 1995(Messerlin 2001, Table 4.5). The Czech Republic signed PECA in July 2001, and Slovakia initialed it inJuly 2002 (EC 2002b and c).
20 One should also note that both countries have special arrangements for mutual recognition of certificatesand test results.

14
imports from third countries" (EC 2002b), while the Czech Republic already has them in place.Thus, it seems that Slovakia would benefit greatly from closer cooperation with the CzechRepublic in this area.
Similar considerations-as outlined above-also apply to protection of intellectualproperty. Both CSU member-countries are members of the World Intellectual PropertyOrganization and signed the GATT Agreement on Trade-Related Intellectual Property Rights(TRIPS). The latter requires that WTO members provide certain minimum levels of intellectualproperty rights (IPR) protection, such as 20-year patent terms, patents on medicines, plant varietyprotection, protection of geographical indications, and the like. With the split of the former Czechand Slovak Federal Republic, most of the staff, equipment and know-how stayed in the CzechRepublic. The Slovak intellectual property rights protection was established from scratch. Thecurrent system has a number of flaws, according to the 2001 FIAS assessment, and has a longway to go to be in line with the acquis communautaire. In contrast, all areas pertinent tointellectual property rights protection in the Czech Republic have been reformed and the Czechregime is highly compatible with that in the EU (WTO 2001, EC 2001).
It would make a lot of economic sense for the government to begin working on theremoval of internal economic borders within the CSCU. Leaving aside the obvious fact that largermarkets are a stronger magnet to FDI inflows and offer better opportunities for domestic firms bylowering transaction costs, the implementation of measures necessary to remove the internalCSCU borders would simultaneously improve investment climate in Slovakia and align itsregulatory regimes closer with the acquis. Close cooperation in bringing standards in line withthose in the EU would provide an extra boost to integration of domestic firms into intemationalmarkets. Harmonization of national standards is essential to participation in international supplychains spread out over several countries, in assembly operations as common standards reinforcelinkages between component manufacturers, assembly operations, and distributors in the finalproduct markets. Good regime of intellectual property rights is also crucial for investment increative industries and industries intensive in research and development. 21 Both countries wouldalso benefit from economies-in-scale in enforcement costs related to standards and intellectualproperty rights.
In all, regulatory cooperation within the CSU and the elimination of internal economicborders would yield tangible benefits to Slovakia. It would enhance its investment climate andreduce the need to attract FDI through costly tax incentives package.
4. ConclusionsThe analysis provides an unequivocally positive answer to a question whether integration
with the CSCU similar in depth and scope as currently existing within the EU would prepareSlovakia to better handle challenges associated with accession to the EU. Consider first that theprocess of mutual adjustment triggered by the emergence of national borders seems to be over.The trade between the two countries is rather unlikely to continue its downward course, as-given their mutually shared commitment to align their respective regulatory structures with theacquis-no new barriers to their-mutual trade will emerge. To the contrary, the regulatoryalignment driven by the acquis can be expected to lower border and behind-the-border barriers.
There appears to be little of intra-industry trade in Czech-Slovak trade, which is driven incontemporary global economy by production fragmentation. The removal of internal economicborders is likely to provide a boost to trade in parts and components within production anddistribution networks. The improvement in the policy environment achieved thanks to measures
21 For empirical evidence from transition economies, see Javorcik (2003).

15
necessary to remove internal customs controls and less fragmented markets will also increaseattractiveness to foreign investors of both countries.
Last but not least, the implementation of measures necessary to remove the internalCSCU borders would improve investment climate in Slovakia thanks to faster alignment ofregulatory regimes with the acquis communautaire. For instance, establishing a good regime ofintellectual property rights, closing the gap in national standards and their harmonization wouldprovide an extra boost to integration of domestic firms into international markets and investmentin creative industries that are intensive in research and development. While one expects transitionperiods for both countries to adopt the acquis, two countries might adopt it fully in their mutualeconomic relations. The marriage a decade or so after the "velvet divorce" would be different intwo important respects-it would take place within a broader European "family" and it wouldinvolve the economic sphere.

16
References:
Besik, R. 1998. Doing Business in the Czech Republic 1998/1999, PP Agency, Prague.
Brenton, Paul 2002. "The Economic Impact of Enlargement on the European Economy: Problemsand Perspectives," CEPS Working Document No. 188, Centre for European PolicyStudies, Brussels, October.
Drabek, Zdenek. 1998. "The Impact of Exchange Rate Regimes on the Stability of Trade Policy,"paper presented at the Annual Convention of the Allied Social Science Association,Chicago, January 4-7
ECE 1994: Economic Survey of Europe in 1993-1994, Economic Commission for Europe, NewYork and Geneva, 1994.
EC 2001, Regular Report from the Commission on Czech Republic's Progress TowardsAccession, Brussels, November.
EC 2002a, Enlargement of the European Union. Guide to the Negotiations. Chapter by Chapter.Directorate-General Enlargement, European Commission, Brussels, October 2002.
EC 2002b, 2002 Regular Report on Slovakia's Progress Towards Accession, Commission of theEuropean Communities, Brussels, October 9, 2002.
EC 2002c, 2002 Regular Report on Czech Republic's Progress Towards Accession, Commissionof the European Communities, Brussels, October 9, 2002.
Engel, Charles, and John H. Rogers. 1996. "How Wide is the Border?" American EconomicReview, Vol. 85, No. 5 (1112 - 25).
FIAS. 2001. Legal Improvements for Attracting Foreign Direct Investment. InternationalFinancial Corporation. Washington D.C.
Hoekman, Bernard M. and Michel M. Kostecki. 2001. The Political Economy of the WorldTrading System: The WTO and Beyond. Oxford University Press, Oxford and New York.
Javorcik, Beata Smarzynska. 2003. "The Composition of Foreign Direct Investment andProtection of Intellectual Property Rights: Evidence from Transition Economies"European Economic Review, forthcoming.
Kaminski, Bartlomiej. 1994. "The Legacy of Communism," in East-Central European Economiesin Transition. Study Papers Submitted to the Joint Economic Committe, Congress of theUnited States, U.S. Government Printing Office, Washington D.C.
Kaminski, Bartlomiej and Beata Smarzynska. 2001. "Integration into global production anddistribution networks through FDI: The case of Poland." Communist Economies &Economic Transformation, Vol. 13. No. 4.
Kaminski, Bartlomiej and Beata Smarzynska. 2002. "Could Deeper Integration within Czech andSlovak Customs Union Provide A Boost to Slovakia's Participation in InternationalProduction Networks?," World Bank mimeo, Washington, DC.
Messerlin, Patrick A. 2001. Measuring the Costs of Protection in Europe. European CommercialPolicy in the 2000s, Institute for International Economics, Washington, D.C.
PlanEcon. 1994. "Slovak Economic Monitor," No. 10-11, Washington D.C., 13 May.

17
World Bank. 1999. Czech Republic: Toward EU Accession, A World Bank Country Study, TheWorld Bank, Washington, D.C. 1999.
WTO. 2001. Trade Policy Review. Czech Republic 2001, World Trade Organization, Geneva,December 2001

18
Statistical Annex
Annex Table 1: Slovak Products with Shares in Czech Republic Total Imports exceeding 33percent in 2000 (four-digit SITC. Rev. 2)
Exports Share in Czech Imports (in %/O)($ million) Factor
Product (SITC Rev I) in 2000 1997 1998 1999 2000 Intensity
6611 LIME 2 99.3 99.0 98.1 94.4 Natural Res.
6612 CEMENT - 27 94.2 92.9 90.1 87.1 Natural Res.
2850 SILVER AND PLATINUM ORES 1 94.9 79.5 65.1 75.7 Natural Res.
0221 MILK CREAM EVAPD,CONDNSD I 57.4 50.0 59.6 75.1 Natural Res.
5711 PREPARED EXPLOSIVES 2 88.6 71.1 75.2 74.8 Capital
7111 STEAM BOILERS 10 13.1 5.3 25.0 73.4 Capital
6727 IRN,STL COIL FR REROLLNG 45 82.8 77.0 73.8 72.0 Skilled labor
1222 CIGARETTES 10 77.6 80.7 82.4 70.0 Natural Res.
2423 SAW-,VENEER-LOGS NON-CON 4 50.5 37.9 45.1 66.6 Natural Res.
5124 ALDEHYDE ETC FNCT CMPNDS 26 75.3 68.8 61.3 64.9 Capital
0619 SUGARS AND SYRUPS NES 10 40.9 65.1 62.0 62.5 Natural Res.
3322 WHITE SPIRIT,KEROSENE 14 0.0 55.9 51.1 61.8 Natural Res.
6747 TINNED PLATES,SHEETS 14 78.0 68.1 77.0 61.7 Skilled labor
2112 CALF AND KIP SKINS 1 42.7 54.0 64.4 60.8 Natural Res.
2411 FUEL WOOD AND WASTE 0 54.5 84.3 54.4 59.3 Natural Res.
3324 RESIDUAL FUEL OILS 192 0.0 57.5 57.1 58.6 Natural Res.
4217 RAPE,COLZA,MUSTARD OILS 5 77.7 59.8 66.3 58.0 Natural Res.
0616 NATURAL HONEY 0 80.4 34.9 32.2 54.9 Natural Res.
0440 MAIZE UNMILLED 6 24.0 66.2 58.5 54.2 Natural Res.
2664 WASTE OF SYN,RGNRTD FBRE 0 53.3 72.8 44.5 54.2 Natural Res.
0482 MALT INCLUDING FLOUR I 0.0 74.3 38.3 53.4 Natural Res.
6715 OTHER FERRO-ALLOYS 29 62.5 53.5 50.4 51.8 Natural Res.
6742 IRN,STL MEDIUM PLATE ETC 68 66.9 52.7 49.6 50.5 Skilled labor5611 CHEM NITROGENOUS FERTLZR 19 62.5 55.1 48.9 50.0 Capital
4311 PROCESD ANML,VEG OIL NES 1 27.0 33.1 41.4 47.6 Natural Res.
6714 FERRO-MANGANESE 4 29.4 42.0 42.7 46.7 Natural Res.
0913 PIG,POULTRY FAT RENDERED 0 91.5 90.1 52 1 45.7 Natural Res.2820 IRON AND STEEL SCRAP 6 81.0 60 1 74.1 44.6 Natural Res.
2412 WOOD CHARCOAL 0 72.9 56.3 82.9 44.1 Natural Res.
2762 REFRACTORY MINERALS NES 7 44.9 40.8 38.5 43.7 Natural Res.
2218 OIL SEEDS,NUTS,ETC NES 4 50.2 51.8 41.6 42.0 Natural Res.
6294 RUBBER BELTING 12 48.4 39.9 45.8 40.2 Skilled labor7112 BOILER HOUSE PLANT NES 1 33.8 18.1 17.0 39.9 Capital
1123 BEER,ALE,STOUT,PORTER 2 26.3 25.8 31.4 39.9 Natural Res.
2433 LUMBER SHAPED NON-CONIFR 13 38.4 37.0 37.3 39.6 Natural Res.
0223 MILK AND CREAM FRESH 9 6.5 6.8 15.4 35.0 Natural Res.
9510 WAR FIREARMS,AMMUNITION 4 0.2 0.7 20.5 34.5 Unskilled Labor
6636 MINRL MFS NES NONCERAMIC 11 30.2 31.3 31.8 34.5 Natural Res.
3510 ELECTRIC ENERGY 17 0.3 0.2 19.7 34.3 Natural Res.
2214 SOYA BEANS,EXCL FLOUR 1 0.9 10.4 40.3 33.2 Natural Res.
0 to 9 ALL GOODS 1,931 8.4 6.9 6.1 6.0
Source: Based on Czech as reporter from UN COMTRADE Statistics.

19
Annex Table 2: Change in the Direction of Trade: The case of Automotive Network inSlovakia, 1995-2000.
l European Union Czech Rep. Memo: Czech R.
Product (SITC Rev. 2) 1995 1998 2000 1995 1998 2000 1ndex, 1995 =
Motor Vehicles Exports in terms of percent 1998 2000
781 Passenger motor cars, for transport 62.3 92.0 87.1 5.4 0.1 0.6 2 11
782 Motor vehicles for transport of goods 2.9 8.1 16.6 63.0 68.2 18.6 108 29
783 Road motor vehicles, others 29.6 69.7 33.2 9.6 21.7 55.5 225 577
722 Tractors fitted or not with power 45.2 31.8 31.4 20.2 9.7 23.4 48 116
74411 Work trucks, mechanic. propel. 65.3 67.7 91.5 17.5 10.5 5.0 60 28
Components
77831 Electr starting & ignition equipment 17.0 35.7 42.0 65.2 42.3 27.8 65 43
77832 Electr.lighting & signaling equip., 5.7 46.5 52.5 62.0 28.1 35.3 45 57
7132 Internal combustion piston engines 13.1 6.i 1S.9 11.8 6.3 17.8 54 150
71623 Generating sets with intemal 4.4 13.3 10.6 78.8 15.9 19.4 20 25combustion pistonParts7139 Parts of intemal comb piston engines 17.4 56.8 77.1 27.7 22.0 8.3 79 30
74419Partsofthetrucks 44.4 8.5 75.7 16.8 0.8 3.3 5 20784 Parts & motor vehicle accessories 31.2 68.4 73.6 57.4 22.1 15.3 39 27
TotalMotor vehicles 42.2 90.0 86.4 24.4 1.3 0.9 5 4
Parts & components 29.1 66.1 72.7 5218 21.7 15.1 41 29
Automotive network as % of all goods (in °/O) 3.8 28.1 29.0 5.0 5.1 4.2 102 84
Motor Vehicles Imports In terms of percent
781 Passenger motor cars,for transport 46.1 43.4 34.0 36.4 40.1 50.0 110 137
782 Motor vehicles for transport of goods 45.5 57.6 66.0 43.4 32.5 22.9 75 53783 Road motor vehicles, others 53.4 61.7 77.2 36.2 16.6 18.3 46 51
722 Tractors fitted or not with power 44.7 43.2' 48.8 18.0 17.7 13.1 98 7374411 Work trucks, mechanic. propeL 74.5 79.1 86.5 18.0 14.2 7.1 79 39
Components77831 Electr.starting& ignition equipment 17.8 82.9 89.5 69.6 11.1 7.5 16 11
77832 Electr.lighting & signaling equip., 34.3 81.4 89.0 56.0 11.3 6.7 20 127132 Intemal combustion piston engines 37.2 47.7 87.7 60.4 8.2 8.5 14 14
71623 Generating sets with intemal 70.2 73.4 85.0 17.6 16.8 10.6 95 60combustion pistonParts7139 Parts of intemal comb piston engines 29.5, 40.2 49.4 62.2 49.4 36.2 79 58
74419Partsofthetrucks 60.3 75.4 86.1 12.7 15.8 4.8 125 38784 Parts & motor vehicle accessories 37.8 88.0 93.3 47.8 4.9 3.5 10 7
Motor vehicles 48.4 48.3 45.3 36.4 35.5 40.7 98 112Parts & components 36.0 85.7 92.4 51.1 6.2 4.2 12 8Automotive network as % of all goods (in %/6) 7.2 17.7 17.6 8.0 13.8 12.9 171 161
Source: Based on Slovakia as reporter from UN COMTRADE Statistics.


Policy Research Working Paper Series
ContactTitle Author Date for paper
WPS2938 Recurrent Expenditure Requirements Ron Hood December 2002 M Galatisof Capital Projects Estimation for David Husband 31177Budget Purposes Fei Yu
WPS2939 School Attendance and Child Labor Gladys L6pez-Acevedo December 2002 M Gellerin Ecuador 85155
WPS2940 The Potential Demand for an HIV/ Hillegonda Maria Dutilh December 2002 H SladovichAIDS Vaccine in Brazil Novaes 37698
Expedito J A LunaMois6s GoldbaumSamuel KilsztajnAnaclaudia RossbachJose de la Rocha Carvalheiro
WPS2941 Income Convergence during the Branko Milanovic January 2003 P SaderDisintegration of the World 33902Economy, 1919-39
WPS2942 Why is Son Preference so Persistent Monica Das Gupta January 2003 M. Das Guptain East and South Asia? A Cross- Jiang Zhenghua 31983Country Study of China, India, and the Li BohuaRepublic of Korea Xie Zhenming
Woojin ChungBae Hwa-Ok
WPS2943 Capital Flows, Country Risk, Norbert Fiess January 2003 R Izquierdoand Contagion 84161
WPS2944 Regulation, Productivity, and Giuseppe Nicoletti January 2003 Social ProtectionGrowth OECD Evidence Stefano Scarpetta Advisory Service
85267
WPS2945 Micro-Finance and Poverty: Evidence Shahidur R Khandker January 2003 D AfzalUsing Panel Data from Bangladesh 36335
WPS2946 Rapid Labor Reallocation with a Jan Rutkowski January 2003 J RutkowskiStagnant Unemployment Pool. The 84569Puzzle of the Labor Market in Lithuania
WPS2947 Tax Systems in Transition Pradeep Mitra January 2003 S TassewNicholas Stern 88212
WPS2948 The Impact of Contractual Savings Gregorio Impavido January 2003 P BraxtonInstitutions on Securities Markets Alberto R Musalem 32720
Thierry Tressel
WPS2949 Intersectoral Migration in Southeast Rita Butzer January 2003 P KokilaAsia: Evidence from Indonesia, Yair Mundlak 33716Thailand, and the Philippines Donald F Larson
WPS2950 Is the Emerging Nonfarm Market Dominique van de Walle January 2003 H SladovichEconomy the Route Out of Poverty Dorothyjean Cratty 37698in Vietnam?
WPS2951 Land Allocation in Vietnam's Martin Ravallion January 2003 H SladovichAgrarian Transition Dominique van de Walle 37698

Policy Research Working Paper Series
ContactTitle Author Date for paper
WPS2952 The Effects of a Fee-Waiver Program Nazmul Chaudhury January 2003 N Chaudhuryon Health Care Utilization among the Jeffrey Hammer 84230Poor: Evidence from Armenia Edmundo Murrugarra
WPS2953 Health Facility Surveys: An Magnus Lindelow January 2003 H. SladovichIntroduction Adam Wagstaff 37698


![L'AWi S :138a7 - World Bankdocuments.worldbank.org/curated/en/753431468765038686/pdf/multi0... · [de]centalization by a [de]centralization ratio of taxing or spending powers, i.e.,](https://img.pdfslide.net/doc/110x75/5b92393409d3f2446f8b4624/lawi-s-138a7-world-decentalization-by-a-decentralization-ratio-of-taxing.jpg)