Embed Size (px)
Citation preview

2010 WTERT
WTERT research on resource recovery from wastes by gasification
Marco J. Castaldi Department of Earth & Environmental EngineeringHenry Krumb School of Mines, Columbia University
WTERT 2010 Bi-Annual Meeting at Columbia UniversityNEW YORK CITY, OCTOBER 7 & 8, 2010

2010 WTERT
Summary (from WTERT 2004)• Developing Novel Technologies for Improved MSW Applications
Efficiency GainsEmission ReductionsDynamic Control
• Drawing on ExpertiseChemical Mechanism DevelopmentHigh Temperature KineticsCatalytic Reactor Design
• PostersCatalytic Rubber Gasification (Kwon)Waste Plastic Gasification to Useful Chemicals (Llewelyn)Greenhouse Gas Reforming (Castaldi)Corrosion Phenomena in WTE Facilities (Albina)Size and Shape Analysis of Particles in WTE Facilities (Nakamora)Breaking Down Municipal Solid Waste for Combustion (Whitworth)
2010 WTERT
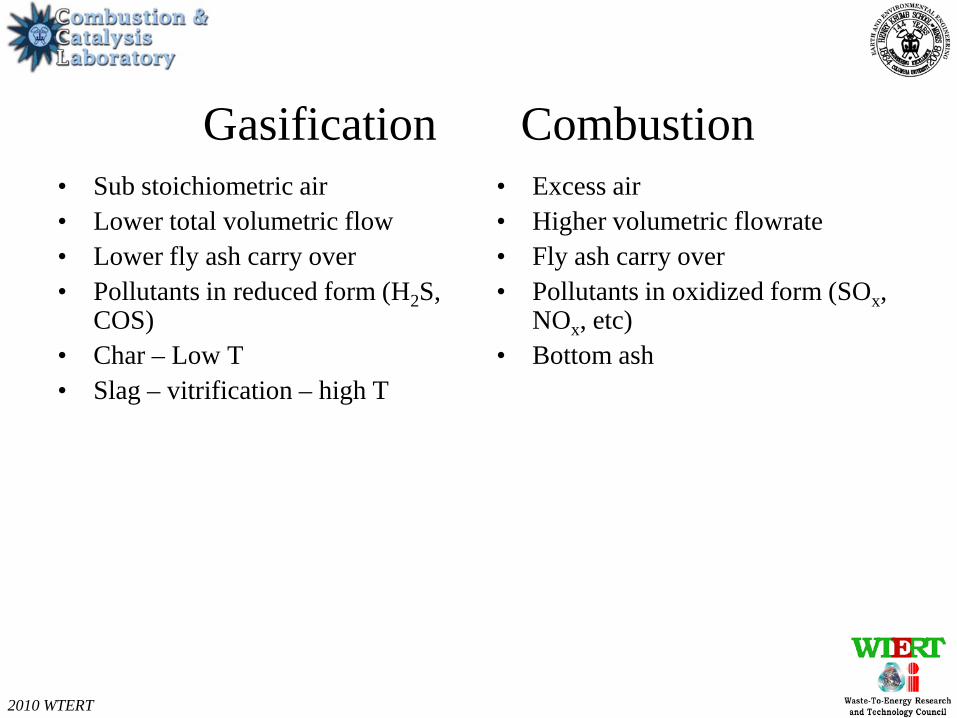
Gasification Combustion• Sub stoichiometric air• Lower total volumetric flow• Lower fly ash carry over• Pollutants in reduced form (H2S,
COS)• Char – Low T• Slag – vitrification – high T
• Excess air• Higher volumetric flowrate• Fly ash carry over• Pollutants in oxidized form (SOx,
NOx, etc)• Bottom ash

2010 WTERT
CO & H2 --------- CO2 & H2O
Transitioning from chemical rearrangement to heat generation, thus Carnot cycle comes into play
Thermodynamic Efficiency Analysis
Source: M. J. Prins et al. / Chemical Engineering Science 58 (2003) 1003 – 1011

2010 WTERT
Enhanced Char Burnout: CO2
Douglas Fir: 0% CO2
• Identical time on stream, reaction
temperature profile, total flow rate
• Physical evidence of more efficient
gasification with CO2
Observed for 100’s samples tested
Douglas Fir: 30% CO2
Walnut Shells: 0% CO2 Walnut Shells: 30% CO2
~20% biomass
remaining<2% remaining as
inorganic ash
2010 WTERT
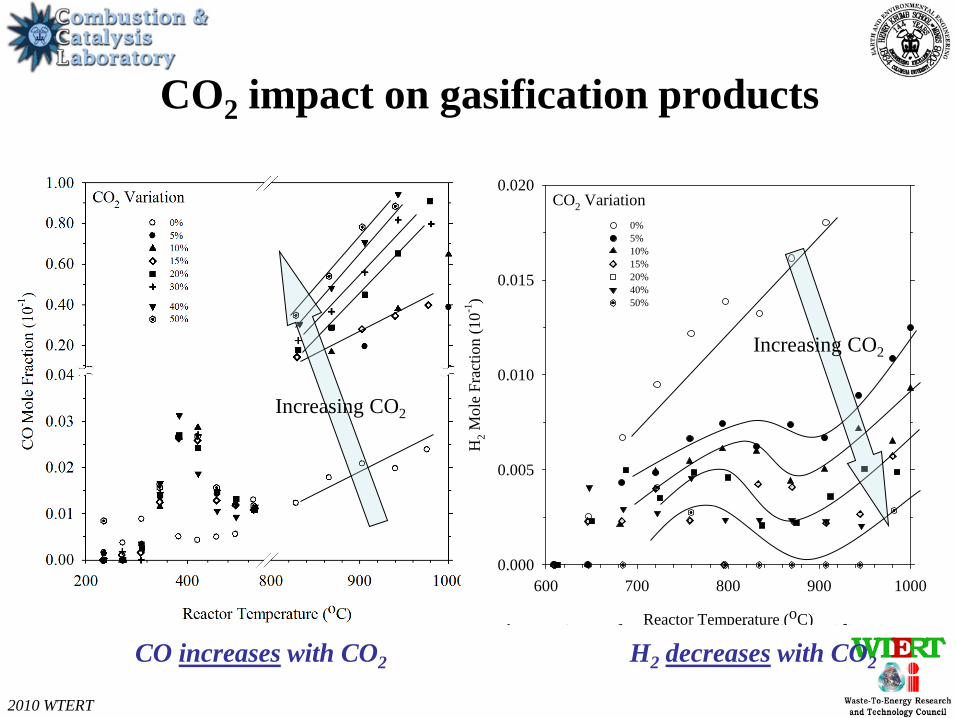
CO2 impact on gasification products
Fi 1 H d i i h CO ifi i
Reactor Temperature (oC)
600 700 800 900 1000
H2 M
ole
Frac
tion
(10-1
)
0.000
0.005
0.010
0.015
0.020
0% 5%10%15%20%40%50%
CO2 Variation
Increasing CO2
Increasing CO2
CO increases with CO2 H2 decreases with CO2

2010 WTERT
0
0.5
1
1.5
2
2.5
3
3.5
4
4.5
5
5.5
0% 10% 20% 30% 40% 50%
% CO2 added to gasification influent
H2/C
O p
rodu
ced
in g
asifi
er
H2/CO (Syngas) Tuning• Fuels • Chemicals• Combustion• Fuel cells
Fisher Tropsch – diesel fuels
Gas Turbine Combustion – Low NOx operation/good stability
Fisher Tropsch – Fe & Co-basedCatalyst processes
specialty chemicals
SOFC operation

2010 WTERT
20.7 16.66
15.6020.03
N
N
CH3
CH3
1
2
3
4
5
6
7
Peak Identification
Fuel Synthesis from Waste Streams

2010 WTERT
Combustion Gasification
Model
Model
Experiment & Simulation Comparison

2010 WTERT
Experiment & Simulation “Scale Up”
O2/Coal=0.6
O2/Coal=0.9O2/Coal=0.9CO2 Recycle
O2/Coal=0.6CO2 Recycle
TGA (~20 mg)
Drop tube (~ 2 g/min)
Image Source: Tondu Corporation, Houston, Texas 77079Plant Simulation (ASPEN ®)

2010 WTERT
Evaluation of Field Systems
• Technical and Economic AnalysisMS Thesis – Caroline Ducharme “Technical and economic analysis of
Plasma-assisted Waste-to-Energy processes”
• Mass and energy balances were developed for each process– Company data & engineering estimates
– Economic analysis comparison to grate combustion systems
• Plasma Technologies– InEnTec– Europlasma– Alter NRG– Plasco

2010 WTERT
INENTEC Plasma Unit
Integration:• Gasifier• Plasma Unit• Thermal Residence Unit
All operated in “sweet spot”

2010 WTERT
WasteManagement & InEnTec

2010 WTERT
EuroplasmaSystem:• Stoker Grate Gasifier• Plasma Unit for Syngas Cleaning• Plasma Unit for Ash Vitrification• Commercial Startup April 2011.• Plant capacity will be 50,000 tons/y• Net electrical output 12 MW
2010 WTERT
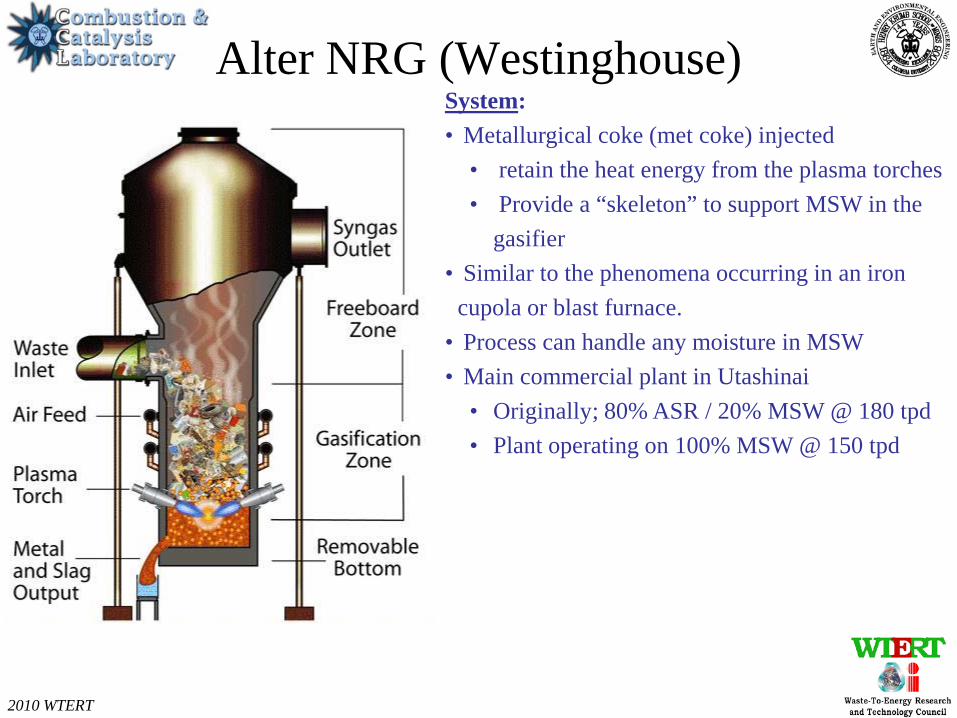
Alter NRG (Westinghouse)System:• Metallurgical coke (met coke) injected
• retain the heat energy from the plasma torches• Provide a “skeleton” to support MSW in the
gasifier• Similar to the phenomena occurring in an iron
cupola or blast furnace. • Process can handle any moisture in MSW • Main commercial plant in Utashinai
• Originally; 80% ASR / 20% MSW @ 180 tpd• Plant operating on 100% MSW @ 150 tpd

2010 WTERT
PlascoSystem:• Demonstration plant in Ottawa built in 2008• Two stages process:
• Horizontal Traditional gasification @ 700°C• Syngas Production: plasma torches @ 1200°C.
• Electricity production• syngas GT combustion• Waste heat for combined cycle.

2010 WTERT
Plasma Field System SummaryTechnology Energy (kWh/ton) Capital Costs ($/ton)
InEnTec 530 ~77 (est)
Alter NRG 617 81
Europlasma 605 86
Plasco 530 86
Grate WTE (US avg) 550 60

2010 WTERT
Landfill Gas Utilization
More reactive system; Reduce/eliminate secondary fuel usage
BurnerIC Engine
Gas Turbine
Heat, CO2,Steam, Energy
LFG
Air
H2,CO
Bleed LFG
catalyticreactor
Bleed Air
Flow Splitter/mixer
Secondary fuel
Kohn, M., et al.” App. Catal. B: Environ, (94), 2010, 125-133.Barrai, F.; et al. Catalysis Today 2007, 129, (3-4), 391-396.

2010 WTERT
LFG Catalytic Reaction Regions
CO2
CH4
H2
CO
O2H2O
Monolith Outlet Temperature
0
100
200
300
400
500
600
700
800
0%
2%
4%
6%
8%
10%
12%
14%
16%
0 0.5 1 1.5 2 2.5 3 3.5 4
Tem
pera
ture
(deg
C)
Mol
ar F
ract
ion
Time (hours)
1 2 3 4
CombustionCH4 + 2O2 CO2 + 2H2O
Steam ReformingCH4 + H2O 3H2 + CO
Dry ReformingCH4 + CO2 2H2 + 2CO
rWater Gas ShiftCO2 + H2 CO + H2O

2010 WTERT
Test Apparatus @ CCL
200 kWe Design Concept2 kWe Laboratory test engine
Catalytic reactor

2010 WTERT
0
50
100
150
200
250
300
0% 10% 20% 30% 40% 50%
CO2 fraction
NO
X [p
pm]
0.2kW0.4kW0.6kW0.8kW0.2 kW simulation0.4 kW simulation0.6 kW simulation0.8 simulation
0
20
40
60
80
100
120
140
160
180
200
0% 5% 10% 15%
syngas fraction
NO
X [p
pm]
0.2kW0.4kW0.6kW0.8kW0.2kW simulation0.4 kW simulation0.6 kW simulation0.8 kW simulation
CO2 reduction of N radical concentration N + CO2 NCO + O
Reduce prompt mechanism by reacting with fuel radicalsCHx + CO2 CHO + CO
CO2 also serves as diluent – reduces concentrationsRCHN = kCCHN CCHN is reducedRN2O = kCN2 CO
LFG and Syngas impact on NOX

2010 WTERT
Test data from Honda Engine on LFG
Test data shows lower emissions possible across all loads utilizing syngas produced from LFG
•SLFG = simulated landfill gas
•10% syngas added = SLFG mixed with 10% syngas
2010 WTERT
Looking over the horizon• Next generation combustors – higher energy density
– Low NOx operation– Approach 3+ MW m-2
• Liquefaction of wastes (T ~ 300 – 500 ºC)– Removal of O2
• In-situ reduction of corrosive gases– Injection of halogen scavengers
• Novel uses of ash – catalytic and property adjustment
• LFGTE Applications and LFG to fuels– Casella Energy to implement in DE

2010 WTERT
Acknowledgments• Collaborators
– Tuncel Yegulalp, Columbia Univ.
– Robert Farrauto, BASF Catalysts, LLC.
• Students– Alex Frank (WTE Modeling – Poster)
– Natali Ganfer (LFGTE Engine Testing – Poster)
– Naomi Klinghoffer (Beneficial Use of Ash - Poster)
– McKenzie Primerano (LFGTE Catalyst Testing – Poster)
– Garrett Fitzgerald (Hydrates – Poster)
– Caroline Ducharme (Plasma Gasification)
– Amanda Simson
– Federico Barrai
– Kelly Westby (ugrad)
• Visiting Scholars – Jin Yuqi, Zhejiang University
– John Dooher, Adelphi University
– Zhixiao Zhang, Hangzhou University
• Post-Docs – Eilhann Kwon
– Heidi Butterman
You, the audience for listening
Please visit CCLlabs.org

2010 WTERTM. J. Prins et al. / Chemical Engineering Science 58 (2003) 1003 – 1011
C (s) + gas
Gas only – no C(s)
• Most HC fuels (CxHyOzNaSb) exist above lines
• Need oxygen source or hydrogen to get below
(CO2, O2, air H2O, H2)

2010 WTERT
Total energy constant
Once all carbon is converted, more air does not help
Rearrangement (chemical Exergy)
Heating (physical Exergy)
Begin combustion reactions regime

2010 WTERT
Combustion & Catalysis Lab (CCL)H2
CO/H2 – engine application
electricity
CO2
To market or community. Stock: plastic furniture household etc
C2H2
plastics or raw materials
Alternative CH4/CO2source – Landfill gas
CH4Hydrates
CO2 CH4
CO2
H2OElec.
H2 + CO2
Air
FuelReforming
Fuel Cell
CO2 capture &GHG reforming
Biomas andWaste to Energy (WTE)
Other fuelsFuelCell
“The nature of environmental issues is changing from a regulatory to a resource focus” R. MacLean, Env. Protec. April 2003, P.12
Resources for energy production will continue to be in demand

2010 WTERT
Stiochiometry & Equilibrium
Ref: STANJAN calculations
C + O2 CO2 + 2H2ODeep Ox 2H2 + COC + O2
Partial Ox
0
0.05
0.1
0.15
0.2
0.25
0.3
0.35
0.4
0 0.1 0.2 0.3 0.4 0.5 0.6 0.7
CH4/Air
Com
posi
tion
0
500
1000
1500
2000
2500
Tem
pera
ture
( o C
)
H2
H2O CO
CO2
Temperature
C / Air


![Home Page | California State Water Resources Control Board · 2016-01-27 · Environmental Law > Solid Wastes > Resource Recovery & Recycling [HN9] The Resource Conservation and Recovery](https://img.pdfslide.net/doc/110x75/5f530bf5bd22ea29ea4659d2/home-page-california-state-water-resources-control-board-2016-01-27-environmental.jpg)