Embed Size (px)
Citation preview

WTO accession and WTO accession and benefits from FDI:benefits from FDI:The case of VietnamThe case of Vietnam
Jean Louis BRILLET (INSEE)TRAN Thi Anh-Dao (CARE, University of Rouen, and CEPN, University of Paris XIII)
LINK spring meetingSt Petersburg June 4-6, 2009
Outline of the presentationOutline of the presentation
The importance of FDIIntegrating FDI in a macroeconomic model
◦Formalizing its determinants ◦Assessing its impact
Applied to the context of WTO accession◦The direct measures◦The structural changes, the policy
decisions

The determinants of FDIThe determinants of FDI
The level of skills and labor costs, the production costs -> profitability
The infrastructuresThe access to financeThe macroeconomic policy, the
regulatory and legal framework, sound institutions
The potential markets and the regional context
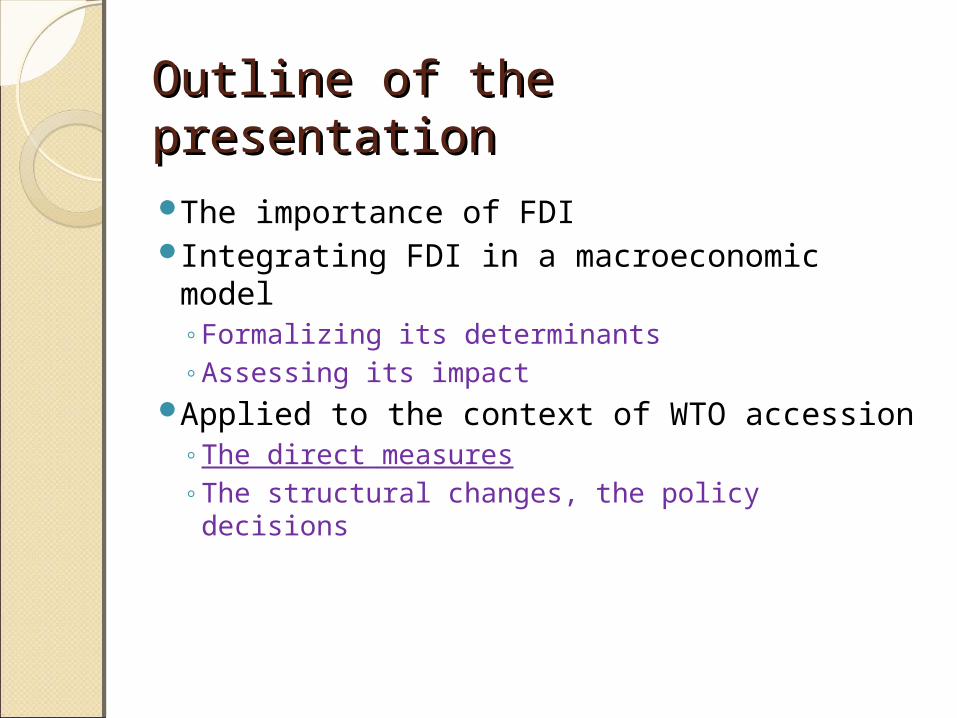
FDI and developmentFDI and developmentFDI should improve the processBy increasing growth
◦Capacity ◦Factor productivity◦Technology transfers◦Exports◦Revenue
But no statistical evidenceThe reason : no complete picture
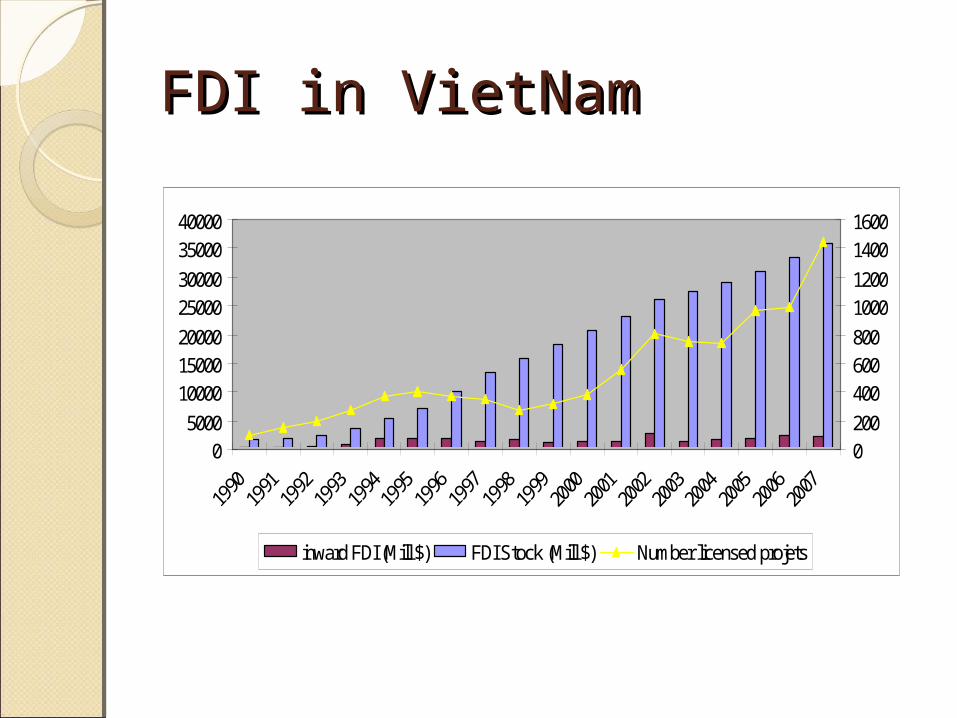
FDI in VietNamFDI in VietNam
05000
100001500020000
2500030000
3500040000
0200
400600800
10001200
14001600
inward FDI (Mill $) FDI Stock (Mill $) Number licensed projets
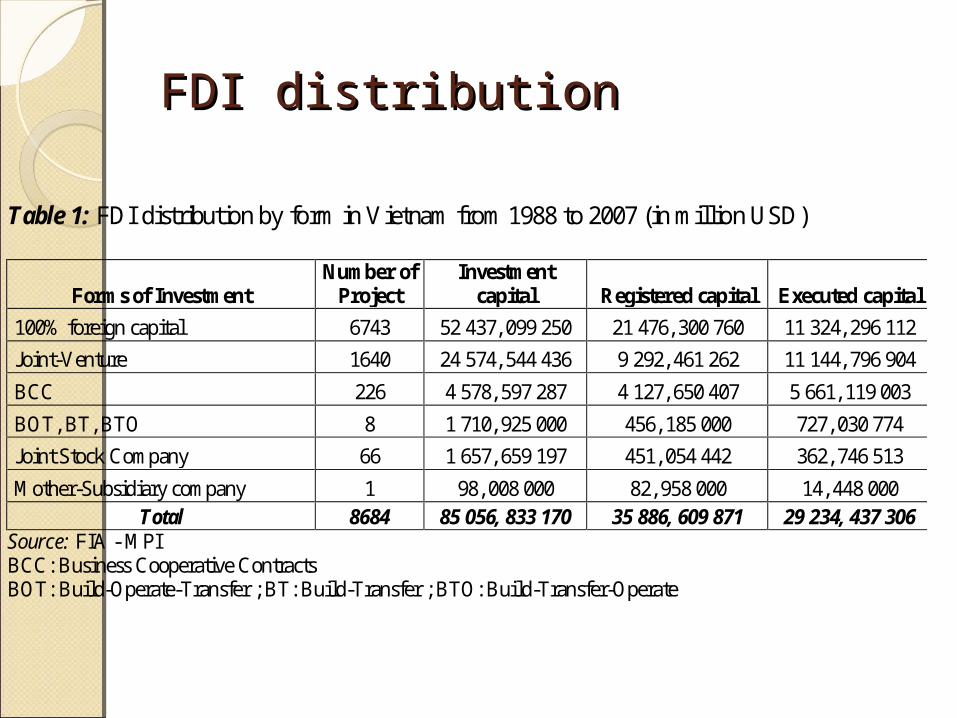
FDI distributionFDI distribution
Table 1: FDI distribution by form in Vietnam from 1988 to 2007 (in million USD)
Forms of Investment Number of
Project Investment
capital Registered capital Executed capital
100% foreign capital 6743 52 437, 099 250 21 476, 300 760 11 324, 296 112
Joint-Venture 1640 24 574, 544 436 9 292, 461 262 11 144, 796 904
BCC 226 4 578, 597 287 4 127, 650 407 5 661, 119 003
BOT, BT, BTO 8 1 710, 925 000 456, 185 000 727, 030 774
Joint Stock Company 66 1 657, 659 197 451, 054 442 362, 746 513
Mother-Subsidiary company 1 98, 008 000 82, 958 000 14, 448 000 Total 8684 85 056, 833 170 35 886, 609 871 29 234, 437 306
Source: FIA - MPI BCC: Business Cooperative Contracts BOT: Build-Operate-Transfer ; BT: Build-Transfer ; BTO: Build-Transfer-Operate
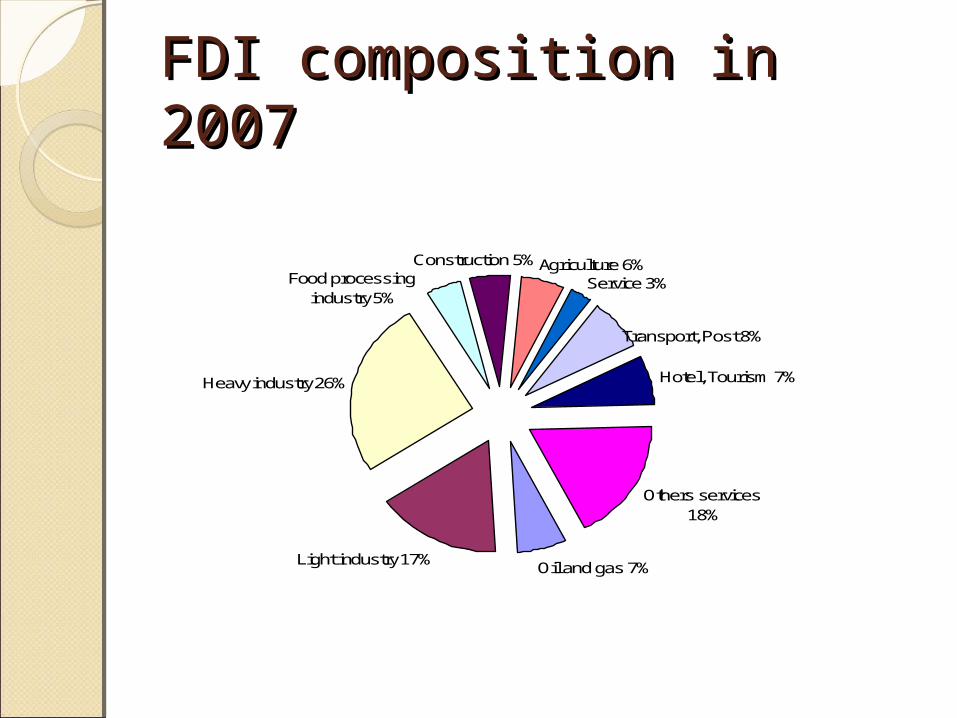
FDI composition in 2007FDI composition in 2007
Oil and gas 7%Light industry 17%
Construction 5%Agriculture 6%
Hotel, Tourism 7%
Others services 18%
Service 3%
Transport, Post 8%
Food processing industry 5%
Heavy industry 26%
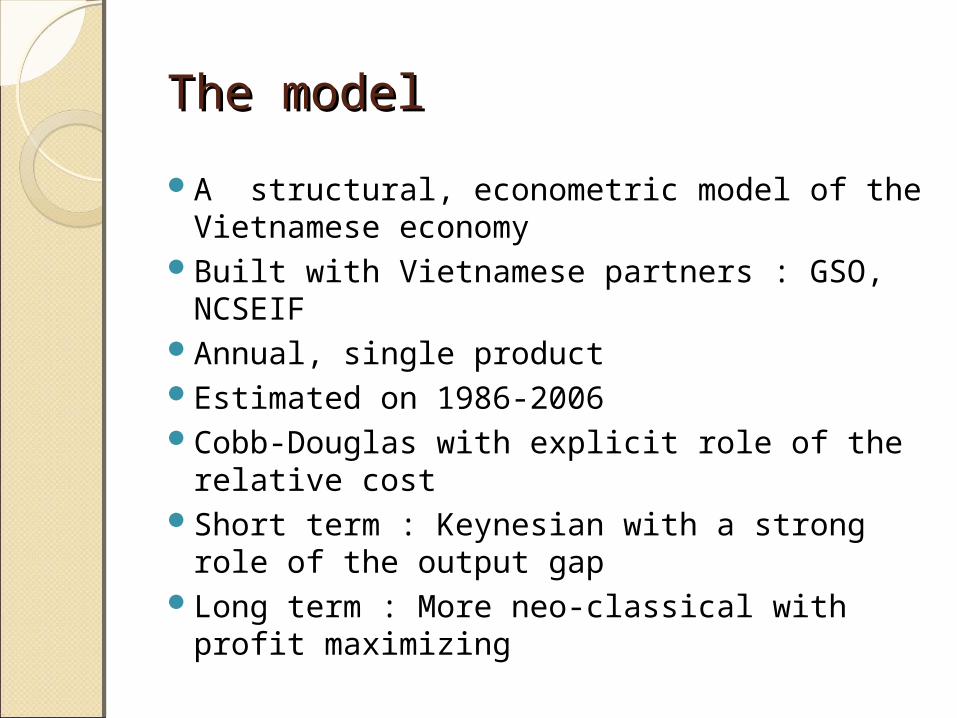
The modelThe model
A structural, econometric model of the Vietnamese economy
Built with Vietnamese partners : GSO, NCSEIF
Annual, single productEstimated on 1986-2006Cobb-Douglas with explicit role of the
relative costShort term : Keynesian with a strong role of
the output gapLong term : More neo-classical with profit
maximizing

Formalizing FDI determinationFormalizing FDI determination
Relative to total capital evolution, FDI depends on
The output gap◦ Sales prospects on the local and foreign markets
The profits rate◦ Compared implicitly with other countries’◦ Contains the output gap◦ Sensitive also to the margins rate, the productivity of
capital, and the ratio of production and demand deflators (sensitive to tariffs)
◦ PR = Marg / (pk K) = MR . pq / pk . UR . prodkCrowding out substitution : -0.3 (calibrated)
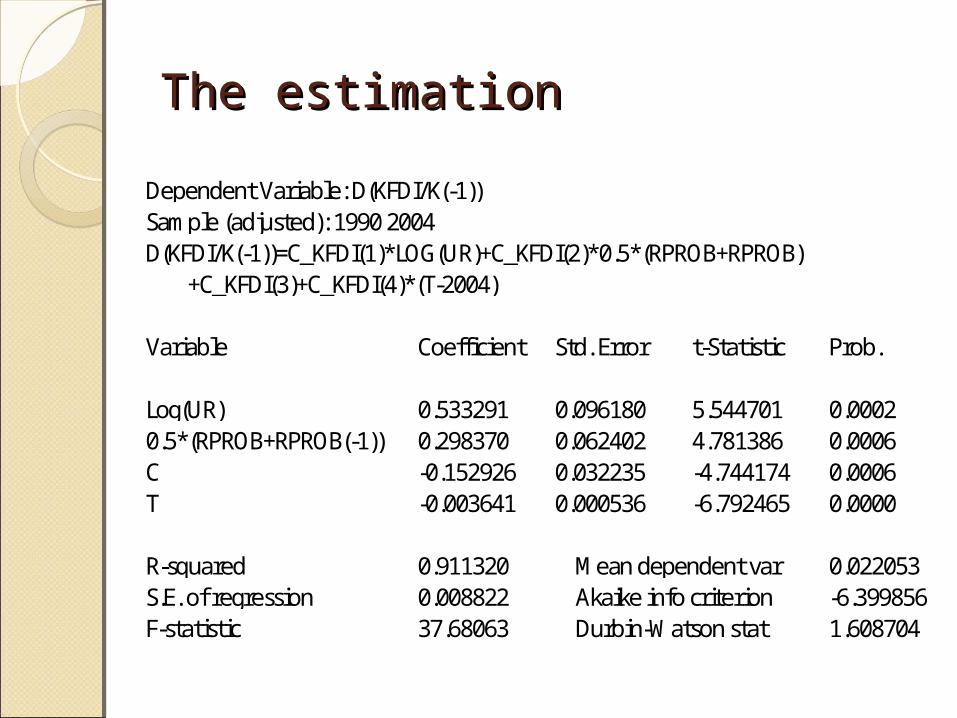
The estimationThe estimation
Dependent Variable: D(KFDI/K(-1))Sample (adjusted): 1990 2004D(KFDI/K(-1))=C_KFDI(1)*LOG(UR)+C_KFDI(2)*0.5*(RPROB+RPROB) +C_KFDI(3)+C_KFDI(4)*(T-2004)
Variable Coefficient Std. Error t-Statistic Prob.
Log(UR) 0.533291 0.096180 5.544701 0.00020.5*(RPROB+RPROB(-1)) 0.298370 0.062402 4.781386 0.0006C -0.152926 0.032235 -4.744174 0.0006T -0.003641 0.000536 -6.792465 0.0000
R-squared 0.911320 Mean dependent var 0.022053S.E. of regression 0.008822 Akaike info criterion -6.399856F-statistic 37.68063 Durbin-Watson stat 1.608704

The production functionThe production function
Estimation Method: Seemingly Unrelated RegressionSample: 1990 2004
Equation: LOG(K*k_corr/QA)=-b*T-c+alpha*LOG(RELC)+c_fdi*LOG(KFDI(-1)/K(-1))S.E. of regression 0.146 Sum squared resid 0.216
Equation: LOG(LE/QA)=-b*T-c+(alpha-1)*LOG(RELC)+c_fdi*LOG(KFDI(-1)/K(-1))S.E. of regression 0.118 Sum squared resid 0.155
Coefficient Std. Error t-Statistic Prob. Capital correction 0.144 0.008057 17.90685 0.0000Time trend -3.67E-05 0.00425 -0.008613 0.993 Constant 1.776 8.520 0.208508 0.836 Alpha 0.655 0.1825 3.590637 0.0014KFDI elasticity -0.228112 0.05066 -4.502119 0.0001
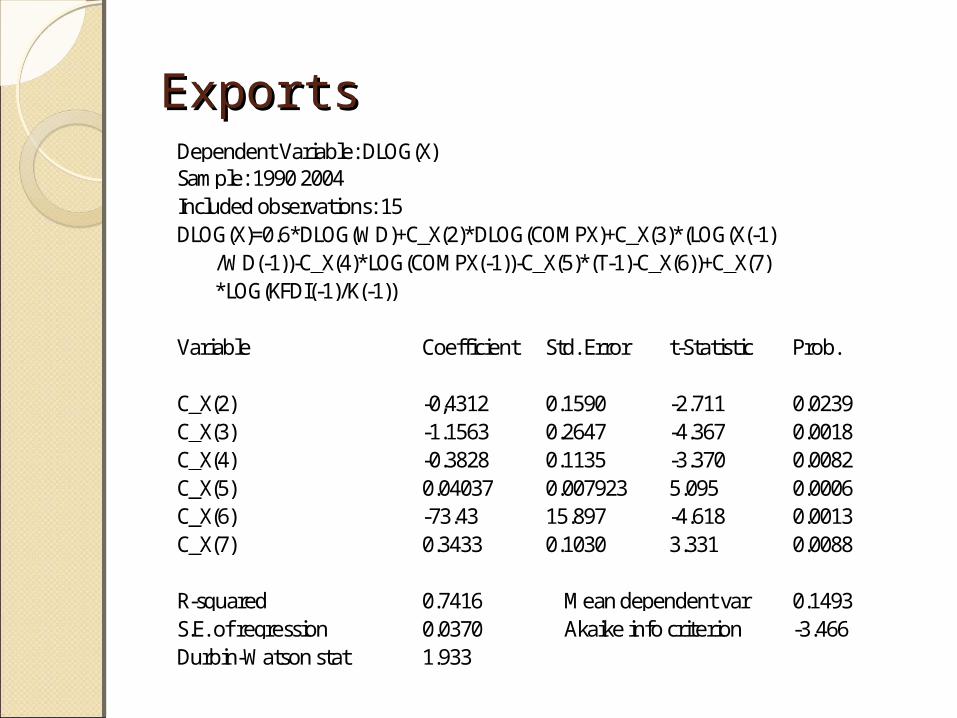
ExportsExportsDependent Variable: DLOG(X)Sample: 1990 2004Included observations: 15DLOG(X)=0.6*DLOG(WD)+C_X(2)*DLOG(COMPX)+C_X(3)*(LOG(X(-1) /WD(-1))-C_X(4)*LOG(COMPX(-1))-C_X(5)*(T-1)-C_X(6))+C_X(7) *LOG(KFDI(-1)/K(-1))
Variable Coefficient Std. Error t-Statistic Prob.
C_X(2) -0,4312 0.1590 -2.711 0.0239C_X(3) -1.1563 0.2647 -4.367 0.0018C_X(4) -0.3828 0.1135 -3.370 0.0082C_X(5) 0.04037 0.007923 5.095 0.0006C_X(6) -73.43 15.897 -4.618 0.0013C_X(7) 0.3433 0.1030 3.331 0.0088
R-squared 0.7416 Mean dependent var 0.1493S.E. of regression 0.0370 Akaike info criterion -3.466Durbin-Watson stat 1.933

graphgraph
Investment
Global factor
Product
Foreign Direct Invest
Rate of use
Final dema
nd
Capacity
GDP
Prices
Labor
Wage rate
Capital
FDI share
in capital
Factorcost
Profitability
World deman
d
Exports
Imports
FDI in the model
0.0
0.2
0.4
0.6
0.8
1.0
1.2
1.4
08 10 12 14 16 18 20 22 24 98 00
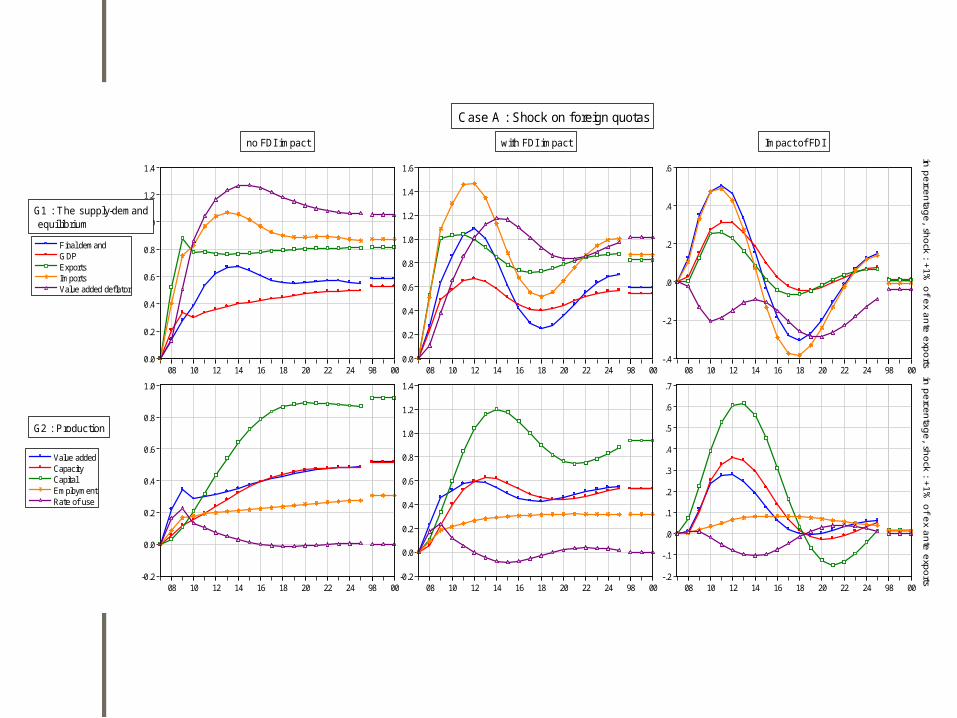
Final demandGDPExportsImportsValue added deflator
G1 : The supply-demand equil ibrium
no FDI impact
0.0
0.2
0.4
0.6
0.8
1.0
1.2
1.4
1.6
08 10 12 14 16 18 20 22 24 98 00
Case A : Shock on f oreign quotas
with FDI impact
-.4
-.2
.0
.2
.4
.6
08 10 12 14 16 18 20 22 24 98 00
in p
erce
nta
ge
, sho
ck : +1
% o
f ex a
nte
exp
orts
Impact of FDI
-0.2
0.0
0.2
0.4
0.6
0.8
1.0
08 10 12 14 16 18 20 22 24 98 00
Value addedCapacityCapitalEmploymentRate of use
G2 : Production
-0.2
0.0
0.2
0.4
0.6
0.8
1.0
1.2
1.4
08 10 12 14 16 18 20 22 24 98 00-.2
-.1
.0
.1
.2
.3
.4
.5
.6
.7
08 10 12 14 16 18 20 22 24 98 00
in p
erce
nta
ge
, sho
ck : +1
% o
f ex a
nte
exp
orts
-.1
.0
.1
.2
.3
.4
.5
.6
.7
08 10 12 14 16 18 20 22 24 98 00
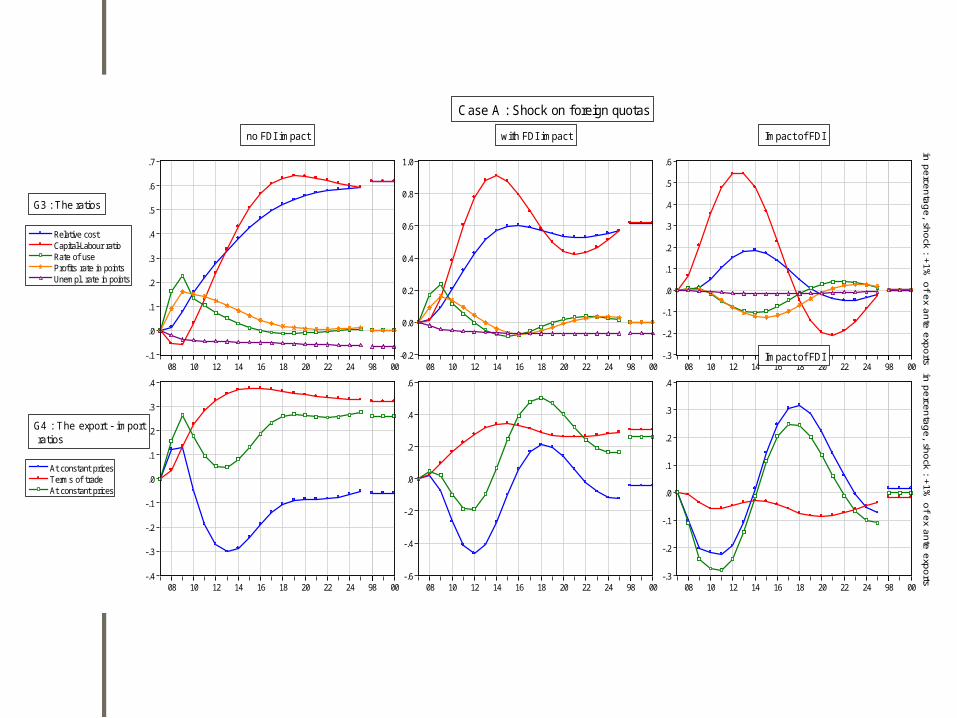
Relative costCapital-Labour ratioRate of useProfits rate in pointsUnempl. rate in points
G3 : The ratios
no FDI impact
-0.2
0.0
0.2
0.4
0.6
0.8
1.0
08 10 12 14 16 18 20 22 24 98 00
Case A : Shock on f oreign quotas
with FDI impact
-.3
-.2
-.1
.0
.1
.2
.3
.4
.5
.6
08 10 12 14 16 18 20 22 24 98 00
in p
erce
nta
ge
, sho
ck : +1
% o
f ex a
nte
exp
orts
Impact of FDI
-.4
-.3
-.2
-.1
.0
.1
.2
.3
.4
08 10 12 14 16 18 20 22 24 98 00
At constant pricesTerms of tradeAt constant prices
G4 : The export - import ratios
-.6
-.4
-.2
.0
.2
.4
.6
08 10 12 14 16 18 20 22 24 98 00-.3
-.2
-.1
.0
.1
.2
.3
.4
08 10 12 14 16 18 20 22 24 98 00
Impact of FDI
in p
erce
nta
ge
, sho
ck : +1
% o
f ex a
nte
exp
orts

-1
0
1
2
3
-.1
.0
.1
.2
.3
08 10 12 14 16 18 20 22 24 98 00
Foreign direct investment in points of IPProductive investmentFDI capitalCapitalRate of use / right scaleProfits rate in points / right scale
Case A : Shock on foreign quotas Foreign Direct Investment - with FDI impact
in p
erc
enta
ge
shock : +1% of ex ante exports
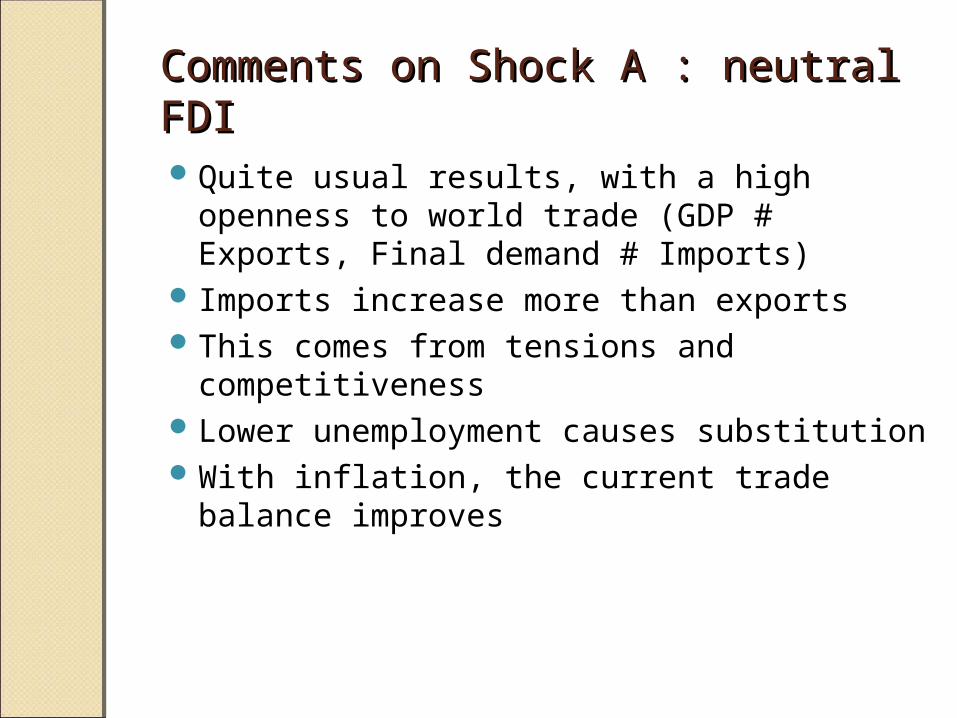
Comments on Shock A : neutral FDIComments on Shock A : neutral FDI
Quite usual results, with a high openness to world trade (GDP # Exports, Final demand # Imports)
Imports increase more than exportsThis comes from tensions and
competitivenessLower unemployment causes substitutionWith inflation, the current trade balance
improves
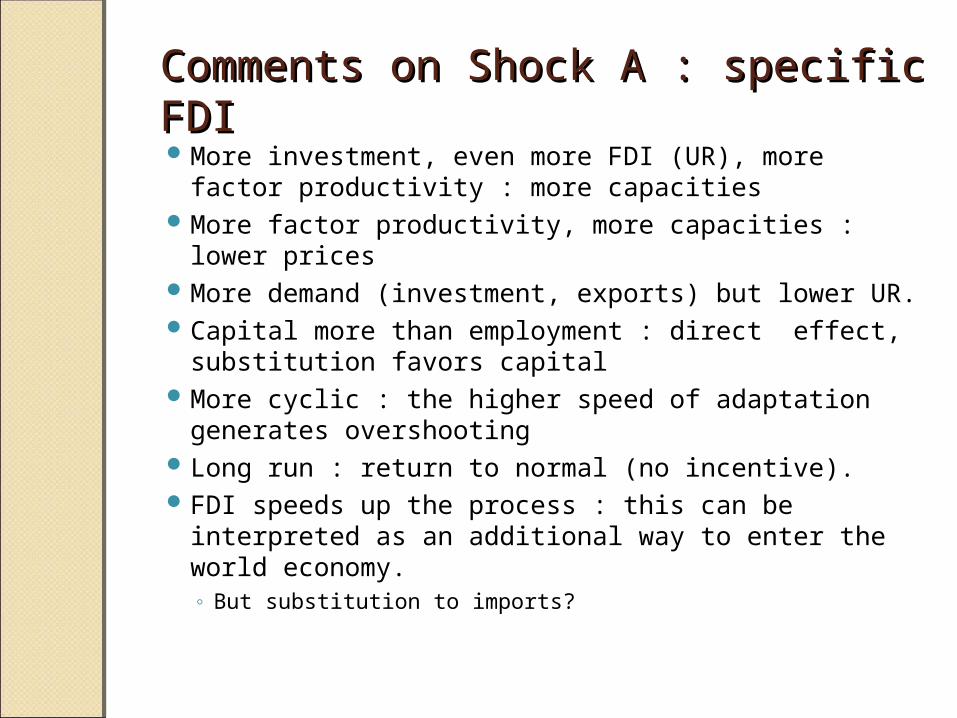
Comments on Shock A : specific Comments on Shock A : specific FDIFDIMore investment, even more FDI (UR), more factor
productivity : more capacitiesMore factor productivity, more capacities : lower
pricesMore demand (investment, exports) but lower UR.Capital more than employment : direct effect,
substitution favors capitalMore cyclic : the higher speed of adaptation
generates overshootingLong run : return to normal (no incentive).FDI speeds up the process : this can be interpreted
as an additional way to enter the world economy.◦ But substitution to imports?
-1.6
-1.2
-0.8
-0.4
0.0
0.4
08 10 12 14 16 18 20 22 24 98 00
Final demandGDPExportsImportsValue added deflator
G1 : The supply-demand equil ibrium
no FDI impact
-1.6
-1.2
-0.8
-0.4
0.0
0.4
0.8
08 10 12 14 16 18 20 22 24 98 00
Case B : Shock on local quotas
with FDI impact
-.8
-.6
-.4
-.2
.0
.2
.4
.6
08 10 12 14 16 18 20 22 24 98 00
in p
erce
nta
ge
, sho
ck : +1
% o
f ex a
nte
imp
orts
Impact of FDI
-1.4
-1.2
-1.0
-0.8
-0.6
-0.4
-0.2
0.0
0.2
08 10 12 14 16 18 20 22 24 98 00
Value addedCapacityCapitalEmploymentRate of use
G2 : Production
-2.0
-1.6
-1.2
-0.8
-0.4
0.0
0.4
08 10 12 14 16 18 20 22 24 98 00-1.0
-0.8
-0.6
-0.4
-0.2
0.0
0.2
08 10 12 14 16 18 20 22 24 98 00
in p
erce
nta
ge
, sho
ck : +1
% o
f ex a
nte
imp
orts
-1.0
-0.8
-0.6
-0.4
-0.2
0.0
0.2
08 10 12 14 16 18 20 22 24 98 00
Relative costCapital-Labour ratioRate of useProfits rate in pointsUnempl. rate in points
G3 : The ratios
no FDI impact
-1.4
-1.2
-1.0
-0.8
-0.6
-0.4
-0.2
0.0
0.2
08 10 12 14 16 18 20 22 24 98 00
Case B : Shock on local quotas
with FDI impact
-.8
-.6
-.4
-.2
.0
.2
.4
08 10 12 14 16 18 20 22 24 98 00
in p
erce
nta
ge
, sho
ck : +1
% o
f ex a
nte
imp
orts
Impact of FDI
-.4
-.2
.0
.2
.4
.6
08 10 12 14 16 18 20 22 24 98 00
At constant pricesTerms of tradeAt constant prices
G4 : The export - import ratios
-0.6
-0.4
-0.2
0.0
0.2
0.4
0.6
0.8
1.0
08 10 12 14 16 18 20 22 24 98 00-.6
-.4
-.2
.0
.2
.4
.6
08 10 12 14 16 18 20 22 24 98 00
Impact of FDI
in p
erce
nta
ge
, sho
ck : +1
% o
f ex a
nte
imp
orts

-4
-3
-2
-1
0
1
-.4
-.3
-.2
-.1
.0
.1
.2
08 10 12 14 16 18 20 22 24 98 00
Foreign direct investment in points of IPProductive investmentFDI capitalCapitalRate of use / right scaleProfits rate in points / right scale
Case B : Shock on local quotas Foreign Direct Investment - with FDI impact
in p
erc
enta
ge
shock : +1% of ex ante im
ports
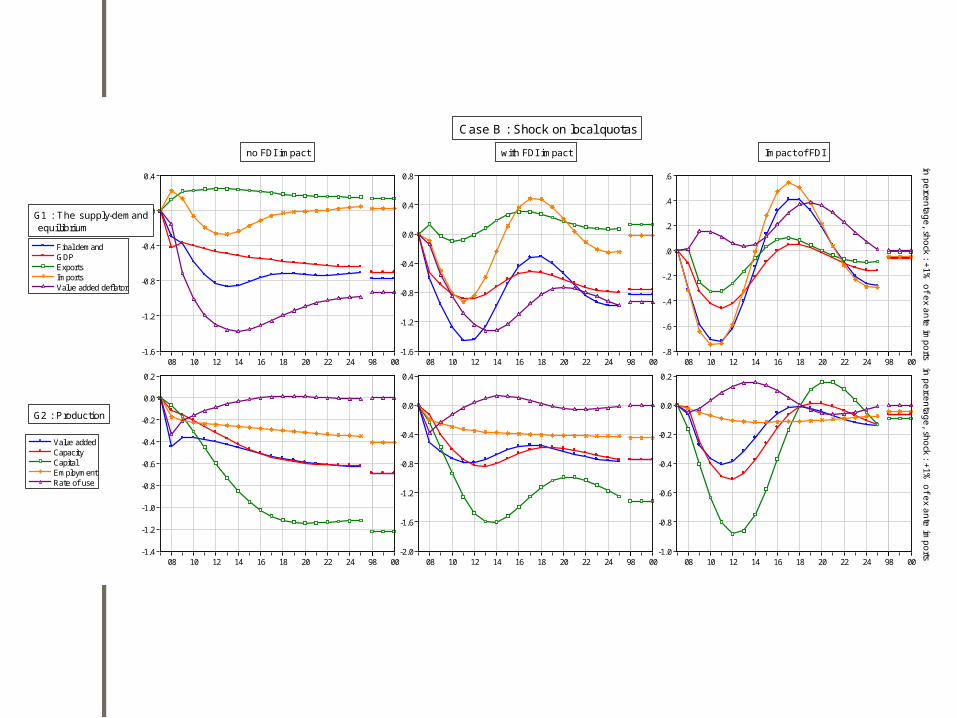
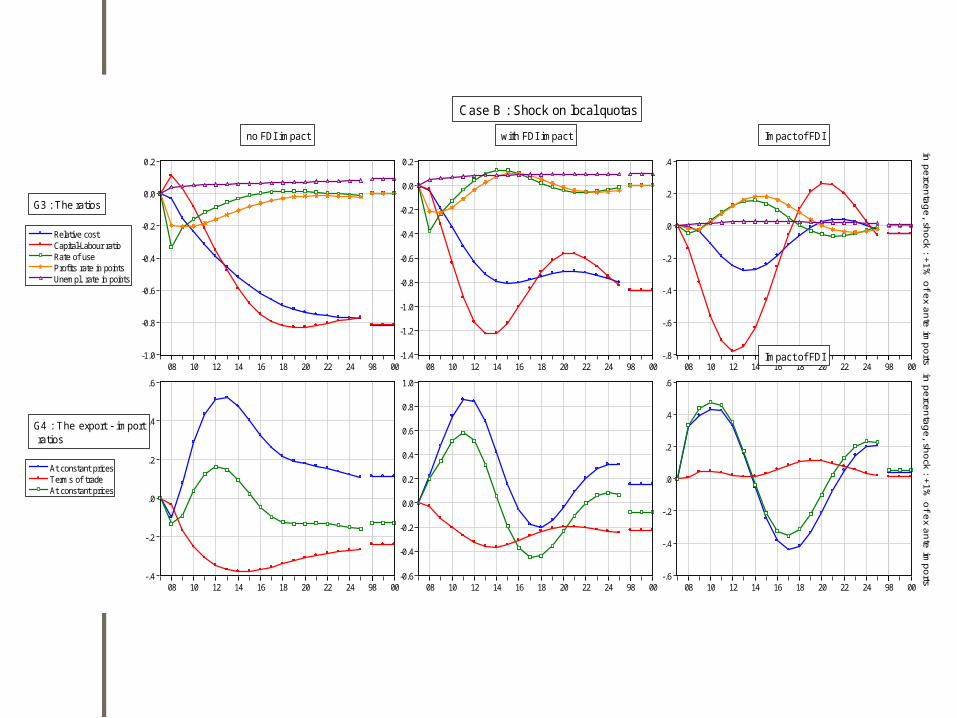
Comments on Shock BComments on Shock B
Ex ante increase of imports, ex post negative demand shock
This closes the explanationAlso for FDI (only ex post effect)
-1.2
-0.8
-0.4
0.0
0.4
0.8
08 10 12 14 16 18 20 22 24 98 00
Final demandGDPExportsImportsValue added deflator
G1 : The supply-demand equil ibrium
no FDI impact
-1.2
-0.8
-0.4
0.0
0.4
0.8
1.2
08 10 12 14 16 18 20 22 24 98 00
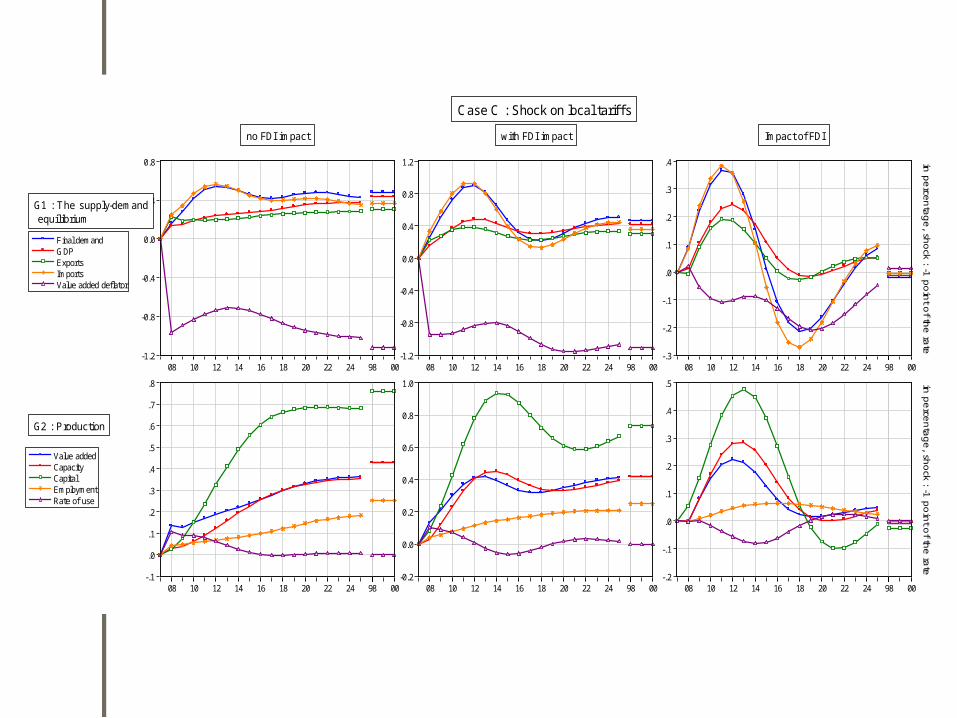
Case C : Shock on local tarif f s
with FDI impact
-.3
-.2
-.1
.0
.1
.2
.3
.4
08 10 12 14 16 18 20 22 24 98 00
in p
erce
nta
ge
, sho
ck : -1 p
oin
t of th
e ra
te
Impact of FDI
-.1
.0
.1
.2
.3
.4
.5
.6
.7
.8
08 10 12 14 16 18 20 22 24 98 00
Value addedCapacityCapitalEmploymentRate of use
G2 : Production
-0.2
0.0
0.2
0.4
0.6
0.8
1.0
08 10 12 14 16 18 20 22 24 98 00-.2
-.1
.0
.1
.2
.3
.4
.5
08 10 12 14 16 18 20 22 24 98 00
in p
erce
nta
ge
, sho
ck : -1 p
oin
t of th
e ra
te
-.1
.0
.1
.2
.3
.4
.5
.6
08 10 12 14 16 18 20 22 24 98 00
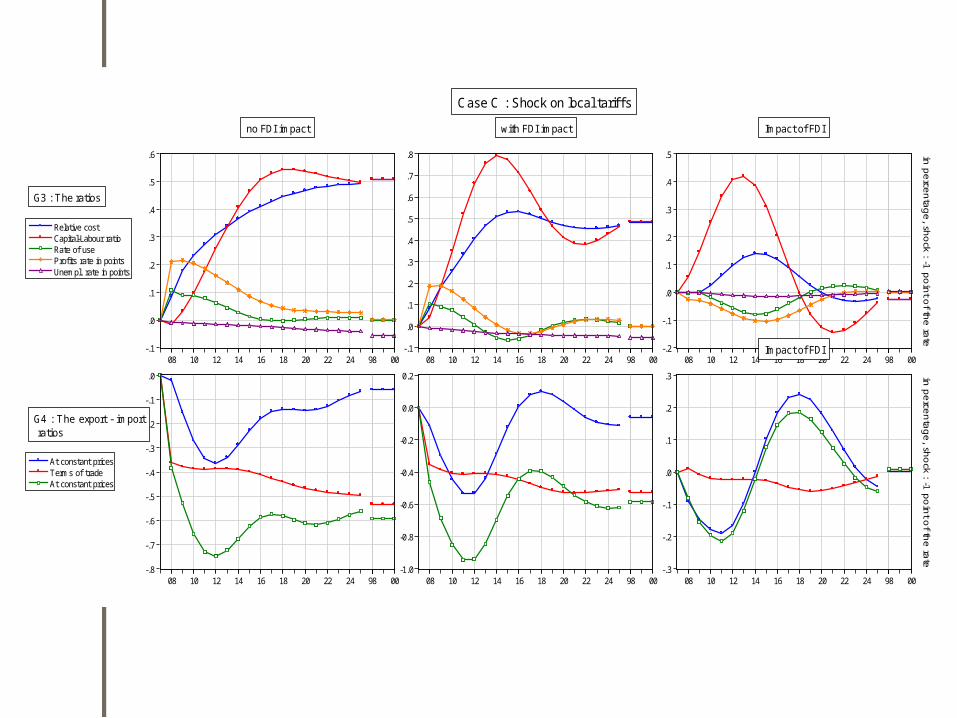
Relative costCapital-Labour ratioRate of useProfits rate in pointsUnempl. rate in points
G3 : The ratios
no FDI impact
-.1
.0
.1
.2
.3
.4
.5
.6
.7
.8
08 10 12 14 16 18 20 22 24 98 00
Case C : Shock on local tarif f s
with FDI impact
-.2
-.1
.0
.1
.2
.3
.4
.5
08 10 12 14 16 18 20 22 24 98 00
in p
erce
nta
ge
, sho
ck : -1 p
oin
t of th
e ra
te
Impact of FDI
-.8
-.7
-.6
-.5
-.4
-.3
-.2
-.1
.0
08 10 12 14 16 18 20 22 24 98 00
At constant pricesTerms of tradeAt constant prices
G4 : The export - import ratios
-1.0
-0.8
-0.6
-0.4
-0.2
0.0
0.2
08 10 12 14 16 18 20 22 24 98 00-.3
-.2
-.1
.0
.1
.2
.3
08 10 12 14 16 18 20 22 24 98 00
Impact of FDI
in p
erce
nta
ge
, sho
ck : -1 p
oin
t of th
e ra
te
-0.5
0.0
0.5
1.0
1.5
2.0
2.5
-.10
-.05
.00
.05
.10
.15
.20
08 10 12 14 16 18 20 22 24 98 00
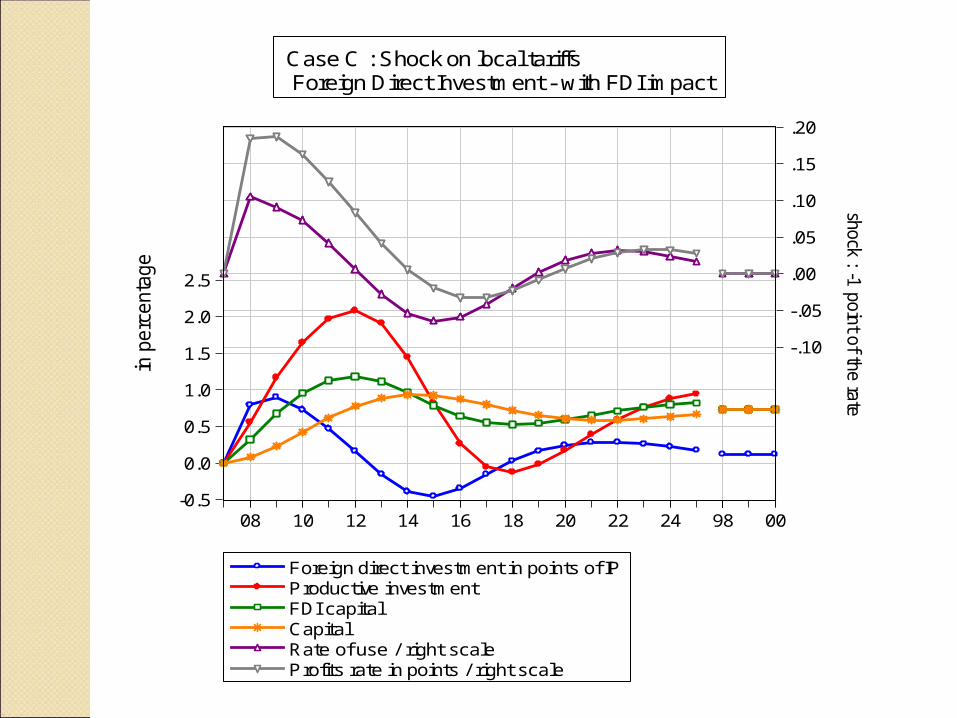
Foreign direct investment in points of IPProductive investmentFDI capitalCapitalRate of use / right scaleProfits rate in points / right scale
Case C : Shock on local tariffs Foreign Direct Investment - with FDI impact
in p
erc
enta
ge
shock : -1 point of the rate

Comments on Shock C : neutral FDIComments on Shock C : neutral FDI
Again, ex ante increase of imports, ex post negative demand shock
With an additional positive supply shock The cost of wages and equipment goes down Creating competitiveness, exports, but also a need
for equipment and consumption goodsAgain, imports increase more than exportsBut GDP and local demand improveLimiting disinflation in the long runBut both real trade balance and terms of
trade worsenAnd of course the State budget
Comments on Shock C : specific Comments on Shock C : specific FDIFDI
Actually similar to shock ABut the increase comes mostly from
profitabilityAnd less (but some) from the rate of useProfitability lasts longerSo GDP is never negatively affectedGlobal impact is stronger

Conclusions on shock A (and Conclusions on shock A (and A’)A’)The access to world markets through quotas and tariffs
produces gains which attract FDI, directly, and indirectly through local demand. FDI increases capacities, limits inflation and helps to satisfy foreign demand.
Both types of shock have the same consequences, at a variable level.
But to really gain from the situation, the conditions of local profitability must be met. Demand is only part of the game. Inflation and costs limit the gains in the medium term.
Conclusions on shock BConclusions on shock B Increasing local quotas depresses the
economy. FDI worsens the situation, as firms prefer exporting to investing in a depressed market. Lower FDI reduces capacities and productivity, limits disinflation and substitution by exports.
These results are trivial, as opposite to the above shocks

Conclusions on shock CConclusions on shock C
Decreasing local tariffs will also increase imports, but create profitability and gradually growth. Foreign firms invest in the country, primarily to export, but local conditions improve too (due to FDI...). Losses in competitiveness are limited.

Conclusions on all shocks (1)Conclusions on all shocks (1)
An initial increase in FDI can be short (medium) lived. More investment and improved factor productivity make capacities adapt faster to demand. The need for additional capacities disappears if profitability does too.
The improvement of exports can sustain the effect, the reduction of costs causes deflation and gains in profitability.
The inertia on FDI, investment and capacities can actually create overshooting, and sometimes negative medium run consequences. But the actualized gain on GDP is almost always positive.
Conclusions on all shocks (2)Conclusions on all shocks (2)
FDI has a positive impact on local (non FDI led) activity, including local firms (except when it comes from the reduction of local subsidies).
On the trade balance, the impact of FDI is generally positive, but it can increase the import of equipment goods in the short run.
But when capacities build up, they will be more productive, more profitable, and create more export potential.
Also, a higher disinflation has a cost on the terms of trade.
Conclusions on all shocks (3)Conclusions on all shocks (3)
Increasing FDI will have a reduced effect on employment, as it increases the role of capital, and the gains in global productivity will limit job creation,
However, employment will generally grow.That all these mechanisms interact with each
other, with generally expanding properties. For instance, FDI increases factor productivity which creates profitability and FDI. Or FDI creates exports and the need for additional capacities and FDI, which increases productivity and helps satisfy export potential….
Final conclusion (did we need a Final conclusion (did we need a model???)model???)For a pure demand shock, FDI increases the
speed of adaptation and makes it smoother◦ By generating capacities through size and
efficiencyBut the impact disappears in the medium
runHowever, the global impact is positiveTo sustain the gains, we need ex ante
profitability (like local tariffs).But even then, more growth and
employment will make profitability disappear in the long run.