Embed Size (px)
Citation preview

PNWD-3300 WTP-RPT-076 Rev. 0
Identification of Washed Solids from Hanford Tanks 241-AN-102 and 241-AZ-101 with X-Ray Diffraction, Scanning Electron Microscopy, and Light-Scattering Particle Analysis
E. C. Buck B. W. Arey S. K. Fiskum J. G. H. Geeting E. D. Jenson B. K. McNamara A. P. Poloski
June 2003
Battelle – Pacific Northwest Division Richland, Washington, 99352
WTP Project Report
LEGAL NOTICE
This report was prepared by Battelle Memorial Institute (Battelle) as an account of sponsored research activities. Neither Client nor Battelle nor any person acting on behalf of either: MAKES ANY WARRANTY OR REPRESENTATION, EXPRESS OR IMPLIED, with respect to the accuracy, completeness, or usefulness of the information contained in this report, or that the use of any information, apparatus, process, or composition disclosed in this report may not infringe privately owned rights; or Assumes any liabilities with respect to the use of, or for damages resulting from the use of, any information, apparatus, process, or composition disclosed in this report. References herein to any specific commercial product, process, or service by trade name, trademark, manufacturer, or otherwise, does not necessarily constitute or imply its endorsement, recommendation, or favoring by Battelle. The views and opinions of authors expressed herein do not necessarily state or reflect those of Battelle.

PNWD-3300 WTP-RPT-076 Rev. 0
Identification of Washed Solids from Hanford Tanks 241-AN-102 and 241-AZ-101 with X-Ray Diffraction, Scanning Electron Microscopy, and Light-Scattering Particle Analysis
E. C. Buck E. D. Jenson B. W. Arey B. K. McNamara S. K. Fiskum A. P. Poloski J. G. H. Geeting June 2003 Prepared for Bechtel National, Inc. under Contract 24590-101-TSA-W000-0004
Test Specifications: 24590-WTP-TSP-RT-01-005 and TSP-W375-01-00002 Test Plans: TP-RPP-WTP-099 and TP-RPP-WTP-066 Test Exceptions: 24590-WTP-TEF-RT-02-081 (AZ101) 24590-WTP-TEF-RT-02-082 (Energetics) R&T Focus Area: Pretreatment Test Scoping Statement(s): B-78 and B-86 Battelle – Pacific Northwest Division Richland, Washington, 99352
Completeness of Testing This report describes the results of work and testing specified by Test Exceptions 24590-WTP-TEF-RT-02-081 (AZ101) and 24590-WTP-TEF-RT-02-082 (Energetics) Test Specifications 24590-WTP-TSP-RT-01-005 and TSP-W375-01-00002 and Test Plans TP-RPP-WTP-099 and TP-RPP-WTP-066. The work and any associated testing followed the quality assurance requirements outlined in the Test Specifications/Plans. The descriptions provided in this test report are an accurate account of both the conduct of the work and the data collected. Test plan results are reported. Also reported are any unusual or anomalous occurrences that are different from expected results. The test results and this report have been reviewed and verified. Approved: Gordon Beeman, Manager Date WTP R&T Support Project
iii
Summary of Testing
The U.S. Department of Energy (DOE) intends to vitrify Hanford tank wastes at the River Protection Project-Waste Treatment Plant (RPP-WTP). The wastes will be phase separated in the plant, where solids will be washed, then forwarded for processing into a high-level waste (HLW) fraction, combined with other HLW waste processing streams, and vitrified into a HLW glass. Modeling these waste-processing steps for process optimization and cold commissioning requires using a simulant that accurately reflects the tank waste solids composition and particle size distribution (PSD). Battelle – Pacific Northwest Division (PNWD) tested Hanford Tanks 241-AN-102 (AN-102) and 241-AZ-101 (AZ-101) solids to define better the composition, morphology, and associated PSD. These characterization activities were performed according to Test Exception 24590-WTP-TEF-RT-02-081(AZ101) and 24590-WTP-TEF-RT-02-082 (Energetics). The testing was defined in technical scoping statements B-86 (AN-102) and B-78 (AZ-101) of the Research and Technology Plan.
Objective The objective of this task was to identify individual phases present in the washed solids sub-samples derived from AN-102 and AZ-101 with scanning electron microscopy (SEM), energy dispersive x-ray spectroscopy (EDS), x-ray diffraction (XRD), infrared spectroscopy (IR), and laser light scattering particle size determination (PSD) to improve simulant development.
Conduct of Testing Samples from homogenized AN-102 were extracted from the third wash of the solids (Bryan et al. 2002). Samples of blended AZ-101 were provided after phase separation (Urie et al. 2002) and rigorous washing (Geeting et al. 2002). These samples were further divided into sub-samples suitable for examination with SEM, EDS, XRD, IR, and PSD. The high activity of the samples necessitated reducing the sample size to allow examination in the various instruments. The need to reduce sample volume combined with the highly heterogeneous nature of the tank solids, suggests that the samples may not have been representative of the bulk material.
Results and Performance Against Objectives The phase identifications are summarized in Table S.1. In AN-102, microstructural analysis provided evidence for the presence of zeolitic phases. XRD and SEM-EDS suggest the presence of boehmite (AlOOH) and sodium aluminate (although the Na-Al carbonate phase, dawsonite, cannot be ruled out). The evaporite phases, sodium nitrate (NaNO3) and sodium nitrite (NaNO2), were identified with XRD. Both NaNO3 and NaNO2 precipitated during sample preparation. A number of smaller particles were also found attached to the surface of the bulk material. The AN-102 sample did not have detectable levels of gibbsite. Uranium oxide (possibly schoepite) particles, ranging in size from 1 to 5 µm in diameter, were found in the AN-102 sample. Iron oxide (hematite) and iron chromium nickel oxide (chromite) were observed. A much rarer cerium oxide (possibly cerianite) and yttrium vanadate particles (possibly wakefieldite) were also found in the AN-102 sample.
iv
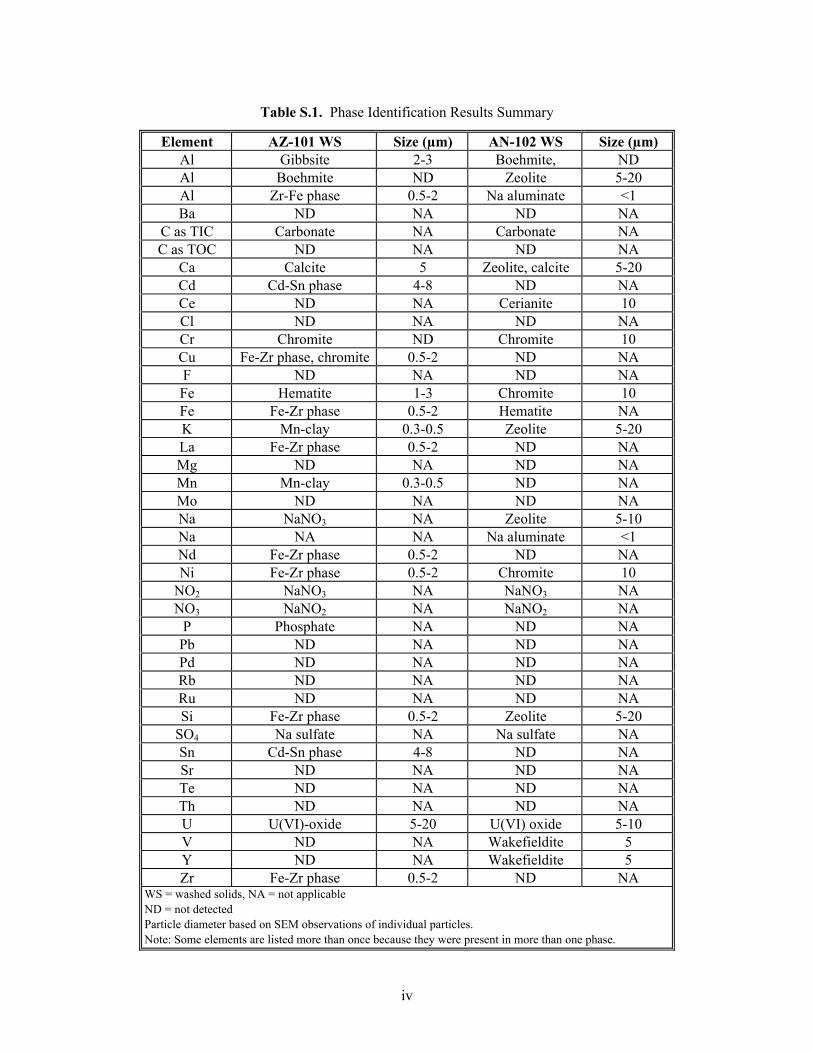
Table S.1. Phase Identification Results Summary
Element AZ-101 WS Size (µm) AN-102 WS Size (µm) Al Gibbsite 2-3 Boehmite, ND Al Boehmite ND Zeolite 5-20 Al Zr-Fe phase 0.5-2 Na aluminate <1 Ba ND NA ND NA
C as TIC Carbonate NA Carbonate NA C as TOC ND NA ND NA
Ca Calcite 5 Zeolite, calcite 5-20 Cd Cd-Sn phase 4-8 ND NA Ce ND NA Cerianite 10 Cl ND NA ND NA Cr Chromite ND Chromite 10 Cu Fe-Zr phase, chromite 0.5-2 ND NA F ND NA ND NA Fe Hematite 1-3 Chromite 10 Fe Fe-Zr phase 0.5-2 Hematite NA K Mn-clay 0.3-0.5 Zeolite 5-20 La Fe-Zr phase 0.5-2 ND NA Mg ND NA ND NA Mn Mn-clay 0.3-0.5 ND NA Mo ND NA ND NA Na NaNO3 NA Zeolite 5-10 Na NA NA Na aluminate <1 Nd Fe-Zr phase 0.5-2 ND NA Ni Fe-Zr phase 0.5-2 Chromite 10
NO2 NaNO3 NA NaNO3 NA NO3 NaNO2 NA NaNO2 NA
P Phosphate NA ND NA Pb ND NA ND NA Pd ND NA ND NA Rb ND NA ND NA Ru ND NA ND NA Si Fe-Zr phase 0.5-2 Zeolite 5-20
SO4 Na sulfate NA Na sulfate NA Sn Cd-Sn phase 4-8 ND NA Sr ND NA ND NA Te ND NA ND NA Th ND NA ND NA U U(VI)-oxide 5-20 U(VI) oxide 5-10 V ND NA Wakefieldite 5 Y ND NA Wakefieldite 5 Zr Fe-Zr phase 0.5-2 ND NA
WS = washed solids, NA = not applicable ND = not detected Particle diameter based on SEM observations of individual particles. Note: Some elements are listed more than once because they were present in more than one phase.

v
The laser light scattering particle size analysis of the AN-102 washed solids sample indicated that most of the particle volume was particles in the 0.5 to 15 micron range. However, under sonication, the agglomerates appeared to break apart, resulting in a larger volume of smaller-diameter particles. After sonication, most of the particles were between approximately 0.6 and 3.0 µm. The results of the particle size analysis were reasonably consistent with observations made with SEM on the nature of the particles. However, the sample preparation method for microscopy did result in the formation of soft agglomerated particles. Therefore, the SEM images of particles do not represent the anticipated size of the particles during waste processing. Zeolites were not found in the two samples of AZ-101 solids. Both AZ-101 samples contained boehmite and gibbsite. A number of smaller particles were also found. Calcite was also identified in AZ-101. Uranium oxide (possibly schoepite) particles ranging in size from 5–10 µm to less than 1 µm in diameter were fairly common in the AZ-101 samples. Iron oxide (hematite) and iron chromium nickel oxide (chromite) were observed in both samples. A zirconium iron phase was common. These phases also contained aluminum, lanthanum, and neodynium. This phase may be mixed carbonate-phosphate, according to IR analysis. A manganese-bearing phase was also commonly found in the unwashed AZ-101 sample. Particle size analysis of these AZ-101 samples is described in Urie et al. (2002).
Quality Requirements PNWD implemented the RPP-WTP quality requirements by performing work in accordance with the quality assurance project plan (QAPjP) approved by the RPP-WTP Quality Assurance (QA) organization. This work was conducted to the quality requirements of NQA-1-1989 and NQA-2a-1990, Part 2.7, as instituted through PNWD’s Waste Treatment Plant Support Project Quality Assurance Requirements and Description (WTPSP) manual. All of the instruments used in this study were checked where possible with National Institute of Standards and Technology (NIST) standards, as well as other internal standards, at the time of the analysis. NIST standards were not available for all instrumentation. For example, both the calibration of the infrared spectrometer and x-ray energy dispersive spectrometer was checked with various compounds. PNWD addressed verification activities by conducting an Independent Technical Review of the final data report in accordance with procedure QA-RPP-WTP-604. This review verified that the reported results were traceable, that inferences and conclusions were soundly based, and the reported work satisfied the Test Plan objectives.
Issues None.

vi
vii
Contents Summary ...................................................................................................................................................... iii
Abbreviations, Acronyms, and Definitions.................................................................................................. xi
1.0 Introduction......................................................................................................................................... 1.1
2.0 Experimental ....................................................................................................................................... 2.1 2.1 Sample History............................................................................................................................ 2.1
2.1.1 AN-102 Solids...................................................................................................................... 2.1 2.1.2 AZ-101 Solids ...................................................................................................................... 2.1
2.2 Composition of Solids................................................................................................................. 2.2 2.3 Microstructural Analysis of Subsamples .................................................................................... 2.5
2.3.1 Scanning electron microscopy ............................................................................................. 2.5 2.3.2 X-ray energy dispersive spectroscopy.................................................................................. 2.6 2.3.3 X-ray diffraction................................................................................................................... 2.7 2.3.4 Infrared spectroscopy ........................................................................................................... 2.8 2.3.5 Particle size analysis ............................................................................................................ 2.8
3.0 Analysis of Washed AN-102 Solids ................................................................................................... 3.1 3.1 Scanning Electron Microscopy of AN-102 Washed Solids ........................................................ 3.1 3.2 X-Ray Diffraction ....................................................................................................................... 3.8 3.3 Particle Size Analysis of AN-102 ............................................................................................. 3.12 3.4 SEM Analysis of Particle Size in AN-102................................................................................ 3.17
4.0 Analysis of AZ-101 Solids.................................................................................................................. 4.1 4.1 XRD Analysis of AZ-101 Washed Solids Sample...................................................................... 4.1 4.2 Scanning Electron Microscopy of AZ-101 Washed Solids ........................................................ 4.5 4.3 XRD Analysis of AZ-101 Unwashed Solids Sample................................................................ 4.10 4.4 Scanning Electron Microscopy of AZ-101 Unwashed Solids................................................... 4.12 4.5 Infrared Spectroscopy of Washed AZ-101 ............................................................................... 4.16
4.5.1 Absorption band identification........................................................................................... 4.17 4.5.2 Anion symmetry and coordination modes ......................................................................... 4.18
5.0 Discussion ........................................................................................................................................... 5.1 5.1 Zeolitic and Carbonate Phases .................................................................................................... 5.1 5.2 Aluminum Oxide Phases............................................................................................................. 5.2 5.3 Hematite Phases .......................................................................................................................... 5.3 5.4 Zirconium Phases in AZ-101 ...................................................................................................... 5.5 5.5 Uranium-Bearing Phases............................................................................................................. 5.7 5.6 Minor Phases in the Samples ...................................................................................................... 5.7 5.7 Nitrates ........................................................................................................................................ 5.8 5.8 Particle Size Analysis.................................................................................................................. 5.9 5.9 Sample Size Issues .................................................................................................................... 5.10
6.0 Conclusions ........................................................................................................................................ 6.1
7.0 References .......................................................................................................................................... 7.1
viii
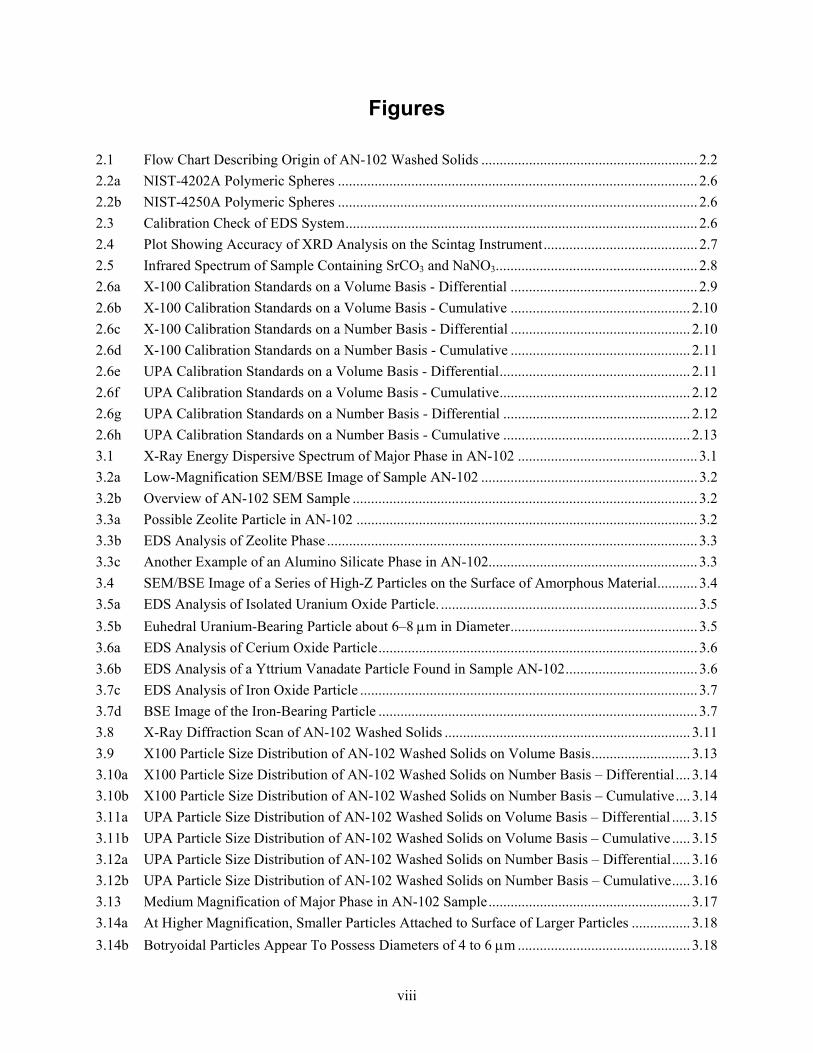
Figures 2.1 Flow Chart Describing Origin of AN-102 Washed Solids ........................................................... 2.2 2.2a NIST-4202A Polymeric Spheres .................................................................................................. 2.6 2.2b NIST-4250A Polymeric Spheres .................................................................................................. 2.6 2.3 Calibration Check of EDS System................................................................................................ 2.6 2.4 Plot Showing Accuracy of XRD Analysis on the Scintag Instrument.......................................... 2.7 2.5 Infrared Spectrum of Sample Containing SrCO3 and NaNO3....................................................... 2.8 2.6a X-100 Calibration Standards on a Volume Basis - Differential ................................................... 2.9 2.6b X-100 Calibration Standards on a Volume Basis - Cumulative ................................................. 2.10 2.6c X-100 Calibration Standards on a Number Basis - Differential ................................................. 2.10 2.6d X-100 Calibration Standards on a Number Basis - Cumulative ................................................. 2.11 2.6e UPA Calibration Standards on a Volume Basis - Differential.................................................... 2.11 2.6f UPA Calibration Standards on a Volume Basis - Cumulative.................................................... 2.12 2.6g UPA Calibration Standards on a Number Basis - Differential ................................................... 2.12 2.6h UPA Calibration Standards on a Number Basis - Cumulative ................................................... 2.13 3.1 X-Ray Energy Dispersive Spectrum of Major Phase in AN-102 ................................................. 3.1 3.2a Low-Magnification SEM/BSE Image of Sample AN-102 ........................................................... 3.2 3.2b Overview of AN-102 SEM Sample .............................................................................................. 3.2 3.3a Possible Zeolite Particle in AN-102 ............................................................................................. 3.2 3.3b EDS Analysis of Zeolite Phase ..................................................................................................... 3.3 3.3c Another Example of an Alumino Silicate Phase in AN-102......................................................... 3.3 3.4 SEM/BSE Image of a Series of High-Z Particles on the Surface of Amorphous Material........... 3.4 3.5a EDS Analysis of Isolated Uranium Oxide Particle. ...................................................................... 3.5 3.5b Euhedral Uranium-Bearing Particle about 6–8 µm in Diameter................................................... 3.5 3.6a EDS Analysis of Cerium Oxide Particle....................................................................................... 3.6 3.6b EDS Analysis of a Yttrium Vanadate Particle Found in Sample AN-102.................................... 3.6 3.7c EDS Analysis of Iron Oxide Particle ............................................................................................ 3.7 3.7d BSE Image of the Iron-Bearing Particle ....................................................................................... 3.7 3.8 X-Ray Diffraction Scan of AN-102 Washed Solids ................................................................... 3.11 3.9 X100 Particle Size Distribution of AN-102 Washed Solids on Volume Basis........................... 3.13 3.10a X100 Particle Size Distribution of AN-102 Washed Solids on Number Basis – Differential .... 3.14 3.10b X100 Particle Size Distribution of AN-102 Washed Solids on Number Basis – Cumulative.... 3.14 3.11a UPA Particle Size Distribution of AN-102 Washed Solids on Volume Basis – Differential ..... 3.15 3.11b UPA Particle Size Distribution of AN-102 Washed Solids on Volume Basis – Cumulative ..... 3.15 3.12a UPA Particle Size Distribution of AN-102 Washed Solids on Number Basis – Differential..... 3.16 3.12b UPA Particle Size Distribution of AN-102 Washed Solids on Number Basis – Cumulative..... 3.16 3.13 Medium Magnification of Major Phase in AN-102 Sample....................................................... 3.17 3.14a At Higher Magnification, Smaller Particles Attached to Surface of Larger Particles ................ 3.18 3.14b Botryoidal Particles Appear To Possess Diameters of 4 to 6 µm ............................................... 3.18
ix
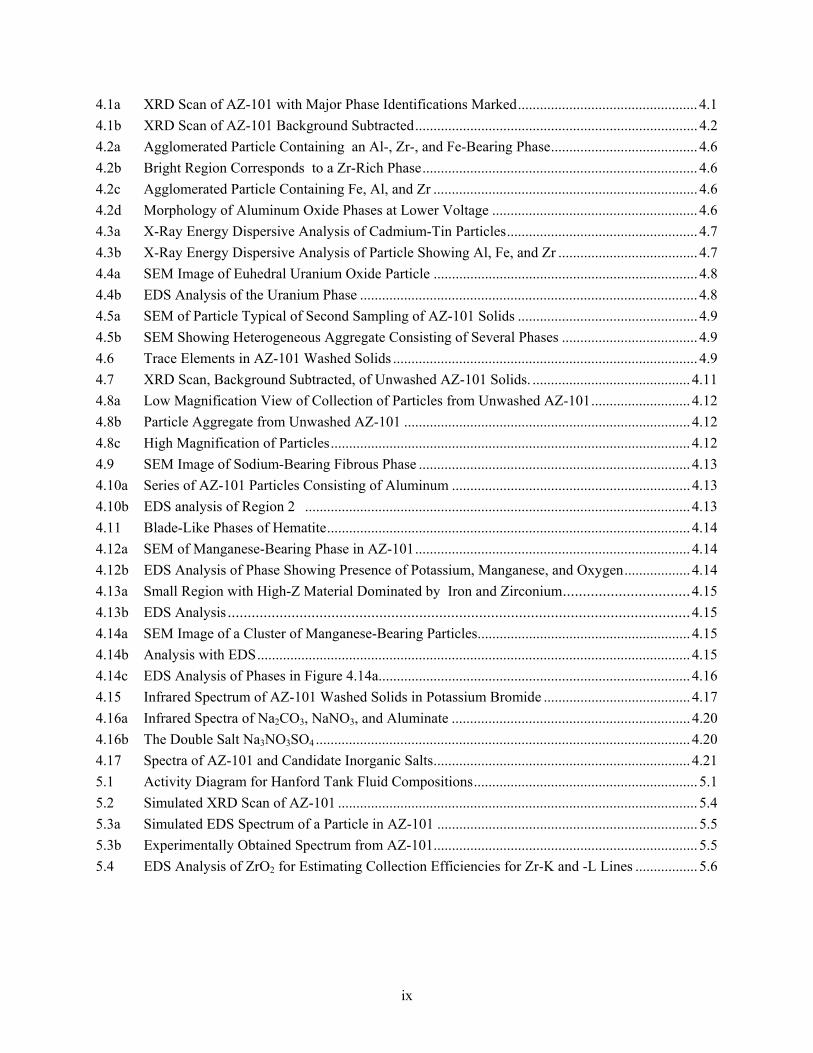
4.1a XRD Scan of AZ-101 with Major Phase Identifications Marked................................................. 4.1 4.1b XRD Scan of AZ-101 Background Subtracted............................................................................. 4.2 4.2a Agglomerated Particle Containing an Al-, Zr-, and Fe-Bearing Phase........................................ 4.6 4.2b Bright Region Corresponds to a Zr-Rich Phase........................................................................... 4.6 4.2c Agglomerated Particle Containing Fe, Al, and Zr ........................................................................ 4.6 4.2d Morphology of Aluminum Oxide Phases at Lower Voltage ........................................................ 4.6 4.3a X-Ray Energy Dispersive Analysis of Cadmium-Tin Particles.................................................... 4.7 4.3b X-Ray Energy Dispersive Analysis of Particle Showing Al, Fe, and Zr ...................................... 4.7 4.4a SEM Image of Euhedral Uranium Oxide Particle ........................................................................ 4.8 4.4b EDS Analysis of the Uranium Phase ............................................................................................ 4.8 4.5a SEM of Particle Typical of Second Sampling of AZ-101 Solids ................................................. 4.9 4.5b SEM Showing Heterogeneous Aggregate Consisting of Several Phases ..................................... 4.9 4.6 Trace Elements in AZ-101 Washed Solids ................................................................................... 4.9 4.7 XRD Scan, Background Subtracted, of Unwashed AZ-101 Solids. ........................................... 4.11 4.8a Low Magnification View of Collection of Particles from Unwashed AZ-101........................... 4.12 4.8b Particle Aggregate from Unwashed AZ-101 .............................................................................. 4.12 4.8c High Magnification of Particles.................................................................................................. 4.12 4.9 SEM Image of Sodium-Bearing Fibrous Phase .......................................................................... 4.13 4.10a Series of AZ-101 Particles Consisting of Aluminum ................................................................. 4.13 4.10b EDS analysis of Region 2 ......................................................................................................... 4.13 4.11 Blade-Like Phases of Hematite................................................................................................... 4.14 4.12a SEM of Manganese-Bearing Phase in AZ-101........................................................................... 4.14 4.12b EDS Analysis of Phase Showing Presence of Potassium, Manganese, and Oxygen.................. 4.14 4.13a Small Region with High-Z Material Dominated by Iron and Zirconium................................4.15 4.13b EDS Analysis....................................................................................................................4.15 4.14a SEM Image of a Cluster of Manganese-Bearing Particles.......................................................... 4.15 4.14b Analysis with EDS...................................................................................................................... 4.15 4.14c EDS Analysis of Phases in Figure 4.14a..................................................................................... 4.16 4.15 Infrared Spectrum of AZ-101 Washed Solids in Potassium Bromide ........................................ 4.17 4.16a Infrared Spectra of Na2CO3, NaNO3, and Aluminate ................................................................. 4.20 4.16b The Double Salt Na3NO3SO4 ...................................................................................................... 4.20 4.17 Spectra of AZ-101 and Candidate Inorganic Salts...................................................................... 4.21 5.1 Activity Diagram for Hanford Tank Fluid Compositions............................................................. 5.1 5.2 Simulated XRD Scan of AZ-101 .................................................................................................. 5.4 5.3a Simulated EDS Spectrum of a Particle in AZ-101 ....................................................................... 5.5 5.3b Experimentally Obtained Spectrum from AZ-101........................................................................ 5.5 5.4 EDS Analysis of ZrO2 for Estimating Collection Efficiencies for Zr-K and -L Lines ................. 5.6

x
Tables S.1 Phase Identification Results Summary................................................................................................ iv 2.1 Composition of AN-102 Washed Solids ........................................................................................... 2.4 2.2 Composition of Washed and Unwashed AZ-101 Solids. .................................................................. 2.4 3.1 X-Ray Diffraction Data from AN-102 Washed Solids ..................................................................... 3.9 3.2 Surrogate Supernatant Composition................................................................................................ 3.12 4.1 X-Ray Diffraction Data from AZ-101 Washed Runs 1 and 2........................................................... 4.3 4.2 XRD Data from AZ-101 Unwashed Solids..................................................................................... 4.10 4.3 Potential Compounds and Their Infrared Bands ............................................................................. 4.19 5.1 Crystal Chemical Data for Aluminum Oxide Phases ........................................................................ 5.3 5.2 Composition of Zr-Fe Phase Used in Spectrum Simulation. ............................................................ 5.6 5.3 XRD Data on Sodium Nitrite and Sodium Nitrate............................................................................ 5.8 5.4 Phase Identification and Particle Size Results .................................................................................. 5.9

xi
Abbreviations, Acronyms, and Definitions BSE Backscattered electron DOE U.S. Department of Energy EDS Energy dispersive x-ray spectroscopy FWHM Full width half maximum HLW High level waste IR Infrared spectroscopy IRC Independent Review Committee ISMS Integrated Safety Management System JCPDS Joint Committee of Powder Diffraction Standard NIST National Institute for Standards and Technology OM Optical microscopy PI principal investigator PNWD Pacific Northwest Division (Battelle) PSD Particle size distribution QA Quality Assurance RPL Radiochemical Processing Laboratory SAL Shielded Analytical Laboratory SEM Scanning electron microscopy TIC Total inorganic carbon TOC Total organic carbon UPA Ultrafine particle analysis WTP Waste Treatment Plant XRD X-ray diffraction
Definitions Acicular Crystals with an elongated or needle-like form Agglomerate Particles in a dispersed system associated into larger structures Amorphous Non-crystalline substance that does not produce an XRD pattern Botryoidal A globular growth of minerals Bremmstrahlung X-ray background signal observed in EDS produced by electrons slowing down as
they pass through the sample. Dissolved solids Soluble solids; those remaining after complete drying of a liquid at 105°C.
Typically reported as wt%. During drying, most mass loss is due to water, but other volatile components (e.g., organics) may also be lost.
d-spacings Lattice spacings obtained with XRD Crypto-crystalline Only partly crystallized but completely amorphous. Euhedral Well-formed crystal with regular shape Floc Assemblies of aggregates

xii
Gel A semi-solid colloidal product Undissolved solids Solids excluding all interstitial liquid. This can be thought of as the solids left if all
the supernatant and associated dissolved solids could be drained from the bulk slurry. The undissolved solids will generally include some materials that can be washed or dissolved during pretreatment.
R The correlation coefficient between measured and predetermined values. Regression Line The relationship between x and y is given by: y = mx + c; this is known as the
regression line of y on x. Spectrum Refers to a plot of measured signal intensity versus energy. Total solids Solids remaining after drying to a stable mass at 105°C; includes dissolved and
undissolved solids.
Mineral Names and Formulae Analcime Na(AlSi2O6)•H2O Asbolane (Co,Ni)1-y(MnO2)2-x(OH)2-2y+2x•nH2O Bayerite β- Al(OH)3 Birnessite Na4Mn14O27•9H2O Boehmite γ−AlOOH Calcite CaCO3 Cancrinite (Na,Ca,K)7Al6Si6O24(CO3)1.6•2.1H2O Cerianite CeO2 Chromite FeCr2O4 Clinoptilolite (Na, K, Ca)2-3Al3(Al, Si)2Si13O36•12H2O Corrundum Al2O3 Birnessite Na4Mn14O27•9H2O Dawsonite NaAl(CO3)(OH)2 Diaspore β- AlOOH Gibbsite β- Al(OH)3 Goethite FeOOH Mahlmodite FeZr(PO4)•4(H2O) Nitratite NaNO3 Norstrandite β-Al(OH)3 Hematite Fe2O3 Heulandite (Ca,Na)2-3Al3(Al,Si)2Si13O36•12H2O Philipsite (K2Na2Ca)(Al2Si4)O14•4-5H2O Powellite CaWO4 Rutherfordine UO2CO3 Schoepite UO3•2H2O Sodalite Na4Al3Si3O12Cl Strontianite SrCO3 Wakefieldite YVO4

xiii
Uraninite UO2
Units at% Atomic percent °C degrees centigrade cm-1 wavenumbers eV electron volt g gram keV kilo-electron volt L liter µg microgram µm micrometer M molarity, mole/liter m meter mg milligram mL milliliter nm nanometer vol% volume percent wt% weight percent

1.1
1.0 Introduction This report describes the identification of phases in the washed solids from actual sludge taken from a composite sample of Tanks 241-AN-102 (AN-102) and 241-AZ-101 (AZ-101) waste.(a) The U.S. Department of Energy (DOE) intends to vitrify Hanford tank wastes at the River Protection Project-Waste Treatment Plant (RPP-WTP). The wastes will be phase separated in the plant, where solids will be washed then forwarded for processing into a high-level waste (HLW) fraction, combined with other HLW waste processing streams, and vitrified into a HLW glass. Modeling these waste processing steps for process optimization and cold commissioning requires using a simulant that accurately reflects the tank waste solids composition and particle size distribution (PSD). Battelle – Pacific Northwest Division (PNWD) tested Hanford Tanks AN-102 and AZ-101 solids to define better the solids composition, morphology, and associated PSD. These characterization activities were performed according to Test Exception 24590-WTP-TEF-RT-02-081(AZ101) and 24590-WTP-TEF-RT-02-082 (Energetics), Test Specifications 24590-WTP-TSP-RT-01-005 and TSP-W375-01-00002 and Test Plans TP-RPP-WTP-099 Rev. 1, AZ-101 HLW Filtration and Caustic Leaching Plan Using the CUF and TP-RPP-WTP-066 Rev. 0, Energetics and Gas Generation Tests. The testing was defined in technical scoping statements B-30 (AN-102) and B-78 (AZ-101) of the Research and Technology Plan. Work described in this report is being conducted at Battelle – Pacific Northwest Division (PNWD) for the DOE RPP-WTP. Two test exceptions covered the solids characterization work. The Test Plans were TP-RPP-WTP-099, TSS B-78; and TP-RPP-WTP-066, TSS B-86. The objective of this work was to determine the structure, composition, and size distribution of individual phases in the washed solids sample. The techniques used were x-ray diffraction (XRD), scanning electron microscopy (SEM) with x-ray energy dispersive spectroscopy (EDS), and laser light scattering particle size determination (PSD). Phase analysis was done by using SEM, EDS, IR, and XRD data from the samples and comparing the results with those reported in the literature. However, there are several limitations in this methodology. First, XRD highlights only the crystalline phases, in particular, the phases that scatter strongly [i.e., high atomic number (Z) crystalline phases]. In addition, the peak intensities cannot be used as a quantitative indication of phase concentration. The SEM tended to examine much smaller size samples than the XRD due to sample handling issues. SEM images are created by rastering a focused electron probe across a sample while simultaneously measuring various secondary and backscattered electron signals as a function of beam position. Elastic and inelastic scattering spread the incident electron beam within the sample yielding an interaction volume, the dimensions of which depend on the electron beam energy and sample composition (i.e., atomic number) rather than the focused probe size (Seaman 2002). As the energy of the beam increases, the interaction volume also increases. When electrons of adequate energy hit the sample, characteristic x-rays indicative of elemental composition (i.e., atomic number) are produced at intensities proportional to the mass concentration of the given element within the interaction volume. To generate an x-ray spectra, the electron beam energy must be greater than the characteristic x-ray energy of the element of interest. For example, to excite the Zr-K line, beam energy of 20 keV is
(a) Hanford waste tanks are designated with the prefix 241-. In this report, as in common usage, the prefix is omitted.
1.2
required. However, as the beam energy increases, the beam excitation volume increases, reducing the spatial resolution. In this study, the beam energy was held at 20 keV for all analyses. The SEM investigation used backscattered imaging that highlights the high atomic number particles. The EDS used for compositional analysis has a minimal spatial resolution of about 1µm3 and is unable to detect any elements lighter than carbon. In general, elements below 1 wt% in any analyzed region cannot be detected, and overlap problems can further reduce detection limits. Nearly all the data collected have been included in this report, including listings of d-spacings from XRD runs. This allows the reader to recheck the data analyses and interpretations themselves. Most phase identifications described in this report are based on interpretations of the available data. With the instrument techniques used and the nature of the tank waste samples, we cannot be completely confident that any phase identification is absolutely correct. All the electron beam and x-ray techniques described here are unable to readily observe organic phases. These are thought to be an important component of AN-102 tank waste. Infrared microscopy and micro-Raman spectroscopy might be a promising technique to use in future investigations to address this issue. The particle size distribution of solids sample from AN-102 labeled as AN-102 WS9 is described in this report. A Microtrac X-100 particle analyzer and a Microtrac ultrafine particle analyzer (UPA) were both used to measure the particle size distribution of the waste samples. The Microtrac X-100 particle analyzer measures particle diameter by scattered light from a laser beam projected through a stream of the sample particles diluted in a suspending medium. The amount and direction of light scattered by the particles is measured by an optical detector array and then analyzed to determine the size distribution of the particles. This measurement is limited to particles with diameters between 0.12 and 700 µm. The Microtrac UPA measures particle diameter by Doppler shifted scattered light. This method is limited to particles with diameters between 3 nm and 6.5 µm. Particle size analysis for AZ-101 samples is reported in Urie et al. (2002).
2.1
2.0 Experimental The objective of this study was to identify individual phases present in the washed solids subsamples derived from AN-102 and AZ-101 with SEM, EDS, XRD, IR, and PSD to assist in the development of a tank waste simulant.
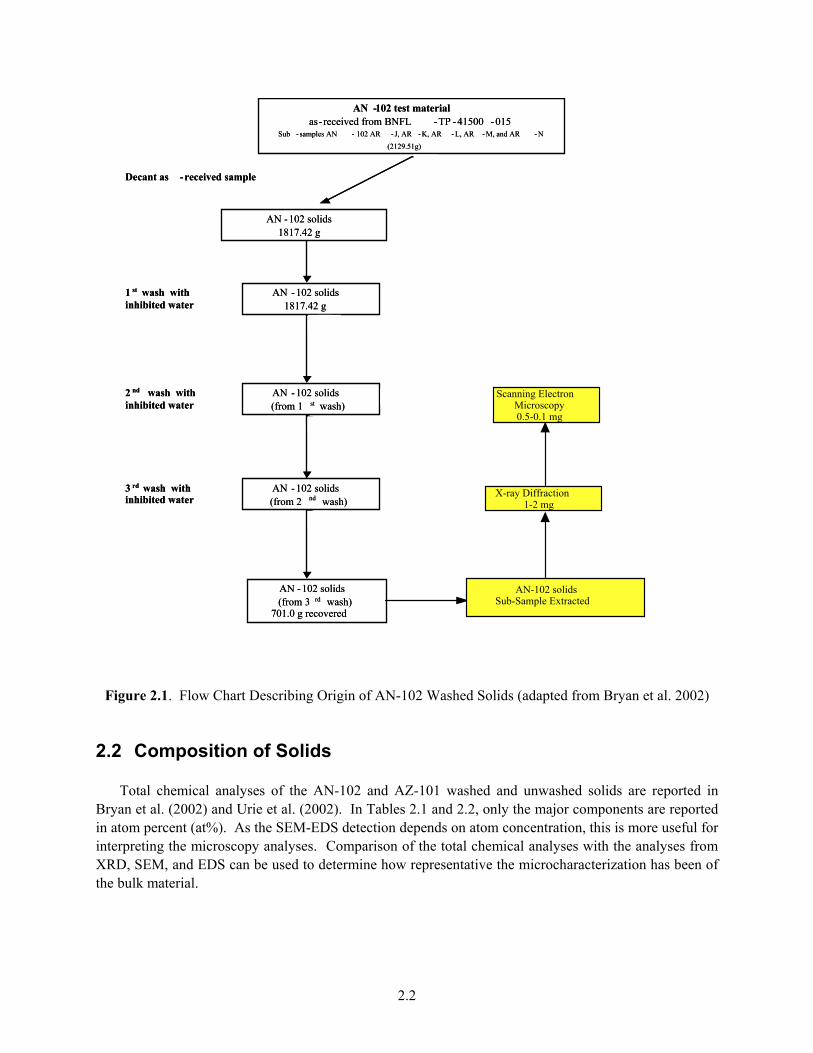
2.1 Sample History Washed solids from Tank AN-102 and washed and unwashed solids from AZ-101 were prepared for micro-analytical characterization at the RPL in the Hanford 300 Area. The washing steps simulated the expected pretreatment processing for these tanks. Before the micro-analytical work was started, both AN-102 and AZ-101 samples had been homogenized, and subsamples had been pulled for further analytical work. 2.1.1 AN-102 Solids The history of the AN-102 sample used in this study is described in Bryan et al. (2002). Figure 2.1 shows where the samples for this characterization work were obtained and their relation to other subsamples of AN-102. The shaded regions refer to steps taken in this investigation. Bryan et al. (2002) reported that samples were generated by homogenizing several of the 30 AN-102 samples that were sent to PNWD in August 2000. The homogenized sample (2129.51 g) went through three washing steps with 0.01 M NaOH. The solids and the wash solution were contacted for one hour with agitation and allowed to settle. Nominally 701.0 g of solids were recovered. This third washed solids sample was used in gas generation (Bryan et al. 2002), and a subsample of about 5g was provided for microcharacterization studies. This sample was dried in an oven at 60°C overnight. Approximately 1-2 mg was used for XRD and 0.5-0.1 mg for SEM studies. 2.1.2 AZ-101 Solids Two samples of AZ-101, washed and unwashed, solids were examined. The material preparation and homogenization of AZ-101 and the details of the unwashed sample, including particle size measurements, are described by Urie et al. (2002). The history of the washed sample processing of the AZ-101 subsamples is described by Geeting et al. (2002). The analyzed washed solids sample is identified as AZ6 in flow charts. Samples for XRD were prepared in the Shielded Analytical Laboratory (SAL). An aliquot of the sample was deposited on a clean glass slide. The slide was transferred to the XRD laboratory and run on the Scintag instrument. Samples for SEM needed to be further reduced in size owing to restrictions on handling and transporting these samples in the microscopes.
2.2
AN -102 solids 1817.42 g
AN -102 test material as- received from BNFL -TP -41500 -015
Sub - samples AN - 102 AR - J, AR - K, AR - L, AR - M, and AR - N(2129.51g)
AN -102 liquid decant312.09 g
Decant as -received sample
AN -102 solids 1817.42 g
Inhibited water added (0.01 NaOH )
998.12 g
1 st wash with inhibited water
AN -102 solids (from 1 st wash)
Inhibited water added 474.3 g
2 nd wash with inhibited water
AN -102 1 st wash liquid decant1446.5 g
AN -102 2 nd wash liquid decant612.9 g
AN -102 solids (from 2 nd wash)
Inhibited water added 503.6 g
3 rd wash with inhibited water
AN -102 3 rd wash liquid decant654.2 g
AN -102 solids (from 3 rd wash)
701.0 g recovered
(liquid decanted)
(liquid decanted)
(liquid decanted)
AN -102 solids from 3 rd wash used in gas generation testing
AN -102 solids 1817.42 g
AN -102 test material as- received from BNFL -TP -41500 -015
Sub - samples AN - 102 AR - J, AR - K, AR - L, AR - M, and AR - N(2129.51g)
AN -102 liquid decant312.09 g
Decant as -received sample
AN -102 solids 1817.42 g
Inhibited water added (0.01 NaOH )
998.12 g
1 st wash with inhibited water
AN -102 solids (from 1 st wash)
Inhibited water added 474.3 g
2 nd wash with inhibited water
AN -102 1 st wash liquid decant1446.5 g
AN -102 2 nd wash liquid decant612.9 g
AN -102 solids (from 2 nd wash)
Inhibited water added 503.6 g
3 rd wash with inhibited water
AN -102 3 rd wash liquid decant654.2 g
AN -102 solids (from 3 rd wash)
701.0 g recovered
(liquid decanted)
(liquid decanted)
(liquid decanted)
AN -102 solids from 3 rd wash used in gas generation testing
AN-102 solidsSub-Sample Extracted
X-ray Diffraction1-2 mg
Scanning ElectronMicroscopy0.5-0.1 mg
Figure 2.1. Flow Chart Describing Origin of AN-102 Washed Solids (adapted from Bryan et al. 2002)
2.2 Composition of Solids Total chemical analyses of the AN-102 and AZ-101 washed and unwashed solids are reported in Bryan et al. (2002) and Urie et al. (2002). In Tables 2.1 and 2.2, only the major components are reported in atom percent (at%). As the SEM-EDS detection depends on atom concentration, this is more useful for interpreting the microscopy analyses. Comparison of the total chemical analyses with the analyses from XRD, SEM, and EDS can be used to determine how representative the microcharacterization has been of the bulk material.
2.3
In AN-102 there are high concentrations of Al, F, N, and Na (of the EDS detectable elements). The minor components include Cl, Ru, Mn, Cr, Fe, and U. In AZ-101, the major EDS detectable components are Al, F, N, S, Na, Si, Fe, and Zr. Minor components are Mg, P, K, Ca, Cr, Ni, Mn, La, Cd, and U.

2.4
Table 2.1. Composition of AN-102 Washed Solids reported in atomic % (at%) (adapted from Bryan et al. 2002)
Element/Species Washed Solids Element/Species Washed Solids Al 18.153% Oxalate 7.443% Br 0.054% Pb 0.040% Ca 0.079% P 0.033% Cl 0.356% Ru 1.859% Cr 0.751% Si 0.077% F 4.589% Sn 0.012% Fe 0.469% S 0.028% K 0.100% U 0.649%
Mn 0.103% V 0.026% Na 60.158% W 0.000% Ni 0.007% Y 0.048% N 4.962% Zr 0.002%
Table 2.2. Composition of Washed and Unwashed AZ-101 Solids reported in atomic % (at%) (adapted from Urie et al. 2002)
Element/Species Unwashed Washed Element/Species Unwashed Washed Al 43.423% 52.977% Na 26.799% 16.043% Ba 0.031% 0.038% Nd 0.075% 0.093%
C as TIC(a) 6.020% 5.749% Ni 0.407% 0.504% C as TOC(a) 0.589% 0.286% N 2.509% 0.760%
Ca 0.517% 0.639% P 0.498% 0.557% Cd 0.358% 0.443% Pb 0.020% 0.025% Ce 0.018% 0.023% Pd 0.008% 0.009% Cl 0.027% 0.009% Rb 0.026% 0.032% Cr 0.133% 0.117% Ru 0.098% 0.121% Cu 0.032% 0.040% Si 1.170% 1.422% F 1.865% 1.932% S 2.155% 1.863% Fe 10.320% 12.817% Sr 0.035% 0.044% K 0.309% 0.325% Te 0.013% 0.016% La 0.111% 0.138% Th 0.004% 0.005% Mg 0.156% 0.193% U 0.133% 0.165% Mn 0.232% 0.287% Y 0.011% 0.014% Mo 0.013% 0.013% Zr 1.843% 2.283%
(a) TIC = total inorganic carbon. (b) TOC = total organic carbon.

2.5
2.3 Microstructural Analysis of Subsamples Samples for SEM (<2 mg) and XRD (20–50 mg) were produced in the Shielded Analytical Laboratory (SAL). For SEM, a small sample aliquot was placed on a clean glass slide in the SAL and transferred to another laboratory fume hood. Sub-samples were extracted from the larger sample and deposited on a sticky carbon tape mounted on a SEM stub. The SEM sample was examined in a JEOL840 (JEOL USA Inc., Boston, MA) SEM equipped with a backscattered electron detector and an Oxford (Oxford Instruments X-ray Technologies, Inc., Santa Cruz, CA) x-ray EDS system in the 326 Building. Because of the carbon coating used to make the sample conductive, the detector was unable to detect elements lighter than carbon. 2.3.1 Scanning electron microscopy All SEM images were obtained in backscattered electron imaging mode with a 20 keV electron beam. This is sometimes a less effective method for obtaining morphological information on many of the phases; however, it is the preferable technique for finding different phases and obtaining EDS data rapidly over a wide energy range. Because the sample was not a polished flat section, it can be unreliable to extract quantitative data from these types of analyses. The SEM sample volume was significantly smaller than the XRD sample size due to radiological issues. Initial samples of AZ-101 were prepared for SEM in the SAL; however, the samples were too radioactive for transfer to Building 326. Using a fine needle, we transferred a small quantity of the sample intended for SEM onto another SEM mount. This reduced the radiation level associated with the sample by about 100 times; however, it similarly reduced the sample size and possibly made this new sample much less representative of the bulk homogenized sample. Because the intention of this study was to identify phases rather than quantify the amount of each phase, the representativeness of samples was not considered a critical issue. The sample was transported to the SEM in Building 326 and examined in the JEOL840 SEM. The SEM magnification scale was calibrated with two National Institute for Standards and Tech-nology (NIST) traceable standards (NIST-4202A and NIST-4250A). Particles from NIST-4202A containing 2.013±0.025 µm polymeric spheres and NIST-4250A containing 50.4±1.0 µm polymeric spheres were placed on a SEM stub, carbon coated, and examined. The NIST standards were similar to those used to check the light scattering equipment. The SEM images of the spheres are shown in Fig-ure 2.2. In both cases, the SEM magnification was within acceptable tolerances. For NIST-4202A, dimensions of 2.045, 2.122, and 1.89 µm were obtained. The SEM image of the particles in Figure 2.2a does not show the complete spheres at this magnification and image contrast range. The polymeric spheres in NIST-4202A did not appear to be perfectly spherical. For NIST-4250A, dimensions of 46.85 and 48.47 µm were obtained. The errors in the SEM magnification were therefore estimated to be <10%.

2.6
Figure 2.2a. NIST-4202A Polymeric Spheres Figure 2.2b. NIST-4250A Polymeric Spheres
2.3.2 X-ray energy dispersive spectroscopy The EDS system was calibrated with known compounds of SrCO3 and NaNO3. These were also analyzed with XRD (see Section 2.3.3). In Figure 2.3, energy positions of peaks measured on the EDS system have been compared with literature values. The agreement between literature and experimental values was excellent, demonstrating that the system was calibrated correctly for analyzing characteristic x-rays at both low and high energies.
0
2
4
6
8
10
12
14
16
0 2 4 6 8 10 12 14 16
y = 0.0031935 + 0.99707x R= 1
Exp
erim
enta
l Val
ues (
keV
)
Literature Values (keV) Figure 2.3. Calibration Check of EDS System

2.7
A comparison of literature energy x-ray line positions was made against experimentally derived values from a carbon-coated SrCO3 and NaNO3 sample with the JEOL 840 EDS system. The correlation coefficient (R) is 1.00 for the JEOL 840 Oxford EDS detectors. The error in the peak energy assignments was estimated to be <1%. A low energy peak was observed in most EDS spectra taken in this study. This is a detector artifact and should be ignored. 2.3.3 X-ray diffraction XRD was performed with a Scintag (ThermoARL, Germany) diffractometer. The XRD samples of the tank waste solids were prepared in the SAL hot cells. The samples were dried at 90°C overnight, crushed and mixed with colloid ion, and deposited onto a clean glass slide. The samples were often covered by the dissolved solids, sodium nitrite, and nitrate phases that formed by evaporation on the slide. The XRD sample preparation exacerbated evaporite formation. The evaporites XRD signal tended to mask the other phases present. A NIST traceable internal standard, corundum (Al2O3), was run. The accuracy of the XRD system was tested by running two samples (SR-1 and SR-2) containing SrCO3 (strontianite) and NaNO3 (nitratite) (see Figure 2.4). These phases were chosen for calibration because they are similar to the phases observed in the tank samples. The agreement between literature values for NaNO3 and SrCO3 with the experimentally obtained data was excellent. All XRD slides were transferred to the XRD lab and run for eight hours (step size was 0.02° with 20-second dwell time). The data were analyzed using the International Centre for Diffraction Data (JCPDS) databases. The correlation coefficients were close to 1.00 in SR-2 and SR-1. The errors in XRD measurements are estimated to be <0.5%.
0.15
0.2
0.25
0.3
0.35
0.4
0.45
0.15 0.2 0.25 0.3 0.35 0.4 0.45
SR-2SR-1
y = 0.0007016 + 0.995x R= 1 y = 0.000793 + 0.9956x R= 1
Mea
sure
d d-
spac
ings
Literature d-spacings
Figure 2.4. Plot Showing Accuracy of XRD Analysis on the Scintag Instrument

2.8
2.3.4 Infrared spectroscopy Infrared spectroscopy was applied to Hanford waste tank simulants by Johnston et al. (2002) to determine the nature of alumina species in strongly alkaline solutions. The technique is effective at identifying the presence of carbonate, nitrate, and nitrite groups as well as organics that may be present. The entire scan might also serve as a fingerprint for comparing simulants and actual wastes. Possible components in the AZ-101 washed solids and a series of standard samples were identified using infrared spectroscopy. The samples were mixed at various concentrations with vacuum-dried potassium bromide. Pellets were made of these mixtures and spectral data acquired on a Nicolet (ThermoNicolet, Madison, WI) 750 infrared spectrometer. For testing the system, a spectrum of a sample containing SrCO3 and NaNO3 was examined. The IR analysis without spectra from the pure phases can be difficult to interpret. From Figure 2.5, it appears that the carbonate is bound to Sr in a unidentate (Cs) fashion because the splitting near 1400 cm-1 is around 100 cm-1. Bidentate coordination (C3v) usually causes larger splitting, on the order of 200-300 cm-1, as the bonding becomes increasingly covalent.
Sr-1 Simula
-0.100.400.901.401.902.402.90
541
607
674
740
806
872
938
1004
1070
1136
1202
1268
1334
1400
1466
1532
1598
1664
1730
1796
1862
1929
Wavenumbers (c-1)
Figure 2.5. Infrared Spectrum of Sample Containing SrCO3 and NaNO3
2.3.5 Particle size analysis
The Microtrac (Microtrac Inc., Clearwater, FL) X-100 particle analyzer measures particle diameter by scattered light from a laser beam projected through a stream of the sample particles diluted in a suspending medium. For the tank waste solids, the suspending medium composition is shown in Table 3.2. The amount and direction of light scattered by the particles is measured by an optical detector array and then analyzed to determine the size distribution of the particles. This measurement is limited to particles with diameters between 0.12 and 700 µm. The Microtrac (Microtrac Inc., Clearwater, FL) Ultrafine Particle Analyzer (UPA) measures particle diameter by Doppler shifted scattered light. This method is limited to particles with diameters between 3 nm and 6.5 µm. The refractive index of the medium was assumed to be 1.33 and that of the particles 1.50. This is a reasonable value for many of the types of phases (i.e., NaNO3 and Al2O3) expected in the samples.
SrCO3 and NaNO3
Wavenumbers (cm-1)

2.9
The particle size distribution of the AN-102 washed solids sample was measured in the Microtrac X-100 at a flow rate of 40 mL/s. The flow rate was then increased to 60 mL/s and the particle size distribution measured. The sample was then sonicated with 40-W ultrasonic waves for 90 seconds at a flow rate of 60 mL/sec and the particle size distribution measured. Finally, the sample was sonicated a second time with 40-W ultrasonic waves for 90 seconds at a flow rate of 60 mL/sec and the particle size measured. Analyses were performed in triplicate on each sample under all flow/sonication conditions. The average of these triplicate measurements is reported in this document.
For the UPA instrument, no sonication or flow options are available. Therefore, the sample is placed in the instrument and the measurements are performed on the as-received, stationary material.
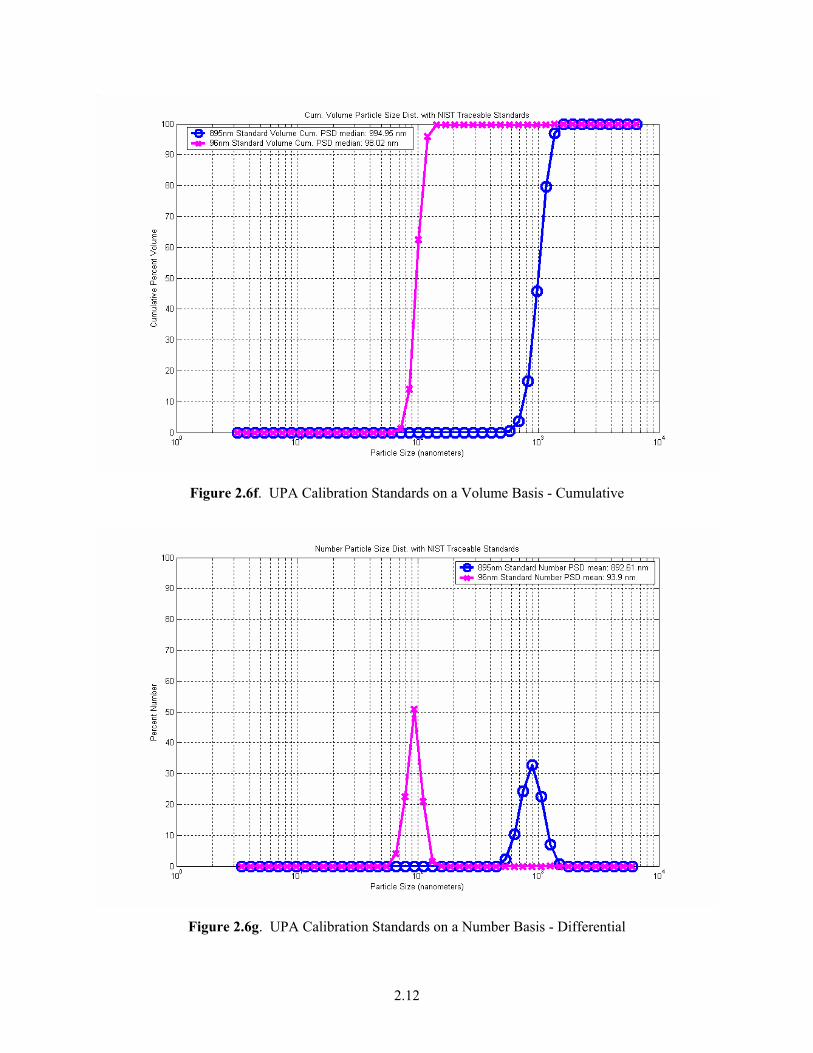
The performance of both instruments was checked against a range of NIST traceable standards from Duke Scientific Corporation. These standards are polystyrene microspheres dispersed in a 1 mM KCl solution. The standards were run prior to analyzing the sample and were the same standards used as a calibration check for the SEM magnification. Results from these standard tests are presented in Fig-ures 2.6a through h. The percentile data shown in the table represent the given percent of the volume (or mass if the specific gravity for all particles is the same) that is smaller than the indicated particle size. The mean diameter of the volume distribution represents the centroid of the distribution and is weighted in the direction of larger particles. The results were within 10% of the NIST traceable values.
Figure 2.6a. X-100 Calibration Standards on a Volume Basis - Differential

2.10
Figure 2.6b. X-100 Calibration Standards on a Volume Basis - Cumulative
Figure 2.6c. X-100 Calibration Standards on a Number Basis - Differential

2.11
Figure 2.6d. X-100 Calibration Standards on a Number Basis - Cumulative
Figure 2.6e. UPA Calibration Standards on a Volume Basis - Differential
2.12
Figure 2.6f. UPA Calibration Standards on a Volume Basis - Cumulative
Figure 2.6g. UPA Calibration Standards on a Number Basis - Differential

2.13
Figure 2.6h. UPA Calibration Standards on a Number Basis - Cumulative
3.1
3.0 Analysis of Washed AN-102 Solids
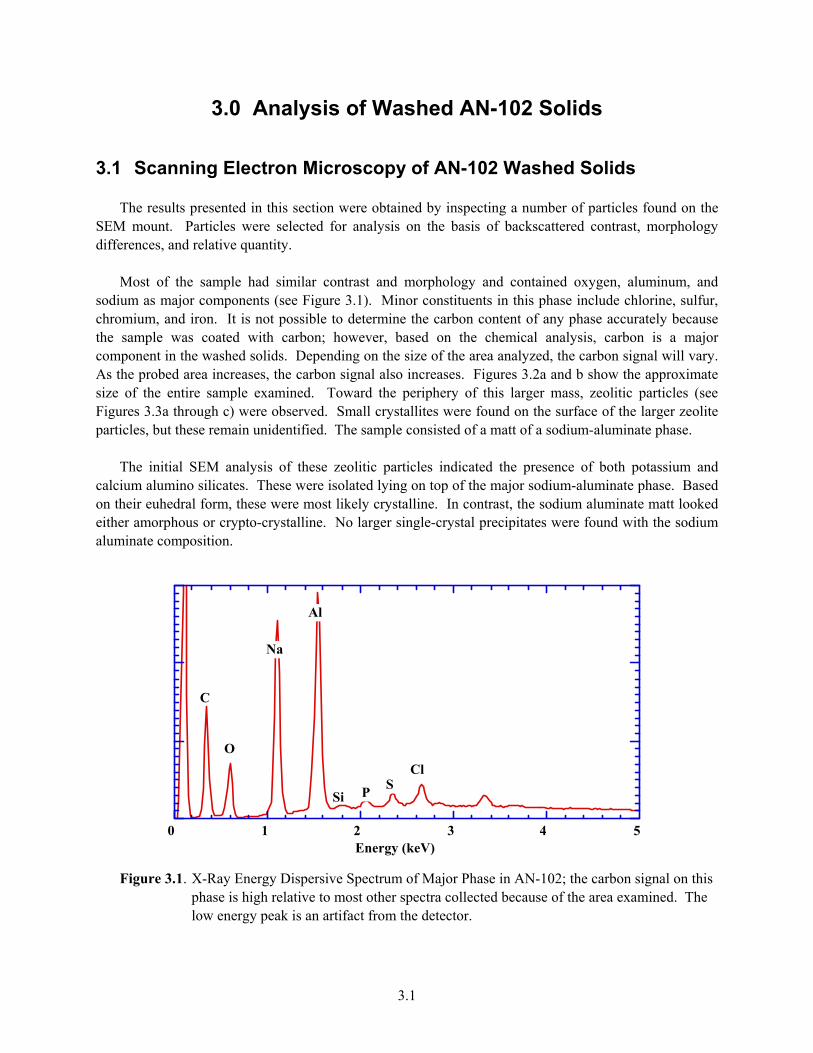
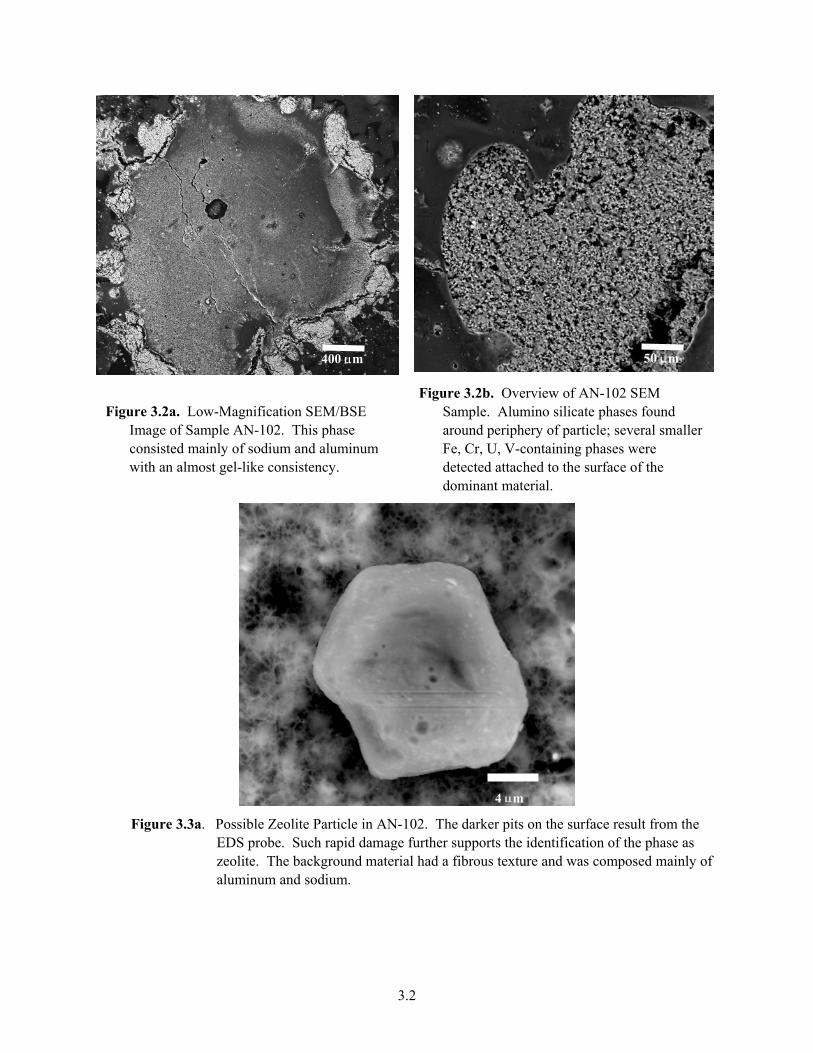
3.1 Scanning Electron Microscopy of AN-102 Washed Solids The results presented in this section were obtained by inspecting a number of particles found on the SEM mount. Particles were selected for analysis on the basis of backscattered contrast, morphology differences, and relative quantity. Most of the sample had similar contrast and morphology and contained oxygen, aluminum, and sodium as major components (see Figure 3.1). Minor constituents in this phase include chlorine, sulfur, chromium, and iron. It is not possible to determine the carbon content of any phase accurately because the sample was coated with carbon; however, based on the chemical analysis, carbon is a major component in the washed solids. Depending on the size of the area analyzed, the carbon signal will vary. As the probed area increases, the carbon signal also increases. Figures 3.2a and b show the approximate size of the entire sample examined. Toward the periphery of this larger mass, zeolitic particles (see Figures 3.3a through c) were observed. Small crystallites were found on the surface of the larger zeolite particles, but these remain unidentified. The sample consisted of a matt of a sodium-aluminate phase. The initial SEM analysis of these zeolitic particles indicated the presence of both potassium and calcium alumino silicates. These were isolated lying on top of the major sodium-aluminate phase. Based on their euhedral form, these were most likely crystalline. In contrast, the sodium aluminate matt looked either amorphous or crypto-crystalline. No larger single-crystal precipitates were found with the sodium aluminate composition.
0 1 2 3 4 5Energy (keV)
Al
Na
O
SSi
C
P
Cl
Figure 3.1. X-Ray Energy Dispersive Spectrum of Major Phase in AN-102; the carbon signal on this
phase is high relative to most other spectra collected because of the area examined. The low energy peak is an artifact from the detector.
3.2
Figure 3.2a. Low-Magnification SEM/BSE Image of Sample AN-102. This phase consisted mainly of sodium and aluminum with an almost gel-like consistency.
Figure 3.2b. Overview of AN-102 SEM Sample. Alumino silicate phases found around periphery of particle; several smaller Fe, Cr, U, V-containing phases were detected attached to the surface of the dominant material.
Figure 3.3a. Possible Zeolite Particle in AN-102. The darker pits on the surface result from the
EDS probe. Such rapid damage further supports the identification of the phase as zeolite. The background material had a fibrous texture and was composed mainly of aluminum and sodium.
400 µm 50 µm
4 µm

3.3
0 1 2 3 4 5 6 7Energy (keV)
Fe
Al
Na
O
Ca
Si
C K
Figure 3.3b. EDS Analysis of Zeolite Phase. The alumino silicate phase contains calcium and a lesser
amount of potassium and sodium.
Figure 3.3c. Another Example of an Alumino Silicate Phase in AN-102
As can be seen in Figure 3.3c, the zeolitic particles had much smaller phases lying on the surface. It was not possible to determine the nature of the phases on the surface of the zeolitic phases. The XRD signal strength will depend both on the crystallinity and the composition of the particles. A small amount of crystalline phase consisting of heavy metals could generate a stronger XRD signal than a
2 µm

3.4
larger mass of an amorphous low-Z material. In Figures 3.4 through 3.7, EDS analyses and SEM images of a series of high-Z particles found in AN-102 are shown. In Figure 3.4, an overview of these types of particles is shown. With backscattered imaging, uranium-bearing particles can be easily identified (Figure 3.5). Unlike the darker (low Z) particles that looked liked aggregates of many particles, the high-Z particles appeared to be individual crystals. Figure 3.6b is a yttrium vanadate phase. In Figures 3.5a and b, SEM analysis of a uranium oxide particle is shown. The EDS analysis of a cerium oxide particle is shown in Figure 3.6a, and in Figures 3.7a through c SEM-EDS analysis of iron-bearing particles is shown. These heavy minerals may also respond differently during laser light scattering particle size measurements than the light material because of their higher refractive indexes, although they represent a very minor component of the AN-102 sample. It is not possible to quantify the amount of particles in the sample with SEM techniques.
Figure 3.4. SEM/BSE Image of a Series of High-Z Particles on the Surface of Amorphous Material
In Figure 3.4, the white (bright) (high Z) particles were determined to be uranium oxide (EDS11), cerium oxide (EDS12), and a calcium-bearing phase, possibly calcite (EDS13). The mass of the material below was the sodium aluminate phase.
EDS11 EDS12
EDS13
20 µm
3.5
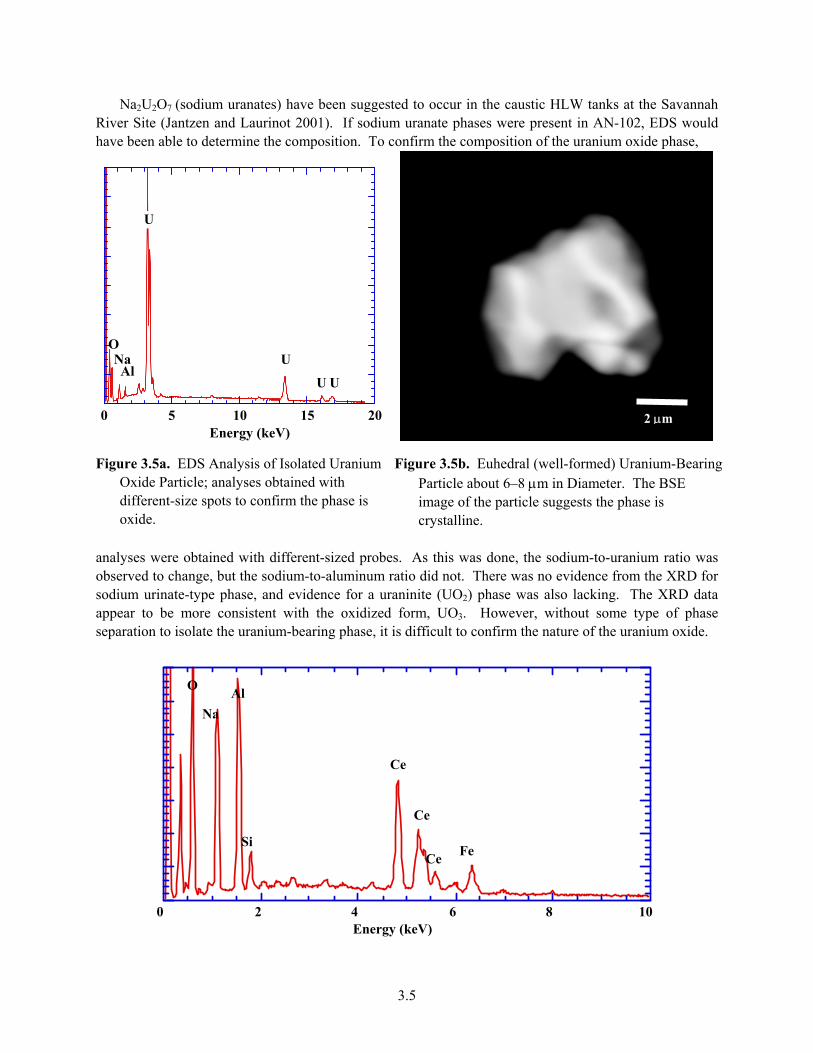
Na2U2O7 (sodium uranates) have been suggested to occur in the caustic HLW tanks at the Savannah River Site (Jantzen and Laurinot 2001). If sodium uranate phases were present in AN-102, EDS would have been able to determine the composition. To confirm the composition of the uranium oxide phase,
0 5 10 15 20Energy (keV)
U
UAl
NaO
U U
Figure 3.5a. EDS Analysis of Isolated Uranium Oxide Particle; analyses obtained with different-size spots to confirm the phase is oxide.
Figure 3.5b. Euhedral (well-formed) Uranium-Bearing Particle about 6–8 µm in Diameter. The BSE image of the particle suggests the phase is crystalline.
analyses were obtained with different-sized probes. As this was done, the sodium-to-uranium ratio was observed to change, but the sodium-to-aluminum ratio did not. There was no evidence from the XRD for sodium urinate-type phase, and evidence for a uraninite (UO2) phase was also lacking. The XRD data appear to be more consistent with the oxidized form, UO3. However, without some type of phase separation to isolate the uranium-bearing phase, it is difficult to confirm the nature of the uranium oxide.
0 2 4 6 8 10Energy (keV)
Ce
Ce
AlNa
O
FeSi
Ce
2 µm

3.6
Figure 3.6a. EDS Analysis of Cerium Oxide Particle, Possibly Cerianite; the Na and Al signals are coming from the surrounding regions of the sample
0 5 10 15 20Energy (keV)
V
Mn Y
Y
Al
NaO
Y
Figure 3.6b. EDS Analysis of a Yttrium Vanadate Particle Found in Sample AN-102
No other trace elements were observed in the uranium phase. Uranium is present in AN-102 at 3x10² µg/g solid. Under backscattered imaging, the uranium-bearing particles are easily observable. The SEM is biased against lower average atomic number phases as these are less visible in the SEM under both backscatter electron (BSE) and secondary imaging conditions. Hence, most other elements present at similar levels in the waste were more difficult to detect in the SEM than uranium.
0 5 10 15Energy (keV)
Cr
Fe
Ni
SiAl
NaO
Figure 3.7a. EDS Analysis of Chromite Particle Figure 3.7b. BSE Image of the
Chromite Particle
10 µm
3.7
Both yttrium and vanadium are trace components in AN-102, present at about 2x101 µg/g solids. Cerium was also a trace component in the AN-102 washed solids. Chlorine, sulfur, silicon, and phosphorus were detected in the EDS analysis of some phases, such as the cerianite particle. However, these are most likely present in the sodium aluminate phase which was ubiquitous within AN-102.
0 2 4 6 8 10Energy (keV)
FeAlNa
O
Fe
Si
C
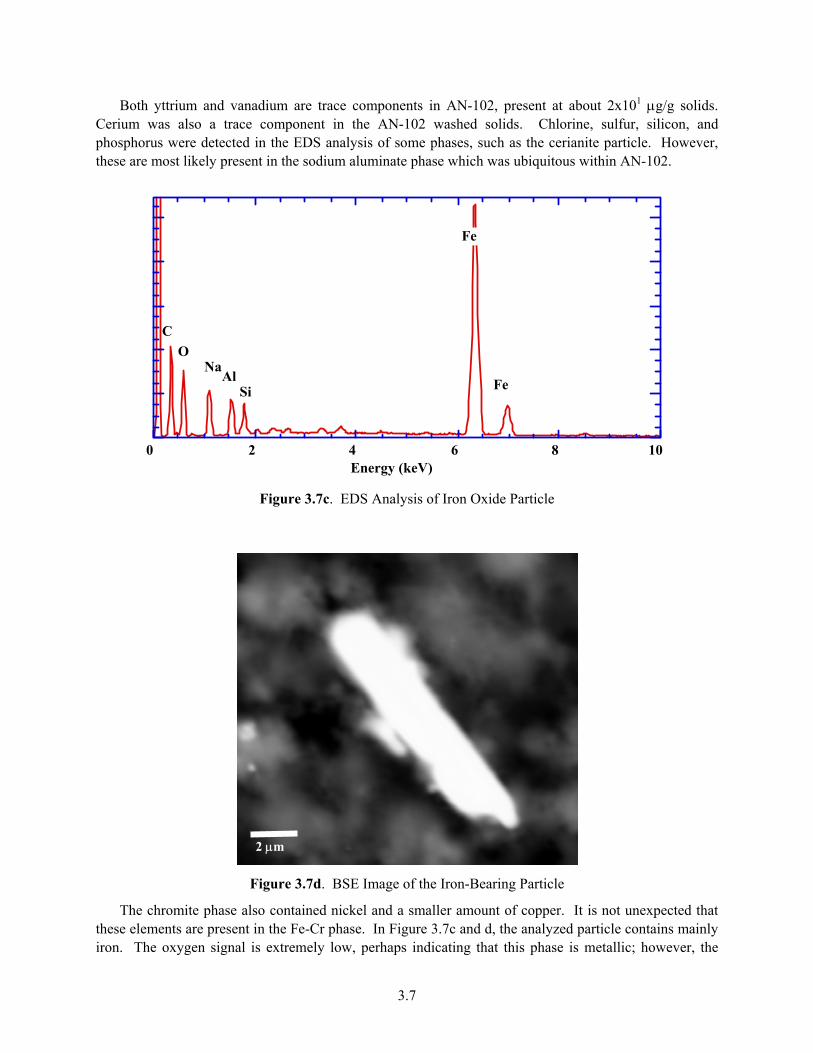
Figure 3.7c. EDS Analysis of Iron Oxide Particle
Figure 3.7d. BSE Image of the Iron-Bearing Particle
The chromite phase also contained nickel and a smaller amount of copper. It is not unexpected that these elements are present in the Fe-Cr phase. In Figure 3.7c and d, the analyzed particle contains mainly iron. The oxygen signal is extremely low, perhaps indicating that this phase is metallic; however, the
2 µm
3.8
weak oxygen x-rays can easily be attenuated in these types of samples and it is very unlikely that a micron-sized particle would remain metallic in a waste tank. The XRD scan also suggested that hematite (Fe2O3) may be present.
3.2 X-Ray Diffraction A single XRD scan was run on the AN-102 washed solids sample. The major and minor lines are listed in Table 3.1 with possible assignments. The XRD scan is shown in Figure 3.8 with the background removed. The d-spacings of several major phases are also shown for phase identification. The spectrum consists of a limited number of sharp diffraction peaks with minor, broader peaks. The major lines can be matched with sodium nitrate (NaNO3) and sodium nitrite (NaNO2) and the broad lines with boehmite (AlOOH). The nitrite and nitrate phases are dissolved solids that formed during sample preparation in the SAL hot cells. These broad peaks suggest that the boehmite is poorly crystalline, perhaps a gel-like consistency. This could have important implications for waste treatment. Gibbsite is not present at detectable levels in the AN-102 sample. It is interesting that these phases containing sodium are still the major crystalline phases in the washed solids sample. Many of the minor lines have been matched with additional phases based on the SEM-EDS analyses. The SEM images suggest the presence of a large amount of amorphous material. This material was composed of mainly aluminum and sodium and was not detected during the XRD scan. Cancrinite [(Na,Ca,K)7.4Al6Si6O24(CO3)1.6•2.1H2O] and sodalite [Na4Si3Al3O12Cl] have been reported to form in caustic solutions under hydrothermal conditions (evaporators) (Jantzen and Laurinot 2001) and in Hanford tank waste (Krumhansl et al. 1999); however, no direct evidence is seen for either of these phases in the AN-102 sample. Major reflections for cancrinite would be expected at 0.321, 0.464, 0.364, and 0.210 nm (Ref: JCPDS 25-776) and at 0.362, 0.627, 0.209, and 0.237 nm for sodalite (JCPDS 20-495). In Nature, both sodalite and cancrinite are found as constituents of plutonic igneous rocks; however, cancrinite has been observed in Hanford tank wastes. These cancrinites often have nitrate ions incorporated into the structure. The aluminum hydroxide phase, boehmite (AlOOH), was a reasonable match with XRD. The sodium nitrate and sodium nitrite phases appear to be clearly present, according to XRD, with well-defined sharp peaks; however, it was not possible to identify conclusively these phases with SEM-EDS. In one instance, there was evidence of small peak suggestive of nitrogen; however, generally, it is not possible to detect nitrogen with EDS.

Table 3.1. X-Ray Diffraction Data from AN-102 Washed Solids
2-Theta d(nm) BG Height I% Area I% FWHM P/N Possible Assignments 8.987 0.9832 16 278 11.8 1325 11.3 0.203 8.1 zeolite
13.737 0.6441 22 56 2.4 399 3.4 0.303 3.2 UO3, sodium aluminate 14.601 0.60617 63 161 6.8 2253 19.1 0.595 5.4 boehmite, AlOOH 14.952 0.59202 23 169 7.2 2362 20.1 0.594 6.1 NA 17.059 0.51933 13 387 16.4 1316 11.2 0.145 9.7 sodium sulfate 20.331 0.43643 15 45 1.9 89 0.8 0.084 2.9 UO3 23.790 0.37370 42 70 3.0 145 1.2 0.088 3.3 zeolite, sodium aluminate 25.727 0.34599 21 106 4.5 271 2.3 0.109 4.7 UO3 27.402 0.32521 56 127 5.4 455 3.9 0.152 4.7 UO3 28.155 0.31668 118 317 13.4 4067 34.6 0.545 7.6 boehmite, AlOOH 29.462 0.30293 217 2362 100.0 7966 67.7 0.143 23.3 nitratite (NaNO3) 30.085 0.29679 113 645 27.3 2345 19.9 0.155 11.7 sodium nitrite 30.911 0.28905 58 405 17.1 1529 13.0 0.160 9.4 NA 31.745 0.28164 53 689 29.2 6230 52.9 0.384 12.6 nitratite, sodium oxalate, UO3 32.101 0.27860 49 313 13.3 2878 24.5 0.391 8.2 NaNO2, uraninite, Na aluminate 34.454 0.26009 73 1576 66.7 11770 100.0 0.317 19.4 iron chromium oxide, sodium oxalate 35.509 0.25260 37 292 12.4 1117 9.5 0.163 8.0 sodium aluminate 36.352 0.24693 6 69 2.9 137 1.2 0.084 4.0 boehmite, AlOOH 38.562 0.23328 72 903 38.2 9635 81.9 0.453 14.5 sodium oxalate, sodium aluminate 39.090 0.23025 41 855 36.2 5912 50.2 0.294 14.3 nitratite 41.577 0.21703 23 125 5.3 744 6.3 0.253 5.1 NA 42.311 0.21343 42 101 4.3 448 3.8 0.189 4.2 NA 42.616 0.21197 17 330 14.0 1934 16.4 0.249 8.9 sodium aluminate 44.544 0.20324 17 317 13.4 1908 16.2 0.256 8.7 sodium nitrite 45.206 0.20041 40 234 9.9 701 6.0 0.127 7.1 sodium aluminate 46.885 0.19362 63 123 5.2 270 2.3 0.093 4.5 uraninite 47.307 0.19199 78 73 3.1 231 2.0 0.134 3.0 nitratite 47.960 0.18953 87 222 9.4 1009 8.6 0.193 6.3 NA 48.408 0.18788 87 292 12.4 1653 14.0 0.241 7.5 NA 49.150 0.18521 157 333 14.1 3297 28.0 0.421 7.5 boehmite 50.147 0.18176 26 122 5.2 781 6.6 0.272 5.0 NA 51.187 0.17831 24 66 2.8 208 1.8 0.134 3.5 sodium aluminate
3.9
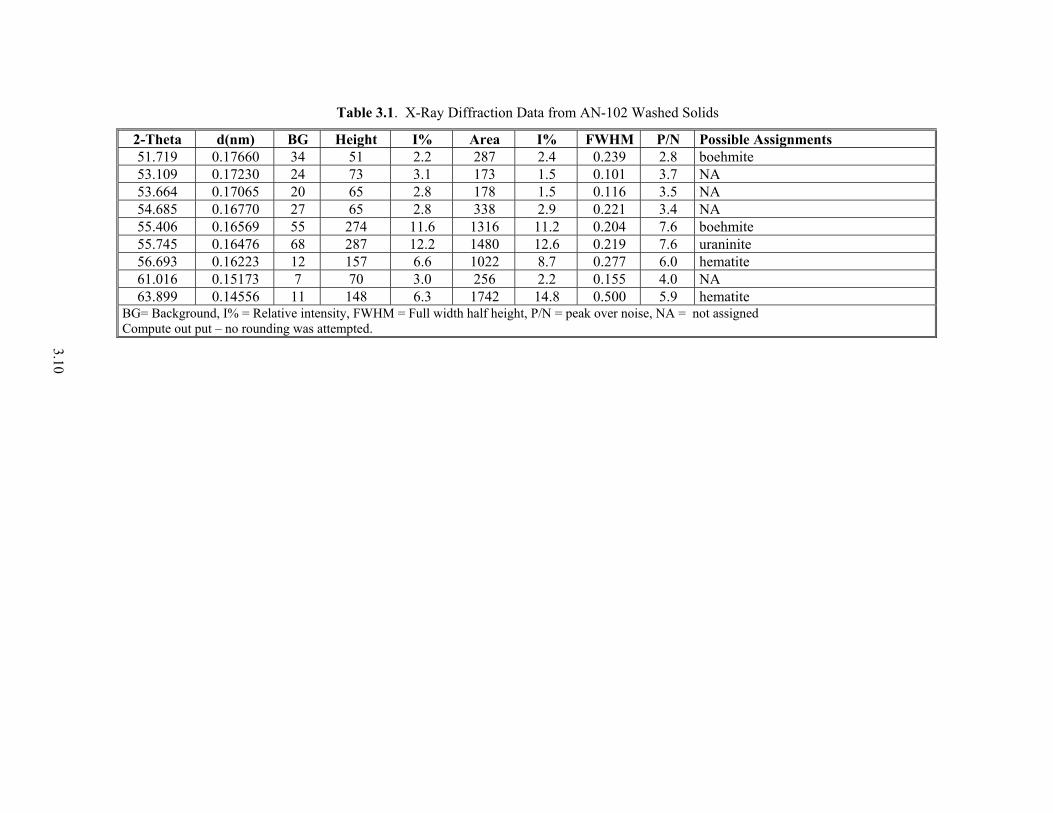
Table 3.1. X-Ray Diffraction Data from AN-102 Washed Solids
2-Theta d(nm) BG Height I% Area I% FWHM P/N Possible Assignments 51.719 0.17660 34 51 2.2 287 2.4 0.239 2.8 boehmite 53.109 0.17230 24 73 3.1 173 1.5 0.101 3.7 NA 53.664 0.17065 20 65 2.8 178 1.5 0.116 3.5 NA 54.685 0.16770 27 65 2.8 338 2.9 0.221 3.4 NA 55.406 0.16569 55 274 11.6 1316 11.2 0.204 7.6 boehmite 55.745 0.16476 68 287 12.2 1480 12.6 0.219 7.6 uraninite 56.693 0.16223 12 157 6.6 1022 8.7 0.277 6.0 hematite 61.016 0.15173 7 70 3.0 256 2.2 0.155 4.0 NA 63.899 0.14556 11 148 6.3 1742 14.8 0.500 5.9 hematite
BG= Background, I% = Relative intensity, FWHM = Full width half height, P/N = peak over noise, NA = not assigned Compute out put – no rounding was attempted.
3.10
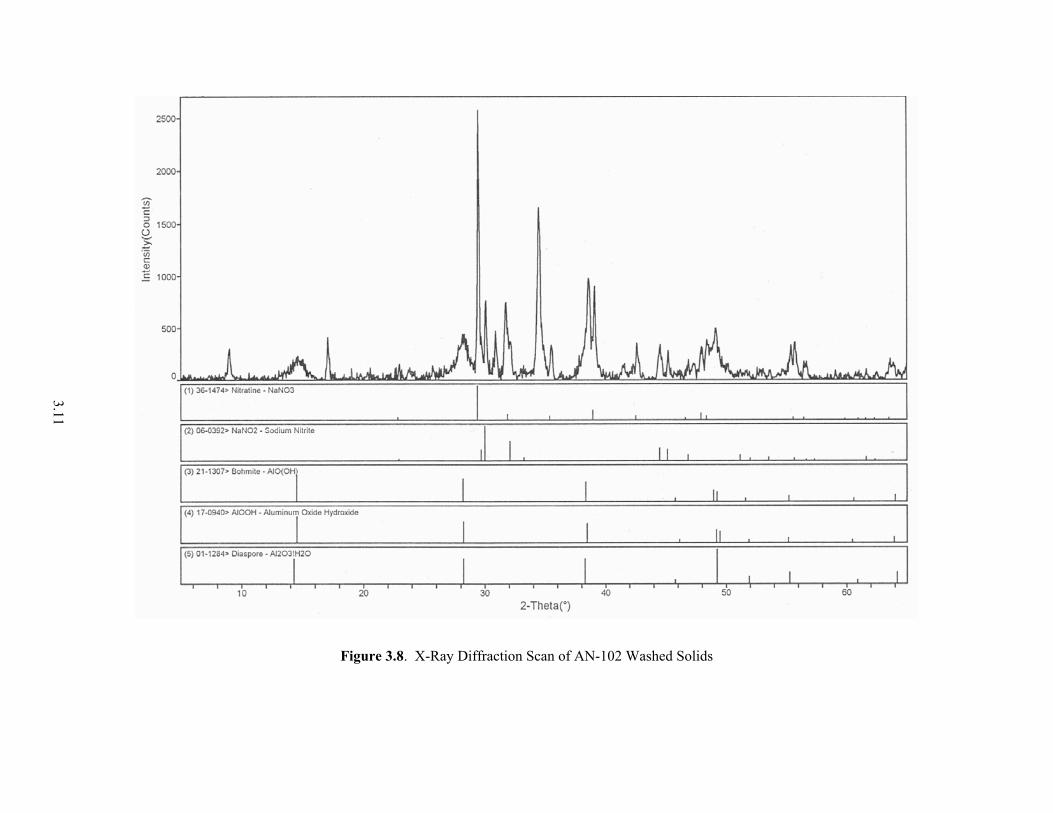
Figure 3.8. X-Ray Diffraction Scan of AN-102 Washed Solids
3.11
3.12
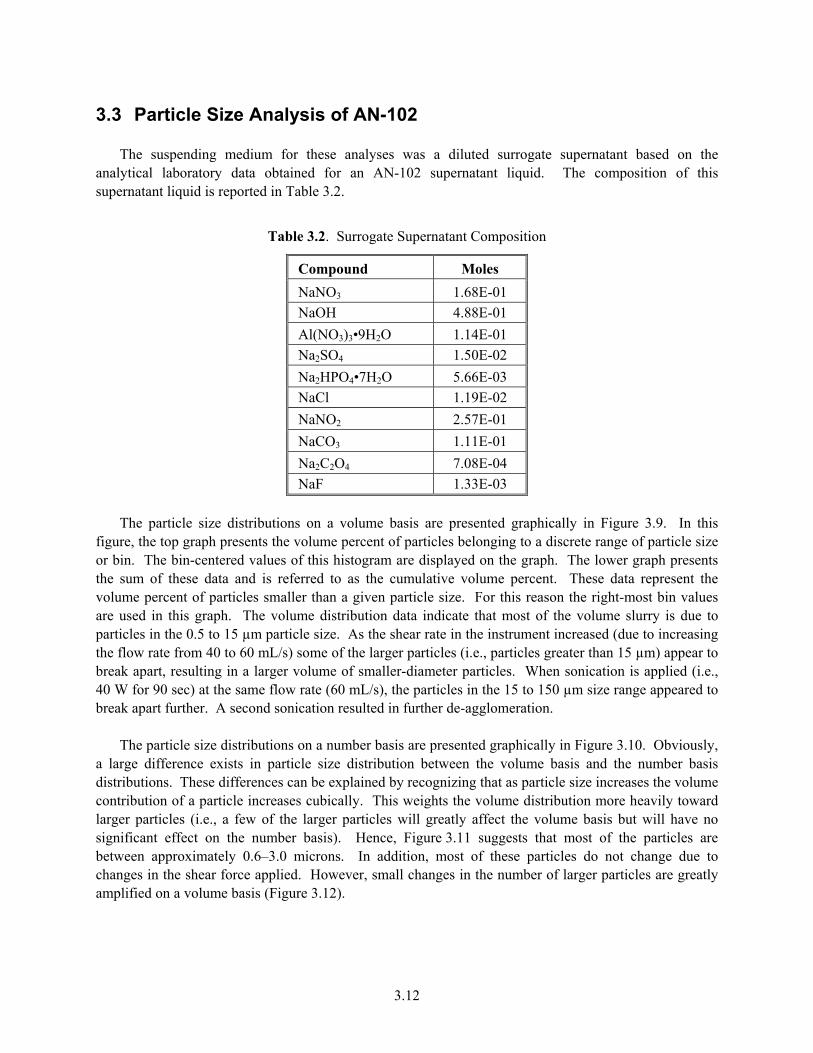
3.3 Particle Size Analysis of AN-102 The suspending medium for these analyses was a diluted surrogate supernatant based on the analytical laboratory data obtained for an AN-102 supernatant liquid. The composition of this supernatant liquid is reported in Table 3.2.
Table 3.2. Surrogate Supernatant Composition
Compound Moles NaNO3 1.68E-01 NaOH 4.88E-01 Al(NO3)3•9H2O 1.14E-01 Na2SO4 1.50E-02 Na2HPO4•7H2O 5.66E-03 NaCl 1.19E-02 NaNO2 2.57E-01 NaCO3 1.11E-01 Na2C2O4 7.08E-04 NaF 1.33E-03
The particle size distributions on a volume basis are presented graphically in Figure 3.9. In this figure, the top graph presents the volume percent of particles belonging to a discrete range of particle size or bin. The bin-centered values of this histogram are displayed on the graph. The lower graph presents the sum of these data and is referred to as the cumulative volume percent. These data represent the volume percent of particles smaller than a given particle size. For this reason the right-most bin values are used in this graph. The volume distribution data indicate that most of the volume slurry is due to particles in the 0.5 to 15 µm particle size. As the shear rate in the instrument increased (due to increasing the flow rate from 40 to 60 mL/s) some of the larger particles (i.e., particles greater than 15 µm) appear to break apart, resulting in a larger volume of smaller-diameter particles. When sonication is applied (i.e., 40 W for 90 sec) at the same flow rate (60 mL/s), the particles in the 15 to 150 µm size range appeared to break apart further. A second sonication resulted in further de-agglomeration. The particle size distributions on a number basis are presented graphically in Figure 3.10. Obviously, a large difference exists in particle size distribution between the volume basis and the number basis distributions. These differences can be explained by recognizing that as particle size increases the volume contribution of a particle increases cubically. This weights the volume distribution more heavily toward larger particles (i.e., a few of the larger particles will greatly affect the volume basis but will have no significant effect on the number basis). Hence, Figure 3.11 suggests that most of the particles are between approximately 0.6–3.0 microns. In addition, most of these particles do not change due to changes in the shear force applied. However, small changes in the number of larger particles are greatly amplified on a volume basis (Figure 3.12).

3.13
Figure 3.9. X100 Particle Size Distribution of AN-102 Washed Solids on a Volume Basis (top–differential; bottom–cumulative)

3.14
Figure 3.10a. X100 Particle Size Distribution of AN-102 Washed Solids on a Number Basis –
Differential
Figure 3.10b. X100 Particle Size Distribution of AN-102 Washed Solids on a Number Basis –
Cumulative
3.15
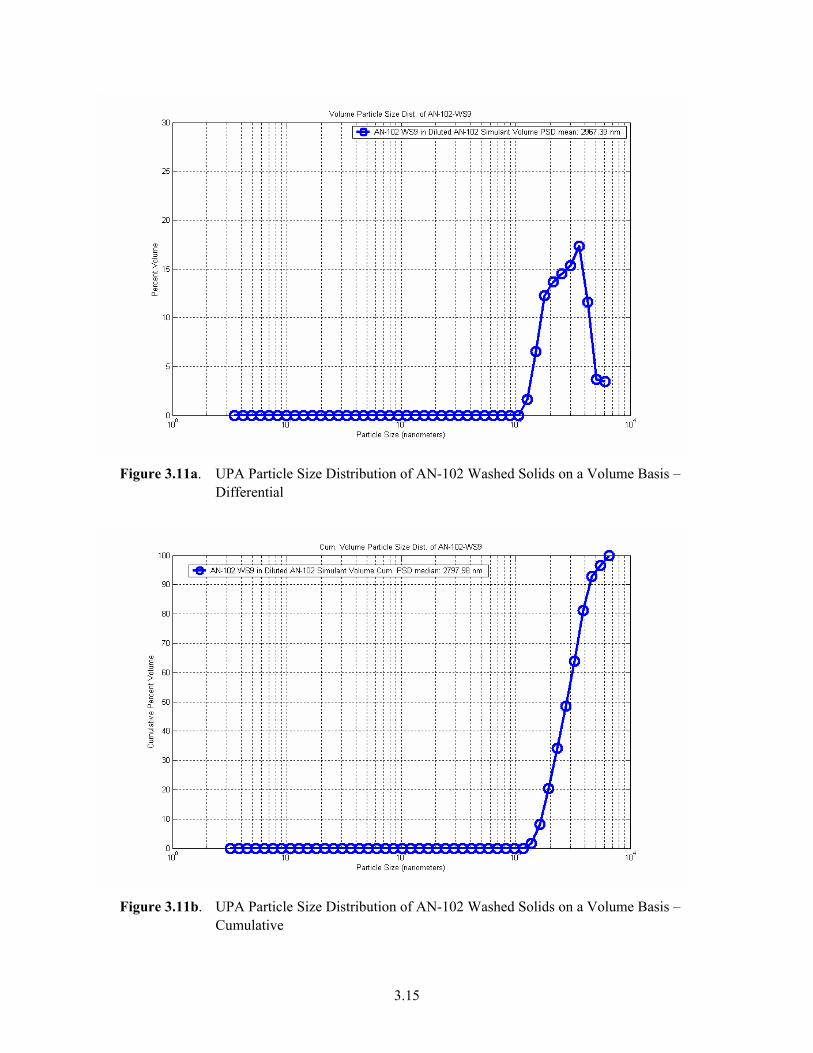
Figure 3.11a. UPA Particle Size Distribution of AN-102 Washed Solids on a Volume Basis –
Differential
Figure 3.11b. UPA Particle Size Distribution of AN-102 Washed Solids on a Volume Basis –
Cumulative

3.16
Figure 3.12a. UPA Particle Size Distribution of AN-102 Washed Solids on a Number Basis –
Differential
Figure 3.12b. UPA Particle Size Distribution of AN-102 Washed Solids on a Number Basis – Cumulative

3.17
Figure 3.13. Medium Magnification of Major Phase in AN-102 Sample; particles of several
sizes observed as agglomerates from 10–50 µm across made up of particles about <1–3 µm in size
As-received samples were also analyzed in the UPA. The particle size range that is common to both the X100 and UPA is 0.12–6.5 microns. The UPA data are consistent with the X100 data over this range on both volume and number bases. Because the UPA did not detect particles smaller than the X100 capabilities, the X100 particle size distribution should be considered reliable to a lower limit of 3 nm.
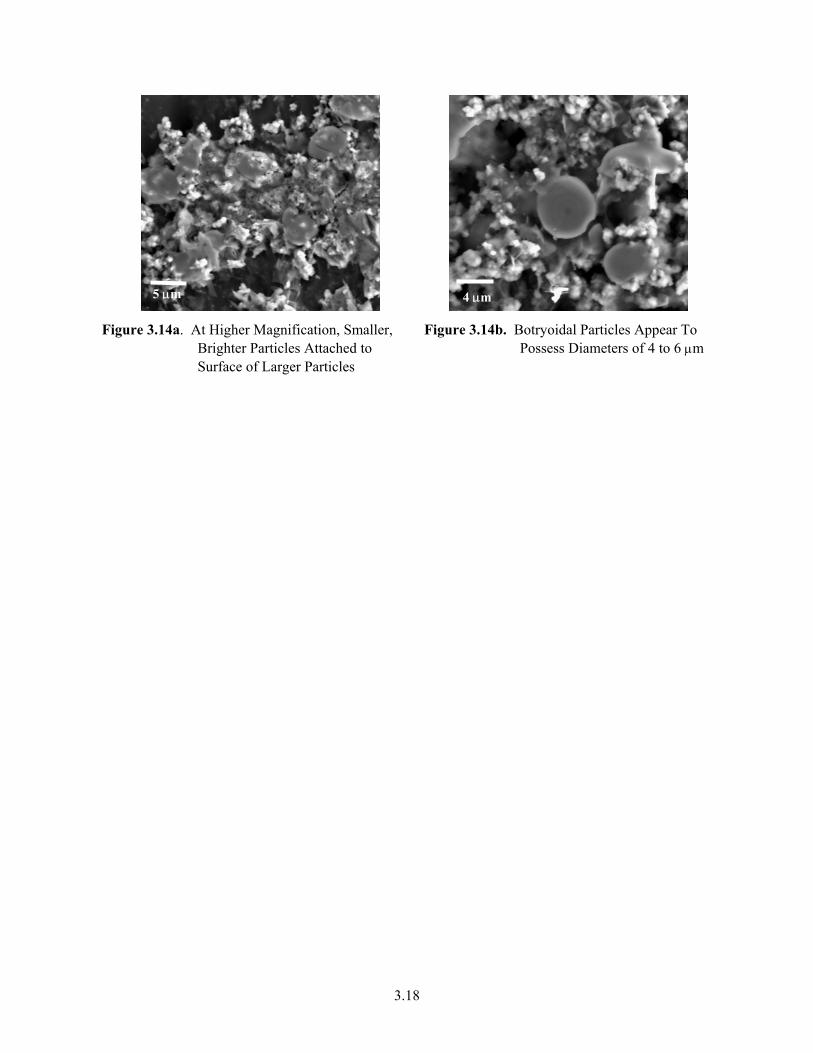
3.4 SEM Analysis of Particle Size in AN-102 Several SEM images of particles can be compared with PSD data. The low-magnification image shown in Figure 3.14 illustrates the nature of AN-102 washed solids as a highly heterogeneous and friable-looking material. The light-scattering analysis indicated that the particles were 0.5 to 15 microns in size. However, with sonication the volume of smaller particles increased, and further sonication resulted in further fragmentation of the sample. Indeed, most of the particles were found to be 0.6–3.0 µm after sonication. In the higher-magnification images, many of the particles are <10µm, and even smaller particles are observable. These laser light-scattering observations were reasonably consistent with the SEM images of AN-102 washed solids. Although the results of the particle size analysis were reasonably consistent with observations made with SEM on the nature of the particles, the sample preparation method for microscopy often results in the formation of soft agglomerated particles. Therefore, the SEM images of particles do not represent the anticipated morphology of the particles during waste processing. These agglomerates form as the solids are dewatered and washed on a dead-end filter. This suggests that the WTP will not see such large agglomerated particles.
10 µm
3.18
Figure 3.14a. At Higher Magnification, Smaller,
Brighter Particles Attached to Surface of Larger Particles
Figure 3.14b. Botryoidal Particles Appear To Possess Diameters of 4 to 6 µm
5 µm 4 µm
4.1
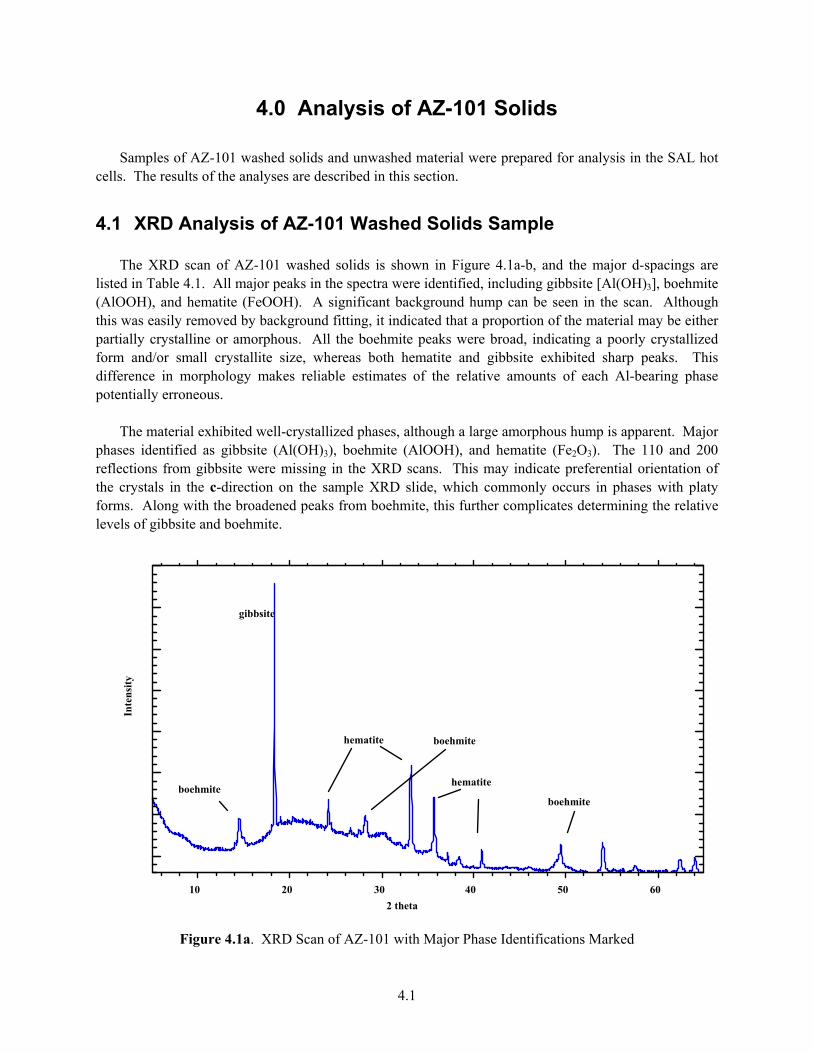
4.0 Analysis of AZ-101 Solids Samples of AZ-101 washed solids and unwashed material were prepared for analysis in the SAL hot cells. The results of the analyses are described in this section.
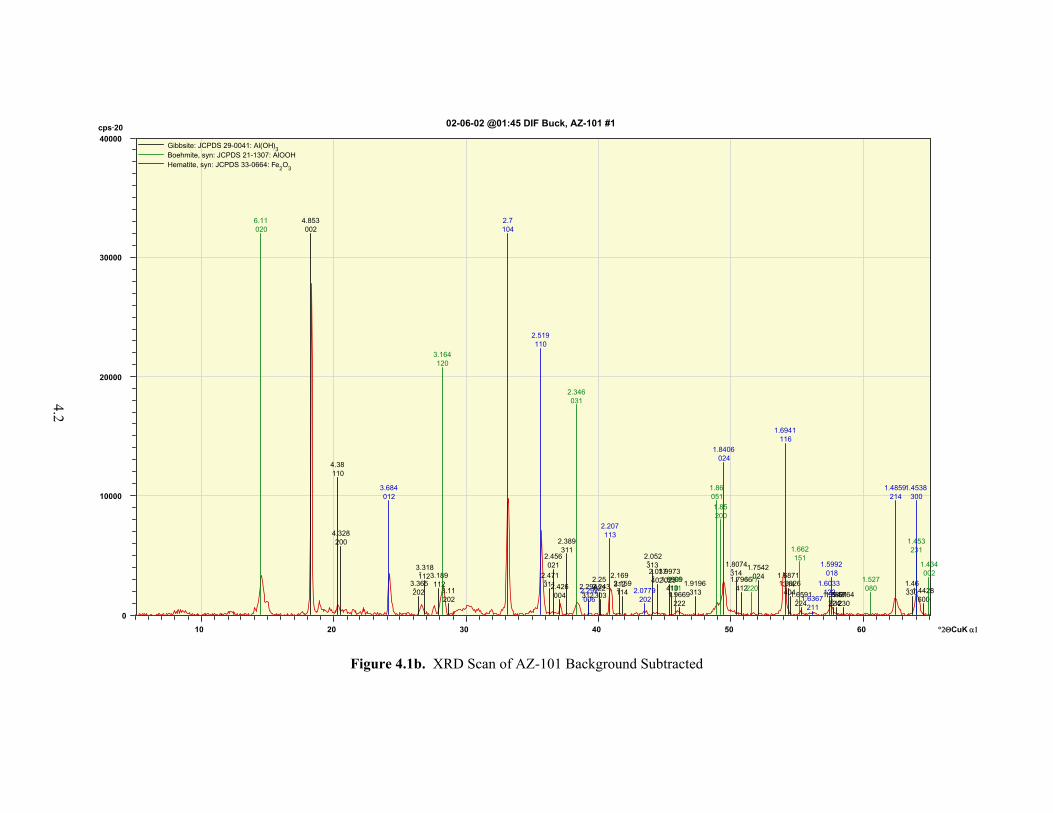
4.1 XRD Analysis of AZ-101 Washed Solids Sample The XRD scan of AZ-101 washed solids is shown in Figure 4.1a-b, and the major d-spacings are listed in Table 4.1. All major peaks in the spectra were identified, including gibbsite [Al(OH)3], boehmite (AlOOH), and hematite (FeOOH). A significant background hump can be seen in the scan. Although this was easily removed by background fitting, it indicated that a proportion of the material may be either partially crystalline or amorphous. All the boehmite peaks were broad, indicating a poorly crystallized form and/or small crystallite size, whereas both hematite and gibbsite exhibited sharp peaks. This difference in morphology makes reliable estimates of the relative amounts of each Al-bearing phase potentially erroneous. The material exhibited well-crystallized phases, although a large amorphous hump is apparent. Major phases identified as gibbsite (Al(OH)3), boehmite (AlOOH), and hematite (Fe2O3). The 110 and 200 reflections from gibbsite were missing in the XRD scans. This may indicate preferential orientation of the crystals in the c-direction on the sample XRD slide, which commonly occurs in phases with platy forms. Along with the broadened peaks from boehmite, this further complicates determining the relative levels of gibbsite and boehmite.
10 20 30 40 50 60
Inte
nsity
2 theta
gibbsite
boehmite
hematite boehmite
hematite
boehmite
Figure 4.1a. XRD Scan of AZ-101 with Major Phase Identifications Marked
°2ΘCuK α1
0
10000
20000
30000
40000cps·20
10 20 30 40 50 60
02-06-02 @01:45 DIF Buck, AZ-101 #1
Gibbsite: JCPDS 29-0041: Al(OH)3 Boehmite, syn: JCPDS 21-1307: AlOOH Hematite, syn: JCPDS 33-0664: Fe2O3
0024.853
1104.38
2004.328
-2023.365
-1123.318
1123.189
2023.11
-3112.471
0212.456
0042.426
3112.389
-3122.294022
2.25
-3032.243 312
2.169
-1142.159
-3132.052
-4022.037
0231.9973
4101.9909
2221.9669313
1.9196
-3141.8074
4121.7966024
1.7542
3141.6871
-4041.6826
-2241.6591
2241.5943
-5121.5891
2301.5764
-3301.46
6001.4428
0206.11
1203.164
0312.346
1311.98
0511.86
2001.85
2201.77
1511.662
0801.527
2311.453
0021.434
0123.684
1042.7
1102.519
0062.292
1132.207
2022.0779
0241.8406
1161.6941
2111.6367
1221.6033
0181.5992
2141.4859
3001.4538
Figure 4.1b. XRD Scan of AZ-101 Background Subtracted
4.2

4.3
Table 4.1. X-Ray Diffraction Data from AZ-101 Washed Runs 1 and 2
2-Theta d(nm) hkl BG Height I% Area(1) I% FWHM Possible Assignments
5.686 1.553 58 290 1.3 1046 0.9 0.061 NA 8.242 1.07185 167 306 1.4 2788 2.3 0.155 NA 8.295 1.06506 80 448 2.0 5143 4.2 0.195 NA 8.542 1.03431 129 319 1.4 3388 2.8 0.181 NA 8.825 1.00124 91 367 1.6 6613 5.4 0.306 NA 12.277 0.72035 49 235 1.0 1062 0.9 0.077 NA 14.041 0.63023 116 536 2.4 2226 1.8 0.071 NA 14.520 0.60955 020 63 2455 10.8 69543 57.0 0.482 boehmite (AlOOH)15.018 0.58942 82 844 3.7 20285 16.6 0.409 NA 18.323 0.48379 002 54 22660 100.0 121979 100.0 0.092 gibbsite 18.922 0.46861 39 855 3.8 3789 3.1 0.075 NA 22.207 0.39998 86 342 1.5 1566 1.3 0.078 NaOH 24.180 0.36777 012 96 2635 11.6 21550 17.7 0.139 hematite 25.625 0.34735 93 171 0.8 776 0.6 0.077 NA 26.604 0.33478 -112 146 629 2.8 4288 3.5 0.116 gibbsite 27.523 0.32381 112 132 632 2.8 7992 6.6 0.215 gibbsite 28.181 0.3164 120 132 2016 8.9 35749 29.3 0.301 boehmite 29.924 0.29835 371 401 1.8 2184 1.8 0.093 NaOH, nitratite 30.079 0.29685 323 547 2.4 2967 2.4 0.092 NA 30.300 0.29474 152 646 2.9 7864 6.4 0.207 NA 30.618 0.29175 83 458 2.0 4933 4.0 0.183 NaOH 31.940 0.27996 98 211 0.9 805 0.7 0.065 nitratite 32.687 0.27373 122 264 1.2 1778 1.5 0.114 NaOH 33.159 0.26995 66 7766 34.3 79632 65.3 0.174 hematite 34.597 0.25905 159 273 1.2 1567 1.3 0.098 NA 34.884 0.25698 109 389 1.7 2695 2.2 0.118 NA 35.223 0.25458 138 616 2.7 6924 5.7 0.191 NA 35.660 0.25157 110 300 5901 26.0 59453 48.7 0.171 hematite 36.437 0.24638 021 23 400 1.8 6888 5.6 0.293 gibbsite 36.698 0.24469 51 480 2.1 1759 1.4 0.062 NaOH 37.119 0.24201 51 1044 4.6 6804 5.6 0.111 gibbsite 38.380 0.23434 031 17 896 4.0 16753 13.7 0.318 boehmite 40.861 0.22067 113 63 1892 8.3 17907 14.7 0.161 hematite 43.221 0.20915 -313 54 161 0.7 652 0.5 0.069 gibbsite 43.464 0.20803 202 43 235 1.0 2090 1.7 0.151 hematite 44.183 0.20482 -402 51 215 0.9 1082 0.9 0.086 gibbsite 44.429 0.20374 62 148 0.7 984 0.8 0.113 NA 45.883 0.19762 131 52 289 1.3 1177 1.0 0.069 boehmite (AlOOH)46.202 0.19632 71 188 0.8 1235 1.0 0.112 NA 48.783 0.18652 26 692 3.1 35268 28.9 0.866 NA 48.980 0.18582 051 58 865 3.8 30954 25.4 0.608 boehmite 49.440 0.1842 024 255 2225 9.8 38379 31.5 0.293 hematite 50.178 0.18166 49 367 1.6 5654 4.6 0.262 NaOH 50.518 0.18052 -314 90 212 0.9 2438 2.0 0.196 gibbsite 51.688 0.1767 220 78 202 0.9 751 0.6 0.063 boehmite

4.4
Table 4.1. X-Ray Diffraction Data from AZ-101 Washed Runs 1 and 2
2-Theta d(nm) hkl BG Height I% Area(1) I% FWHM Possible Assignments
54.020 0.16961 116 29 3046 13.4 36095 29.6 0.201 hematite 55.279 0.16604 151 19 267 1.2 1134 0.9 0.072 boehmite 56.269 0.16335 67 213 0.9 1759 1.4 0.140 NaOH 57.500 0.16015 122 30 659 2.9 9247 7.6 0.239 hematite 62.382 0.14873 214 43 1400 6.2 16904 13.9 0.205 hematite 63.981 0.1454 300 51 1562 6.9 20305 16.6 0.221 hematite AZ-101-2 Run with internal corundum standard* 8.295 1.06506 24 112 0.4 530 0.2 0.080 NA 11.843 0.74664 108 399 1.3 4526 2.1 0.193 NA 11.960 0.73938 39 576 1.9 2711 1.2 0.080 NA 12.040 0.73445 81 548 1.8 7785 3.5 0.242 NA 12.203 0.72472 60 483 1.6 3578 1.6 0.126 NA 12.251 0.72185 85 343 1.1 3747 1.7 0.186 NA 13.988 0.63261 39 368 1.2 2099 1.0 0.097 NA 14.519 0.60956 020 66 1399 4.6 28224 12.8 0.343 boehmite 14.898 0.59414 96 589 2.0 7478 3.4 0.216 NaOH 15.131 0.58505 72 349 1.2 6382 2.9 0.311 NA 18.336 0.48346 002 97 3387 11.2 16807 7.6 0.084 gibbsite 22.197 0.40015 111 288 1.0 1062 0.5 0.063 NA 24.179 0.36779 012 71 1731 5.7 13319 6.1 0.131 hematite 25.619 0.34743 012 150 23008 76.3 158493 72.1 0.117 corundum 26.033 0.342 40 331 1.1 1496 0.7 0.077 NA 26.658 0.33412 -202 165 391 1.3 1755 0.8 0.076 gibbsite 27.543 0.32358 -112 226 279 0.9 942 0.4 0.057 gibbsite 28.199 0.3162 120 132 1094 3.6 17474 7.9 0.272 boehmite 29.485 0.30269 201 155 0.5 1573 0.7 0.173 NA 29.976 0.29784 216 350 1.2 1528 0.7 0.074 NA 30.157 0.2961 121 409 1.4 4108 1.9 0.171 NaOH 31.907 0.28025 116 156 0.5 1063 0.5 0.116 NA 32.680 0.27379 120 343 1.1 1635 0.7 0.081 NaOH 33.142 0.27008 104 93 4718 15.7 46576 21.2 0.168 hematite 35.198 0.25476 104 53 30146 100.0 219894 100.0 0.124 corundum 35.658 0.25158 63 3143 10.4 33216 15.1 0.180 hematite 37.819 0.23769 110 0 11290 37.5 78802 35.8 0.119 corundum 38.360 0.23446 031 68 369 1.2 3901 1.8 0.180 boehmite 39.816 0.22621 0 134 0.4 981 0.4 0.124 NA 40.859 0.22068 113 113 1059 3.5 6689 3.0 0.107 hematite 41.711 0.21636 006 22 336 1.1 1603 0.7 0.081 corundum 43.382 0.20841 113 39 26494 87.9 200831 91.3 0.129 corundum 43.754 0.20672 202 64 319 1.1 3480 1.6 0.185 hematite 45.639 0.19861 70 89 0.3 725 0.3 0.138 NaOH 45.703 0.19835 51 105 0.3 828 0.4 0.134 NA 45.984 0.1972 131 50 207 0.7 740 0.3 0.061 boehmite 46.239 0.19618 202 76 359 1.2 2037 0.9 0.096 corundum

4.5
Table 4.1. X-Ray Diffraction Data from AZ-101 Washed Runs 1 and 2
2-Theta d(nm) hkl BG Height I% Area(1) I% FWHM Possible Assignments
48.777 0.18654 051 41 393 1.3 4399 2.0 0.190 boehmite 48.958 0.1859 83 448 1.5 6748 3.1 0.256 NA 49.402 0.18433 024 110 1203 4.0 20202 9.2 0.285 hematite 49.795 0.18297 81 239 0.8 1770 0.8 0.126 NA 50.043 0.18212 81 186 0.6 660 0.3 0.060 NaOH 50.303 0.18124 39 232 0.8 1759 0.8 0.129 NA 52.579 0.17391 024 25 9960 33.0 79088 36.0 0.135 corundum 54.019 0.16961 45 1438 4.8 16195 7.4 0.191 hematite 57.520 0.1601 116 4 19641 65.2 166047 75.5 0.144 corundum 59.762 0.15461 211 41 417 1.4 2357 1.1 0.096 corundum 61.320 0.15105 122 42 1503 5.0 11702 5.3 0.132 corundum 62.345 0.14881 214 56 534 1.8 7639 3.5 0.243 hematite 63.978 0.1454 300 65 797 2.6 9623 4.4 0.205 hematite (1) computer output – no rounding was attempted BG = background. NA = not assigned I% = relative intensity. FWHM = full width half maximum. *Corundum (Al2O3) JCPDS 42-1468. Another sample was run with a small amount of corundum (Al2O3) as an internal standard. However, too much of the standard was added to the sample, and the Al2O3 peaks dominated the spectrum. These data are presented in the table. There was some concern that the over night drying may have crystallized the aluminum oxide phases. The internal Al2O3 standard was used to confirm that the peak positions were accurate in the other spectra.
4.2 Scanning Electron Microscopy of AZ-101 Washed Solids The sample was shown to be extremely complex under SEM, revealing many different phases that were not detected during the XRD scan. With optical microscopy the particles were mainly yellow and orange in color. The aggregate nature of the particles in AZ-101 made it difficult to determine the true composition of individual phases. Under SEM, individual particle aggregates were 5 to 10 µm in diameter. These larger particles were composed of many fine-grained phases (Figure 4.2 a and b). The characteristic blades (iron rose) of hematite can be seen in Figure 4.2 c and d. These exhibit bright contrast, suggesting a high average atomic number. In Figure 4.2a, EDS analyses were obtained from an area (EDS03) and a point (EDS04). The resulting spectra were almost identical, suggesting that the Zr-Fe phase composition represents a single phase and not an agglomeration of phases.
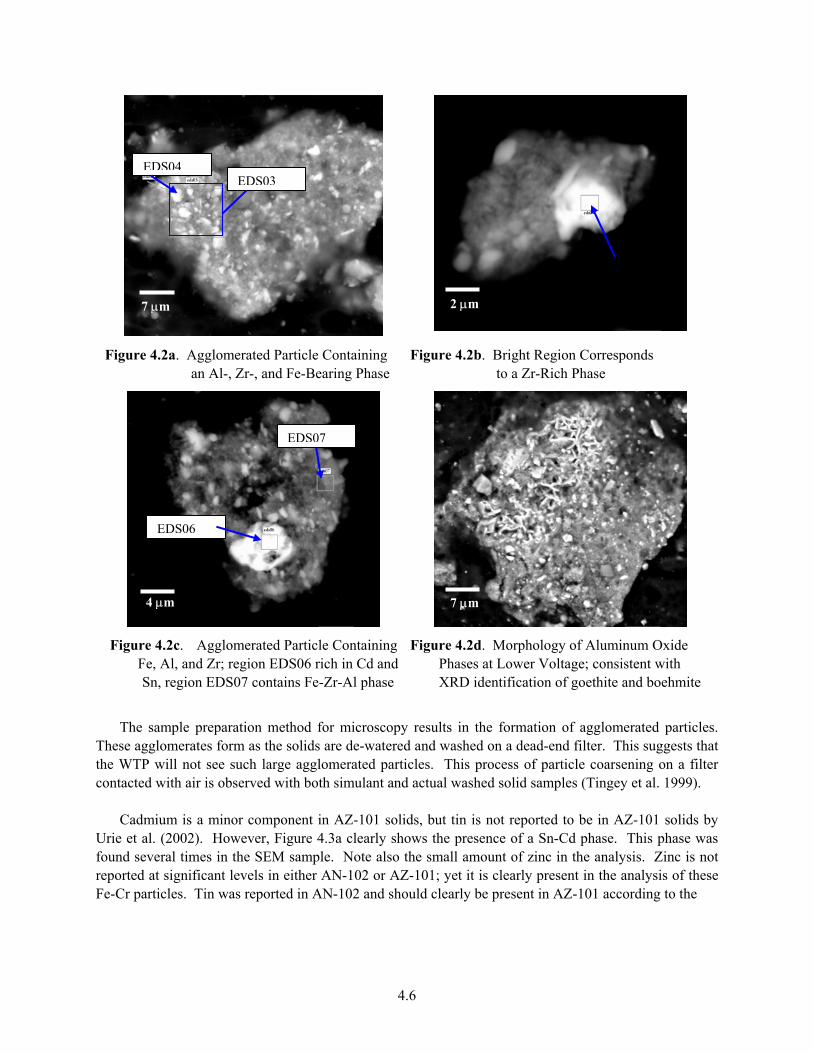
4.6
Figure 4.2a. Agglomerated Particle Containing an Al-, Zr-, and Fe-Bearing Phase
Figure 4.2b. Bright Region Corresponds to a Zr-Rich Phase
Figure 4.2c. Agglomerated Particle Containing
Fe, Al, and Zr; region EDS06 rich in Cd and Sn, region EDS07 contains Fe-Zr-Al phase
Figure 4.2d. Morphology of Aluminum Oxide Phases at Lower Voltage; consistent with XRD identification of goethite and boehmite
The sample preparation method for microscopy results in the formation of agglomerated particles. These agglomerates form as the solids are de-watered and washed on a dead-end filter. This suggests that the WTP will not see such large agglomerated particles. This process of particle coarsening on a filter contacted with air is observed with both simulant and actual washed solid samples (Tingey et al. 1999). Cadmium is a minor component in AZ-101 solids, but tin is not reported to be in AZ-101 solids by Urie et al. (2002). However, Figure 4.3a clearly shows the presence of a Sn-Cd phase. This phase was found several times in the SEM sample. Note also the small amount of zinc in the analysis. Zinc is not reported at significant levels in either AN-102 or AZ-101; yet it is clearly present in the analysis of these Fe-Cr particles. Tin was reported in AN-102 and should clearly be present in AZ-101 according to the
EDS04EDS03
4 µm 7 µm
7 µm 2 µm
EDS06
EDS07

4.7
0 5 10 15 20Energy (keV)
CuZr
ZrAl
CdSn
Fe
Ni
O
Zn
Figure 4.3a. X-Ray Energy Dispersive Analysis of Cadmium-Tin Particles
EDS analysis. The composition of another common phase found in AZ-101 is shown in Figure 4.3b. This phase contains Zr, Fe, and lesser amounts of Al, La, and Nd. Other rare earths may be present but cannot be resolved with SEM-EDS. Zirconium and iron are both major components in AZ-101, and La and Nd are minor components present at about 3x10³ and 1.3x10³ µg/g solids, respectively. Cerium may also be present but cannot be detected due to overlap problems, and its lower concentration in the washed solids (5x10² µg/g solid). A possible zirconium-iron phase might be the phosphate. One possible mineral would be mahlmodite [FeZr(PO4)•4(H2O)] which has major d-spacings at 0.316, 0.4382, and 0.958 nm.
0 5 10 15 20Energy (keV)
Fe
Zr
Zr
Al
Cd CaLa
FeNi
O
Figure 4.3b. X-Ray Energy Dispersive Analysis of Particle Showing the Presence of Al, Fe,
and Zr; the phase is compositionally similar to Zr-bearing phases reported by Lumetta et al. (1996)
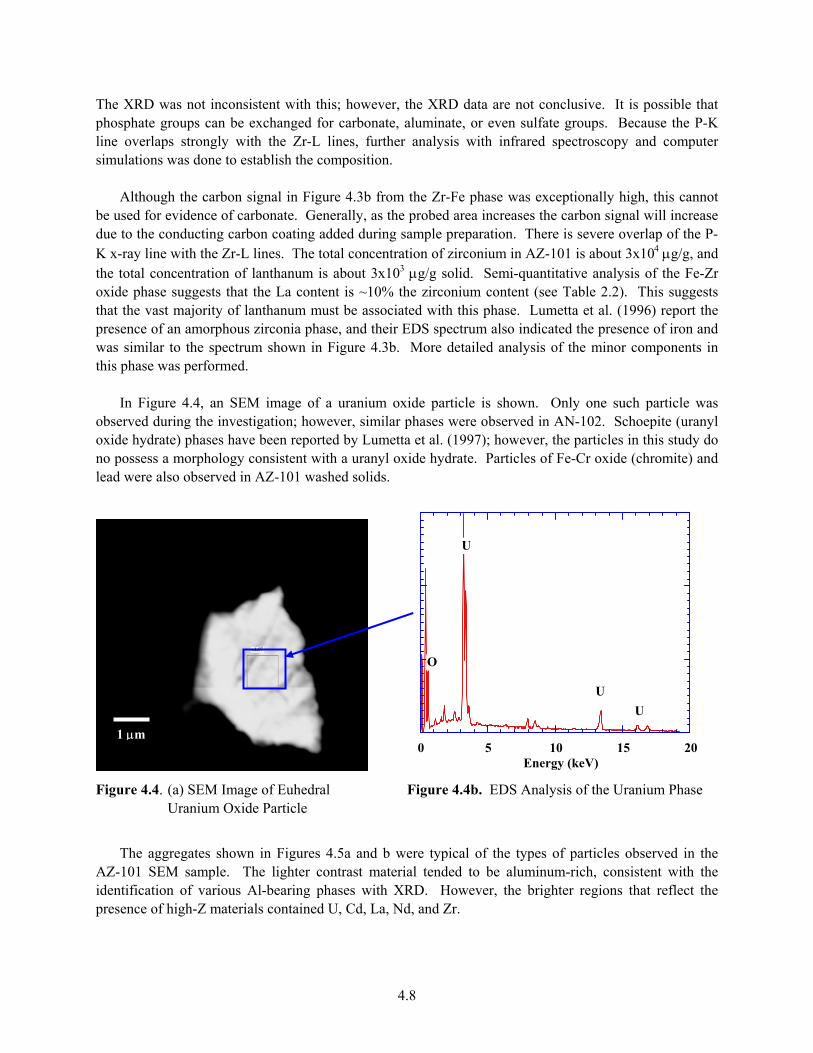
4.8
The XRD was not inconsistent with this; however, the XRD data are not conclusive. It is possible that phosphate groups can be exchanged for carbonate, aluminate, or even sulfate groups. Because the P-K line overlaps strongly with the Zr-L lines, further analysis with infrared spectroscopy and computer simulations was done to establish the composition. Although the carbon signal in Figure 4.3b from the Zr-Fe phase was exceptionally high, this cannot be used for evidence of carbonate. Generally, as the probed area increases the carbon signal will increase due to the conducting carbon coating added during sample preparation. There is severe overlap of the P-K x-ray line with the Zr-L lines. The total concentration of zirconium in AZ-101 is about 3x10⁴ µg/g, and the total concentration of lanthanum is about 3x10³ µg/g solid. Semi-quantitative analysis of the Fe-Zr oxide phase suggests that the La content is ~10% the zirconium content (see Table 2.2). This suggests that the vast majority of lanthanum must be associated with this phase. Lumetta et al. (1996) report the presence of an amorphous zirconia phase, and their EDS spectrum also indicated the presence of iron and was similar to the spectrum shown in Figure 4.3b. More detailed analysis of the minor components in this phase was performed. In Figure 4.4, an SEM image of a uranium oxide particle is shown. Only one such particle was observed during the investigation; however, similar phases were observed in AN-102. Schoepite (uranyl oxide hydrate) phases have been reported by Lumetta et al. (1997); however, the particles in this study do no possess a morphology consistent with a uranyl oxide hydrate. Particles of Fe-Cr oxide (chromite) and lead were also observed in AZ-101 washed solids.
0 5 10 15 20
Energy (keV)
U
UU
O
Figure 4.4. (a) SEM Image of Euhedral Figure 4.4b. EDS Analysis of the Uranium Phase Uranium Oxide Particle
The aggregates shown in Figures 4.5a and b were typical of the types of particles observed in the AZ-101 SEM sample. The lighter contrast material tended to be aluminum-rich, consistent with the identification of various Al-bearing phases with XRD. However, the brighter regions that reflect the presence of high-Z materials contained U, Cd, La, Nd, and Zr.
1 µm

4.9
Figure 4.5a. SEM of Particle Typical of Second
Sampling of AZ-101 Solids Prepared for Microscopic Characterization
Figure 4.5b. SEM Showing Heterogeneous Aggregate Consisting of Several Phases; regions labeled EDS05 and EDS06 were iron zirconium aluminate phase; probe of region EDS07 revealed particle was uranium oxide.
In Figure 4.6, an experimental EDS analysis of the minor elements in the Fe-Zr phase, possibly with several other minor phases, is shown along with a simulated spectrum (line) of 10 elements (Na, Al, Si, Zr, Ru, U, Ca, La, Mo, Cr, Fe, Ni, Cu, and Zn. There was reasonable agreement with the experimental and a computer simulation, although it was not possible to completely model the background of the experimental analysis. This analysis indicated that the ruthenium was present in the AZ-101 washed solids sample and that it was associated with the Zr-bearing phase.
0 2 4 6 8 10Energy (keV)
Cu
ZrAlCa
U
Fe
Ni
O
Zn
Fe
Mn
Na
Si
LaNdRu
Figure 4.6. Trace Elements in AZ-101 Washed Solids
EDS05
EDS06
EDS07
7 µm 5 µm

4.10
4.3 XRD Analysis of AZ-101 Unwashed Solids Sample Sample AZ-101 unwashed represents material that had not yet gone through the first stage of washing. The XRD scan and list of d-spacings are shown in Table 4.2 and Figure 4.7, respectively. The phases found in the SEM study were not consistent with the single XRD run. A liquid separation of the sample was run to isolate the denser phases of interest. However, only a small amount of material was isolated, so the run did not yield any new information.
Table 4.2. XRD Data from AZ-101 Unwashed Solids
2-Theta d(nm) BG Height I% Area I% FWHM Possible Assignments 11.707 0.75532 19 107 1.3 302 1.5 0.120 NA 14.500 0.61036 38 463 5.6 2869 14.3 0.263 boehmite 18.332 0.48356 24 8236 100.0 20005 100.0 0.103 gibbsite 20.317 0.43673 67 2274 27.6 4983 24.9 0.093 NA 28.172 0.31649 57 164 2.0 409 2.0 0.106 boehmite 29.410 0.30345 30 3021 36.7 8109 40.5 0.114 NaOH, nitratite 30.028 0.29735 47 766 9.3 1740 8.7 0.097 NaOH 31.441 0.2843 30 47 0.6 215 1.1 0.194 NA 31.893 0.28037 48 450 5.5 1194 6.0 0.113 nitratite 32.378 0.27628 48 193 2.3 741 3.7 0.163 NA 33.167 0.26988 67 594 7.2 2699 13.5 0.193 hematite 34.101 0.2627 56 125 1.5 291 1.5 0.099 NA 34.501 0.25975 57 2293 27.8 4683 23.4 0.087 NA 35.431 0.25314 54 451 5.5 1179 5.9 0.111 hematite 36.699 0.24468 11 127 1.5 306 1.5 0.102 NaOH 39.015 0.23067 0 375 4.6 921 4.6 0.104 nitratite 40.863 0.22066 0 62 0.8 172 0.9 0.118 hematite 44.506 0.2034 33 1071 13.0 3424 17.1 0.136 gibbsite 46.870 0.19368 28 336 4.1 707 3.5 0.089 NA 47.925 0.18966 20 478 5.8 1616 8.1 0.144 nitratite 48.359 0.18806 12 213 2.6 535 2.7 0.107 NaOH 53.558 0.17096 31 88 1.1 193 1.0 0.093 NA 54.121 0.16932 32 131 1.6 650 3.2 0.211 hematite 55.655 0.16501 34 150 1.8 440 2.2 0.125 boehmite 58.616 0.15736 16 114 1.4 209 1.0 0.078 NA 62.437 0.14862 20 129 1.6 363 1.8 0.120 hematite 63.940 0.14548 41 98 1.2 202 1.0 0.088 hematite
BG= background, NA = not assigned. I% = relative intensity. FWHM = full width half maximum.
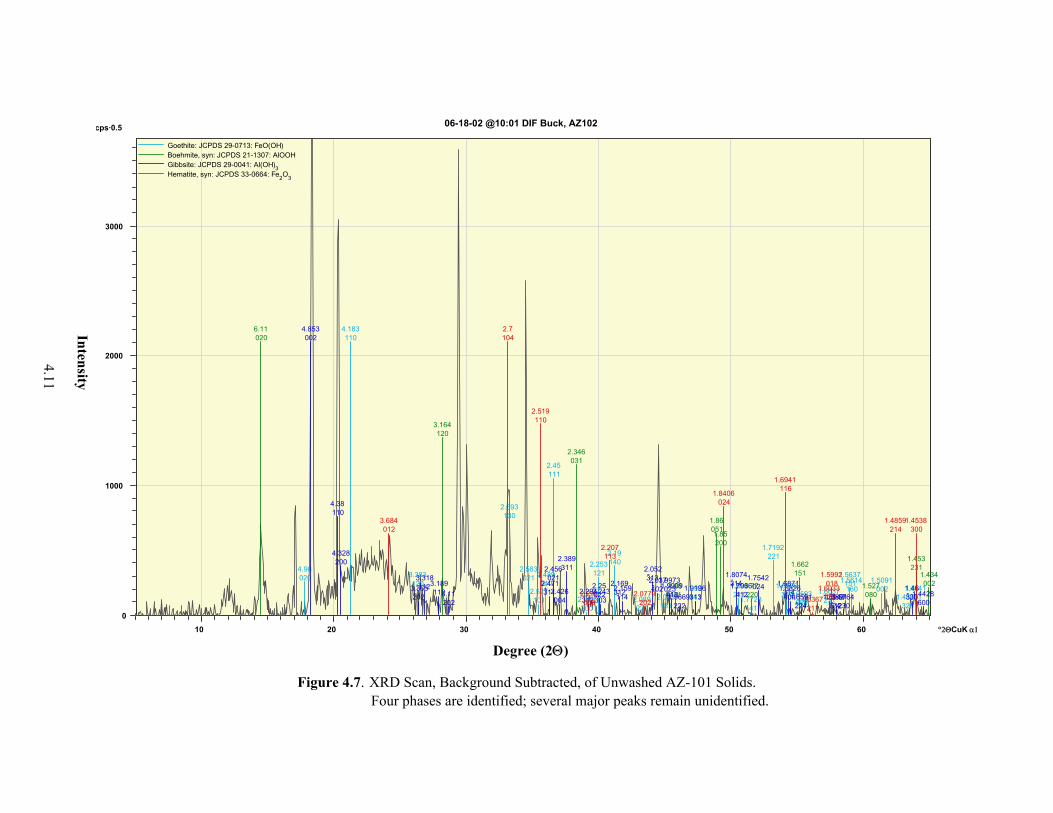
°2ΘCuK α1
0
1000
2000
3000
cps·0.5
10 20 30 40 50 60
06-18-02 @10:01 DIF Buck, AZ102
Goethite: JCPDS 29-0713: FeO(OH) Boehmite, syn: JCPDS 21-1307: AlOOH Gibbsite: JCPDS 29-0041: Al(OH)3 Hematite, syn: JCPDS 33-0664: Fe2O3
0204.98
1104.183
1203.383
1302.693
0212.583
1012.527
0402.489
1112.45
2002.303
1212.253 140
2.19
2202.089
1312.011 041
1.92211
1.802
1411.7728
2211.7192
2401.6906
0601.6593
2311.6037
1511.5637
1601.5614
0021.5091
3201.4675061
1.4541
0206.11
1203.164
0312.346
1311.98
0511.86
2001.85
2201.77
1511.662
0801.527
2311.453
0021.434
0024.853
1104.38
2004.328
-2023.365
-1123.318
1123.189
2023.11
-3112.471
0212.456
0042.426
3112.389
-3122.294022
2.25-303
2.243 3122.169
-1142.159
-3132.052
-4022.037
0231.9973
4101.9909
2221.9669313
1.9196-314
1.8074
4121.7966024
1.7542
3141.6871
-4041.6826
-2241.6591
2241.5943
-5121.5891
2301.5764 -330
1.46
6001.4428
0123.684
1042.7
1102.519
0062.292
1132.207
2022.0779
0241.8406
1161.6941
2111.6367122
1.6033018
1.5992
2141.4859
3001.4538
Figure 4.7. XRD Scan, Background Subtracted, of Unwashed AZ-101 Solids. Four phases are identified; several major peaks remain unidentified.
4.11
Degree (2Θ)
Intensity
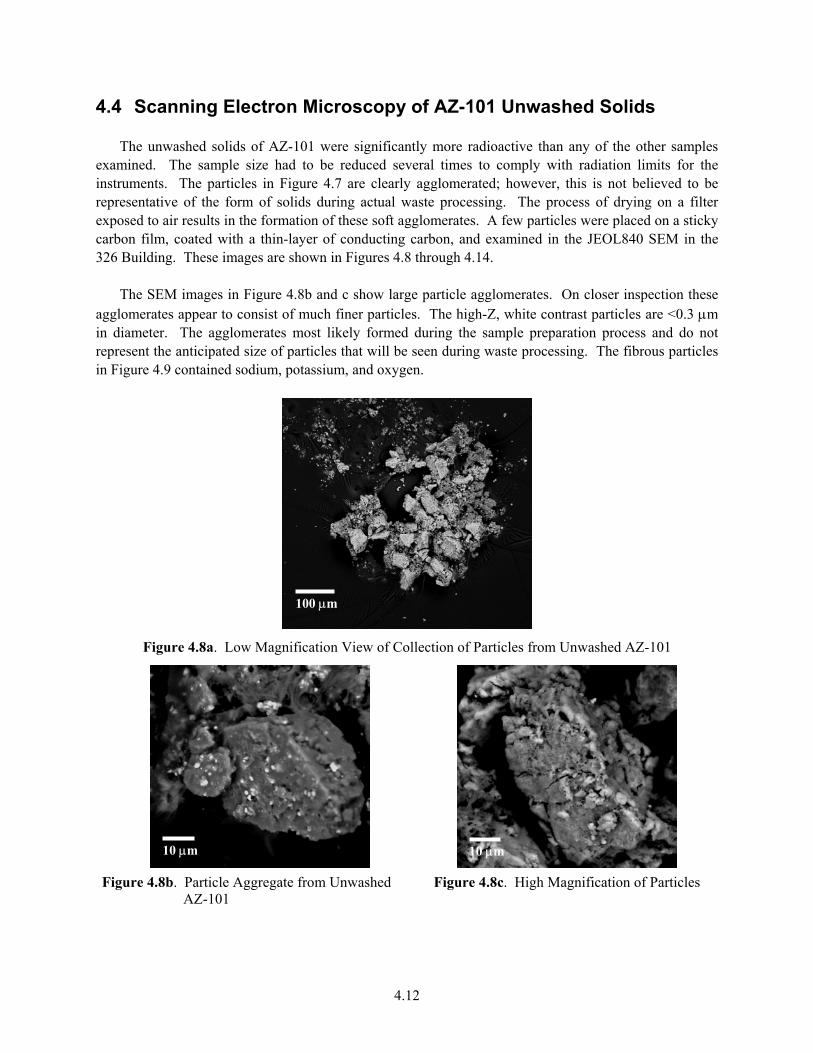
4.12
4.4 Scanning Electron Microscopy of AZ-101 Unwashed Solids The unwashed solids of AZ-101 were significantly more radioactive than any of the other samples examined. The sample size had to be reduced several times to comply with radiation limits for the instruments. The particles in Figure 4.7 are clearly agglomerated; however, this is not believed to be representative of the form of solids during actual waste processing. The process of drying on a filter exposed to air results in the formation of these soft agglomerates. A few particles were placed on a sticky carbon film, coated with a thin-layer of conducting carbon, and examined in the JEOL840 SEM in the 326 Building. These images are shown in Figures 4.8 through 4.14. The SEM images in Figure 4.8b and c show large particle agglomerates. On closer inspection these agglomerates appear to consist of much finer particles. The high-Z, white contrast particles are <0.3 µm in diameter. The agglomerates most likely formed during the sample preparation process and do not represent the anticipated size of particles that will be seen during waste processing. The fibrous particles in Figure 4.9 contained sodium, potassium, and oxygen.
Figure 4.8a. Low Magnification View of Collection of Particles from Unwashed AZ-101
Figure 4.8b. Particle Aggregate from Unwashed
AZ-101 Figure 4.8c. High Magnification of Particles
10 µm 10 µm
100 µm

4.13
Figure 4.9. SEM Image of Sodium-Bearing Fibrous Phase
Nickel, copper, manganese, and trace zinc were detected in Region 2 in Figure 4.10. The level of zinc is similar to that of copper in the spectrum; however, zinc is not reported as a significant component in AZ-101 solids (Urie et al. 2002). In Figure 4.10a, Region 1 was aluminum oxide (Ref: EDS02), Region 2 an iron aluminate (Ref:EDS03) (see Figure 4.10b), and Region 3 an aluminum oxide (Ref: EDS01).
0 2 4 6 8 10
Energy (keV)
O
Al
Na
C
Fe
Zr
Figure 4.10a. Series of AZ-101 Particles Figure 4.10b. EDS analysis of Region 2 Consisting of Aluminum
The phases shown in Figure 4.11 were composed of iron and oxygen. The particle morphology was characteristic of hematite (Fe2O3). Crystals of hematite are often arranged like petals of a rose (so-called iron-rose). These particles were also observed in the washed samples (Ref: EDS04).
4 µm
Region 1 Region 2 Region 3
10 µm

4.14
Figure 4.11. Blade-Like Phases of Hematite
The particles within these regions appeared to consist of particle agglomerates. For instance, in Figures 4.12 and 4.13a, the individual particles are submicron. The composition of the phase shown in Figure 4.12b was consistent with manganese clay minerals containing both K and Na (Chukhrov et al. 1980).
0 2 4 6 8 10
Energy (keV)
Mn
Mn
K
Si
NaO
C
Figure 4.12a. SEM of Manganese-Bearing Figure 4.12b. EDS Analysis of Phase Showing Phase in AZ-101 Presence of Potassium, Manganese,
and Oxygen
The Sr-L and Si-K peaks overlap strongly, the overall peak shape fits Si more precisely; in addition, the higher energy peak, Sr-K, was absent. The phase also contains La and Nd. Other rare earths may be present but overlap strongly in this region. This phase was also observed in the washed sample where it was observed more commonly than in the unwashed sample.
5 µm
7 µm
5 µm
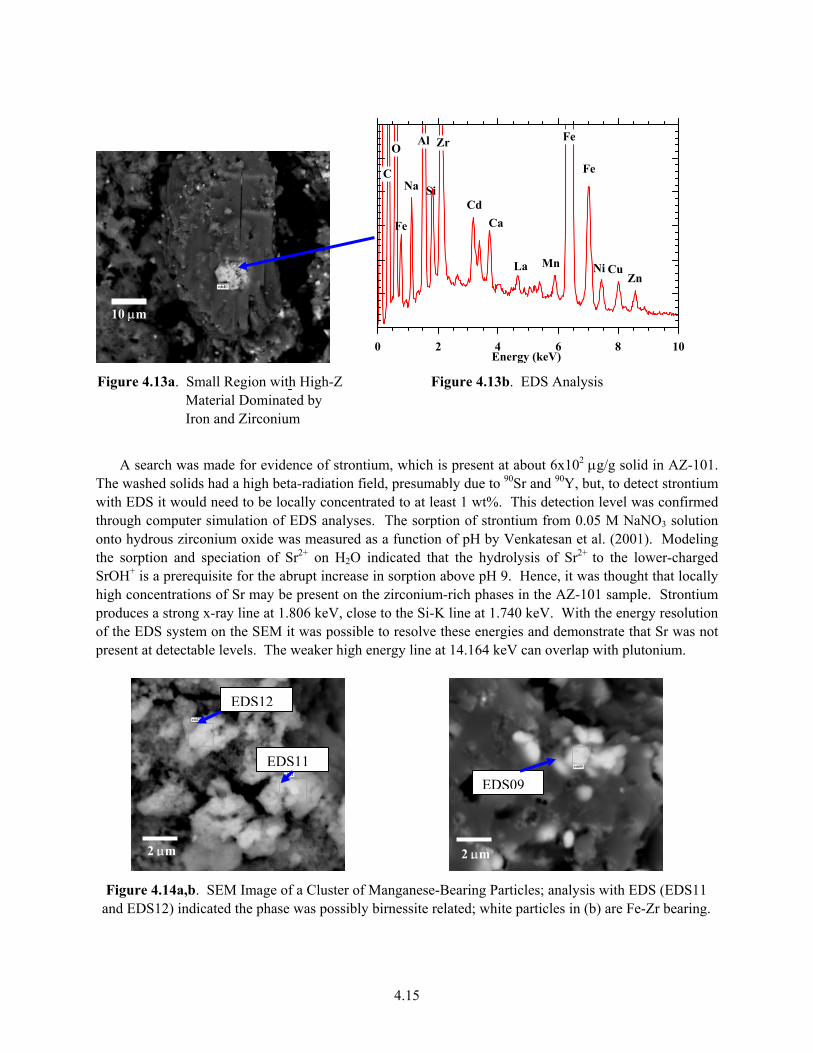
4.15
0 2 4 6 8 10
Energy (keV)
Al Zr
Cd
Fe
CuNiZn
Na
La
Ca
Mn
Fe
Si
O
C
Fe
Figure 4.13a. Small Region with High-Z Figure 4.13b. EDS Analysis
Material Dominated by Iron and Zirconium
A search was made for evidence of strontium, which is present at about 6x10² µg/g solid in AZ-101. The washed solids had a high beta-radiation field, presumably due to 90Sr and 90Y, but, to detect strontium with EDS it would need to be locally concentrated to at least 1 wt%. This detection level was confirmed through computer simulation of EDS analyses. The sorption of strontium from 0.05 M NaNO3 solution onto hydrous zirconium oxide was measured as a function of pH by Venkatesan et al. (2001). Modeling the sorption and speciation of Sr2+ on H2O indicated that the hydrolysis of Sr2+ to the lower-charged SrOH+ is a prerequisite for the abrupt increase in sorption above pH 9. Hence, it was thought that locally high concentrations of Sr may be present on the zirconium-rich phases in the AZ-101 sample. Strontium produces a strong x-ray line at 1.806 keV, close to the Si-K line at 1.740 keV. With the energy resolution of the EDS system on the SEM it was possible to resolve these energies and demonstrate that Sr was not present at detectable levels. The weaker high energy line at 14.164 keV can overlap with plutonium.
Figure 4.14a,b. SEM Image of a Cluster of Manganese-Bearing Particles; analysis with EDS (EDS11
and EDS12) indicated the phase was possibly birnessite related; white particles in (b) are Fe-Zr bearing.
10 µm
EDS12
EDS11EDS09
2 µm 2 µm

4.16
0 2 4 6 8 10Energy (keV)
K
Mn�
Na Mn
Al
O
C
Mn
Figure 4.14c. EDS Analysis of Phases in Figure 4.14a
Manganese phases were commonly observed in the unwashed solid sample. The phase was ag-glomerated with a fluffy texture; the individual particles were 0.3–0.5 µm in diameter. Compositionally, the phase matched a manganese clay mineral such as birnessite (see EDS12 in Figure 4.14c). These phases exhibited lighter contrast than the bulk material. The EDS analyses of these types of phases yielded a relatively pure single-phase composition. However, manganese is a minor component of AZ-101 solids (~1x10² µg/g solid), suggesting that there may have been problems obtaining representative samples in this case. Manganese was not detected in any other phases.
4.5 Infrared Spectroscopy of Washed AZ-101 A section of the infrared spectrum from the AZ-101 washed solids is shown in Figure 4.15. The absorption bands are in a region most consistent with nitrate, carbonate, sulfate, aluminate and/or phosphate. The largest absorption signatures are likely due to a phosphate species because large absorp-tion signatures for nitrates, carbonates, and sulfates typically appear at energies higher than 1100 cm-1. The absorption does not appear to be due to a pure salt or mixtures of pure salts.
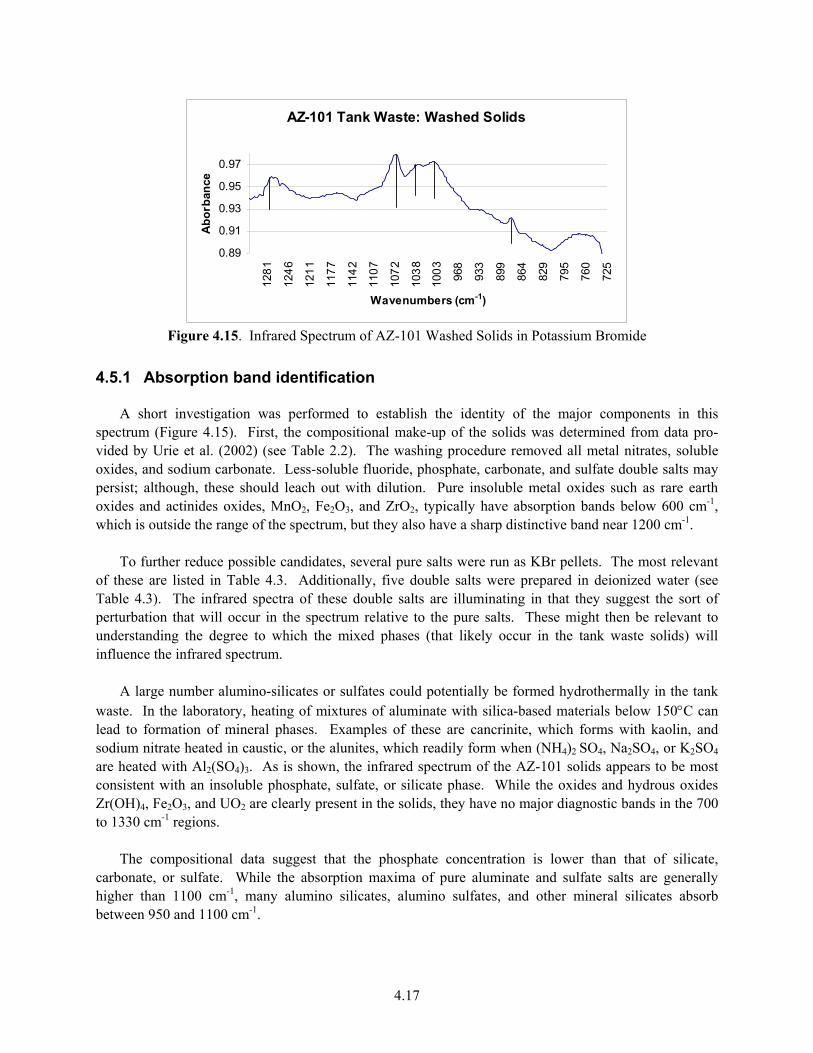
4.17
AZ-101 Tank Waste: Washed Solids
0.89
0.91
0.93
0.95
0.97
725
760
795
829
864
899
933
968
1003
1038
1072
1107
1142
1177
1211
1246
1281
Wavenumbers (cm-1)
Abo
rban
ce
Figure 4.15. Infrared Spectrum of AZ-101 Washed Solids in Potassium Bromide
4.5.1 Absorption band identification A short investigation was performed to establish the identity of the major components in this spectrum (Figure 4.15). First, the compositional make-up of the solids was determined from data pro-vided by Urie et al. (2002) (see Table 2.2). The washing procedure removed all metal nitrates, soluble oxides, and sodium carbonate. Less-soluble fluoride, phosphate, carbonate, and sulfate double salts may persist; although, these should leach out with dilution. Pure insoluble metal oxides such as rare earth oxides and actinides oxides, MnO2, Fe2O3, and ZrO2, typically have absorption bands below 600 cm-1, which is outside the range of the spectrum, but they also have a sharp distinctive band near 1200 cm-1. To further reduce possible candidates, several pure salts were run as KBr pellets. The most relevant of these are listed in Table 4.3. Additionally, five double salts were prepared in deionized water (see Table 4.3). The infrared spectra of these double salts are illuminating in that they suggest the sort of perturbation that will occur in the spectrum relative to the pure salts. These might then be relevant to understanding the degree to which the mixed phases (that likely occur in the tank waste solids) will influence the infrared spectrum. A large number alumino-silicates or sulfates could potentially be formed hydrothermally in the tank waste. In the laboratory, heating of mixtures of aluminate with silica-based materials below 150°C can lead to formation of mineral phases. Examples of these are cancrinite, which forms with kaolin, and sodium nitrate heated in caustic, or the alunites, which readily form when (NH4)2 SO4, Na2SO4, or K2SO4 are heated with Al2(SO4)3. As is shown, the infrared spectrum of the AZ-101 solids appears to be most consistent with an insoluble phosphate, sulfate, or silicate phase. While the oxides and hydrous oxides Zr(OH)4, Fe2O3, and UO2 are clearly present in the solids, they have no major diagnostic bands in the 700 to 1330 cm-1 regions. The compositional data suggest that the phosphate concentration is lower than that of silicate, carbonate, or sulfate. While the absorption maxima of pure aluminate and sulfate salts are generally higher than 1100 cm-1, many alumino silicates, alumino sulfates, and other mineral silicates absorb between 950 and 1100 cm-1.
4.18
4.5.2 Anion symmetry and coordination modes The positions of the oxides, fluorides, nitrates, carbonates, or phosphates are seen not to dramatically shift with metal. The metal coordination often results in a reduction in the anion symmetry and causes degenerate vibrations to become non-degenerate. This means that vibrations having the same energy are decoupled to produce multiple molecular vibrations, some of which are infrared active. For NaNO3, the spectrum is a single broad band, which indicates monodentate coordination of trigonal planar nitrate. In the spectrum of lanthanum nitrate, for instance, two bands appear, separated by 150 cm-1. This separation indicates bidentate coordination of the nitrate. Similar effects occur for trigonal planar carbonate and tetrahedral sulfate. The double salts show similar behavior, but the splitting is not large enough to be consistent with bidentate coordination. The sodium double-salt spectrum in Figure 4.16a shows the splitting in the nitrate and sulfate signatures. This indicates alternate coordination to one sodium or to bridged metals in these salts. The important observation with regard to the spectrum of AZ-101 is that none of the major bands for aluminate, oxalate, carbonate, sulfate, or nitrate pure salts or double salts match the observed spectrum. The spectrum of trisodium phosphate, calcium phosphate, and the Na7F(PO4)2.19H2O double salt are in the appropriate region, but the band positions in these salts do not match the prominent bands in the tank waste spectrum. A much closer match is seen in the spectrum of the zirconium phosphate. This spectrum is superimposed on the AZ-101 washed sample spectrum in Figure 4.17. There are three similar absorbance bands between these two spectra. The near match in position of these bands suggests that this is a major phase in the sample, in agreement with the SEM study. But there is apparently more than this simple phosphate phase. The SEM investigation found no evidence of a pure zirconium phosphate phase in washed AZ-101. Further evidence is provided by the sharp bands centered around 850 cm-1. The tank waste spectrum has a similar band at 883 cm-1. A sharp absorption band is seen for nitrate (837 cm-1), carbonate (883 cm-1), and aluminate (860 cm-1) species. This band shifts only 10–20 cm-1 for substitution by other metals common to the AZ-101 composition, i.e., Al, Na, Zr, Ca, and La. The effect on the band due to the Na3NO3SO4 double-salt coordination is again seen in Figure 4.16 to be about 3 cm-1. The nitrate salts, including zirconium nitrate, are soluble. This leaves an insoluble carbonate or aluminate species. The exact match with sodium carbonate at this band position may be fortuitous, however, an insoluble zirconium carbonate species is a reasonable candidate because the zirconium concentration in the solids is dominant. The aluminum concentration is also high, so an insoluble aluminate should not be ruled out. Unfortunately, the major bands (near 1400 cm-1) in the spectra of zirconium or other metal carbonates or aluminates are outside our observation window. Again, the SEM evidence suggested that Al is present in the zirconium phase and there may also be evidence for carbon. A last band near 1240 cm-1 is similar to ZrF4 which can be seen as an impurity in the Zr3(PO4)4 spectrum. The infrared spectrum of the AZ-101 washed solids is consistent with a mixed phase containing at least zirconium phosphate. The phase likely contains other insoluble phosphates such as Ca or La, which give the band structure its complexity. Both La and Ca were identified in association with the Zr-bearing phase in the washed AZ-101 sample with SEM-EDS. ZrF4 may be present in the sample, consistent with a relatively high fluoride concentration in AZ-101 but not with XRD or SEM data. The presence of carbonate or aluminate species is also suggested by the infrared data and backed up by SEM-EDS data.

4.19
Table 4.3. Potential Compounds and Their Infrared Bands
Sodium oxalate [Na2C2O4] 1321, 781, 775(w) Potassium oxalate [K2C2O4] 1315, 780, 721 Sodium nitrate [NaNO3] 1364, 836 Sodium nitrite [NaNO2] 1326, 1264, 827 Na3NO3SO4 1371, 837 Nitrated zeolite-A (ideally Na12Al12Si12O48•27H2O) 1268, 1000,732, 708, 664 Sodium aluminate [NaAlO4] 1453, 867 Strontium aluminate [Sr(AlO4)2] 1452, 1091, 859, 706, 698 Lanthanum carbonate [La2(CO3)3] 1434, 870, 847 Sodium carbonate [Na2CO3] 1440, 879, 702, 694 Manganese carbonate (MnCO3) 1430,1074, 863, 726 Na6(SO4)2CO3 1452, 1110, 990, 876, 636 Sodium phosphate [Na3(PO4)3] 1266, 1122, 1066, 992, 867,
820, 617 Calcium phosphate [Ca3(PO4)2] 1091, 1032, 600 Aluminum phosphate (AlPO4) 1120 Lanthanum phosphate [La(PO4)] 1053, 1009, 617 Zirconium phosphate [Zr3(PO4)4] 860, 774 NaF(PO4)2.19H2O 1008, 987, 744, 698 Sodium sulfate (Na2SO4) 1123, 635, 613 Aluminum sulfate [Al2(SO4)3] 1103, 927, 705 Gypsum (CaSO4) 1150, 670, 600 Na3FSO4 1144, 629 Ferrous sulfate (FeSO4) 1102, 988, 612 Ferric sulfate [Fe2(SO4)3] 1198, 1098, 1083, 640 Zirconium hydroxide [Zr(OH)4] 1338, 1098, 1050, 851, 781

4.20
0
0.2
0.4
0.6
0.8
1
1.2
4006008001000120014001600
Na2CO3NaNO3Sr Aluminate
Abs
orba
nce
Wavenumber (cm-1) Figure 4.16a. Infrared Spectra of Na2CO3, NaNO3, and Aluminate
0
0.2
0.4
0.6
0.8
1
1.2
4006008001000120014001600
NaNO3Na2SO4Na2SO4NO3
Abs
orba
nce
Wavenumber (cm-1)
Figure 4.16b. The Double Salt Na3NO3SO4
NaNO3 Na2SO4

4.21
Wavenumbers (cm-1)
8009001000110012001300-0.2
0.0
0.2
0.4
0.6
0.8
1.0
1.2
AZ-101
Zr3(PO4)4
Na2CO3
Figure 4.17. Spectra of AZ-101 and Candidate Inorganic Salts
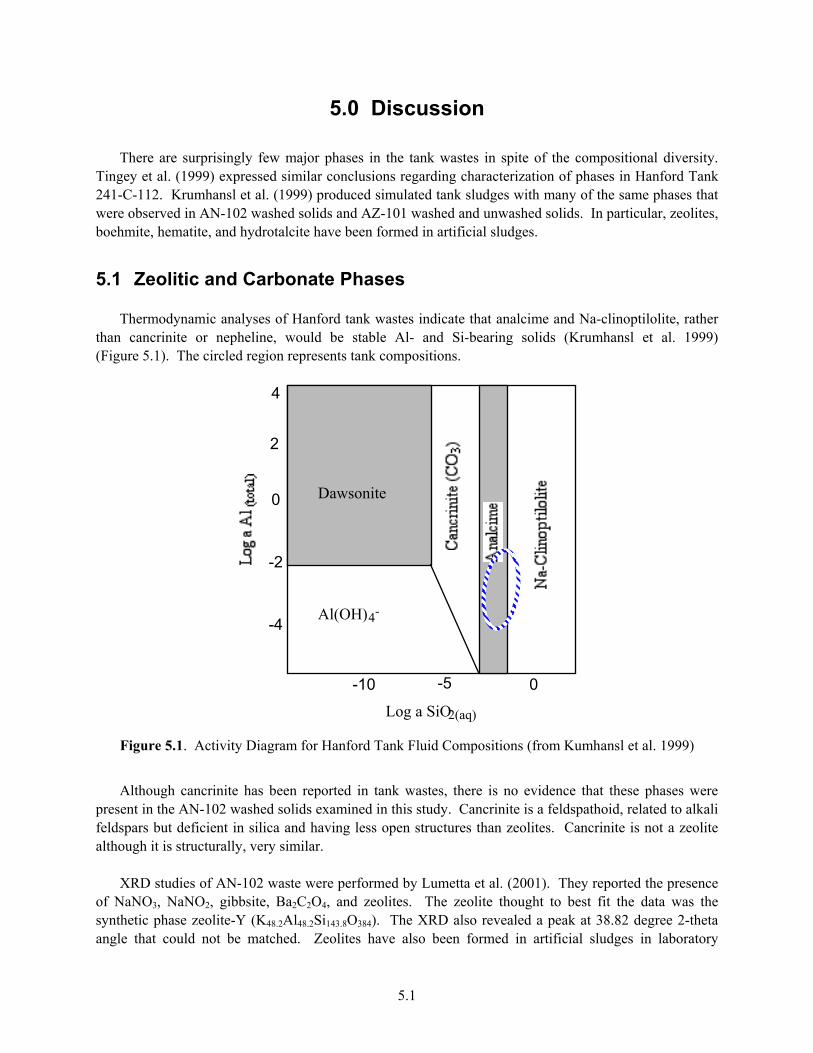
5.1
5.0 Discussion There are surprisingly few major phases in the tank wastes in spite of the compositional diversity. Tingey et al. (1999) expressed similar conclusions regarding characterization of phases in Hanford Tank 241-C-112. Krumhansl et al. (1999) produced simulated tank sludges with many of the same phases that were observed in AN-102 washed solids and AZ-101 washed and unwashed solids. In particular, zeolites, boehmite, hematite, and hydrotalcite have been formed in artificial sludges.
5.1 Zeolitic and Carbonate Phases Thermodynamic analyses of Hanford tank wastes indicate that analcime and Na-clinoptilolite, rather than cancrinite or nepheline, would be stable Al- and Si-bearing solids (Krumhansl et al. 1999) (Figure 5.1). The circled region represents tank compositions.
Log a SiO2(aq)
Dawsonite
Al(OH)4-
4
2
-2
-4
0
-10 -5 0
Figure 5.1. Activity Diagram for Hanford Tank Fluid Compositions (from Kumhansl et al. 1999)
Although cancrinite has been reported in tank wastes, there is no evidence that these phases were present in the AN-102 washed solids examined in this study. Cancrinite is a feldspathoid, related to alkali feldspars but deficient in silica and having less open structures than zeolites. Cancrinite is not a zeolite although it is structurally, very similar. XRD studies of AN-102 waste were performed by Lumetta et al. (2001). They reported the presence of NaNO3, NaNO2, gibbsite, Ba2C2O4, and zeolites. The zeolite thought to best fit the data was the synthetic phase zeolite-Y (K48.2Al48.2Si143.8O384). The XRD also revealed a peak at 38.82 degree 2-theta angle that could not be matched. Zeolites have also been formed in artificial sludges in laboratory

5.2
experiments by Krumhansl et al. (1999). Jantzen et al. (2002) reported that reactive oxides, soluble silicates, and soluble aluminates can form sodium alumino-silicate (NAS) hydrogel that converts to zeolite-A (ideally Na12Al12Si12O48•27H2O) under hydrothermal conditions at elevated temperatures, and eventually to sodalite (cubic), and finally to cancrinite (hexagonal). The zeolite was nitrated (i.e., some H2O groups are replaced with NO3
- in the structure). In nature, both nepheline and cancrinite are found in igneous rocks and generally require high temperatures and pressures to form, although Mattigod et al. (2002) have produced cancrinite in the laboratory by hydrothermal synthesis at 80°C. Conditions present in the Hanford tanks should tend to favor the formation of zeolites because these precipitate readily under low-temperature hydrothermal and/or high-pH conditions, for example, during borosilicate glass dissolution at high pH (Abdelouas et al. 1997). The morphology of the alumino silicate phases and the limited XRD data support the identification of zeolites in the sample. The zeolites present may not be found in the powder diffraction database (diffraction spacings are less accurate at the high d-spacings); however, the closest match appears to be laumontite or heulandite. In AN-102, most of the sample consisted of a matt of aluminum and sodium. The SEM samples are coated with carbon to make them conductive, and the intensity of the carbon signal in the x-ray spectrum increases as the area probed increases. Because inorganic carbon is known to be a major component in the washed solids, carbonate phases should be present. One possible sodium alumino-carbonate phase is dawsonite [ideally NaAlCO3(OH)2]. Dawsonite has been predicted by Krumhansl et al. (1999) to form under high Al and low SiO2(aq) activities (see Figure 5.1). Comparison with the XRD data (see Table 3.1) revealed peaks at 0.592, 0.278, 0.260, and 0.200 nm that agree reasonably with the major reflections from dawsonite. There are no other major phases with this composition in the JCPDS database. The morphology of dawsonite is typically acicular or fibrous spheres, and rosettes; however, the phase can occur as random aggregates, as may be the case here.
5.2 Aluminum Oxide Phases Aluminum species constitute a predominant proportion of the washed solid tank wastes. The complex chemistry of aluminum in alkaline HLW has recently been investigated in simulants by Johnston et al. (2002). They used infrared and Raman spectroscopy to study the immediate coordination sphere of aqueous Na+, OH-, and Al(OH)4- species as well as bound water contained in the hydrated solid phases (e.g., sodium aluminate). This study was useful for analyzing the infrared data on AZ-101 washed solids in this study. Sodium aluminate (Na2Al2O3(OH)2•1.5H2O) is known experimentally to be a major phase in alkaline HLW (Johnston et al. 2002). Current understanding of the ternary system for Al2O3-Na2O-H2O indicates that gibbsite may preclude the formation of sodium aluminate. Indeed, Johnston et al. (2002) claim that gibbsite, although initially predicted by some models, is not observed in Hanford tank wastes. However, we see clear evidence, at least in AZ-101, for the presence of both boehmite and gibbsite. Gibbsite was also observed by Tingey et al. (1999) in Hanford tank 241-C-112. In this study, gibbsite was not found in AN-102 washed solids, but a sodium aluminate was observed with SEM-EDS. Boehmite (AlOOH) has been identified in TEM studies of some Hanford tank waste by Krumhansl et al. (1999). The phase was identified by its hexagonal platelet-like morphology. Boehmite is sometimes observed to be fibrous or acicular, so such observations are not necessarily diagnostic. However, boehmite will precipitate as rhombohedral plates changing over to more hexagonal-like plates in the presence of nitrate (Music et al. 1998). The morphology of gibbsite crystals evolves from thin, rounded
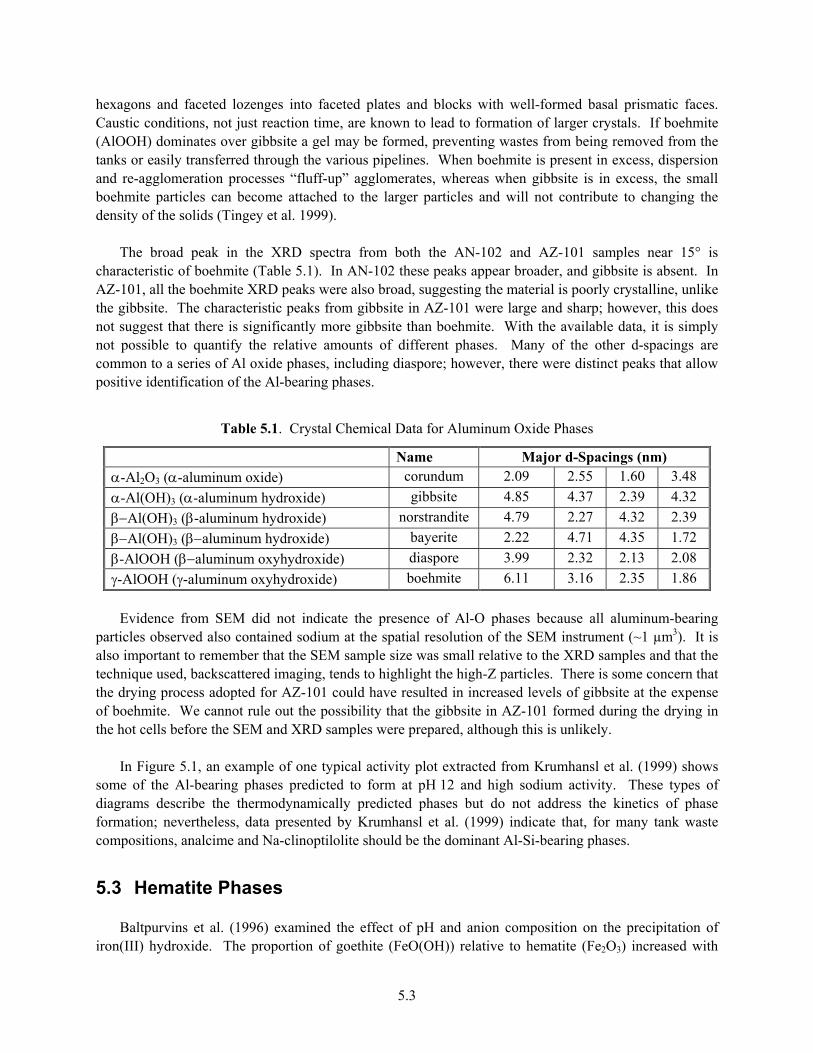
5.3
hexagons and faceted lozenges into faceted plates and blocks with well-formed basal prismatic faces. Caustic conditions, not just reaction time, are known to lead to formation of larger crystals. If boehmite (AlOOH) dominates over gibbsite a gel may be formed, preventing wastes from being removed from the tanks or easily transferred through the various pipelines. When boehmite is present in excess, dispersion and re-agglomeration processes “fluff-up” agglomerates, whereas when gibbsite is in excess, the small boehmite particles can become attached to the larger particles and will not contribute to changing the density of the solids (Tingey et al. 1999). The broad peak in the XRD spectra from both the AN-102 and AZ-101 samples near 15° is characteristic of boehmite (Table 5.1). In AN-102 these peaks appear broader, and gibbsite is absent. In AZ-101, all the boehmite XRD peaks were also broad, suggesting the material is poorly crystalline, unlike the gibbsite. The characteristic peaks from gibbsite in AZ-101 were large and sharp; however, this does not suggest that there is significantly more gibbsite than boehmite. With the available data, it is simply not possible to quantify the relative amounts of different phases. Many of the other d-spacings are common to a series of Al oxide phases, including diaspore; however, there were distinct peaks that allow positive identification of the Al-bearing phases.
Table 5.1. Crystal Chemical Data for Aluminum Oxide Phases
Name Major d-Spacings (nm) α-Al2O3 (α-aluminum oxide) corundum 2.09 2.55 1.60 3.48 α-Al(OH)3 (α-aluminum hydroxide) gibbsite 4.85 4.37 2.39 4.32 β−Al(OH)3 (β-aluminum hydroxide) norstrandite 4.79 2.27 4.32 2.39 β−Al(OH)3 (β−aluminum hydroxide) bayerite 2.22 4.71 4.35 1.72 β-AlOOH (β−aluminum oxyhydroxide) diaspore 3.99 2.32 2.13 2.08 γ-AlOOH (γ-aluminum oxyhydroxide) boehmite 6.11 3.16 2.35 1.86
Evidence from SEM did not indicate the presence of Al-O phases because all aluminum-bearing particles observed also contained sodium at the spatial resolution of the SEM instrument (~1 µm3). It is also important to remember that the SEM sample size was small relative to the XRD samples and that the technique used, backscattered imaging, tends to highlight the high-Z particles. There is some concern that the drying process adopted for AZ-101 could have resulted in increased levels of gibbsite at the expense of boehmite. We cannot rule out the possibility that the gibbsite in AZ-101 formed during the drying in the hot cells before the SEM and XRD samples were prepared, although this is unlikely. In Figure 5.1, an example of one typical activity plot extracted from Krumhansl et al. (1999) shows some of the Al-bearing phases predicted to form at pH 12 and high sodium activity. These types of diagrams describe the thermodynamically predicted phases but do not address the kinetics of phase formation; nevertheless, data presented by Krumhansl et al. (1999) indicate that, for many tank waste compositions, analcime and Na-clinoptilolite should be the dominant Al-Si-bearing phases.
5.3 Hematite Phases Baltpurvins et al. (1996) examined the effect of pH and anion composition on the precipitation of iron(III) hydroxide. The proportion of goethite (FeO(OH)) relative to hematite (Fe2O3) increased with
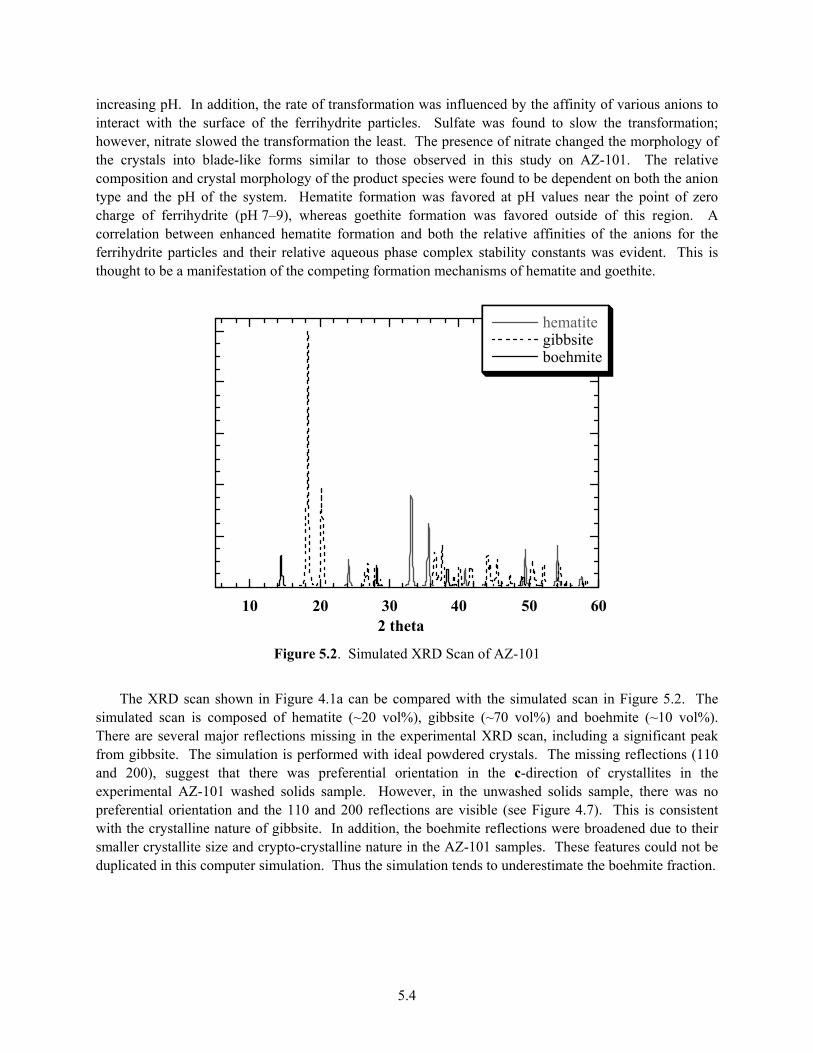
5.4
increasing pH. In addition, the rate of transformation was influenced by the affinity of various anions to interact with the surface of the ferrihydrite particles. Sulfate was found to slow the transformation; however, nitrate slowed the transformation the least. The presence of nitrate changed the morphology of the crystals into blade-like forms similar to those observed in this study on AZ-101. The relative composition and crystal morphology of the product species were found to be dependent on both the anion type and the pH of the system. Hematite formation was favored at pH values near the point of zero charge of ferrihydrite (pH 7–9), whereas goethite formation was favored outside of this region. A correlation between enhanced hematite formation and both the relative affinities of the anions for the ferrihydrite particles and their relative aqueous phase complex stability constants was evident. This is thought to be a manifestation of the competing formation mechanisms of hematite and goethite.
10 20 30 40 50 60
hematitegibbsiteboehmite
2 theta Figure 5.2. Simulated XRD Scan of AZ-101
The XRD scan shown in Figure 4.1a can be compared with the simulated scan in Figure 5.2. The simulated scan is composed of hematite (~20 vol%), gibbsite (~70 vol%) and boehmite (~10 vol%). There are several major reflections missing in the experimental XRD scan, including a significant peak from gibbsite. The simulation is performed with ideal powdered crystals. The missing reflections (110 and 200), suggest that there was preferential orientation in the c-direction of crystallites in the experimental AZ-101 washed solids sample. However, in the unwashed solids sample, there was no preferential orientation and the 110 and 200 reflections are visible (see Figure 4.7). This is consistent with the crystalline nature of gibbsite. In addition, the boehmite reflections were broadened due to their smaller crystallite size and crypto-crystalline nature in the AZ-101 samples. These features could not be duplicated in this computer simulation. Thus the simulation tends to underestimate the boehmite fraction.

5.5
5.4 Zirconium Phases in AZ-101 The zirconium-iron-bearing phase was observed only in the AZ-101 washed solids. The composition and structure of this phase remains unclear. Using different-sized probes the same composition was obtained, suggesting that this is a single phase. Lumetta et al. (1996) reports that tank wastes contain nano-sized particles of amorphous ZrO2 and FeOOH. However, the technique used by Lumetta et al. (1996), TEM with a Be-window EDS system, would not have been able to establish whether these phases contained carbon or oxygen, for instance. Indeed, analysis of the data in this report suggests the composi-tion is actually closer to a mixed Zr-Fe phase, similar to that observed in this study. Unfortunately, the EDS analyses by Lumetta et al. (1996) were not run long enough to allow minor elements to be detected. Based on the results of this study, it is highly unlikely that such pure phase oxides exist in the tank wastes. The true nature of these particles can only be determined with TEM equipped with light element-capable EDS and an electron energy-loss spectroscopy system. The overlap of the Zr-L (2.042 keV) and the P-K (2.015 keV) lines in the EDS analysis can be severe. The presence of Zr can only be confirmed by the observation of the Zr-K line; however, phosphorus could still be present in the analyzed region. The magnitude of the overlap problem can be modeled (Figure 5.3). In Table 5.2, a composition is shown that produces a spectrum similar to an actual spectrum collected from sample AZ-101. Because the K-line x-ray efficiency is so much greater than other lines, even a small amount of Al, Si, or P yield a large peak in the x-ray spectrum. The Zr-K peak is more prominent in the experimental spectrum because of the nature of the sample. This is because the weaker x-rays detection efficiency was slightly reduced. In addition, the bremmstrahlung is curtailed on the lower energy side more so on the experimental spectrum than in the simulated spectrum. These effects could be due to the surface roughness in the actual AZ-101 sample changes the characteristic x-ray collection efficiencies at the EDS detector. This simulation suggests that phosphorus may not be present in the sample at significant levels. As the cross-section for the Al-K, Si-K, or P-K lines are so high, even a small amount of these in the phase would have resulted in a large peak.
0 4 8 12 16
Inte
nsity
Energy (keV)
Fe
Zr
Al
CaCd
MnZrCu
0 4 8 12 16
Energy (keV)
Al
Zr
Ca
Fe
ZrCuMnCd
Figure 5.3a. Simulated EDS Spectrum of a Figure 5.3b. Experimentally Obtained
Particle in AZ-101 Spectrum from AZ-101
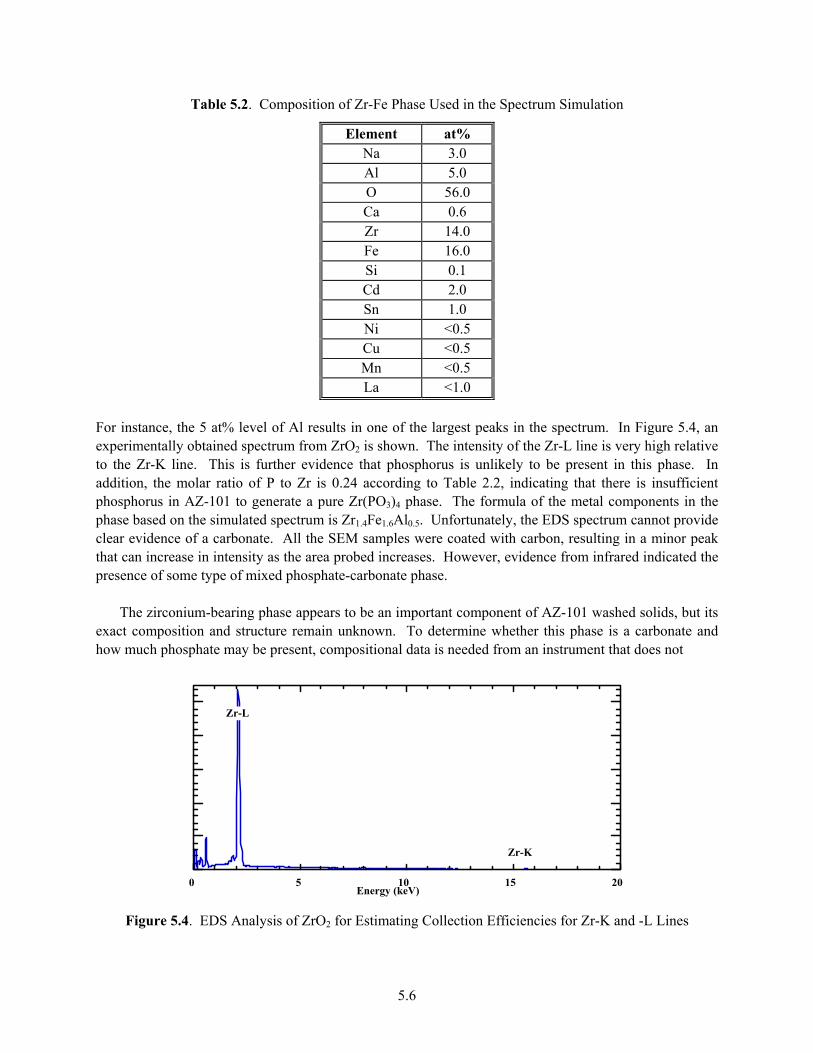
5.6
Table 5.2. Composition of Zr-Fe Phase Used in the Spectrum Simulation
Element at% Na 3.0 Al 5.0 O 56.0 Ca 0.6 Zr 14.0 Fe 16.0 Si 0.1 Cd 2.0 Sn 1.0 Ni <0.5 Cu <0.5 Mn <0.5 La <1.0
For instance, the 5 at% level of Al results in one of the largest peaks in the spectrum. In Figure 5.4, an experimentally obtained spectrum from ZrO2 is shown. The intensity of the Zr-L line is very high relative to the Zr-K line. This is further evidence that phosphorus is unlikely to be present in this phase. In addition, the molar ratio of P to Zr is 0.24 according to Table 2.2, indicating that there is insufficient phosphorus in AZ-101 to generate a pure Zr(PO3)4 phase. The formula of the metal components in the phase based on the simulated spectrum is Zr1.4Fe1.6Al0.5. Unfortunately, the EDS spectrum cannot provide clear evidence of a carbonate. All the SEM samples were coated with carbon, resulting in a minor peak that can increase in intensity as the area probed increases. However, evidence from infrared indicated the presence of some type of mixed phosphate-carbonate phase. The zirconium-bearing phase appears to be an important component of AZ-101 washed solids, but its exact composition and structure remain unknown. To determine whether this phase is a carbonate and how much phosphate may be present, compositional data is needed from an instrument that does not
0 5 10 15 20Energy (keV)
Zr-L
Zr-K
Figure 5.4. EDS Analysis of ZrO2 for Estimating Collection Efficiencies for Zr-K and -L Lines

5.7
suffer from carbon coating issues and is able to extract structural data from the phase. For instance, analytical transmission electron microscopy (TEM) combined with electron energy-loss spectroscopy would allow determination of whether carbonate, phosphate, or both are present in these phases. The correct identification of these phases may assist in final waste immobilization in borosilicate glass.
5.5 Uranium-Bearing Phases The one uranium-bearing phase is Na2U2O7, supported by thermodynamic models and some obser-vations (Jantzen and Laurinot 2001). In this study, we have observed the presence of euhedral uranium oxide particles in both AN-102 and AZ-101 washed solid samples; however, in each case, no evidence for Na-bearing uranate phases were found in the SEM-EDS analysis. The uranium oxide particles ranged in size from 5 to 8 µm in diameter to less than 1 µm. The shape of the particles suggests that they may have precipitated within the tanks. No transuranic elements were identified in the samples; however, none of the techniques used have the necessary detection capabilities to see these elements. Given the distribution of the uranium phases and their probable scattering potential, it is likely that they would be detected with XRD. In AN-102, these particles were fairly common and were attached to the bulk amorphous-looking Na-Al material. The XRD match to uraninite (UO2) was not convincing in either AZ-101 or AN-102, but a reasonable match to UO3-type phases was found. Under caustic conditions, it is possible that hydrated uranyl oxide hydrate, e.g., schoepite (ideal UO3•2H2O) or uranyl carbonate, rutherfordine (UO2CO3), phases might precipitate. Schoepite has characteristic reflections at 0.736, 0.366, 0.359, 0.348, and 0.324 nm. Schoepite was reported in S-104 sludge by Lumetta et al. (1997). Although the TEM images look characteristic of a uranyl oxide hydrate phase, there are insufficient data to confirm the existence of schoepite. Some of these reflections may be present in the XRD scans of AZ-101, but this is simply not strong enough evidence to support the identification of schoepite in the tank waste samples. Direct identification of this micron-sized phase can only be obtained with TEM.
5.6 Minor Phases in the Samples In both AN-102 and AZ-101, iron chromium oxide particles were observed occasionally. These would be expected to scatter at greater intensity than many of the other phases, even though they were minor components. Iron-bearing particles and iron chromium nickel were relatively common. These types of phases are unlikely to be metallic because an oxygen signal was visible in all analyses. The manganese phase observed in unwashed solids from AZ-101 was relatively common. Its composition was determined to be close to that of Na3MnAl0.2K0.2Ox. This composition does not match any known manganese phase but, as stated earlier, quantification with SEM-EDS is problematic, particularly for the light elements, sodium and oxygen. The phase may be related to manganese clay minerals (e.g., asbolane or birnessite), which produce a strong reflection near 0.70±0.02 nm (the interlayer spacing). The manganese clay minerals have a two-dimensional layered structure that consists of edge-shared MnO6 octahedra with cations and water molecules occupying the interlayer region (Chukhrov et al. 1980). Manganese clay mineral phases can be formed through oxidation of Mn2+ in concentrated NaOH solution. Although an unidentified reflection is observed near 0.7 nm, the XRD evidence is not strong enough for positive identification of this phase.

5.8
As the cerium-bearing particle (possibly cerianite, CeO2) and the yttrium vanadate particle (possibly wakefieldite, YVO4) were observed only once, these must be considered trace components. Cerianite (CeO2) and powellite ((Nd,La)WO4) have been observed to precipitate during long-term corrosion of borosilicate waste glasses exposed to high pH (Abdelouas et al. 1997). Tungsten-bearing particles were not observed in the samples. Zeolitic phases are commonly formed during borosilicate waste glass dissolution above pH 9–10. Wakefieldite can be formed by reacting yttrium nitrate with vanadium oxide at pH 12.5 (Riwotzki and Haase 1998) and has a structure similar to that of wakefieldite. One problem with SEM-EDS is that the probe excites an area approximately 1 µm3 in volume; thus it can be difficult to obtain a signal from a single phase. A higher spatial resolution technique such as TEM would be more useful in these cases because the composition would be exact, and structural information on the individual particle could be obtained (Buck et al. 1996). Quantitative information on phase distributions cannot be obtained with the techniques described in this report.
5.7 Nitrates Evidence for sodium nitrate and nitrite phases was present in the XRD spectrum of AN-102 (see Figure 3.8). These are evaporite phases. The sample preparation methods for SEM were generally more effective at reducing the total volume of these soluble phases. Evidence for NaNO2 and NaNO3 was reported by Lumetta et al. (2001). It is possible to identify these solely on the basis of XRD data. Table 5.3 lists possible phases reported in the JCPDS database. Because these phases are soluble, changes in the sample preparation method can easily result in their removal.
Table 5.3. XRD Data on Sodium Nitrite and Sodium Nitrate
Compound Major d-Spacings (nm) JCPDS Ref. NaNO3 0.304 0.231* 0.190* 36-1474 Na3NO3 0.230* 0.260* 0.163 34-743 Na2N2O3 0.229 0.268 0.258 35-926 NaNO2 0.298 0.279* 0.204 6-392
*Match to measured d-spacing within +/-0.01 nm. The gas generation studies reported by Bryan et al. (2002) demonstrated that nitrous oxide and nitrogen gas were produced during thermal testing. The origin of the nitrogen in these gases must be from the large volume percent of nitrates and nitrites in the AN-102 solids. Because both SEM and XRD are unable to detect organic phases, infrared spectroscopy of the sample would be worthwhile. Infrared techniques were used on AZ-101 washed solids but not on AN-102 washed solids. A clearer picture of the AN-102 solids for simulant development might be accomplished by using multiple characterization techniques as well as some phase separation techniques to isolate different components. All techniques have limitations but, by using a large range of techniques, it is possible to reduce the degree of speculation. Nitrate phases were also clearly present in the unwashed AZ-101 sample but were not observed in the washed AZ-101 sample.
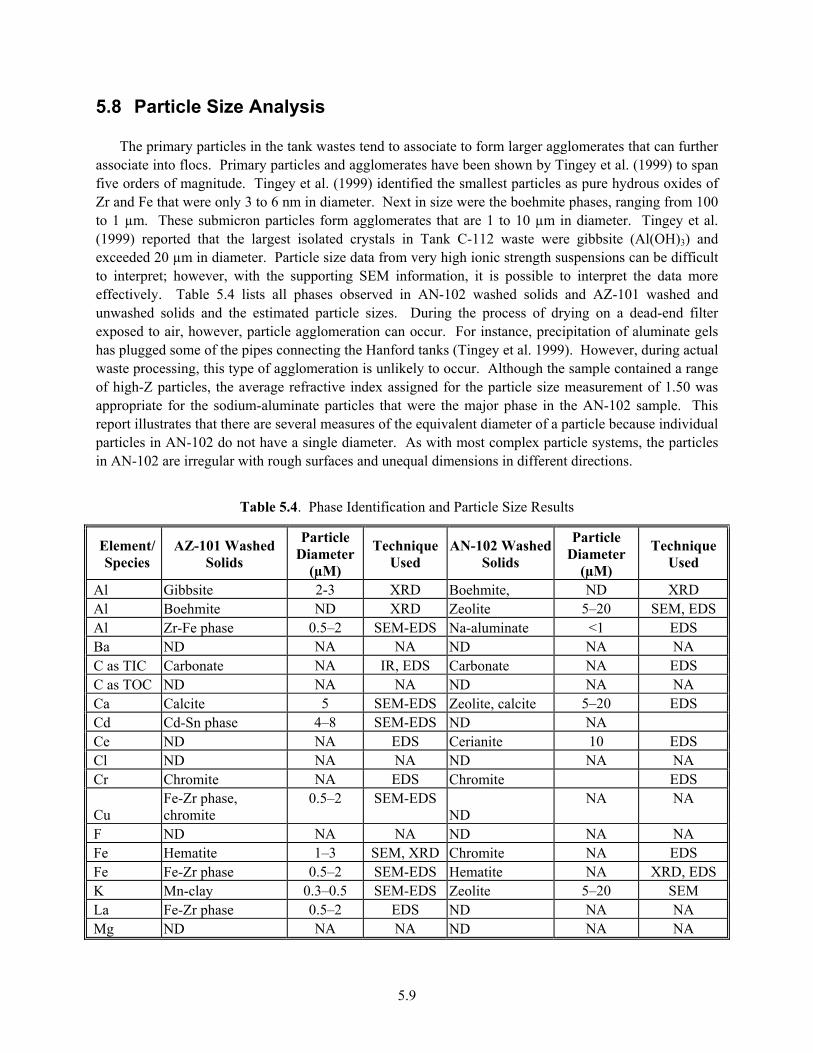
5.9
5.8 Particle Size Analysis The primary particles in the tank wastes tend to associate to form larger agglomerates that can further associate into flocs. Primary particles and agglomerates have been shown by Tingey et al. (1999) to span five orders of magnitude. Tingey et al. (1999) identified the smallest particles as pure hydrous oxides of Zr and Fe that were only 3 to 6 nm in diameter. Next in size were the boehmite phases, ranging from 100 to 1 µm. These submicron particles form agglomerates that are 1 to 10 µm in diameter. Tingey et al. (1999) reported that the largest isolated crystals in Tank C-112 waste were gibbsite (Al(OH)3) and exceeded 20 µm in diameter. Particle size data from very high ionic strength suspensions can be difficult to interpret; however, with the supporting SEM information, it is possible to interpret the data more effectively. Table 5.4 lists all phases observed in AN-102 washed solids and AZ-101 washed and unwashed solids and the estimated particle sizes. During the process of drying on a dead-end filter exposed to air, however, particle agglomeration can occur. For instance, precipitation of aluminate gels has plugged some of the pipes connecting the Hanford tanks (Tingey et al. 1999). However, during actual waste processing, this type of agglomeration is unlikely to occur. Although the sample contained a range of high-Z particles, the average refractive index assigned for the particle size measurement of 1.50 was appropriate for the sodium-aluminate particles that were the major phase in the AN-102 sample. This report illustrates that there are several measures of the equivalent diameter of a particle because individual particles in AN-102 do not have a single diameter. As with most complex particle systems, the particles in AN-102 are irregular with rough surfaces and unequal dimensions in different directions.
Table 5.4. Phase Identification and Particle Size Results
Element/ Species
AZ-101 Washed Solids
Particle Diameter
(µM)
Technique Used
AN-102 Washed Solids
Particle Diameter
(µM)
Technique Used
Al Gibbsite 2-3 XRD Boehmite, ND XRD Al Boehmite ND XRD Zeolite 5–20 SEM, EDS Al Zr-Fe phase 0.5–2 SEM-EDS Na-aluminate <1 EDS Ba ND NA NA ND NA NA C as TIC Carbonate NA IR, EDS Carbonate NA EDS C as TOC ND NA NA ND NA NA Ca Calcite 5 SEM-EDS Zeolite, calcite 5–20 EDS Cd Cd-Sn phase 4–8 SEM-EDS ND NA Ce ND NA EDS Cerianite 10 EDS Cl ND NA NA ND NA NA Cr Chromite NA EDS Chromite EDS
Cu Fe-Zr phase, chromite
0.5–2 SEM-EDS ND
NA NA
F ND NA NA ND NA NA Fe Hematite 1–3 SEM, XRD Chromite NA EDS Fe Fe-Zr phase 0.5–2 SEM-EDS Hematite NA XRD, EDS K Mn-clay 0.3–0.5 SEM-EDS Zeolite 5–20 SEM La Fe-Zr phase 0.5–2 EDS ND NA NA Mg ND NA NA ND NA NA

5.10
Table 5.4. Phase Identification and Particle Size Results
Element/ Species
AZ-101 Washed Solids
Particle Diameter
(µM)
Technique Used
AN-102 Washed Solids
Particle Diameter
(µM)
Technique Used
Mn Mn-clay 0.3–0.5 SEM ND NA NA Mo ND NA NA ND NA NA Na NaNO3 NA XRD, EDS Zeolite 5–10 SEM, XRD Na NA NA NA Na-aluminate <1 SEM-EDS Nd Fe-Zr phase 0.5–2 SEM-EDS ND NA NA Ni Fe-Zr phase 0.5–2 SEM-EDS Chromite 10 NA
NO2 NaNO3 NA IR NaNO3 NA XRD NO3 NaNO2 NA IR NaNO2 NA XRD
P Phosphate NA IR ND NA NA Pb ND NA NA ND NA NA Pd ND NA NA ND NA NA Rb ND NA NA ND NA NA Ru ND NA NA ND NA NA Si Fe-Zr phase 0.5–2 NA Zeolite 5–20 SEM
SO4 Na sulfate NA IR Na sulfate NA EDS Sn Cd-Sn phase 4–8 SEM-EDS ND NA NA Sr ND NA NA ND NA NA Te ND NA NA ND NA NA Th ND NA NA ND NA NA U U(VI)-oxide 5–20 SEM-EDS U(VI) oxide 5–10 SEM-EDS V ND NA NA Wakefieldite 5 SEM-EDS Y ND NA NA Wakefieldite 5 SEM-EDS Zr Fe-Zr phase 0.5–2 SEM-EDS ND NA NA
ND = element was not detected with SEM-EDS or IR, NA = not applicable Particle diameter based on SEM observations of individual particles. Some particles were present as agglomerates. Note: Some elements are listed more than once because they were present in more than one phase.
5.9 Sample Size Issues
Given the extremely small volume of the SEM, PSD, IR, and XRD samples relative to the bulk sample volume, there are issues with these being representative of the bulk material. In addition, the high activity in some samples, particularly AZ-101, necessitated further reduction of the sample size to allow examination in the various instruments. The tank waste samples are all highly heterogeneous, meaning that larger sample volumes need to be examined to be more confident in the results. However, comparison of the chemical analyses of AN-102 and AZ-101 with the SEM-EDS data, indicates that the disposition of most major and minor components has been determined. For example, evidence of co-precipitation of lanthanum and neodymium within the Fe-Zr phase in AZ-101. In addition, mineral phase data on some trace components has been established, for example, the yttrium vanadium phase in AN-102. The positive identification of a few phases; however, can tell us the approximate conditions in the tanks and will assist in thermodynamic modeling of potential phases likely to be present in the tanks.
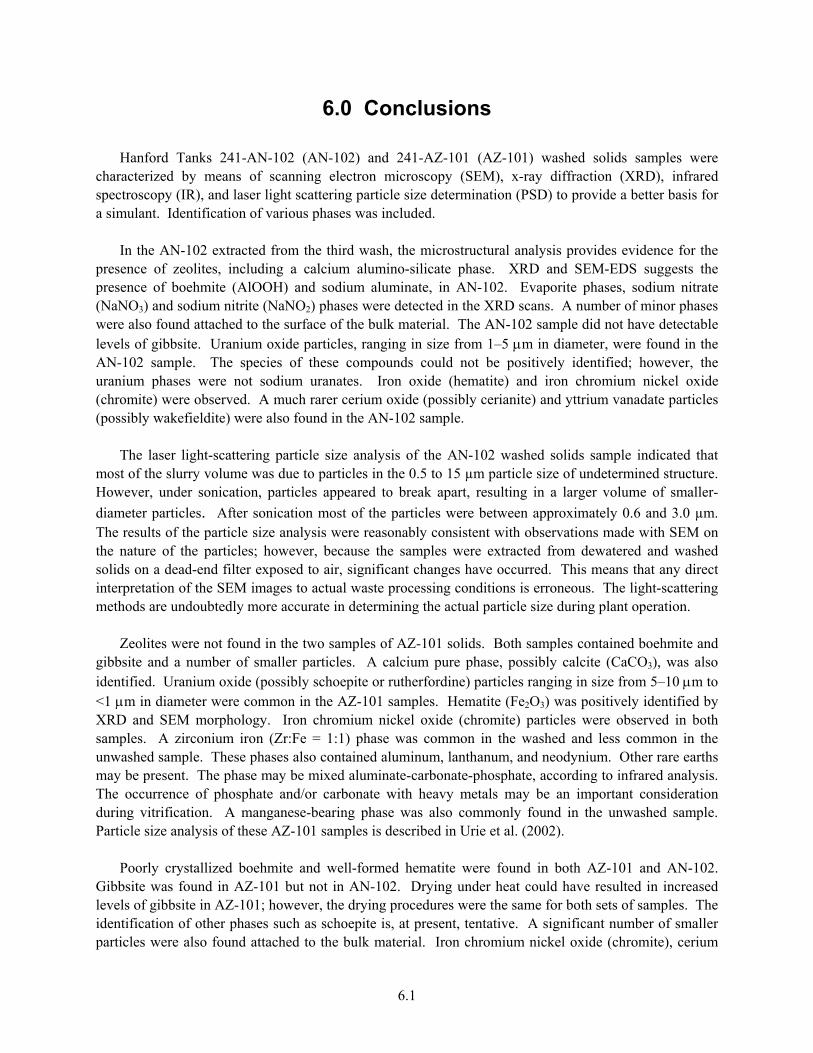
6.1
6.0 Conclusions Hanford Tanks 241-AN-102 (AN-102) and 241-AZ-101 (AZ-101) washed solids samples were characterized by means of scanning electron microscopy (SEM), x-ray diffraction (XRD), infrared spectroscopy (IR), and laser light scattering particle size determination (PSD) to provide a better basis for a simulant. Identification of various phases was included. In the AN-102 extracted from the third wash, the microstructural analysis provides evidence for the presence of zeolites, including a calcium alumino-silicate phase. XRD and SEM-EDS suggests the presence of boehmite (AlOOH) and sodium aluminate, in AN-102. Evaporite phases, sodium nitrate (NaNO3) and sodium nitrite (NaNO2) phases were detected in the XRD scans. A number of minor phases were also found attached to the surface of the bulk material. The AN-102 sample did not have detectable levels of gibbsite. Uranium oxide particles, ranging in size from 1–5 µm in diameter, were found in the AN-102 sample. The species of these compounds could not be positively identified; however, the uranium phases were not sodium uranates. Iron oxide (hematite) and iron chromium nickel oxide (chromite) were observed. A much rarer cerium oxide (possibly cerianite) and yttrium vanadate particles (possibly wakefieldite) were also found in the AN-102 sample. The laser light-scattering particle size analysis of the AN-102 washed solids sample indicated that most of the slurry volume was due to particles in the 0.5 to 15 µm particle size of undetermined structure. However, under sonication, particles appeared to break apart, resulting in a larger volume of smaller-diameter particles. After sonication most of the particles were between approximately 0.6 and 3.0 µm. The results of the particle size analysis were reasonably consistent with observations made with SEM on the nature of the particles; however, because the samples were extracted from dewatered and washed solids on a dead-end filter exposed to air, significant changes have occurred. This means that any direct interpretation of the SEM images to actual waste processing conditions is erroneous. The light-scattering methods are undoubtedly more accurate in determining the actual particle size during plant operation. Zeolites were not found in the two samples of AZ-101 solids. Both samples contained boehmite and gibbsite and a number of smaller particles. A calcium pure phase, possibly calcite (CaCO3), was also identified. Uranium oxide (possibly schoepite or rutherfordine) particles ranging in size from 5–10 µm to <1 µm in diameter were common in the AZ-101 samples. Hematite (Fe2O3) was positively identified by XRD and SEM morphology. Iron chromium nickel oxide (chromite) particles were observed in both samples. A zirconium iron (Zr:Fe = 1:1) phase was common in the washed and less common in the unwashed sample. These phases also contained aluminum, lanthanum, and neodynium. Other rare earths may be present. The phase may be mixed aluminate-carbonate-phosphate, according to infrared analysis. The occurrence of phosphate and/or carbonate with heavy metals may be an important consideration during vitrification. A manganese-bearing phase was also commonly found in the unwashed sample. Particle size analysis of these AZ-101 samples is described in Urie et al. (2002). Poorly crystallized boehmite and well-formed hematite were found in both AZ-101 and AN-102. Gibbsite was found in AZ-101 but not in AN-102. Drying under heat could have resulted in increased levels of gibbsite in AZ-101; however, the drying procedures were the same for both sets of samples. The identification of other phases such as schoepite is, at present, tentative. A significant number of smaller particles were also found attached to the bulk material. Iron chromium nickel oxide (chromite), cerium

6.2
oxide (cerianite), and yttrium vanadate (wakefieldite) particles were also found in the sample. Further detailed analysis with analytical transmission electron microscopy would be necessary to identify the individual phases conclusively and determine the location of specific elements. This information could then be used to reanalyze the bulk analysis data to obtain more reliable estimates of particle types and quantities and greatly assist in the understanding of the waste samples.
7.1
7.0 References Abdelouas A, JL Crovisier, W Lutze, B Grambow, JC Dran, and R Müller. 1997. “Surface layers on a borosilicate nuclear waste glass corroded in MgCl2 solution.” J. Nucl. Mater. Vol. 240, pp. 100-111.
Baltpurvins, KA, RC Burns, GA Lawrance, and AD Stuart. 1996. “Effect of pH and Anion Type on the Aging of Freshly Precipitated Iron(III) Hydroxide Sludges.” Environ. Sci. Technol. Vol. 30, pp. 939–944.
Bryan SA, JGH Geeting, and RL Sell. 2002. Thermal and Radiolytical Gas Generation from Washed AN-102 Sludge. PNWD-3201, Battelle – Pacific Northwest Division, Richland, WA.
Buck EC, NR Brown, and NL Dietz. 1996. “Contaminant Uranium Phases and Leaching at the Fernald Site in Ohio.” Environ. Sci. Technol. Vol. 30, pp. 81-88.
Chukhrov FV, AI Gorshkov, ES Rudnitskaya, VV Beresovskaya, and AV Sivtsov. 1980. “Manganese minerals in clays: A review.” Clays Clay Miner. Vol. 28, pp. 346-354.
Geeting, JGH, KP Brooks, RT Hallen, LK Jagoda, AP Poloski, DR Weier, and RD Scheele. 2002. Filtration, Washing, and Caustic Leaching of Hanford AZ-101 Sludge. PNWD-3206, Battelle Pacific Northwest Division, Richland, WA. Jantzen CM, JE Laurinot and KG Brown. 2002. "Thermodynamic modeling of the SRS Evaporators: Part I. The 2H and 2F Systems (U)" Westinghouse Savannah River Company Report, WSRC-TR-2000-00293, Rev 1, Aiken, SC.
Johnston CT, SF Agnew, JR Schoonover, JW Kenney III, B Page, J Osborn, and R Corbin. 2002. “Raman Study of Aluminum Speciation in Simulated Alkaline Nuclear Waste.” Environ. Sci. Technol. Vol. 36, pp. 2451-2458.
Krumhansl JL, PV Brady, PC Zhang, HL Anderson, SE Arthur, SK Hutcherson, MA Molecke, C Jove-Colon, J Liu, M Qian, KL Nagy, and B Wakoff. 1999. Final Report: Phase Chemistry of Tank Sludge Residual Components. Environmental Management Science Program, Project No. 60403. On line at: http://www.osti.gov/em52/final_reports/60403.pdf (accessed March 2003).
Lumetta GJ, BM Rapko, MJ Wagner, J Liu, and YL Chen. 1996. Washing and Caustic Leaching of Hanford Tank Sludges: Results of FY1996 Studies. PNNL-11278 Rev 1, Pacific Northwest National Laboratory, Richland, WA.
Lumetta GJ, IE Burgeson, MJ Wagner, J Liu, and YL Chen. 1997. Washing and Caustic Leaching of Hanford Tank Sludge: Results of FY1997 Studies. PNNL-11636 Rev 1, Pacific Northwest National Laboratory, Richland, WA.
Lumetta GJ, RT Hallen, IE Burgeson, RL Sell, SD Halstead, JP Bramson, OT Farmer III, LR Greenwood, ED Jenson, MJ Steele, and MW Urie. June 2001. Evaporation of a Mixture of Tank AN-102 Low-Activity Waste and C-104 Washing and Leaching Solutions. WTP-RPT-017, Battelle – Pacific Northwest Division, Richland, WA.
Mattigod, SV, DT Hobbs, LQ Wang, DM Dabbs, and IA Aksay. 2002. Precipitation and Deposition of Aluminum-Containing Species in Tank Wastes. Environmental Management Science Program, Project No. 81887. On line at: http://emsp.em.doe.gov/portfolio/AbstractDetails.asp?ProjectID=373 (accessed March 2003).
7.2
Music S, D Dracevic, S Popovic, and N Vdovic. 1998. “Microstructural properties of boehmite formed under hydrothermal conditions.” Mater. Sci. Eng. Vol. 52, pp. 145-153.
Riwotzki K and M Haase. 1998. “Wet chemical synthesis of doped colloidal nanoparticles: YVO4:Ln (Ln= Eu, Sm, Dy).” J. Phys. Chem. Vol. B102, pp. 10129-10135.
Tingey JM, JD Berg, KD Keefer, AS Lea, DR Rector, JW Virden, and S Stenkamp. 1999. Final Report: Colloidal Agglomerates in Tank Sludge: Impact on Waste Processing. Environmental Management Science Program, Project No. 54628. On line at: http://www.osti.gov/em52/final_reports/54628.pdf (accessed March 2003).
Urie MW, GM Mong, PR Bredt, AP Poloski, JA Campbell, RD Scheele, OT Farmer, CZ Soderquist, SK Fiskum, RG Swoboda, LR Greenwood, MP Thomas, EW Hoppe, and JJ Wagner. 2002. Chemical Analysis and Physical Property Testing of 241-AZ-101 Tank Waste—Supernatant and Centrifuged Solids. PNWD-3215, Battelle – Pacific Northwest Division, Richland, WA.
Venkatesan KA, PR Vasudeva, and K Stamberg. 2001. “Modeling of the sorption of Sr(II) on hydrous zirconium oxide.” J. Radioanal. Nucl. Chem. Vol. 250, pp. 477-484.
PNWD-3300 WTP-RPT-076 Rev. 0
Distr.1
Distribution No. of Copies OFFSITE
No. of Copies ONSITE
4 Savannah River Technology Center Russ Eibling PO Box 616, Road 1 Building 999-W Aiken, SC 29808 Erich Hansen PO Box 616, Road 1 Building 773-41A Aiken, SC 29808 Jim Marra PO Box 616, Road 1 Building 773-43A Aiken, SC 29808 Harold Sturm PO Box 616, Road 1 Building 773-A Aiken, SC 29808
16 Battelle - Pacific Northwest Division B.W. Arey P8-16 J.M. Bates K7-15 J.R. Bontha K6-24 E.C. Buck P7-27 A.R. Felmy K8-96 S.K. Fiskum P7-22 J.G.H. Geeting P7-28 E.D. Jensen P7-22 B.K. McNamara P7-25 D.E. Kurath P7-28 A.P. Poloski P7-25 G.L. Smith H4-02 Project File (2) P7-28 Information Release (2) K1-06
9 Bechtel National, Inc. S.M. Barnes H4-02 W.L. Graves H4-02 H.R. Hazen H4-02 D.E. Larson H4-02 R.A. Peterson H4-02 K. Prindiville H4-02 P.S. Townson H4-02 W.L. Tomasitis H4-02 WTP PDC Coordinator H4-02