Embed Size (px)
Citation preview

THE BOARD OF EDUCATION NICHOLAS COUNTY
BOARD MEMBERS 400 OLD MAIN DRIVE SUMMERSVILLE, WV 26651 Lloyd K. Adkins, President Phone (304) 872-3611 Fax (304) 872-4626Philip BerryBarbara TaylorBob M. O’DellJason Swager
SUPERINTENDENT Beverly Kingery
February 28, 2011
Jan Stanley, State Title I DirectorExecutive Director, Office of Title IDivision of Educator Quality and System SupportWest Virginia Department of Education1900 Kanawha Blvd., EastBldg. 6, Room 330Charleston, WV 25305
Re: Richwood High School, NCES ID # 540102000847
Dear Ms. Stanley:
Please accept this letter and attachments as intent to make application for a school improvement grant authorized by section 1003(g) of the Elementary and Secondary Education Act on behalf of Richwood High School, a Tier II school. Nicholas County Schools will implement the transformational model at Richwood High School.
Enclosed are the Needs Assessment, a District Capacity Index, and a preliminary budget for all three years of the grant. A leadership team consisting of Richwood High School and Central Office staff has led the involvement of the total school faculty in developing these documents.
We appreciate your assistance and will be happy to quickly supply any additional information you might need.
Sincerely,

Beverly Kingery, SuperintendentNicholas County Board of Education
District Capacity Index
Criteria Poor1 point
Satisfactory2 points
Commendable3 points
Points Earned
LEA governance State takeover district Limited SEA intervention No SEA intervention 3
Title I audit reportsFindings in areas requiring a repayment of funds
Findings in areas noted-repayment of funds not required
No findings in the fiscal area 2
LEA overall achievement ranking
Bottom (5% = 3 districts)
Middle(70% = 38 districts)
Top (25% = 14 districts) 2
Approval of the district strategic plan by the SEA(entire plan, not just the Title I section)
Not approved by the SEA Approved by the SEA with revisions
Approved by the SEA without revisions 3
Percentage of Title I schools that met AYP in the last testing cycle
0-50% of the Title I schools met AYP.
51-75% of the Title I schools met AYP.
76-100% of the Title I schools met AYP. 3
Development of schools as professionallearning communities
The school has not yet begun to address the practice of a PLC or an effort has been made to address the practice of PLCs, but has not yet begun to impact a critical mass of staff members.
A critical mass of staff has begun to engage in PLC practice. Members are being asked to modify their thinking as well as their traditional practice. Structural changes are being met to support the transition.
The practice of PLCs is deeply embedded in the culture of the school. It is a driving force in the daily work of the staff. It is deeply internalized and staff would resist attempts to abandon the practice.
2
Identification of district leadership team and assignment of responsibilities
No district leadership team nor identified person assigned for monitoring implementation
Lacks specific identification of personnel for the district leadership team and for monitoring implementation.
A specific district leadership team is identified and one or more persons are assigned for monitoring implementation.
3
School Leadership Team
School leadership team members are identified on the district and school level, but little evidence is produced to document whether the requirements of NCLB Sections 1116 and 1117 have been met.
School leadership team members are identified on the district and school level and evidence is produced to document whether the requirements of NCLB Sections 1116 and 1117 have been met.
School leadership team members are identified on the district and school level and include a wide range of stakeholders (e.g., parents; representatives of institutions of higher education; representatives of RESA or representatives of outside consultant groups).Evidence is produced to document whether the requirements of
3

NCLB Sections 1116 and 1117 have been exceeded.Total Points 21
Districts must obtain a score of 20 out of 24 possible points to demonstrate capacity to provide adequate resources and related support to each Tier I and Tier II school identified in the LEA’s application in order to implement fully and effectively the selected intervention/activities in each identified school.
Revisions to Capacity Index:
1. A copy of the rubric demonstrating no revisions for the Title I plan is attached. (See Attachment 5.)
2. The Nicholas County Strategic Plan was approved. 2011 Strategic
Plan RLIS IDEA Technology Title I Title II Title III Title IVARRATitle I
ARRAIDEA
ARRAEETT
ARRAStabilization
NICHOLAS Approved Approved Approved Approved Approved Approved
3. 100% of Nicholas County Title I schools met AYP.4. The practice of utilizing Professional Learning Communities (PLCs) as a vehicle for professional
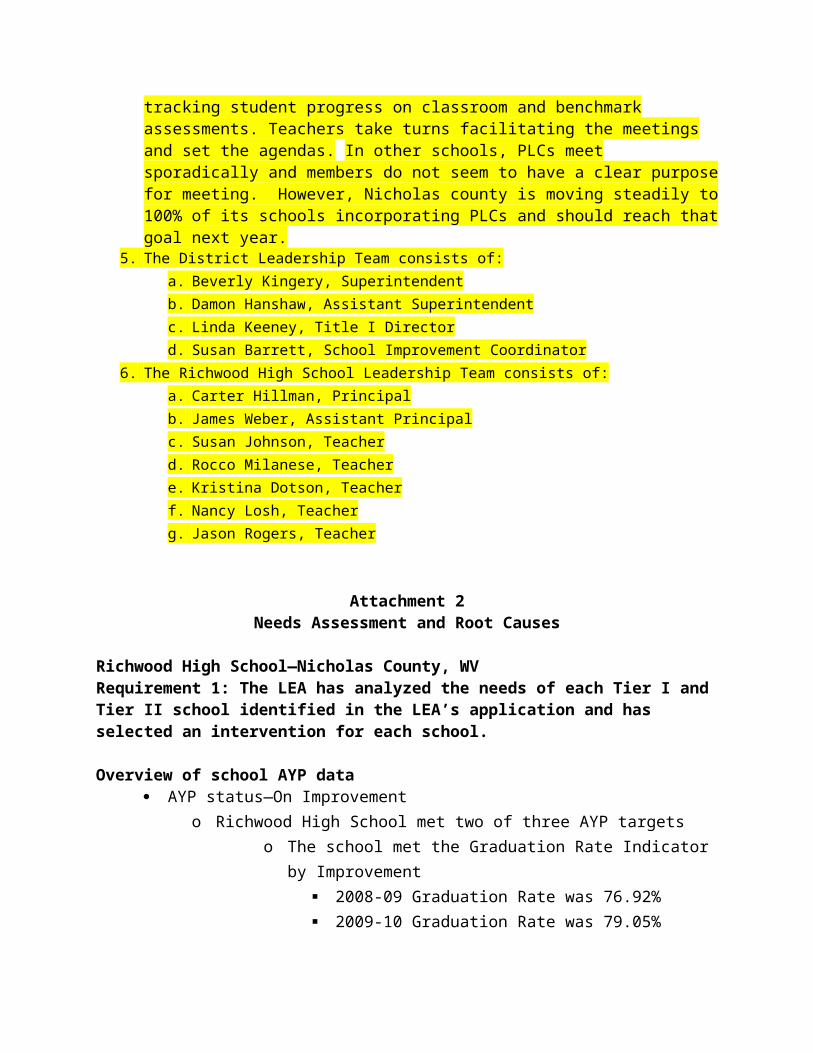
development was introduced on the district level three years ago. Central office personnel received professional development on the topic through sessions provided by the WVDE. School board members, principals, and central office staff have engaged in several book studies centered on leadership and increasing student achievement, including Classroom Assessment for Student Learning, Results Now, and From Good to Great. These provided the framework for rich professional discussions and gave those in leadership positions the opportunity to experience a PLC first hand. Principals and central office staff are now organized in PLCs around self-selected topics and meet several times a year as a part of principals’ meetings.Copies of Classroom Instruction That Works were purchased for each school to put research-based instructional strategies in the hands of teachers and to extend the PLCs to the school level. In some schools, PLCs now meet weekly and the members have moved beyond book studies to focus on continuous improvement through data analysis, setting SMART goals, and tracking student progress on classroom and benchmark assessments. Teachers take turns facilitating the meetings and set the agendas. In other schools, PLCs meet sporadically and members do not seem to have a clear purpose for meeting. However, Nicholas county is moving steadily to 100% of its schools incorporating PLCs and should reach that goal next year.
5. The District Leadership Team consists of:a. Beverly Kingery, Superintendentb. Damon Hanshaw, Assistant Superintendentc. Linda Keeney, Title I Directord. Susan Barrett, School Improvement Coordinator
6. The Richwood High School Leadership Team consists of:a. Carter Hillman, Principalb. James Weber, Assistant Principalc. Susan Johnson, Teacher

d. Rocco Milanese, Teachere. Kristina Dotson, Teacherf. Nancy Losh, Teacherg. Jason Rogers, Teacher
Attachment 2Needs Assessment and Root Causes
Richwood High School—Nicholas County, WVRequirement 1: The LEA has analyzed the needs of each Tier I and Tier II school identified in the LEA’s application and has selected an intervention for each school. Overview of school AYP data
AYP status—On Improvemento Richwood High School met two of three AYP targets
o The school met the Graduation Rate Indicator by Improvement 2008-09 Graduation Rate was 76.92% 2009-10 Graduation Rate was 79.05%
o The School did not meet the required Participation Rate of 95% The participation rate in Math by All students was 94% The participation rate in Math by Low SES students was 93% The participation rate in Reading and Language Arts by Low
SES students was 93%o Richwood High School met the Assessment Standards Indicator by
confidence intervals: 28% of all students were proficient in Math (confidence interval
18) 19% of Low SES students were proficient in Math (confidence
interval 15) 21% of Low SES students were proficient in Reading
(confidence interval 12)
School improvement status and applicable sanctions—Richwood High School (NCES ID # 540102000847) has been identified as a Tier II school.
Number of required instructional days/minutes within the school year –Richwood High School currently meets the required number of instructional minutes/days, excluding days of instruction lost for inclement weather or other emergencies. They have 360 minutes/day and 180 days/year for instruction. Although it is beyond their control, it is worth noting that 19 days of instruction were missed last year and 15 so far this year due to snow. Combining those with 2-hour delays and early dismissals for bad weather, a significant amount of instructional time has been missed. There are two days at the end of each semester set aside for final and make-up exams; only a small percent of students are present on those days.
Arena scheduling, pep rallies, and special programs have accounted for smaller amounts of lost instructional time.
A description of the conclusions reached after examining AYP data—While Richwood High School failed in meeting only one of the three required indicators for meeting AYP, the two that were met through improvement and confidence intervals loom as concerns. A graduation rate of 79% and the low percentages of students proficient in Reading and Math are quantifiable symptoms of both academic and a poor school climate. Trend data, both external trend data and student achievement data will support the conclusion that students, as well as staff and community, have allowed academic failure to become commonplace and “unavoidable.”
External trend data Local demographic trends are reviewed for the impact on student achievement.
o District and school poverty rates—The most recent poverty-census data (2009) indicates that 18.1% of Nicholas County Citizens live below the poverty level. In Nicholas County Schools, 2,212 students, or 58.15%, qualify for free or reduced meals. At Richwood High School, 64.48% of students in grades 9-12 qualify for free or reduced meals.
o Mother’s educational level—While the county has 70% of persons over the age of 25 with a high school diploma, the number of high school dropouts in recent years makes the value of that statistic questionable. 223 students at Richwood High School dropped out of school in the years 2001-2010.
o Number of college graduates in the district—Only 10% of Nicholas County citizens have a college degree or higher.
o Median age of district population—The median age in 2000 was 44.7.o Substance abuse—West Virginians are more likely to die from drug overdoses than
people in any other state. Drug overdoses have become the leading cause of death for adults younger than 45 in West Virginia. More than fifty percent of expulsions conducted in the 2006-07 school year in Nicholas County were because of drug possession.
o Unemployment rate—The county unemployment rate as of December 2010 was 12.1%
o Mobility rate of students—Only 68% of families in Nicholas County have lived in the same location for more than 5 years. At Richwood High School, the number of homeless students for the current school year is 20. The number of homeless students last year was 8.
A description of the conclusions reached after examining external trend data—If demographics for the community of Richwood have elevated certain risk factors for all citizens, secondary students need “intensive care” in order to escape those risks. Research indicates that more than 80% of High School dropouts remain within 20-30 miles of their high school. So a high dropout rate can compound poor demographic data. Unfortunately, the combination of poor demographics and a failing school provides a fertile field for a parasitic drug culture.


Student achievement data
Percentage of students at or above each performance level on State assessments in reading/language arts and mathematics by grade:
RHS 2010 WESTEST 2 Performance Levels
MATHEMATICS READING & LANG. ARTS
Grade 9 Grade 10 Grade 11Grade
9 Grade 10 Grade 11Novice 47% 47% 57% 41% 38% 30%
Partial Mastery 27% 29% 16% 36% 30% 39%Mastery 20% 18% 20% 18% 18% 22%
Above Mastery 6% 5% 5% 4% 10% 9%Distinguished 0% 1% 1% 1% 5% 1%
RHS 2009 WESTEST 2 Performance Levels
MATHEMATICS READING & LANG. ARTS
Grade 9 Grade 10 Grade 11Grade
9 Grade 10 Grade 11Novice 24% 11% 19% 6% 5% 6%
Partial Mastery 22% 35% 25% 49% 50% 54%Mastery 50% 50% 57% 29% 33% 32%
Above Mastery 3% 4% 0% 15% 11% 7%Distinguished 0% 0% 0% 1% 2% 1%
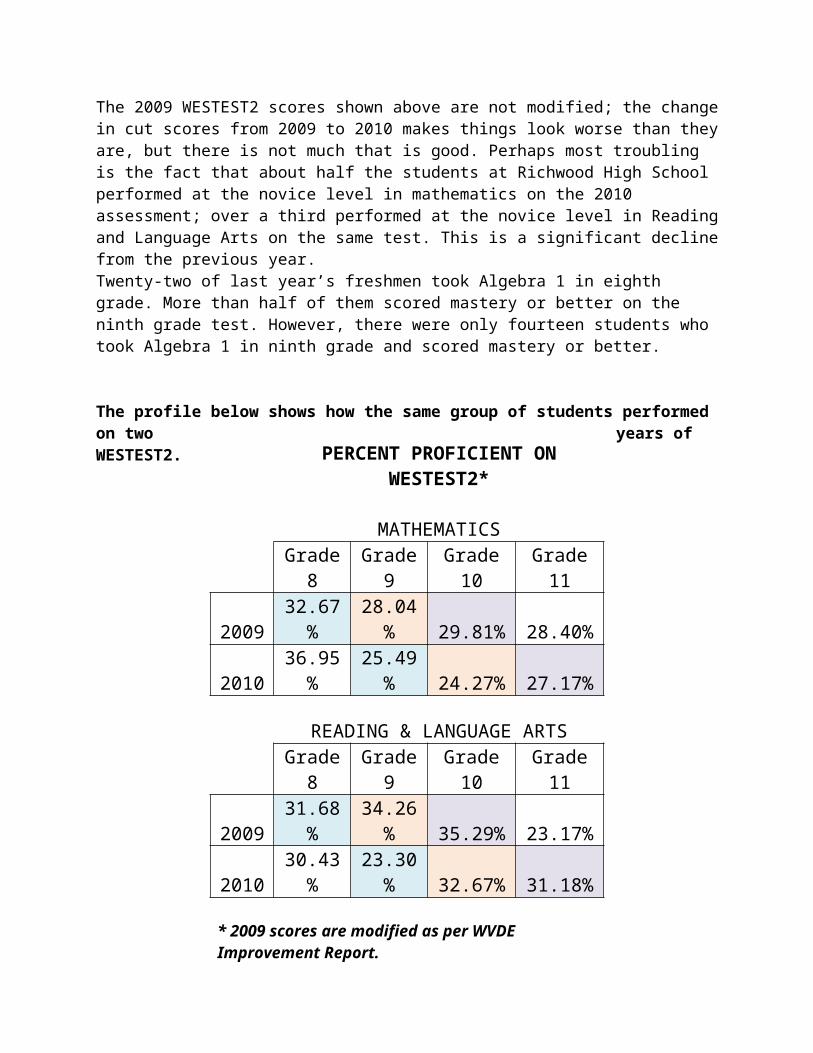
Gap Analysis:The 2009 WESTEST2 scores shown above are not modified; the change in cut scores from 2009 to 2010 makes things look worse than they are, but there is not much that is good. Perhaps most troubling is the fact that about half the students at Richwood High School performed at the novice level in mathematics on the 2010 assessment; over a third performed at the novice level in Reading and Language Arts on the same test. This is a significant decline from the previous year.Twenty-two of last year’s freshmen took Algebra 1 in eighth grade. More than half of them scored mastery or better on the ninth grade test. However, there were only fourteen students who took Algebra 1 in ninth grade and scored mastery or better.

The profile below shows how the same group of students performed on two years of WESTEST2.
Gap Analysis:
Eighth grade scores are included to show where students were when they entered the high school.
Even with the modified scores, all three grades showed a decline in the percent of students reaching mastery or better when comparing the same group of students from 2009 to 2010. The largest drops were from eighth to ninth grade in both Math and Reading & Language Arts.
PERCENT PROFICIENT ON WESTEST2*
MATHEMATICS Grade 8 Grade 9 Grade 10 Grade 11
2009 32.67% 28.04% 29.81% 28.40%2010 36.95% 25.49% 24.27% 27.17%
READING & LANGUAGE ARTSGrade 8 Grade 9 Grade 10 Grade 11
2009 31.68% 34.26% 35.29% 23.17%2010 30.43% 23.30% 32.67% 31.18%
* 2009 scores are modified as per WVDE Improvement Report.

Almost every grade and subject showed a decrease in scores from 2009 to 2010; the only exception was Grade 11 Reading and Language Arts.
Percentage of students at mastery or better on State assessments in reading/language arts and mathematics by subgroup:
Richwood High School WESTEST 2 Percent Proficient by Subgroup
2010 MATHEMATICS 2009 MATHEMATICSGrade 9 Grade 10 Grade 11 Grade 9 Grade 10 Grade 11
All Students 25% 24% 27% All Students 53% 53% 57%Female 31% 18% 29% Female 55% 61% 58%Male 21% 31% 24% Male 52% 42% 56%
Low SES 22% 15% 19% Low SES 48% 43% 49%Special Ed. 4% 5% 7% Special Ed. 30% 26% 25%
2010READING & LANGUAGE
ARTS 2009READING & LANGUAGE
ARTSGrade 9 Grade 10 Grade 11 Grade 9 Grade 10 Grade 11
All Students 23% 33% 31% All Students 44% 46% 40%Female 32% 46% 40% Female 55% 54% 55%Male 15% 20% 20% Male 34% 33% 26%
Low SES 17% 32% 21% Low SES 36% 38% 33%Special Ed. 4% 0% 0% Special Ed. 11% 0% 0%
Gap Analysis:Girls are outperforming boys in almost every grade and subject area, with the only exception being tenth grade Mathematics in 2010. The gap is wider and more consistent in Reading and Language Arts across all grades.Students in the Low SES group scored consistently below the All Students group. There does not appear to be any significant pattern in those differences by subject or grade.Students with Disabilities performed at significantly lower levels than other students. This group makes up as much as 24% of students in some grades so their performance has a significant impact on the overall scores. The gap is wide in both Mathematics and Reading & Language Arts and has widened between 2009 and 2010.

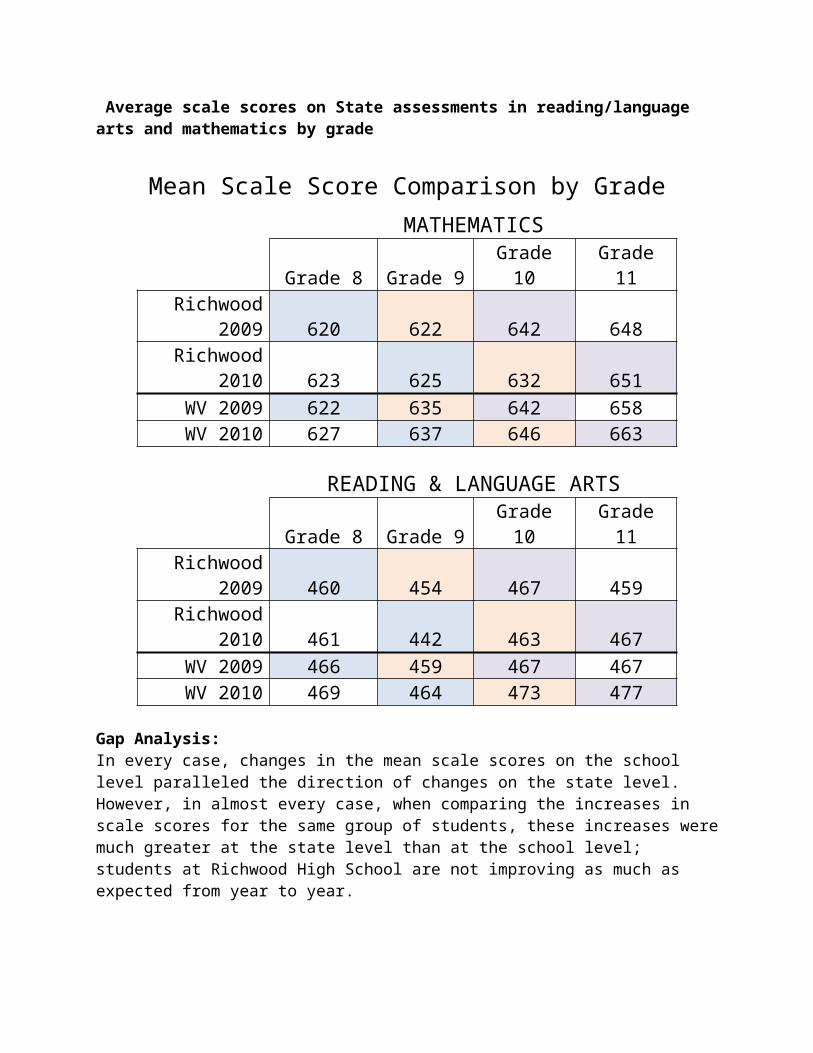
Average scale scores on State assessments in reading/language arts and mathematics by grade
Mean Scale Score Comparison by Grade
MATHEMATICS Grade 8 Grade 9 Grade 10 Grade 11
Richwood 2009 620 622 642 648
Richwood 2010 623 625 632 651
WV 2009 622 635 642 658WV 2010 627 637 646 663
READING & LANGUAGE ARTSGrade 8 Grade 9 Grade 10 Grade 11
Richwood 2009 460 454 467 459
Richwood 2010 461 442 463 467
WV 2009 466 459 467 467WV 2010 469 464 473 477
Gap Analysis:In every case, changes in the mean scale scores on the school level paralleled the direction of changes on the state level. However, in almost every case, when comparing the increases in scale scores for the same group of students, these increases were much greater at the state level than at the school level; students at Richwood High School are not improving as much as expected from year to year.The only place where mean scale scores declined on the state level was a 2-point drop in RLA for students moving from eighth to ninth grade. At Richwood, this decline was 18 points.There were two cases where students in Richwood had a mean scale score equal to all students in the state in 2009 (tenth grade Math and RLA). This did not hold steady in 2010 for those students or that grade in either subject.

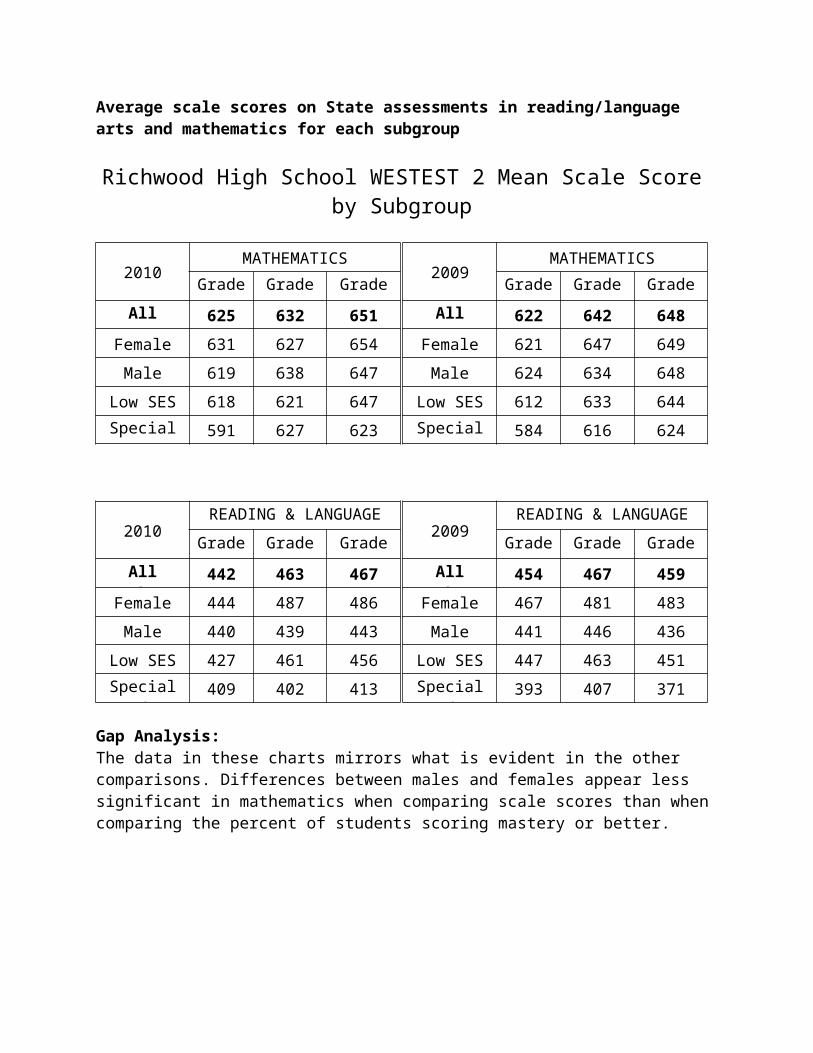
Average scale scores on State assessments in reading/language arts and mathematics for each subgroup
Richwood High School WESTEST 2 Mean Scale Score by Subgroup
2010MATHEMATICS
2009MATHEMATICS
Grade 9 Grade 10 Grade 11 Grade 9 Grade 10 Grade 11
All Students 625 632 651 All Students 622 642 648
Female 631 627 654 Female 621 647 649
Male 619 638 647 Male 624 634 648
Low SES 618 621 647 Low SES 612 633 644
Special Ed. 591 627 623 Special Ed. 584 616 624
2010READING & LANGUAGE
ARTS 2009READING & LANGUAGE
ARTSGrade 9 Grade 10 Grade 11 Grade 9 Grade 10 Grade 11
All Students 442 463 467 All Students 454 467 459
Female 444 487 486 Female 467 481 483
Male 440 439 443 Male 441 446 436
Low SES 427 461 456 Low SES 447 463 451
Special Ed. 409 402 413 Special Ed. 393 407 371 Gap Analysis:The data in these charts mirrors what is evident in the other comparisons. Differences between males and females appear less significant in mathematics when comparing scale scores than when comparing the percent of students scoring mastery or better.

o Percentage of limited English proficient students who attain English language proficiency – Richwood High School does not have any LEP students at this time.
o Comparative gap analysis for all subgroups – Gap analysis has been included following each chart above.
o Other Student Achievement Data – ACT PLAN – Average scores at Richwood High School have declined in all
areas over the past three years, while scores on the national level have increased in all areas. Females outscored males on every subtest of the most recent test. The greatest discrepancies between local and national scores were in the area of Mathematics (2.9), English (2.1) and in the subscore for Pre-Algebra (2.3).
ACT – The percent of students who took the ACT in 2008-2009 was 44%, 26% lower than the state average. The average composite score was 18.9
Advanced Placement Courses – Seventy-eight AP classes were taken by students in 2009-2010. Courses included Calculus AB, Chemistry, English Language and Composition, English Literature and Composition, and Environmental Science. There were 47 exams taken, with 37 of those in English. Students received a score of 3 or better on 13 of those exams. AP exams were taken by 23% of juniors and 22% of seniors in 2008-2009.
Course failures - An analysis of the data for the first semester of the current school year showed 105 course failures. There are two strong patterns evident – 67% of the failures were courses taken by freshmen and sophomores and 43% of the failures were in Math, with the majority of those for Algebra Support, Algebra 1, and Geometry. This pattern goes back several years; on DP21 there are several semesters that show a failure rate in mathematics that exceeds 30%.
A description of the conclusions reached after examining student achievement data—
Between 2004 and 2008 the percent of students reaching mastery or better ranged from 53% to 60% in mathematics and from 62% to 74% in reading and language arts. These numbers are somewhat deceptive as Richwood High School consistently lagged behind the other high school in the county and the state averages. With only tenth grade scores available, the lack of progress may not have been given sufficient attention as the school continued to make AYP for academics. These deficits became more apparent with WESTEST 2 as increased rigor led to plummeting test scores, particularly in 2010. The failure rate in Algebra I and Geometry classes indicates a need for a comprehensive change in instruction; what they are currently doing is not working. The data shows a clear need to focus on a successful transition from middle to high school, particularly in mathematics, yet nobody on the staff mentioned this
Other student outcome data Analysis includes review of other important student outcome data:
o Attendance: 2006 Register—92.04%/ 2007 Register—90.10% 2008 Register—86.67 2009 Register—90.73 (Accountability 94.78) 20010 Register—92.21 (Accountability 95.84)
o Promotion/retention rates-- Until last year, the school did not have a retention policy and students passed to the next grade automatically, becoming “fifth year seniors” if they did not have enough credits to graduate. Promotion to the next grade is now tied to the number of credits earned.
o Dropout rates - The dropout rate given on the school’s annual report card ranged from 4.0 to 4.5 for 2006-2009. However, students do not count on the drop out rate until their class graduates. During the last school year, 2009-2010, twenty-three students elected to drop out at Richwood High School. More troubling, however, is that nine of those who dropped out were ages 18-20. Seven of the dropouts were seniors.
o Discipline—While Richwood High School has had a dramatic decrease in Total Discipline Referrals (944 in 2006-2007 down to 123 in 2009-2010), the number of out-of-school suspensions has shown a reverse trend: 94 in 2006-2007, 123 in 2007-08, 146 in 2008-09, 123 in 2009-10.
A description of the conclusions reached after examining other student outcome data. Weaknesses in three important areas warrant careful consideration in building the transformation at Richwood High School.
o Attendance, dropout rates and discipline are areas of concern. NCLB allows attendance data to exclude “excused” absences. The Nicholas County Attendance Director has been waging an on-going battle with local physicians whose staffs write “doctor’s excuses” based on simple phone requests.
o Dropout rates do not sound alarmingly high. However, more telling data is the graduation rate at Richwood High School. In 2005-06 it was 81.91%. In 2006-07 it was 84.49%. In 2007-08 it was 81.40%. In 2008-2009 it was 76.92%!
o While total number of discipline referrals has declined dramatically, the number of out-of-school suspensions is not acceptable.
Analysis of culture, conditions and practices Analysis includes a review of the following data:
o Cultural Typology or Cultural Survey results conducted by the State System of Support (SSOS) The SSOS team visited Richwood High School in February but the school has not yet received their report.
o Current governance structure – presence of engaged principals, teacher input into decision-making, the organization of teachers by teams – Richwood has a full-time principal and a half-time assistant principal. There are department heads for the core subjects but they do not meet regularly. When they do meet, it is after school. A leadership team of 5 teachers was appointed by the superintendent when the school began this school improvement effort. Committees have been formed to address academic standards, incentives, communication, policies, and morale.
o Instructional Practices Inventory conducted by the SSOS – This has not yet taken place.o Use of standards-based instructional practices – Considerations from the Frameworks
Needs Assessment in the school’s strategic plan indicate the following as prioritized strategic issues for the current school year:
1. By the end of the 2010-2011 school year Richwood High School will have developed a platform for teachers to address issues and concerns based on faculty meeting notes, development of data analysis skills, and implementation of curricular outcome strategies.
2. By the end of the 2010-2011 school year Richwood High School parents and community members will have a greater connection to the high school based on parent and community interest surveys and overall activity involvement.
3. By the end of the 2010-2011 school year Richwood High School teachers will be more uniform in their approach to developing curricular support and strategies based on CSO mastery understanding and content vocabulary cues.
4. By the end of the 2010-2011 school year Richwood High School will have developed and implemented RTI, Tier I intervention strategies for class instruction based on department best practices, professional dialogue, and assessment.
5. To assure that school staffs utilize 21st Century skills, research-based instructional design, management, and delivery.
It is not clear how many of the faculty members are aware of these strategic issues or the goals and objectives that are a part of the plan. There is a disconnect between what is in the plan and what is actually happening in the school.
o Availability of current technology and degree to which technology is integrated into instructionTeachers have presentation stations including a laptop, ELMO, and data projector. The degree that technology is integrated in classroom instruction varies from one teacher to another, as does the degree of technological expertise. Data has been submitted indicating that the computer labs were used 50 days during the first semester, often by more than one teacher during the same day. There are two computer labs and 34 computers in the
library, all with Vista or Windows 7 and Office 2010. Data shows that the computer labs were used 50 days during the first semester, often by more than one teacher during the same day. The most common use of the labs has been for word processing and research. The use of Acuity for benchmark assessments increased from a total of 6 last year to over 600 this year. There are 20 other computers available for student use in two other rooms.
o Federal monitoring reports for NCLB, IDEA and state reports for the Office of Education Performance Audits—The Office of Education Performance had one audit finding for Richwood High School—The school did not have a minimum of 95% of students participate in required statewide testing.
o Questionnaires or observations completed by staff or external evaluators--Two teachers put together a survey for faculty and one for students as part of this needs assessment. The surveys were completed by only two-thirds of the teachers, a fact which in itself says something about the school culture. The results of the survey are still being analyzed at this time.
o Description of the overall culture, conditions and practices that exist in the school-- Richwood High School has a staff with an average of 20 years of experience led by a principal who came to the community from another state about three years ago. The principal’s knowledge is up to date regarding best practices, school improvement, and research findings. However, this knowledge has yet to have much impact on classroom practice or school culture. As an example, the principal writes of ongoing Professional Learning Communities in the strategic plan, but a teacher on the school leadership team was not aware of what “PLC” meant. After the term was explained, the leadership team agreed that they did not have PLCs at their school. Although they are on a block schedule with 90-minute planning periods, teachers do not have any collaborative planning built in. Teachers generally seem to do their own thing, bringing to mind the description of a school as “a group of independent contractors united by a common parking lot.” Over the years of slow economic and academic decline, complacency and an attitude of tacit acceptance of low student performance and effort have settled in at Richwood High School.
o Results of classroom walkthroughs—Walkthroughs for the current year recorded in two weeks of visits found that: 68% of teachers were seated at their desks; 45% of students were doing seatwork; 34% of teachers were in the front of the room; 34% of the students were involved in student-based activity.
o Highly qualified teacher data—100% of teachers at Richwood High School were highly qualified in 2010.
o Number of administrators in the building, definition of roles, years experience, specialized training and advanced degrees-- Carter Hillman came to Richwood High School as the second long-term substitute to replace an administrator who was suffering from a serious illness. He was officially hired as the school principal at the beginning of the 2009-2010 school year. He has 9 years of administrative experience with master’s degrees in School Administration and Teaching. He has attended the Principal Leadership Academy where he was

named a Distinguished Scholar; he has also participated in the Principal Fellows Scholarship Program.Jim Weber serves as a half-time assistant principal, teaching Social Studies classes part of the day. He accepted this position at the beginning of the current school year and it is his first administrative position. He has an M.A. in Education with certification in Educational Administration.
o Use of professional and paraprofessional staff to support students--There are three instructional aides who work with students with special needs. There is a Pro Officer in the school and a part-time Dropout Preventionist.
o Number of content and program specialists (e.g., counselors, health staff and social workers)--The school is served by a full-time guidance counselor. She has been working at Richwood High School for two years, working at the adjacent middle school for several years before that. She is often overwhelmed with data entry and other clerical work and does not have the time she would like to devote to counseling students. There is no social worker although several faculty members have pointed out the need for one. The Wellness Center housed at the adjacent middle school has improved student access to health care while keeping them in the school environment.
o Professional development (e.g., opportunities available to teachers and principals, number of days dedicated to professional development and the amount of teacher generated professional development, percentage of teachers regularly attending professional development)--Professional development is provided by the county as required. There is little that is school-based or driven by the needs of the students or faculty of the school. Many veteran teachers have an “I’ve already seen this” attitude and participate with little enthusiasm. Follow-through and follow-up are clearly lacking, with teachers perceiving much of what has been presented as wave after wave of new initiatives with no time to adjust.
o Teacher average monthly attendance rates-- Teachers’ attendance rates are lower than those of students. Considering that student attendance is one of the areas that has been targeted for improvement, this fact compounds the problem. Although there have been serious illnesses with faculty and family members, factors such as the age of the faculty, job satisfaction, lack of work ethic, and a union mentality were also cited as possible root causes.
o Parent training and support for families--There are limited opportunities for parent training and support. Those that are offered, including financial workshops and academic planning, are poorly attended. There is definitely room for improvement here.
o Degree of meaningful parent involvement and amount/frequency of communication with parents--The school encourages parents to stay connected to their child’s academic progress through Edline. Letters, phone calls, emails, and

web-based communication are all in place, with varying degrees of participation from both home and school. There are active booster groups for band and athletics, and the school recognizes the need to expand this interest into the academic realm. There is a group of parents who began meeting out of concern with mathematics at the school; this group is becoming more involved in the overall improvement process at the superintendent’s invitation. Meetings for parents run by the parents are planned for the coming months with the purpose of encouraging increase involvement in the school improvement process.
A description of the conclusions reached after examining the culture, conditions and practices-- Learning that your school is one of the lowest-performing schools in the state is depressing and demoralizing. People tend to go through denial and blame before the real work of turning around the school can begin. As the faculty worked through this needs assessment, they have begun to realize that there is much work to be done to transform their school into a progressive, successful place centered on student needs. The newly formed leadership team is working hard to harness the positive energy of their colleagues and diminish the negative voices. The faculty has recognized the need for consistency in every area and they are ready to begin the hard work of changing the school culture and practices. There is a strong need for more focused, embedded, and sustained professional development based on the specific needs of this school, as opposed to the one-time, “one-size-fits-all” approach that has dominated in recent years. This professional development must begin with the school culture. The report from the State System of Support visit will hopefully help the school identify where to begin.
Root CausesAfter the data has been examined and analyzed each school is required to determine the root causes for the results of the needs assessment. The root causes are identified for the following areas:The document, Data Analysis and Determination of Root Causes has been attached to this document.
Administrators and teachers—Administrators and teachers have been working in isolation—responsible for their content. In spite of 90 minutes of planning time per teacher daily, there is no time designated for collaborative planning. Richwood High School still uses the old model of “classroom” teacher, rather than “school” teacher. The Administrators are distracted by discipline problems, reporting demands and are not adequately engaged as instructional leaders. The five-year plan has not been utilized as a planning tool.
Curriculum and materials—Students are in class for 90-minute blocks of time. There is little evidence of project-based learning, research-based strategies that promote student engagement, or promotion of critical thinking. Richwood High School has had recent state and national successes with its sports teams and its marching band. Successes in those two areas do not happen unless student athletes and musicians work hard and master high-level skill sets. This success has not been mirrored in the academic arena. Students are falling farther behind in all academic areas; achievement has declined to a critical level. The school’s failure to make AYP due to participation rate for the past two years may have distracted attention from the dire academic situation, but the data presented here paints a painfully clear picture.
Master schedule, classroom schedules and classroom management/discipline—Student engagement or lack of engagement is directly impacted by each of these areas and can cause success or problems in each. Students and teachers are on “opposing” teams often at the school and this root cause has had serious consequences.
Students and parents-- The tired excuses that these kids can’t do the work or they have no family support have little validity since the same students have mastered difficult sports and musical skill sets. The family support has been strong also for those areas. Highly successful schools have recognized that academically rigorous curricula must incorporate real-world relevance. The current proficiency rates in reading and math indicate that neither academic rigor nor real world relevance are occurring. Further support of this conclusion comes from comparing the two years of available data from WESTEST II—all subgroups performed at a lower proficiency level than the same sub group had performed in the previous year.
Transformation Model
1. How will the LEA select a new leader for the school, and what experience, training, and skills will the new leader be expected to possess? The current principal was officially

hired as the school principal at the beginning of the 2009-2010 school year and will not be replaced.
2. How will the LEA enable the new leader to make strategic staff replacements? The LEA will support Improvement Plans for staff in need of improvement. The LEA has also been working with the school administration in making strategic course assignment adjustments. (For example, a retired business teacher will work on a part-time basis to assist students committed to a business track for graduation in order to free up a position for an additional science teacher.)
3. What is the LEA’s own capacity to support the transformation, including the implementation of required, recommended, and diagnostically determined strategies? The LEA has an experienced School Improvement Coordinator already employed who has worked successfully with another Improvement School. In addition, the Superintendent and the Title I Director are experienced in this area. The County Leadership Team is committed to the success of this model and will seek technical assistance from both the WVDE and external resources.
4. What changes in decision-making policies and mechanisms (including greater school-level flexibility in budgeting, staffing, and scheduling) must accompany the transformation? The school leadership team is looking carefully at how to utilize the current block schedule more efficiently. Richwood High School, on a traditional schedule, had tremendous academic success. Team members will be collecting data to determine if that success has been diminished by that schedule change. The task of modifying the block schedule, however, does not appear to be the most critical need and will be carefully assessed in year one of this proposal.School-level flexibility in budgeting and staffing must be constrained by WV Personnel and Fiscal code. The school’s Faculty Senate, LSIC team, and the Leadership Team will, however, work to implement new policy or change old policy that are currently barriers to strategic, engaging instruction.
5. What changes in operational practice must accompany the transformation, and how will these changes be brought about and sustained? As the faculty worked through data sets, it discovered areas of great need. In order to transform Richwood High School into a progressive, successful place centered on student needs, the faculty, the school leadership team, and the LEA leadership team agree that school culture and climate must change. Professional Development in these areas will be the starting point of this transformation and will continue through out the three years of the proposal. The faculty has recognized the need for consistency in every area and they are ready to begin the hard work of changing the school culture and practices. Professional Development will be focused and embedded. As the staff “grows” in this process, improved academics, dropout rates, discipline, attendance, and other indicators will provide the impetus required to reverse the current poor climate. Operational practices such as master schedules, extended learning time, and professional development requirements will be student centered.

Preliminary Budget Form
District Name: Nicholas County
School Name by TierIntervention Models: Select the model that will be implemented in each Tier I and Tier II school.Turnaround Restart Closure Transformation
Tier I School:
Tier II Schools: Richwood High School X
Tier III Schools:Not applicable to Tier III schools.
Transformation Model Pre-Implemen-
tationYear 1 Year 2 Year 3 Total
A. Develop teacher and school leader effectivenessReplace the principalUse rigorous, transparent and equitable evaluation systems that take into account data on student growth
$5,000 $7,000 $8,000 $20,000
Identify and reward school leaders, teachers and other staff who have increased student achievement and the graduation rate
$45,000 $60,000 $60,000 $175,000
Provide high quality, job-embedded professional development
$5,000 $70,000 $70,000 $70,000 $286,000
Implement strategies to recruit, place and retain staff
$10,000 $5,000 $5,000 $20,000
Other permissible activities as defined in the regulations (specify activities)Subtotal: $5,000 $165,00
0$140,000
$140,000
$445,000
B. Comprehensive instructional reform programsUse data to identify and implement an instructional program that is research-based and vertically aligned from one grade to the next as well as aligned with State academic standards
$35,000 $25,000 $25,000 $85,000
Promote the continuous use of student data to inform and differentiate instruction
$5,000 $5,000 $5,000 $15,000

Other permissible activities as defined in the regulations (specify activities)Subtotal: $40,000 $30,000 $30,000 $100,000C. Increasing learning time and creating community-oriented schoolsEstablish schedules and strategies that provide increased learning time as defined by ED and create community-oriented schools
$5,000 $100,000
$90,000 $90,000 $270,000
Provide ongoing mechanisms for family and community engagement
$6,000 $7,000 $7,500
Other permissible activities as defined in the regulations (specify activities)Subtotal:D. Provide operating flexibility and sustained supportGive schools operating flexibility to implement fully a comprehensive approachEnsure that the school receives ongoing, intensive technical assistance and related support from the LEA and/or the SEA
$90,000 $95,000 $97,000
Provide intensive technical assistance and related support from a designated external lead partnership organization
$25,000 $100,000
$100,000
Other permissible activities as defined in the regulations (specify activities)Subtotal: $5,000 $225,00
0$292,500
$294,500
$817,000
Total for Transformation Model: $10,000 $445,000
$462,500
$464,500
$1,322,000
Budget Clarification:o Year One: There was an increase in the amount budgeted for teacher evaluation because it was
assumed that in years two and three that the required participants would have been trained and the follow-up provided in years two and three would be less expensive.
o External Partner: The External Partners had not been selected and the budgeted amounts were low. Corrections have been made in the finalized grant which is part of the application.
o Identify and reward school leaders: The amount for year one was less than years two and three because it was projected that fewer teachers would be rewarded in year one since the proposal components would be new. Corrections have been made in the finalized grant proposal.