Embed Size (px)
Citation preview
Leveled Literacy Intervention September 2017 Page 1
What Works Clearinghouse™ U.S. DEPARTMENT OF EDUCATION
WWC Intervention ReportA summary of findings from a systematic review of the evidence
Beginning Reading September 2017
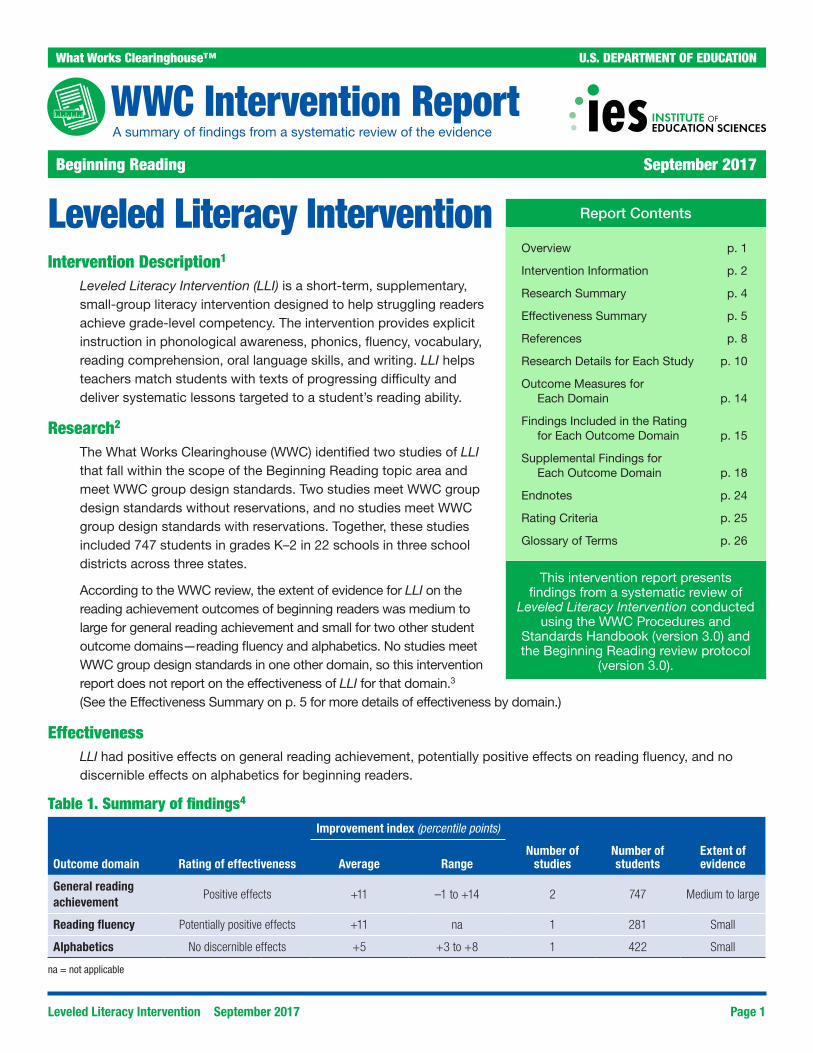
Leveled Literacy InterventionIntervention Description1
Leveled Literacy Intervention (LLI) is a short-term, supplementary, small-group literacy intervention designed to help struggling readers achieve grade-level competency. The intervention provides explicit instruction in phonological awareness, phonics, fluency, vocabulary, reading comprehension, oral language skills, and writing. LLI helps teachers match students with texts of progressing difficulty and deliver systematic lessons targeted to a student’s reading ability.
Research2 The What Works Clearinghouse (WWC) identified two studies of LLI that fall within the scope of the Beginning Reading topic area and meet WWC group design standards. Two studies meet WWC group design standards without reservations, and no studies meet WWC group design standards with reservations. Together, these studies included 747 students in grades K–2 in 22 schools in three school districts across three states.
According to the WWC review, the extent of evidence for LLI on the reading achievement outcomes of beginning readers was medium to large for general reading achievement and small for two other student outcome domains—reading fluency and alphabetics. No studies meet WWC group design standards in one other domain, so this intervention report does not report on the effectiveness of LLI for that domain.3 (See the Effectiveness Summary on p. 5 for more details of effectiveness by domain.)
EffectivenessLLI had positive effects on general reading achievement, potentially positive effects on reading fluency, and no discernible effects on alphabetics for beginning readers.
Table 1. Summary of findings4
Improvement index (percentile points)
Outcome domain Rating of effectiveness Average RangeNumber of
studiesNumber of students
Extent ofevidence
General reading achievement
Positive effects +11 –1 to +14 2 747 Medium to large
Reading fluency Potentially positive effects +11 na 1 281 Small
Alphabetics No discernible effects +5 +3 to +8 1 422 Small
na = not applicable
Report Contents
Overview p. 1
Intervention Information p. 2
Research Summary p. 4
Effectiveness Summary p. 5
References p. 8
Research Details for Each Study p. 10
Outcome Measures for Each Domain p. 14
Findings Included in the Rating for Each Outcome Domain p. 15
Supplemental Findings for Each Outcome Domain p. 18
Endnotes p. 24
Rating Criteria p. 25
Glossary of Terms p. 26
This intervention report presents findings from a systematic review of
Leveled Literacy Intervention conducted using the WWC Procedures and
Standards Handbook (version 3.0) and the Beginning Reading review protocol
(version 3.0).
Leveled Literacy Intervention September 2017 Page 2
Intervention Information
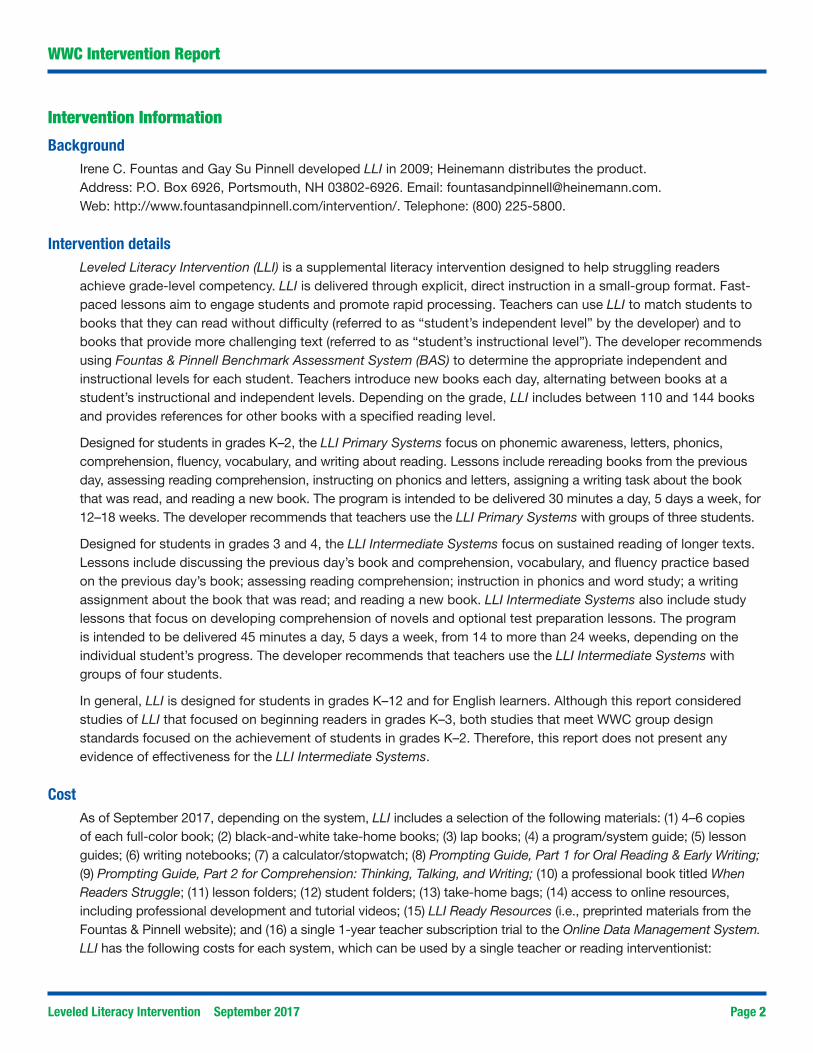
BackgroundIrene C. Fountas and Gay Su Pinnell developed LLI in 2009; Heinemann distributes the product. Address: P.O. Box 6926, Portsmouth, NH 03802-6926. Email: [email protected]. Web: http://www.fountasandpinnell.com/intervention/. Telephone: (800) 225-5800.
Intervention details
2
WWC Intervention Report
Leveled Literacy Intervention (LLI) is a supplemental literacy intervention designed to help struggling readers achieve grade-level competency. LLI is delivered through explicit, direct instruction in a small-group format. Fast-paced lessons aim to engage students and promote rapid processing. Teachers can use LLI to match students to books that they can read without difficulty (referred to as “student’s independent level” by the developer) and to books that provide more challenging text (referred to as “student’s instructional level”). The developer recommends using Fountas & Pinnell Benchmark Assessment System (BAS) to determine the appropriate independent and instructional levels for each student. Teachers introduce new books each day, alternating between books at a student’s instructional and independent levels. Depending on the grade, LLI includes between 110 and 144 books and provides references for other books with a specified reading level.
Designed for students in grades K–2, the LLI Primary Systems focus on phonemic awareness, letters, phonics, comprehension, fluency, vocabulary, and writing about reading. Lessons include rereading books from the previous day, assessing reading comprehension, instructing on phonics and letters, assigning a writing task about the book that was read, and reading a new book. The program is intended to be delivered 30 minutes a day, 5 days a week, for 12–18 weeks. The developer recommends that teachers use the LLI Primary Systems with groups of three students.
Designed for students in grades 3 and 4, the LLI Intermediate Systems focus on sustained reading of longer texts. Lessons include discussing the previous day’s book and comprehension, vocabulary, and fluency practice based on the previous day’s book; assessing reading comprehension; instruction in phonics and word study; a writing assignment about the book that was read; and reading a new book. LLI Intermediate Systems also include study lessons that focus on developing comprehension of novels and optional test preparation lessons. The program is intended to be delivered 45 minutes a day, 5 days a week, from 14 to more than 24 weeks, depending on the individual student’s progress. The developer recommends that teachers use the LLI Intermediate Systems with groups of four students.
In general, LLI is designed for students in grades K–12 and for English learners. Although this report considered studies of LLI that focused on beginning readers in grades K–3, both studies that meet WWC group design standards focused on the achievement of students in grades K–2. Therefore, this report does not present any evidence of effectiveness for the LLI Intermediate Systems.
CostAs of September 2017, depending on the system, LLI includes a selection of the following materials: (1) 4–6 copies of each full-color book; (2) black-and-white take-home books; (3) lap books; (4) a program/system guide; (5) lesson guides; (6) writing notebooks; (7) a calculator/stopwatch; (8) Prompting Guide, Part 1 for Oral Reading & Early Writing; (9) Prompting Guide, Part 2 for Comprehension: Thinking, Talking, and Writing; (10) a professional book titled WhenReaders Struggle; (11) lesson folders; (12) student folders; (13) take-home bags; (14) access to online resources,including professional development and tutorial videos; (15) LLI Ready Resources (i.e., preprinted materials from theFountas & Pinnell website); and (16) a single 1-year teacher subscription trial to the Online Data Management System.LLI has the following costs for each system, which can be used by a single teacher or reading interventionist:
Leveled Literacy Intervention September 2017 Page 3
WWC Intervention Report
• $2,900fortheLLI Orange System (Kindergarten, Levels A–E)
• $3,416fortheLLI Green System (Grade 1, Levels A–K)
• $3,324fortheLLI Blue System (Grade 2, Levels C–N)
• $4,950fortheLLI Red System (Grade 3, Levels L–Q)
Additional subscriptions to the Fountas & Pinnell Online Data Management Systemare$30perteacher,peryear,which includes unlimited access for school and district administrators. An annual subscription to the Fountas & Pinnell Leveled Books website, a list of more than 50,000 titles that have been leveled using the Fountas & Pinnell framework,costs$25andisavailableathttp://fountasandpinnellleveledbooks.com/.
Leveled Literacy Intervention September 2017 Page 4
Research Summary
WWC Intervention Report
The WWC identified 10 eligible studies that investigated the effects of LLI on the reading achievement of beginning readers. The WWC identified 13 additional studies that do not meet WWC eligibility criteria (see the Glossary of Terms in this document for a definition of this term and other commonly used research terms) for review in this topic area. Citations for all 23 studies are in the References section, which begins on p. 8.
The WWC reviewed 10 eligible studies against group design standards. Two studies are randomized controlled trials that meet WWC group design standards without reservations. This report summarizes those two studies. The remaining eight studies do not meet WWC group design standards.
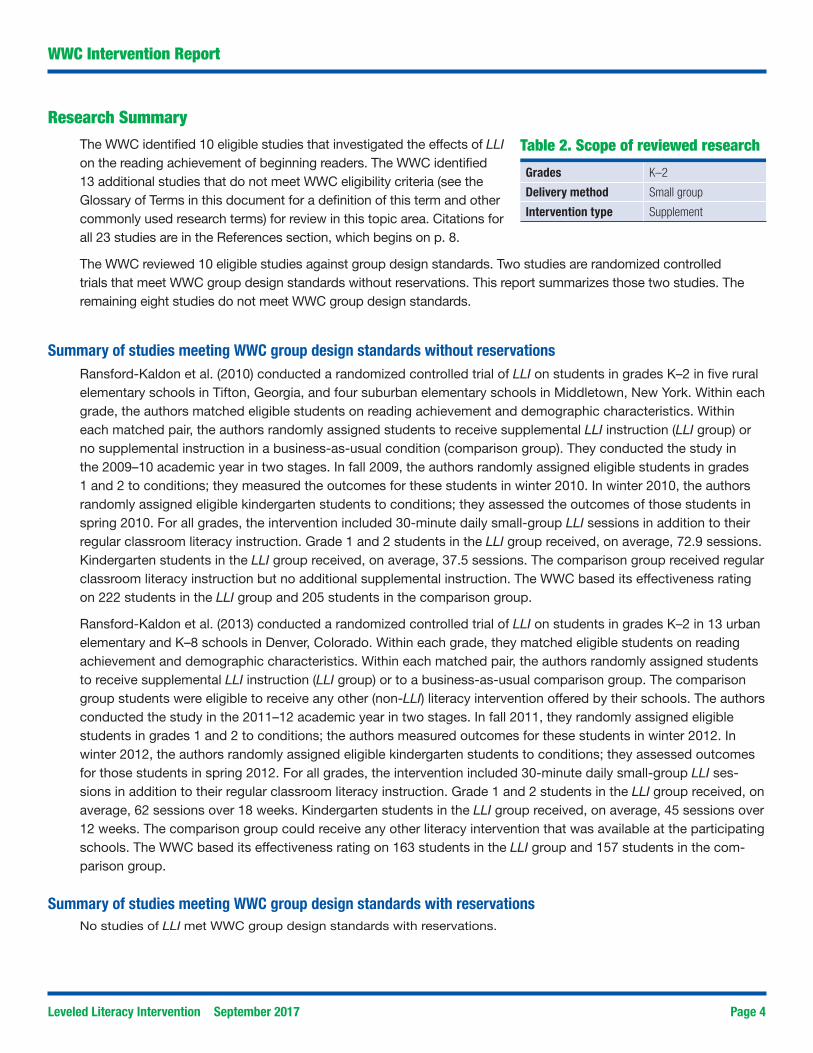
Table 2. Scope of reviewed research
Grades K–2
Delivery method Small group
Intervention type Supplement
Summary of studies meeting WWC group design standards without reservationsRansford-Kaldon et al. (2010) conducted a randomized controlled trial of LLI on students in grades K–2 in five rural elementary schools in Tifton, Georgia, and four suburban elementary schools in Middletown, New York. Within each grade, the authors matched eligible students on reading achievement and demographic characteristics. Within each matched pair, the authors randomly assigned students to receive supplemental LLI instruction (LLI group) or no supplemental instruction in a business-as-usual condition (comparison group). They conducted the study in the 2009–10 academic year in two stages. In fall 2009, the authors randomly assigned eligible students in grades 1 and 2 to conditions; they measured the outcomes for these students in winter 2010. In winter 2010, the authors randomly assigned eligible kindergarten students to conditions; they assessed the outcomes of those students in spring 2010. For all grades, the intervention included 30-minute daily small-group LLI sessions in addition to their regular classroom literacy instruction. Grade 1 and 2 students in the LLI group received, on average, 72.9 sessions. Kindergarten students in the LLI group received, on average, 37.5 sessions. The comparison group received regular classroom literacy instruction but no additional supplemental instruction. The WWC based its effectiveness rating on 222 students in the LLI group and 205 students in the comparison group.
Ransford-Kaldon et al. (2013) conducted a randomized controlled trial of LLI on students in grades K–2 in 13 urban elementary and K–8 schools in Denver, Colorado. Within each grade, they matched eligible students on reading achievement and demographic characteristics. Within each matched pair, the authors randomly assigned students to receive supplemental LLI instruction (LLI group) or to a business-as-usual comparison group. The comparison group students were eligible to receive any other (non-LLI) literacy intervention offered by their schools. The authors conducted the study in the 2011–12 academic year in two stages. In fall 2011, they randomly assigned eligible students in grades 1 and 2 to conditions; the authors measured outcomes for these students in winter 2012. In winter 2012, the authors randomly assigned eligible kindergarten students to conditions; they assessed outcomes for those students in spring 2012. For all grades, the intervention included 30-minute daily small-group LLI ses-sions in addition to their regular classroom literacy instruction. Grade 1 and 2 students in the LLI group received, on average, 62 sessions over 18 weeks. Kindergarten students in the LLI group received, on average, 45 sessions over 12 weeks. The comparison group could receive any other literacy intervention that was available at the participating schools. The WWC based its effectiveness rating on 163 students in the LLI group and 157 students in the com-parison group.
Summary of studies meeting WWC group design standards with reservationsNo studies of LLI met WWC group design standards with reservations.
Leveled Literacy Intervention September 2017 Page 5
Effectiveness Summary
WWC Intervention Report
The WWC review of LLI for the Beginning Reading topic area includes student outcomes in four domains: general reading achievement, reading fluency, alphabetics, and comprehension. The two studies of LLI that meet WWC group design standards reported findings in three of the four domains: general reading achievement, reading fluency, and alphabetics. The following findings present the authors’ estimates and WWC-calculated estimates of the size and statistical significance of the effects of LLI on beginning readers. Additional comparisons are available as supplemental findings in Appendix D. The supplemental findings do not factor into the intervention’s rating of effectiveness. For a more detailed description of the rating of effectiveness and extent of evidence criteria, see the WWC Rating Criteria on p. 25.
Summary of effectiveness for the general reading achievement domain
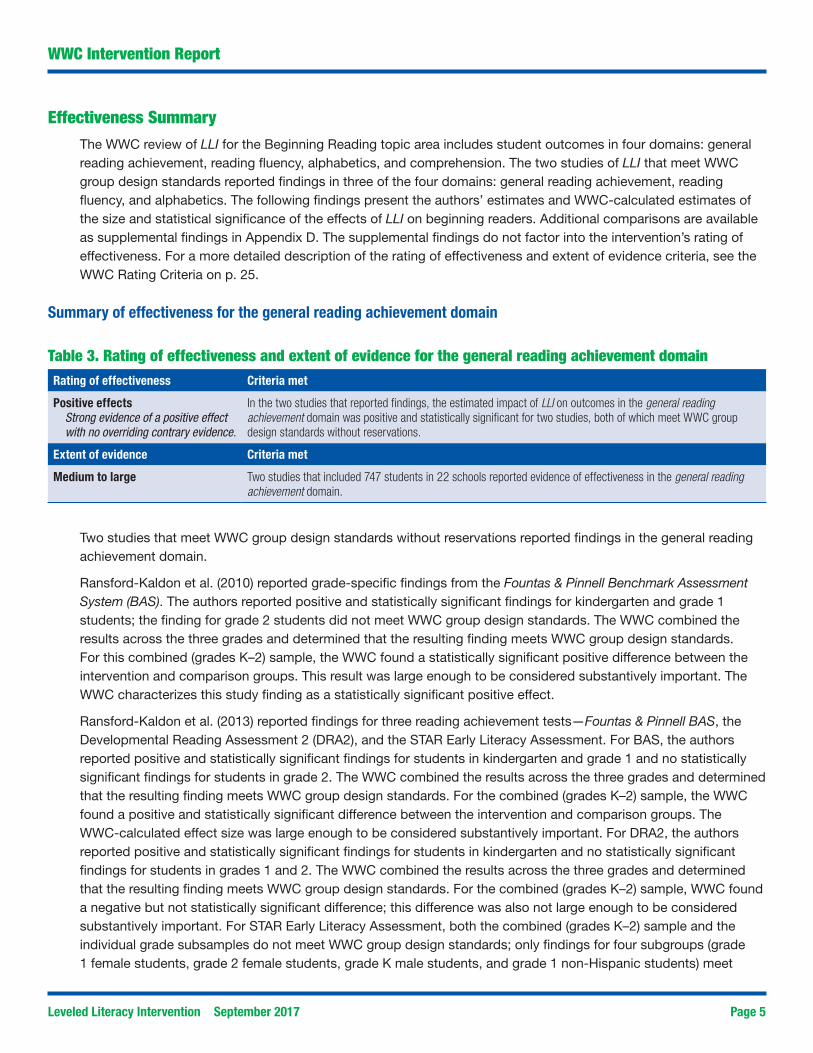
Table 3. Rating of effectiveness and extent of evidence for the general reading achievement domainRating of effectiveness Criteria met
Positive effectsStrong evidence of a positive effect with no overriding contrary evidence.
In the two studies that reported findings, the estimated impact of LLI on outcomes in the general reading achievement domain was positive and statistically significant for two studies, both of which meet WWC group design standards without reservations.
Extent of evidence Criteria met
Medium to large Two studies that included 747 students in 22 schools reported evidence of effectiveness in the general reading achievement domain.
Two studies that meet WWC group design standards without reservations reported findings in the general reading achievement domain.
Ransford-Kaldon et al. (2010) reported grade-specific findings from the Fountas & Pinnell Benchmark Assessment System (BAS). The authors reported positive and statistically significant findings for kindergarten and grade 1 students; the finding for grade 2 students did not meet WWC group design standards. The WWC combined the results across the three grades and determined that the resulting finding meets WWC group design standards. For this combined (grades K–2) sample, the WWC found a statistically significant positive difference between the intervention and comparison groups. This result was large enough to be considered substantively important. The WWC characterizes this study finding as a statistically significant positive effect.
Ransford-Kaldon et al. (2013) reported findings for three reading achievement tests—Fountas & Pinnell BAS, the Developmental Reading Assessment 2 (DRA2), and the STAR Early Literacy Assessment. For BAS, the authors reported positive and statistically significant findings for students in kindergarten and grade 1 and no statistically significant findings for students in grade 2. The WWC combined the results across the three grades and determined that the resulting finding meets WWC group design standards. For the combined (grades K–2) sample, the WWC found a positive and statistically significant difference between the intervention and comparison groups. The WWC-calculated effect size was large enough to be considered substantively important. For DRA2, the authors reported positive and statistically significant findings for students in kindergarten and no statistically significant findings for students in grades 1 and 2. The WWC combined the results across the three grades and determined that the resulting finding meets WWC group design standards. For the combined (grades K–2) sample, WWC found a negative but not statistically significant difference; this difference was also not large enough to be considered substantively important. For STAR Early Literacy Assessment, both the combined (grades K–2) sample and the individual grade subsamples do not meet WWC group design standards; only findings for four subgroups (grade 1 female students, grade 2 female students, grade K male students, and grade 1 non-Hispanic students) meet
Leveled Literacy Intervention September 2017 Page 6
WWC Intervention Report
WWC group design standards. The WWC combined two largest non-overlapping subgroups—grade 1 female students and grade 2 female students—that, together, meet WWC group design standards. For the combined (female students in grades 1 and 2) sample, the WWC found a positive but not statistically significant difference; this difference was large enough to be considered substantively important. The WWC characterizes these study findings as a statistically significant positive effect.
Thus, for the general reading achievement domain, two studies have a statistically significant positive effect. This results in a rating of positive effects, with a medium to large extent of evidence.
Summary of effectiveness for the reading fluency domain
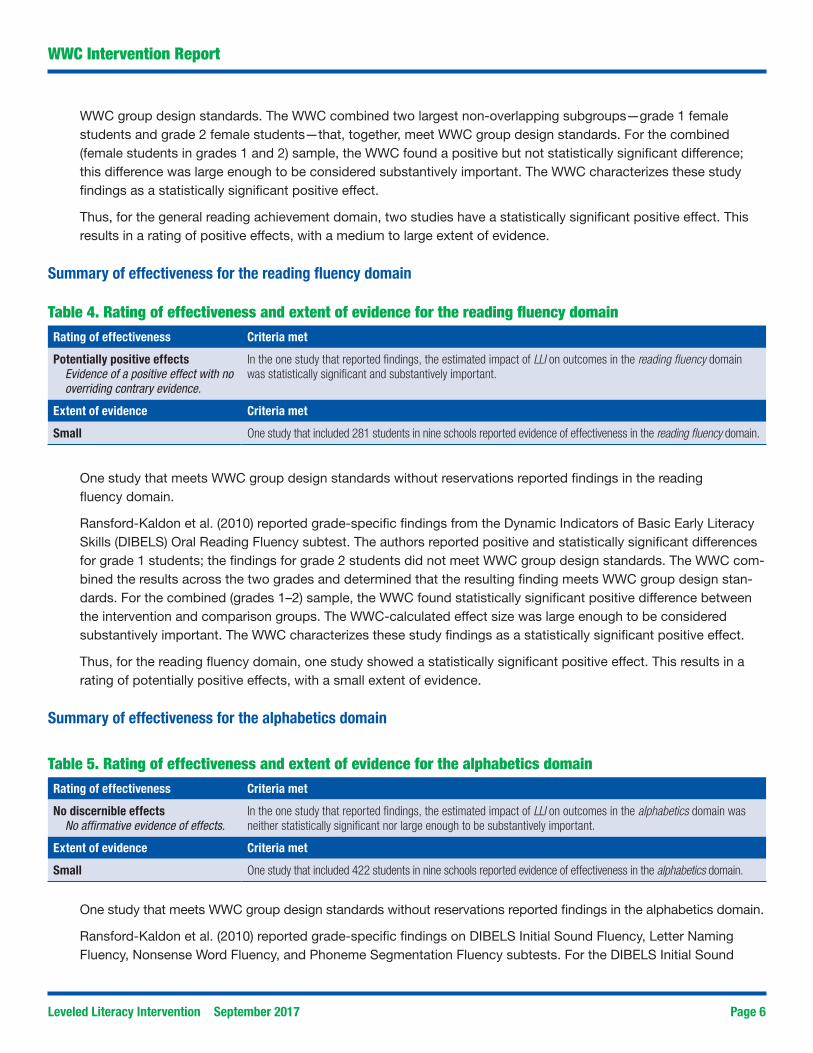
Table 4. Rating of effectiveness and extent of evidence for the reading fluency domainRating of effectiveness Criteria met
Potentially positive effectsEvidence of a positive effect with no overriding contrary evidence.
In the one study that reported findings, the estimated impact of LLI on outcomes in the reading fluency domain was statistically significant and substantively important.
Extent of evidence Criteria met
Small One study that included 281 students in nine schools reported evidence of effectiveness in the reading fluency domain.
One study that meets WWC group design standards without reservations reported findings in the reading fluency domain.
Ransford-Kaldon et al. (2010) reported grade-specific findings from the Dynamic Indicators of Basic Early Literacy Skills (DIBELS) Oral Reading Fluency subtest. The authors reported positive and statistically significant differences for grade 1 students; the findings for grade 2 students did not meet WWC group design standards. The WWC com-bined the results across the two grades and determined that the resulting finding meets WWC group design stan-dards. For the combined (grades 1–2) sample, the WWC found statistically significant positive difference between the intervention and comparison groups. The WWC-calculated effect size was large enough to be considered substantively important. The WWC characterizes these study findings as a statistically significant positive effect.
Thus, for the reading fluency domain, one study showed a statistically significant positive effect. This results in a rating of potentially positive effects, with a small extent of evidence.
Summary of effectiveness for the alphabetics domain
Table 5. Rating of effectiveness and extent of evidence for the alphabetics domainRating of effectiveness Criteria met
No discernible effectsNo affirmative evidence of effects.
In the one study that reported findings, the estimated impact of LLI on outcomes in the alphabetics domain was neither statistically significant nor large enough to be substantively important.
Extent of evidence Criteria met
Small One study that included 422 students in nine schools reported evidence of effectiveness in the alphabetics domain.
One study that meets WWC group design standards without reservations reported findings in the alphabetics domain.
Ransford-Kaldon et al. (2010) reported grade-specific findings on DIBELS Initial Sound Fluency, Letter Naming Fluency, Nonsense Word Fluency, and Phoneme Segmentation Fluency subtests. For the DIBELS Initial Sound
Leveled Literacy Intervention September 2017 Page 7
WWC Intervention Report
Fluency subtest, the authors reported, and the WWC confirmed, no statistically significant differences between kindergarten students in the intervention and comparison groups; the difference was also not large enough to be considered substantively important. For the DIBELS Letter Naming Fluency subtest, the authors reported no statistically significant difference between the intervention and comparison groups for kindergarten students but a positive and statistically significant difference for grade 1 students. The WWC combined the results across the two grades and determined that the resulting finding meets WWC group design standards. For the combined (grades K–1) sample, WWC found no statistically significant or substantively important difference between the intervention and comparison groups. For the DIBELS Nonsense Word Fluency subtest, the authors reported positive and statistically significant differences between the intervention and comparison group students in the kindergarten and grade 1 samples; the findings for grade 2 students did not meet WWC group design standards. The WWC combined the results across the three grades and determined that the resulting finding meets WWC group design standards. For the combined (grades K–2) sample, the WWC found no statistically significant or substantively important difference between the intervention and comparison groups. For the DIBELS Phoneme Segmentation Fluency subtest, the authors reported no statistically significant differences between the intervention and comparison groups for kindergarten and grade 1 students. The WWC combined the results across the two grades and determined that the resulting finding meets WWC group design standards. For the combined (grades K–1) sample, the WWC found no statistically significant or substantively important difference between the intervention and comparison groups. The WWC characterizes these study findings as an indeterminate effect.
Thus, for the alphabetics domain, one study found an indeterminate effect. This results in a rating of no discernible effects, with a small extent of evidence.
Leveled Literacy Intervention September 2017 Page 8
WWC Intervention Report
References
Studies that meet WWC group design standards without reservationsRansford-Kaldon, C., Flynt, E. S., Ross, C. L., Franceschini, L., Zoblotsky, T., Huang, Y., & Gallagher, B. (2010).
Implementation of effective intervention: An empirical study to evaluate the efficacy of Fountas & Pinnell’s Leveled Literacy Intervention system (LLI). Memphis, TN: Center for Research in Educational Policy, University of Memphis. Retrieved from https://eric.ed.gov/?&id=ED544374Additional source:Ransford-Kaldon, C., Flynt, E. S., & Ross, C. (2011). A randomized controlled trial of a response-to-intervention
(RTI) Tier 2 literacy program: Leveled Literacy Intervention (LLI). Washington, DC: Society for Research on Educational Effectiveness. Retrieved from https://eric.ed.gov/?&id=ED518772
Ransford-Kaldon, C., Ross, C., Lee, C., Sutton Flynt, E., Franceschini, L., & Zoblotsky, T. (2013). Efficacy of the Leveled Literacy Intervention System for K–2 urban students: An empirical evaluation of LLI in Denver Public Schools. Memphis, TN: Center for Research in Educational Policy, University of Memphis.
Studies that meet WWC group design standards with reservationsNone.
Studies that do not not meet WWC group design standardsBecker, J. A. (2015). A program evaluation of the Leveled Literacy Intervention program among third grade students
(Doctoral dissertation). Available from ProQuest Dissertations and Theses database. (UMI No. 3719143) The study does not meet WWC group design standards because equivalence of the analytic intervention and comparison groups is necessary and not demonstrated.
Burns, M. K., Maki, K. E., Karich, A. C., Hall, M., McComas, J. J., & Helman, L. (2016). Problem analysis at Tier 2: Using data to find the category of the problem. In S. R. Jimerson, et al. (Eds.), Handbook of response to intervention (pp. 293–307). New York, NY: Springer. The study does not meet WWC group design standards because equivalence of the analytic intervention and comparison groups is necessary and not demonstrated.
Burton-Archie, S. H. (2014). Reading intervention: The effectiveness of Leveled Literacy Intervention (Doctoral dissertation). Available from ProQuest Dissertations and Theses database. (UMI No. 3611522) The study does not meet WWC group design standards because equivalence of the analytic intervention and comparison groups is necessary and not demonstrated.
Gabriel, K. (2012). The effect of intervention programs through the response to intervention framework on first grade reading achievement (Doctoral dissertation). Available from ProQuest Dissertations and Theses database. (UMI No. 3545580) The study does not meet WWC group design standards because equivalence of the analytic intervention and comparison groups is necessary and not demonstrated.
Harvey, M. W. (2011). Union County public schools action research: Comparing early literacy interventions used in Union County public schools; Reading Recovery vs. Leveled Literacy Intervention (Doctoral dissertation). Retrieved from https://eric.ed.gov/?&id=ED522721 The study does not meet WWC group design standards because equivalence of the analytic intervention and comparison groups is necessary and not demonstrated.
Miller, H. T. (2014). Evaluating the effectiveness of first grade literacy interventions: Reading Recovery and Leveled Literacy Intervention (Doctoral dissertation). Available from ProQuest Dissertations and Theses database. (UMI No. 3690941) The study does not meet WWC group design standards because equivalence of the analytic intervention and comparison groups is necessary and not demonstrated.
Odell, K. (2012). The effect of Fountas & Pinnell’s Leveled Literacy Intervention on kindergarten students reading below grade level (Research paper, Northwest Missouri State University). Retrieved from http://www.nwmissouri.edu/ The study does not meet WWC group design standards because the measures of effectiveness cannot be attributed solely to the intervention.
Leveled Literacy Intervention September 2017 Page 9
WWC Intervention Report
Ward, E. (2011). Leveled Literacy Intervention: Research and data collection project 2009-2010. Portsmouth, NH: Heinemann. The study does not meet WWC group design standards because equivalence of the analytic intervention and comparison groups is necessary and not demonstrated.
Studies that are ineligible for review using the Beginning Reading Evidence Review ProtocolCampbell, K. (2015). Leveled Literacy Intervention: An elementary reading intervention for English language learner
newcomers. Cross-Cultural Approaches to Language and Literacy Development, 5, 118–138. The study is ineligible for review because it does not use an eligible design.
Corcoran, R. P., & Ross, S. M. (2015). An evaluation of the effectiveness of the Remediation Plus program on improving reading achievement of students in the Marinette (WI) school district. Baltimore, MD: Center for Research and Reform in Education, Johns Hopkins University. The study is ineligible for review because it is out of scope of the protocol.
Demers, L. (2012). Leveled Literacy Intervention: Research and data collection project 2010-2011. Portsmouth, NH: Heinemann. The study is ineligible for review because it does not use an eligible design.
Fountas & Pinnell Literacy. (n.d.). Leveled Literacy Intervention (LLI) data analysis: Reading gains for students enrolled in LLI pilot 2006-2008. Portsmouth, NH: Heinemann. The study is ineligible for review because it does not use an eligible design.
Hansen, C. (2014). The effects of self-graphing oral reading fluency in Tier 2 response-to-intervention (Doctoral dissertation). Available from ProQuest Dissertations and Theses database. (UMI No. 3685535) The study is ineligible for review because it is out of scope of the protocol.
Harrison, L., Peterman, R., Grehan, A., Ross, S., Dexter, E., & Inan, F. (2008, March). Evaluation of the Leveled Literacy Intervention: Year 1. Paper presented at the annual meeting of the American Educational Research Association, New York, NY. The study is ineligible for review because it does not use an eligible design.
Haupin, R. G. (2016). Improving receptive oral language skills of English language learners to enhance achievement in Reading Recovery®. Available from ProQuest Dissertations and Theses. (UMI No. 10116933) The study is ineligible for review because it does not use a sample aligned with the protocol.
Hof-Dunn, D. C. (2015). The effect of Leveled Literacy Intervention on first and second grade student literacy achievement (Doctoral dissertation). Available from ProQuest Dissertations and Theses database. (UMI No. 3712273) The study is ineligible for review because it does not use an eligible design.
Mertes, L. (2015). Leveled Literacy Intervention and supports for English language learners (Doctoral dissertation). Available from ProQuest Dissertations and Theses database. (UMI No. 3700653) The study is ineligible for review because it is out of scope of the protocol.
Metz, T. J. (2014). A case study: Effects of using Leveled Literacy Intervention on fourth and fifth grade students’ reading achievement (Doctoral dissertation). Available from ProQuest Dissertations and Theses database. (UMI No. 3581423) The study is ineligible for review because it does not use a sample aligned with the protocol.
Murray, M. S., Munger, K. A., & Hiebert, E. H. (2014). An analysis of two reading intervention programs: How do the words, texts, and programs compare? The Elementary School Journal, 114(4), 479–500. The study is ineligible for review because it does not use an eligible design.
Peterman, R., Grehan, A., Ross, S., Gallagher, B., & Dexter, E. (2009, April). An evaluation of the Leveled Literacy Intervention program: A small-group intervention for students in K-2. Paper presented at the annual meeting of the American Educational Research Association, San Diego, CA. The study is ineligible for review because it does not use an eligible design.
Zeng, S., Benner, G. J., & Silva, R. M. (2016). Effects of a summer learning program for students at risk for emotional and behavioral disorders. Education and Treatment of Children, 39(4), 593–615. The study is ineligible for review because it does not use a sample aligned with the protocol.
Leveled Literacy Intervention September 2017 Page 10
Appendix A.1: Research details for Ransford-Kaldon et al. (2010)
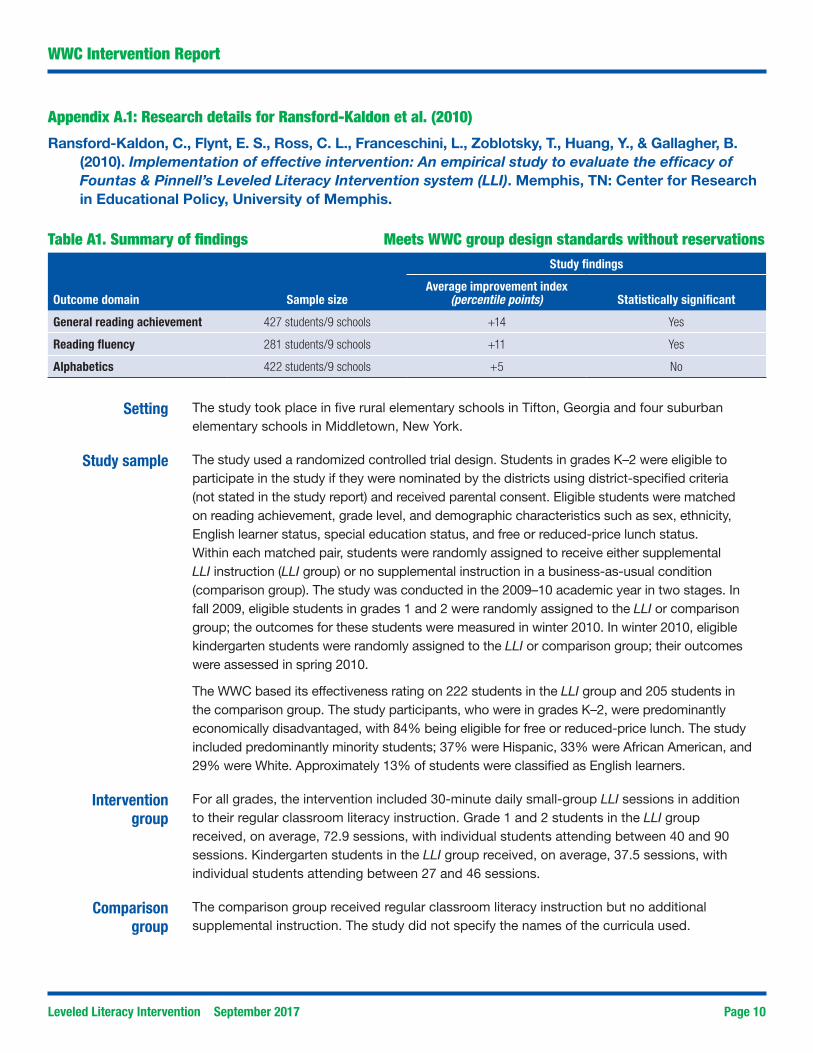
Ransford-Kaldon, C., Flynt, E. S., Ross, C. L., Franceschini, L., Zoblotsky, T., Huang, Y., & Gallagher, B. (2010). Implementation of effective intervention: An empirical study to evaluate the efficacy of Fountas & Pinnell’s Leveled Literacy Intervention system (LLI). Memphis, TN: Center for Research in Educational Policy, University of Memphis.
Table A1. Summary of findings Meets WWC group design standards without reservationsStudy findings
Outcome domain Sample sizeAverage improvement index
(percentile points) Statistically significant
General reading achievement 427 students/9 schools +14 Yes
Reading fluency 281 students/9 schools +11 Yes
Alphabetics 422 students/9 schools +5 No
Setting The study took place in five rural elementary schools in Tifton, Georgia and four suburban elementary schools in Middletown, New York.
Study sample The study used a randomized controlled trial design. Students in grades K–2 were eligible to participate in the study if they were nominated by the districts using district-specified criteria (not stated in the study report) and received parental consent. Eligible students were matched on reading achievement, grade level, and demographic characteristics such as sex, ethnicity, English learner status, special education status, and free or reduced-price lunch status. Within each matched pair, students were randomly assigned to receive either supplemental LLI instruction (LLI group) or no supplemental instruction in a business-as-usual condition (comparison group). The study was conducted in the 2009–10 academic year in two stages. In fall 2009, eligible students in grades 1 and 2 were randomly assigned to the LLI or comparison group; the outcomes for these students were measured in winter 2010. In winter 2010, eligible kindergarten students were randomly assigned to the LLI or comparison group; their outcomes were assessed in spring 2010.
The WWC based its effectiveness rating on 222 students in the LLI group and 205 students in the comparison group. The study participants, who were in grades K–2, were predominantly economically disadvantaged, with 84% being eligible for free or reduced-price lunch. The study included predominantly minority students; 37% were Hispanic, 33% were African American, and 29% were White. Approximately 13% of students were classified as English learners.
Intervention group
For all grades, the intervention included 30-minute daily small-group LLI sessions in addition to their regular classroom literacy instruction. Grade 1 and 2 students in the LLI group received, on average, 72.9 sessions, with individual students attending between 40 and 90 sessions. Kindergarten students in the LLI group received, on average, 37.5 sessions, with individual students attending between 27 and 46 sessions.
Comparison group
The comparison group received regular classroom literacy instruction but no additional supplemental instruction. The study did not specify the names of the curricula used.
WWC Intervention Report
Leveled Literacy Intervention September 2017 Page 11
WWC Intervention Report
Outcomes and measurement
Outcomes were measured using six tests: Dynamic Indicators of Basic Early Literacy Skills (DIBELS) Initial Sound Fluency (grade K), Letter Naming Fluency (grades K–1), Phoneme Segmentation Fluency (K–1), Nonsense Word Fluency (K–2), and Oral Reading Fluency (1–2) subtests and the Fountas & Pinnell Benchmark Assessment System (K–2). For a more detailed description of these outcome measures, see Appendix B.
The study presented findings for multiple subgroups, including separately by grade and grade by race/ethnicity combination. The subgroup findings that met the WWC group design standards are presented in Appendix D. These supplemental findings do not factor into the intervention’s rating of effectiveness.5
Support for implementation
Intervention teachers received 8 days of professional development using the LLI materials and instructional techniques, and training on the online data management system for LLI. The authors note that professional development support continued during the study period.
Leveled Literacy Intervention September 2017 Page 12
Appendix A.2: Research details for Ransford-Kaldon et al. (2013)
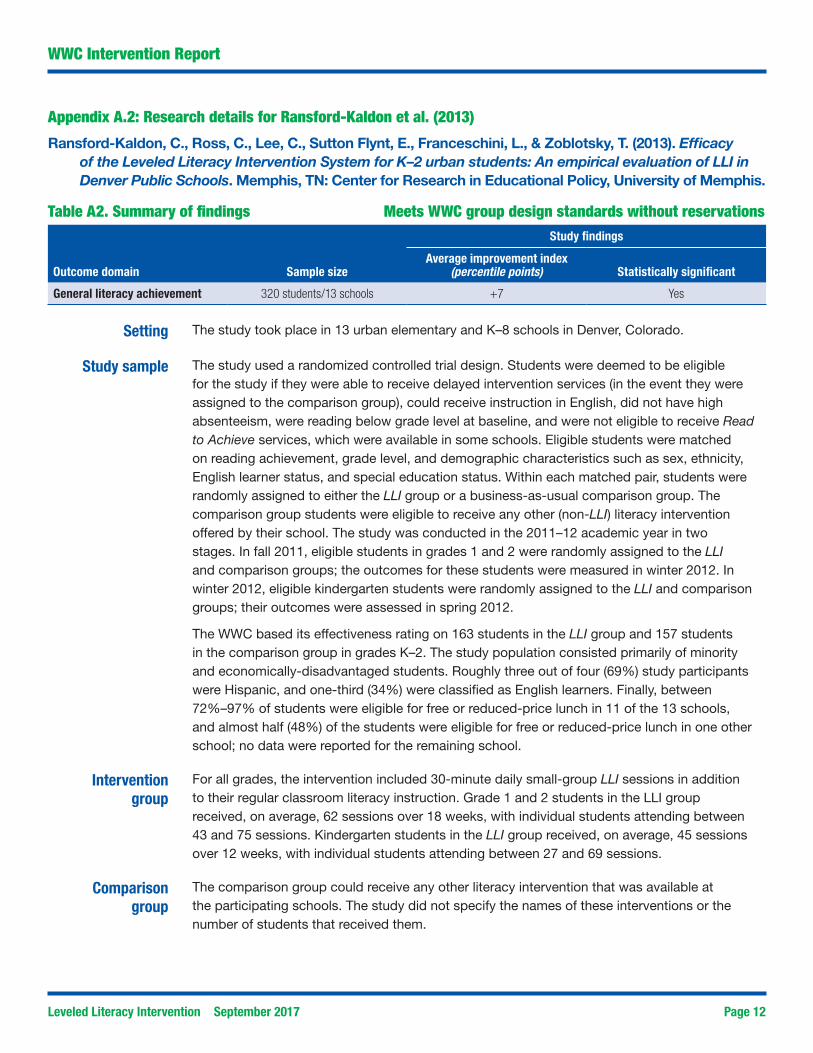
Ransford-Kaldon, C., Ross, C., Lee, C., Sutton Flynt, E., Franceschini, L., & Zoblotsky, T. (2013). Efficacy of the Leveled Literacy Intervention System for K–2 urban students: An empirical evaluation of LLI in Denver Public Schools. Memphis, TN: Center for Research in Educational Policy, University of Memphis.
Table A2. Summary of findings Meets WWC group design standards without reservationsStudy findings
Outcome domain Sample sizeAverage improvement index
(percentile points) Statistically significant
General literacy achievement 320 students/13 schools +7 Yes
Setting The study took place in 13 urban elementary and K–8 schools in Denver, Colorado.
Study sample The study used a randomized controlled trial design. Students were deemed to be eligible for the study if they were able to receive delayed intervention services (in the event they were assigned to the comparison group), could receive instruction in English, did not have high absenteeism, were reading below grade level at baseline, and were not eligible to receive Read to Achieve services, which were available in some schools. Eligible students were matched on reading achievement, grade level, and demographic characteristics such as sex, ethnicity, English learner status, and special education status. Within each matched pair, students were randomly assigned to either the LLI group or a business-as-usual comparison group. The comparison group students were eligible to receive any other (non-LLI) literacy intervention offered by their school. The study was conducted in the 2011–12 academic year in two stages. In fall 2011, eligible students in grades 1 and 2 were randomly assigned to the LLI and comparison groups; the outcomes for these students were measured in winter 2012. In winter 2012, eligible kindergarten students were randomly assigned to the LLI and comparison groups; their outcomes were assessed in spring 2012.
The WWC based its effectiveness rating on 163 students in the LLI group and 157 students in the comparison group in grades K–2. The study population consisted primarily of minority and economically-disadvantaged students. Roughly three out of four (69%) study participants were Hispanic, and one-third (34%) were classified as English learners. Finally, between 72%–97% of students were eligible for free or reduced-price lunch in 11 of the 13 schools, and almost half (48%) of the students were eligible for free or reduced-price lunch in one other school; no data were reported for the remaining school.
Intervention group
For all grades, the intervention included 30-minute daily small-group LLI sessions in addition to their regular classroom literacy instruction. Grade 1 and 2 students in the LLI group received, on average, 62 sessions over 18 weeks, with individual students attending between 43 and 75 sessions. Kindergarten students in the LLI group received, on average, 45 sessions over 12 weeks, with individual students attending between 27 and 69 sessions.
Comparison group
The comparison group could receive any other literacy intervention that was available at the participating schools. The study did not specify the names of these interventions or the number of students that received them.
WWC Intervention Report
Leveled Literacy Intervention September 2017 Page 13
WWC Intervention Report
Outcomes and measurement
Outcomes were measured using three tests in the general reading achievement domain: (1) Fountas & Pinnell Benchmark Assessment System 1, 2nd edition (2010), (2) the Developmental Reading Assessment 2 (DRA2), and (3) the STAR Early Literacy Assessment. For a more detailed description of these outcome measures, see Appendix B.
The study presented findings for multiple subgroups, including separately by grade and grade by various demographic subgroups (e.g., grade 1 male students or grade 1 Hispanic students). The subgroup findings that met the WWC group design standards are presented in Appendix D. These supplemental findings do not factor into the intervention’s rating of effectiveness.6
Support for implementation
Literacy teachers in the intervention group received 8 days of professional development, access to the LLI online data management system, course materials, and a detailed teaching guide. Additional professional development was provided throughout the implementation year, including training on how to improve reading comprehension using teacher-to-student and student-to-student interactions.
Leveled Literacy Intervention September 2017 Page 14
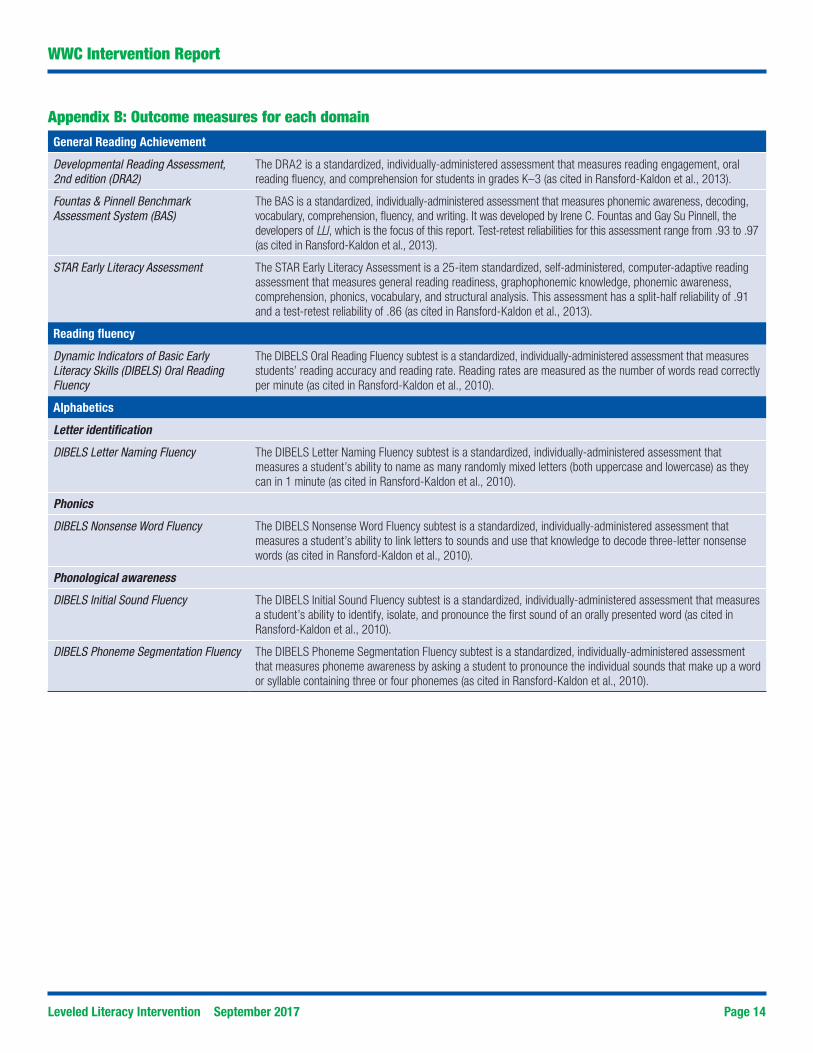
Appendix B: Outcome measures for each domainGeneral Reading Achievement
Developmental Reading Assessment, 2nd edition (DRA2)
The DRA2 is a standardized, individually-administered assessment that measures reading engagement, oral reading fluency, and comprehension for students in grades K–3 (as cited in Ransford-Kaldon et al., 2013).
Fountas & Pinnell Benchmark Assessment System (BAS)
The BAS is a standardized, individually-administered assessment that measures phonemic awareness, decoding, vocabulary, comprehension, fluency, and writing. It was developed by Irene C. Fountas and Gay Su Pinnell, the developers of LLI, which is the focus of this report. Test-retest reliabilities for this assessment range from .93 to .97 (as cited in Ransford-Kaldon et al., 2013).
STAR Early Literacy Assessment The STAR Early Literacy Assessment is a 25-item standardized, self-administered, computer-adaptive reading assessment that measures general reading readiness, graphophonemic knowledge, phonemic awareness, comprehension, phonics, vocabulary, and structural analysis. This assessment has a split-half reliability of .91 and a test-retest reliability of .86 (as cited in Ransford-Kaldon et al., 2013).
Reading fluency
Dynamic Indicators of Basic Early Literacy Skills (DIBELS) Oral Reading Fluency
The DIBELS Oral Reading Fluency subtest is a standardized, individually-administered assessment that measures students’ reading accuracy and reading rate. Reading rates are measured as the number of words read correctly per minute (as cited in Ransford-Kaldon et al., 2010).
Alphabetics
Letter identification
DIBELS Letter Naming Fluency The DIBELS Letter Naming Fluency subtest is a standardized, individually-administered assessment that measures a student’s ability to name as many randomly mixed letters (both uppercase and lowercase) as they can in 1 minute (as cited in Ransford-Kaldon et al., 2010).
Phonics
DIBELS Nonsense Word Fluency The DIBELS Nonsense Word Fluency subtest is a standardized, individually-administered assessment that measures a student’s ability to link letters to sounds and use that knowledge to decode three-letter nonsense words (as cited in Ransford-Kaldon et al., 2010).
Phonological awareness
DIBELS Initial Sound Fluency The DIBELS Initial Sound Fluency subtest is a standardized, individually-administered assessment that measures a student’s ability to identify, isolate, and pronounce the first sound of an orally presented word (as cited in Ransford-Kaldon et al., 2010).
DIBELS Phoneme Segmentation Fluency The DIBELS Phoneme Segmentation Fluency subtest is a standardized, individually-administered assessment that measures phoneme awareness by asking a student to pronounce the individual sounds that make up a word or syllable containing three or four phonemes (as cited in Ransford-Kaldon et al., 2010).
WWC Intervention Report
Leveled Literacy Intervention September 2017 Page 15
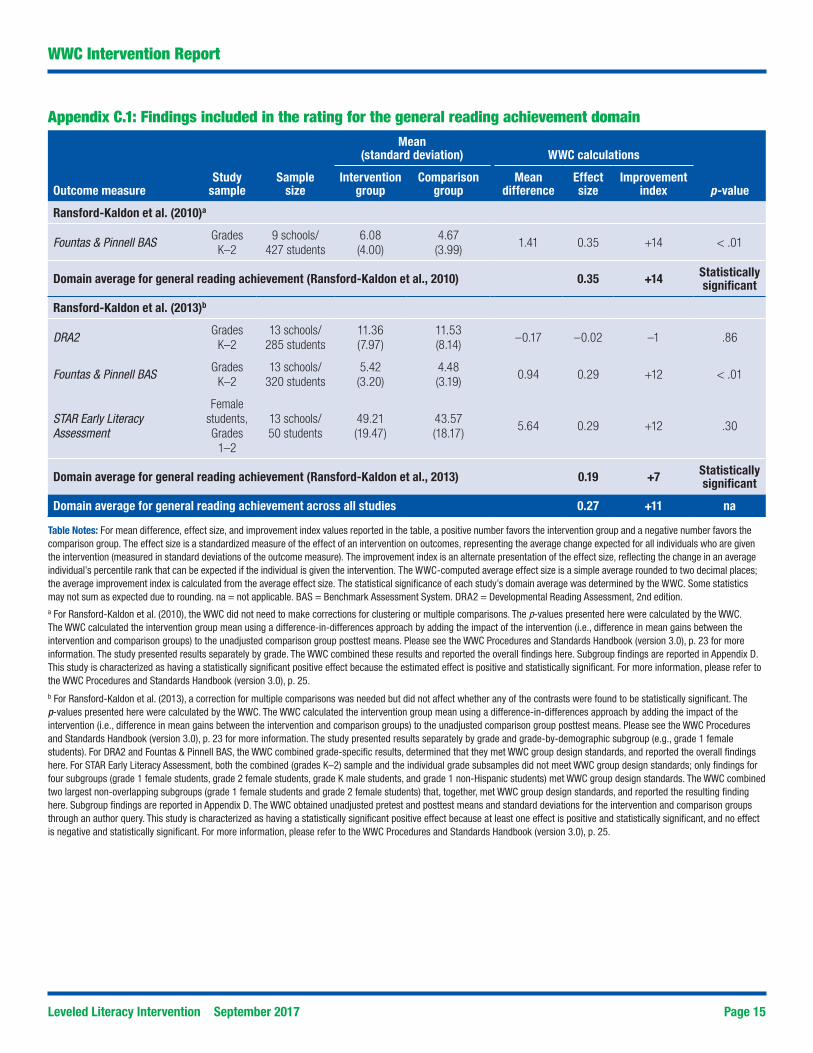
Appendix C.1: Findings included in the rating for the general reading achievement domain
Mean
(standard deviation) WWC calculations
Outcome measureStudy
sampleSample
sizeIntervention
groupComparison
groupMean
differenceEffect size
Improvement index p-value
Ransford-Kaldon et al. (2010)a
Fountas & Pinnell BAS Grades K–2
9 schools/427 students
6.08(4.00)
4.67(3.99)
1.41 0.35 +14 < .01
Domain average for general reading achievement (Ransford-Kaldon et al., 2010) 0.35 +14 Statistically significant
Ransford-Kaldon et al. (2013)b
DRA2 Grades K–2
13 schools/285 students
11.36(7.97)
11.53(8.14)
–0.17 –0.02 –1 .86
Fountas & Pinnell BAS Grades K–2
13 schools/320 students
5.42(3.20)
4.48(3.19)
0.94 0.29 +12 < .01
STAR Early LiteracyAssessment
Female students, Grades
1–2
13 schools/50 students
49.21(19.47)
43.57(18.17)
5.64 0.29 +12 .30
Domain average for general reading achievement (Ransford-Kaldon et al., 2013) 0.19 +7 Statistically significant
Domain average for general reading achievement across all studies 0.27 +11 na
WWC Intervention Report
Table Notes: For mean difference, effect size, and improvement index values reported in the table, a positive number favors the intervention group and a negative number favors the comparison group. The effect size is a standardized measure of the effect of an intervention on outcomes, representing the average change expected for all individuals who are given the intervention (measured in standard deviations of the outcome measure). The improvement index is an alternate presentation of the effect size, reflecting the change in an average individual’s percentile rank that can be expected if the individual is given the intervention. The WWC-computed average effect size is a simple average rounded to two decimal places; the average improvement index is calculated from the average effect size. The statistical significance of each study’s domain average was determined by the WWC. Some statistics may not sum as expected due to rounding. na = not applicable. BAS = Benchmark Assessment System. DRA2 = Developmental Reading Assessment, 2nd edition.a For Ransford-Kaldon et al. (2010), the WWC did not need to make corrections for clustering or multiple comparisons. The p-values presented here were calculated by the WWC. The WWC calculated the intervention group mean using a difference-in-differences approach by adding the impact of the intervention (i.e., difference in mean gains between the intervention and comparison groups) to the unadjusted comparison group posttest means. Please see the WWC Procedures and Standards Handbook (version 3.0), p. 23 for more information. The study presented results separately by grade. The WWC combined these results and reported the overall findings here. Subgroup findings are reported in Appendix D. This study is characterized as having a statistically significant positive effect because the estimated effect is positive and statistically significant. For more information, please refer to the WWC Procedures and Standards Handbook (version 3.0), p. 25.b For Ransford-Kaldon et al. (2013), a correction for multiple comparisons was needed but did not affect whether any of the contrasts were found to be statistically significant. The p-values presented here were calculated by the WWC. The WWC calculated the intervention group mean using a difference-in-differences approach by adding the impact of the intervention (i.e., difference in mean gains between the intervention and comparison groups) to the unadjusted comparison group posttest means. Please see the WWC Procedures and Standards Handbook (version 3.0), p. 23 for more information. The study presented results separately by grade and grade-by-demographic subgroup (e.g., grade 1 female students). For DRA2 and Fountas & Pinnell BAS, the WWC combined grade-specific results, determined that they met WWC group design standards, and reported the overall findings here. For STAR Early Literacy Assessment, both the combined (grades K–2) sample and the individual grade subsamples did not meet WWC group design standards; only findings for four subgroups (grade 1 female students, grade 2 female students, grade K male students, and grade 1 non-Hispanic students) met WWC group design standards. The WWC combined two largest non-overlapping subgroups (grade 1 female students and grade 2 female students) that, together, met WWC group design standards, and reported the resulting finding here. Subgroup findings are reported in Appendix D. The WWC obtained unadjusted pretest and posttest means and standard deviations for the intervention and comparison groups through an author query. This study is characterized as having a statistically significant positive effect because at least one effect is positive and statistically significant, and no effect is negative and statistically significant. For more information, please refer to the WWC Procedures and Standards Handbook (version 3.0), p. 25.
Leveled Literacy Intervention September 2017 Page 16
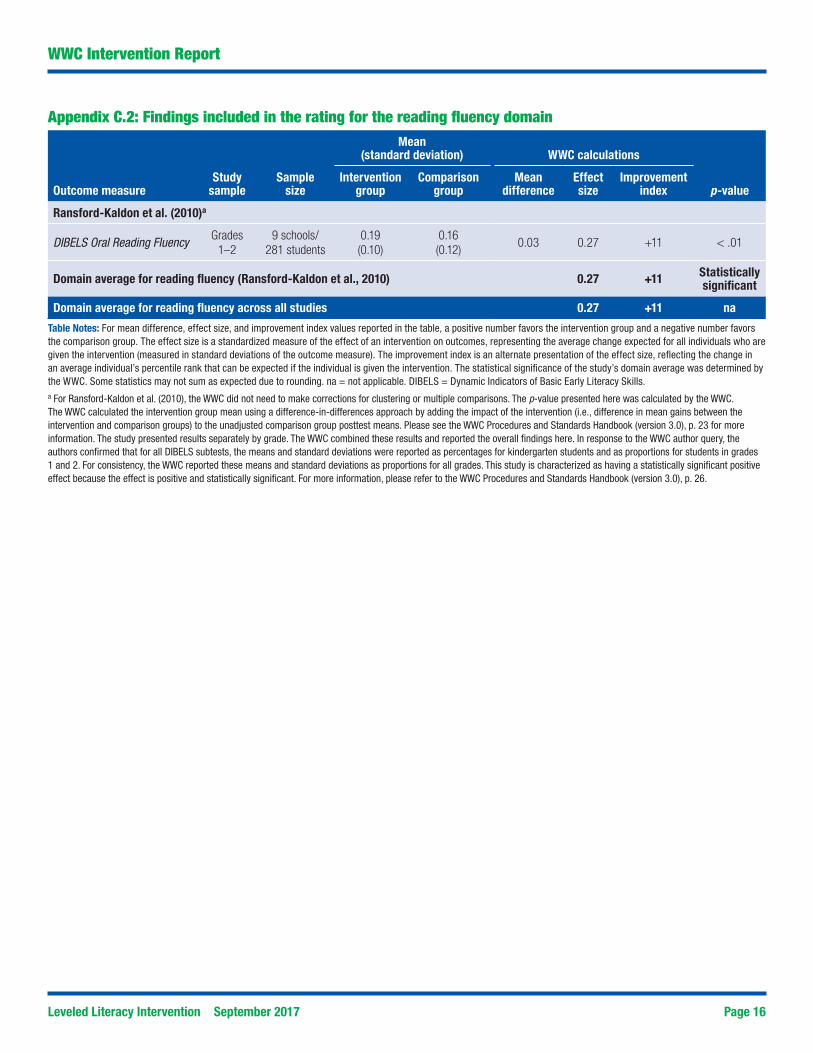
Appendix C.2: Findings included in the rating for the reading fluency domain
Mean
(standard deviation) WWC calculations
Outcome measureStudy
sampleSample
sizeIntervention
groupComparison
groupMean
differenceEffect size
Improvement index p-value
Ransford-Kaldon et al. (2010)a
DIBELS Oral Reading Fluency Grades 1–2
9 schools/281 students
0.19(0.10)
0.16(0.12)
0.03 0.27 +11 < .01
Domain average for reading fluency (Ransford-Kaldon et al., 2010) 0.27 +11 Statistically significant
Domain average for reading fluency across all studies 0.27 +11 na
WWC Intervention Report
Table Notes: For mean difference, effect size, and improvement index values reported in the table, a positive number favors the intervention group and a negative number favors the comparison group. The effect size is a standardized measure of the effect of an intervention on outcomes, representing the average change expected for all individuals who are given the intervention (measured in standard deviations of the outcome measure). The improvement index is an alternate presentation of the effect size, reflecting the change in an average individual’s percentile rank that can be expected if the individual is given the intervention. The statistical significance of the study’s domain average was determined by the WWC. Some statistics may not sum as expected due to rounding. na = not applicable. DIBELS = Dynamic Indicators of Basic Early Literacy Skills. a For Ransford-Kaldon et al. (2010), the WWC did not need to make corrections for clustering or multiple comparisons. The p-value presented here was calculated by the WWC. The WWC calculated the intervention group mean using a difference-in-differences approach by adding the impact of the intervention (i.e., difference in mean gains between the intervention and comparison groups) to the unadjusted comparison group posttest means. Please see the WWC Procedures and Standards Handbook (version 3.0), p. 23 for more information. The study presented results separately by grade. The WWC combined these results and reported the overall findings here. In response to the WWC author query, the authors confirmed that for all DIBELS subtests, the means and standard deviations were reported as percentages for kindergarten students and as proportions for students in grades 1 and 2. For consistency, the WWC reported these means and standard deviations as proportions for all grades. This study is characterized as having a statistically significant positive effect because the effect is positive and statistically significant. For more information, please refer to the WWC Procedures and Standards Handbook (version 3.0), p. 26.
Leveled Literacy Intervention September 2017 Page 17
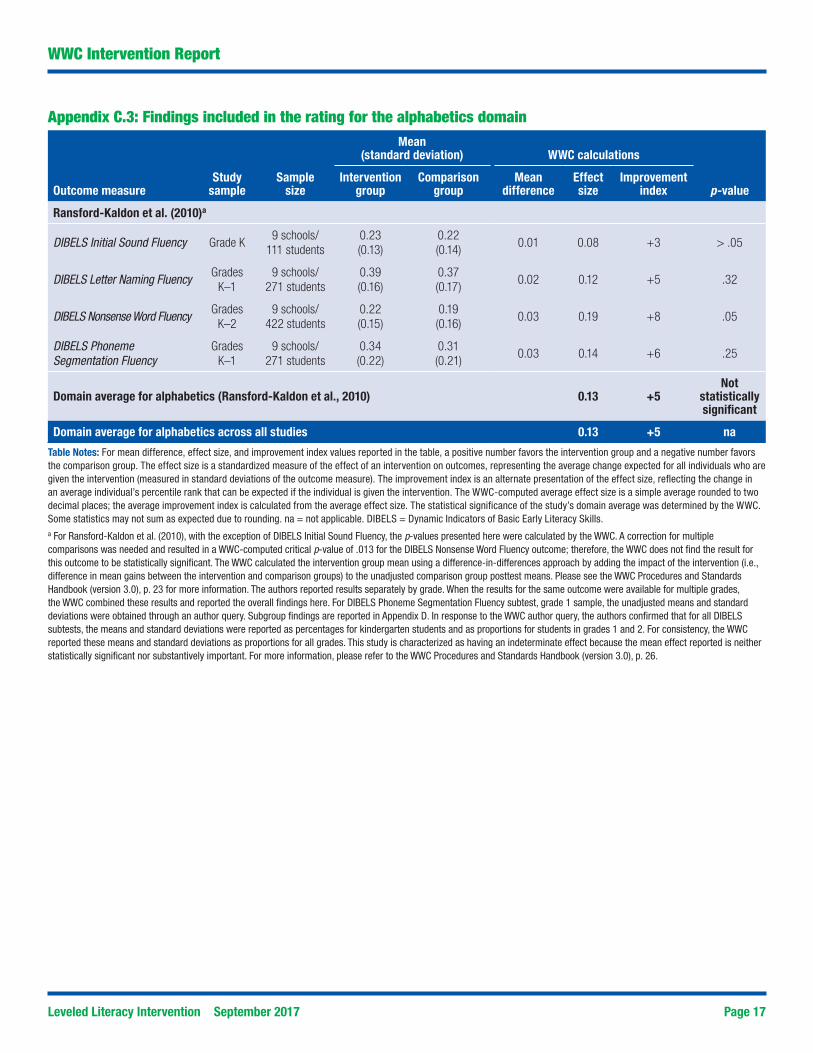
Appendix C.3: Findings included in the rating for the alphabetics domain
Mean
(standard deviation) WWC calculations
Outcome measureStudy
sampleSample
sizeIntervention
groupComparison
groupMean
differenceEffect size
Improvement index p-value
Ransford-Kaldon et al. (2010)a
DIBELS Initial Sound Fluency Grade K9 schools/
111 students0.23(0.13)
0.22(0.14)
0.01 0.08 +3 > .05
DIBELS Letter Naming Fluency Grades K–1
9 schools/271 students
0.39(0.16)
0.37(0.17)
0.02 0.12 +5 .32
DIBELS Nonsense Word Fluency Grades K–2
9 schools/422 students
0.22 (0.15)
0.19(0.16)
0.03 0.19 +8 .05
DIBELS Phoneme Segmentation Fluency
Grades K–1
9 schools/271 students
0.34(0.22)
0.31(0.21)
0.03 0.14 +6 .25
Domain average for alphabetics (Ransford-Kaldon et al., 2010) 0.13 +5Not
statistically significant
Domain average for alphabetics across all studies 0.13 +5 na
WWC Intervention Report
Table Notes: For mean difference, effect size, and improvement index values reported in the table, a positive number favors the intervention group and a negative number favors the comparison group. The effect size is a standardized measure of the effect of an intervention on outcomes, representing the average change expected for all individuals who are given the intervention (measured in standard deviations of the outcome measure). The improvement index is an alternate presentation of the effect size, reflecting the change in an average individual’s percentile rank that can be expected if the individual is given the intervention. The WWC-computed average effect size is a simple average rounded to two decimal places; the average improvement index is calculated from the average effect size. The statistical significance of the study’s domain average was determined by the WWC. Some statistics may not sum as expected due to rounding. na = not applicable. DIBELS = Dynamic Indicators of Basic Early Literacy Skills. a For Ransford-Kaldon et al. (2010), with the exception of DIBELS Initial Sound Fluency, the p-values presented here were calculated by the WWC. A correction for multiple comparisons was needed and resulted in a WWC-computed critical p-value of .013 for the DIBELS Nonsense Word Fluency outcome; therefore, the WWC does not find the result for this outcome to be statistically significant. The WWC calculated the intervention group mean using a difference-in-differences approach by adding the impact of the intervention (i.e., difference in mean gains between the intervention and comparison groups) to the unadjusted comparison group posttest means. Please see the WWC Procedures and Standards Handbook (version 3.0), p. 23 for more information. The authors reported results separately by grade. When the results for the same outcome were available for multiple grades, the WWC combined these results and reported the overall findings here. For DIBELS Phoneme Segmentation Fluency subtest, grade 1 sample, the unadjusted means and standard deviations were obtained through an author query. Subgroup findings are reported in Appendix D. In response to the WWC author query, the authors confirmed that for all DIBELS subtests, the means and standard deviations were reported as percentages for kindergarten students and as proportions for students in grades 1 and 2. For consistency, the WWC reported these means and standard deviations as proportions for all grades. This study is characterized as having an indeterminate effect because the mean effect reported is neither statistically significant nor substantively important. For more information, please refer to the WWC Procedures and Standards Handbook (version 3.0), p. 26.
Leveled Literacy Intervention September 2017 Page 18
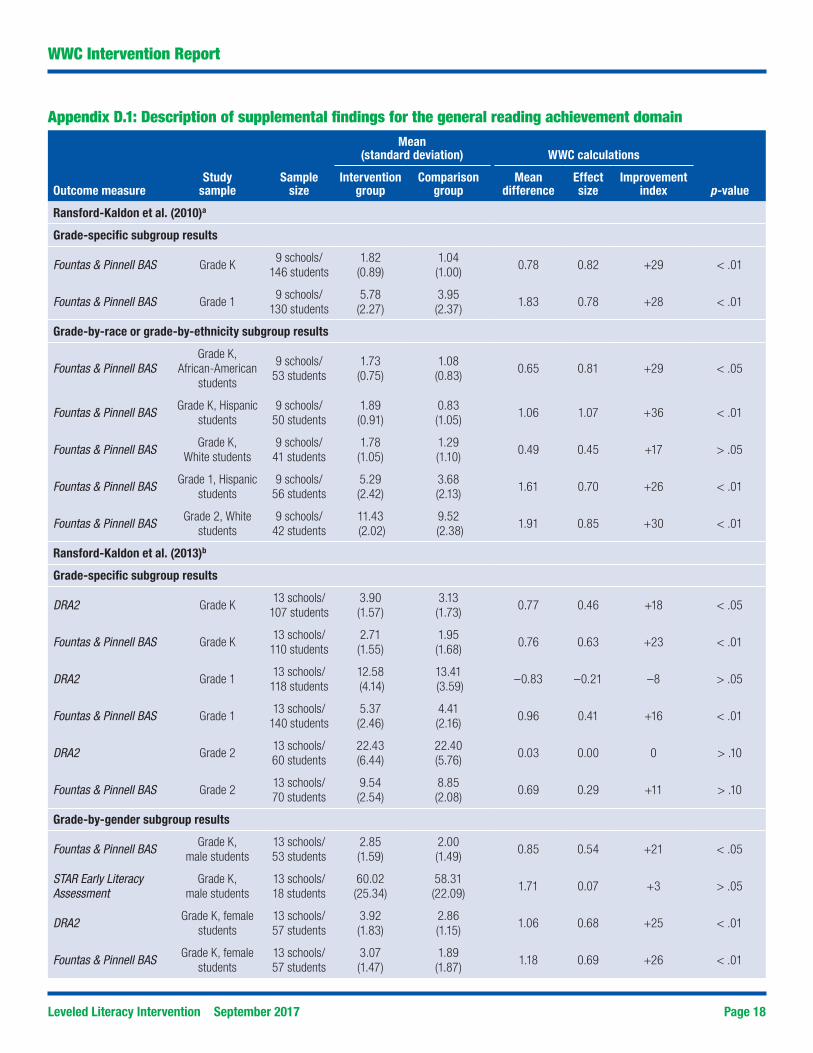
Appendix D.1: Description of supplemental findings for the general reading achievement domain
Mean(standard deviation) WWC calculations
Outcome measureStudy
sampleSample
sizeIntervention
groupComparison
groupMean
differenceEffect size
Improvement index p-value
Ransford-Kaldon et al. (2010)a
Grade-specific subgroup results
Fountas & Pinnell BAS Grade K9 schools/
146 students1.82
(0.89)1.04(1.00)
0.78 0.82 +29 < .01
Fountas & Pinnell BAS Grade 19 schools/
130 students5.78
(2.27)3.95(2.37)
1.83 0.78 +28 < .01
Grade-by-race or grade-by-ethnicity subgroup results
Fountas & Pinnell BASGrade K,
African-American students
9 schools/53 students
1.73(0.75)
1.08(0.83)
0.65 0.81 +29 < .05
Fountas & Pinnell BAS Grade K, Hispanic students
9 schools/50 students
1.89(0.91)
0.83(1.05)
1.06 1.07 +36 < .01
Fountas & Pinnell BAS Grade K,White students
9 schools/41 students
1.78(1.05)
1.29(1.10)
0.49 0.45 +17 > .05
Fountas & Pinnell BAS Grade 1, Hispanic students
9 schools/56 students
5.29(2.42)
3.68(2.13)
1.61 0.70 +26 < .01
Fountas & Pinnell BAS Grade 2, White students
9 schools/42 students
11.43 (2.02)
9.52 (2.38)
1.91 0.85 +30 < .01
Ransford-Kaldon et al. (2013)b
Grade-specific subgroup results
DRA2 Grade K13 schools/
107 students3.90(1.57)
3.13(1.73)
0.77 0.46 +18 < .05
Fountas & Pinnell BAS Grade K13 schools/
110 students2.71(1.55)
1.95(1.68)
0.76 0.63 +23 < .01
DRA2 Grade 113 schools/
118 students12.58 (4.14)
13.41 (3.59)
–0.83 –0.21 –8 > .05
Fountas & Pinnell BAS Grade 113 schools/
140 students5.37(2.46)
4.41(2.16)
0.96 0.41 +16 < .01
DRA2 Grade 213 schools/60 students
22.43(6.44)
22.40(5.76)
0.03 0.00 0 > .10
Fountas & Pinnell BAS Grade 213 schools/70 students
9.54(2.54)
8.85(2.08)
0.69 0.29 +11 > .10
Grade-by-gender subgroup results
Fountas & Pinnell BAS Grade K, male students
13 schools/53 students
2.85(1.59)
2.00(1.49)
0.85 0.54 +21 < .05
STAR Early Literacy Assessment
Grade K, male students
13 schools/18 students
60.02(25.34)
58.31(22.09)
1.71 0.07 +3 > .05
DRA2 Grade K, female students
13 schools/57 students
3.92(1.83)
2.86(1.15)
1.06 0.68 +25 < .01
Fountas & Pinnell BAS Grade K, female students
13 schools/57 students
3.07(1.47)
1.89(1.87)
1.18 0.69 +26 < .01
WWC Intervention Report
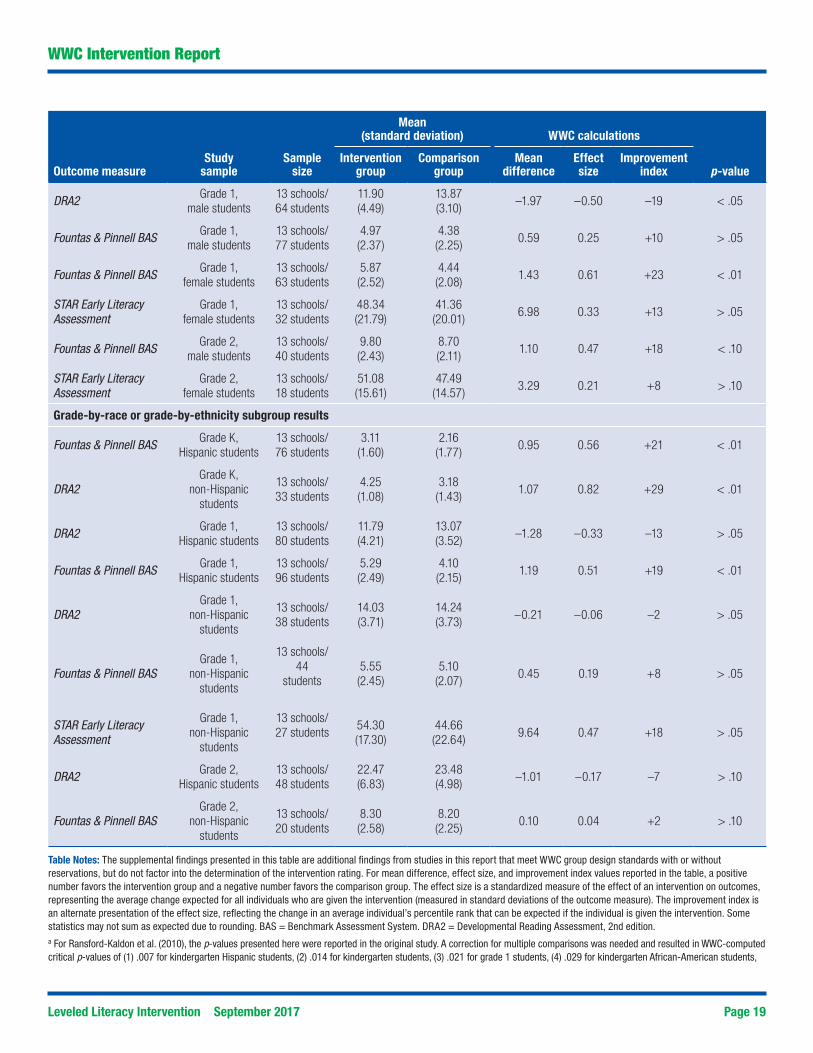
Leveled Literacy Intervention September 2017 Page 19
Mean
(standard deviation) WWC calculations
Outcome measureStudy
sampleSample
sizeIntervention
groupComparison
groupMean
differenceEffect size
Improvement index p-value
DRA2 Grade 1, male students
13 schools/64 students
11.90(4.49)
13.87(3.10)
–1.97 –0.50 –19 < .05
Fountas & Pinnell BAS Grade 1, male students
13 schools/77 students
4.97(2.37)
4.38(2.25)
0.59 0.25 +10 > .05
Fountas & Pinnell BAS Grade 1,female students
13 schools/63 students
5.87(2.52)
4.44(2.08)
1.43 0.61 +23 < .01
STAR Early Literacy Assessment
Grade 1,female students
13 schools/32 students
48.34(21.79)
41.36(20.01)
6.98 0.33 +13 > .05
Fountas & Pinnell BAS Grade 2,male students
13 schools/40 students
9.80(2.43)
8.70(2.11)
1.10 0.47 +18 < .10
STAR Early Literacy Assessment
Grade 2,female students
13 schools/18 students
51.08(15.61)
47.49(14.57)
3.29 0.21 +8 > .10
Grade-by-race or grade-by-ethnicity subgroup results
Fountas & Pinnell BAS Grade K,Hispanic students
13 schools/76 students
3.11(1.60)
2.16(1.77)
0.95 0.56 +21 < .01
DRA2Grade K,
non-Hispanic students
13 schools/33 students
4.25(1.08)
3.18(1.43)
1.07 0.82 +29 < .01
DRA2 Grade 1,Hispanic students
13 schools/80 students
11.79(4.21)
13.07(3.52)
–1.28 –0.33 –13 > .05
Fountas & Pinnell BAS Grade 1,Hispanic students
13 schools/96 students
5.29(2.49)
4.10(2.15)
1.19 0.51 +19 < .01
DRA2Grade 1,
non-Hispanic students
13 schools/38 students
14.03(3.71)
14.24(3.73)
–0.21 –0.06 –2 > .05
Fountas & Pinnell BASGrade 1,
non-Hispanic students
13 schools/44
students5.55(2.45)
5.10(2.07)
0.45 0.19 +8 > .05
STAR Early LiteracyAssessment
Grade 1,non-Hispanic
students
13 schools/27 students
54.30(17.30)
44.66(22.64)
9.64 0.47 +18 > .05
DRA2 Grade 2,Hispanic students
13 schools/48 students
22.47(6.83)
23.48(4.98)
–1.01 –0.17 –7 > .10
Fountas & Pinnell BASGrade 2,
non-Hispanic students
13 schools/20 students
8.30(2.58)
8.20(2.25)
0.10 0.04 +2 > .10
WWC Intervention Report
Table Notes: The supplemental findings presented in this table are additional findings from studies in this report that meet WWC group design standards with or without reservations, but do not factor into the determination of the intervention rating. For mean difference, effect size, and improvement index values reported in the table, a positive number favors the intervention group and a negative number favors the comparison group. The effect size is a standardized measure of the effect of an intervention on outcomes, representing the average change expected for all individuals who are given the intervention (measured in standard deviations of the outcome measure). The improvement index is an alternate presentation of the effect size, reflecting the change in an average individual’s percentile rank that can be expected if the individual is given the intervention. Some statistics may not sum as expected due to rounding. BAS = Benchmark Assessment System. DRA2 = Developmental Reading Assessment, 2nd edition. a For Ransford-Kaldon et al. (2010), the p-values presented here were reported in the original study. A correction for multiple comparisons was needed and resulted in WWC-computed critical p-values of (1) .007 for kindergarten Hispanic students, (2) .014 for kindergarten students, (3) .021 for grade 1 students, (4) .029 for kindergarten African-American students,
Leveled Literacy Intervention September 2017 Page 20
WWC Intervention Report
(5) .036 for grade 2 White students, (6) .043 for grade 1 Hispanic students, and (7) .05 for kindergarten White students. Since the exact author-calculated p-values were not known, the WWC applied the multiple comparison adjustment to the WWC-calculated p-values (not shown). This did not affect whether any of the contrasts were found to be statistically significant. The WWC calculated the intervention group mean using a difference-in-differences approach by adding the impact of the intervention (i.e., difference in mean gains between the intervention and comparison groups) to the unadjusted comparison group posttest means. Please see the WWC Procedures and Standards Handbook (version 3.0), p. 23 for more information.b For Ransford-Kaldon et al. (2013), the p-values presented here were reported in the original study and were based on gain scores analyses. A correction for multiple comparisons was needed and resulted in WWC-computed critical p-values of (1) .004 for Fountas & Pinnell BAS for grade K, female student sample; (2) .006 for DRA2 for grade K, female student sample; (3) .008 for BAS grade 1, Hispanic student sample; (4) .010 for BAS grade 1 sample; (5) .013 for BAS grade K, Hispanic student sample; (6) .015 for BAS grade 1, female student sample; (7) .017 for DRA2 grade K subsample; (8) .019 for DRA2 grade K, Hispanic student sample; and (9) .049 for DRA2 grade 1, male student sample. Since the exact author-calculated p-values were not known, the WWC applied the multiple comparison adjustment to the WWC-calculated p-values (not shown). As a result, the WWC found only the results on the BAS for kindergarten students to be statistically significant. The WWC calculated the intervention group mean using a difference-in-differences approach by adding the impact of the intervention (i.e., difference in mean gains between the intervention and comparison groups) to the unadjusted comparison group posttest means. Please see the WWC Procedures and Standards Handbook (version 3.0), p. 23 for more information. The WWC obtained unadjusted pretest and posttest means and standard deviations for the intervention and comparison groups through an author query.
Leveled Literacy Intervention September 2017 Page 21
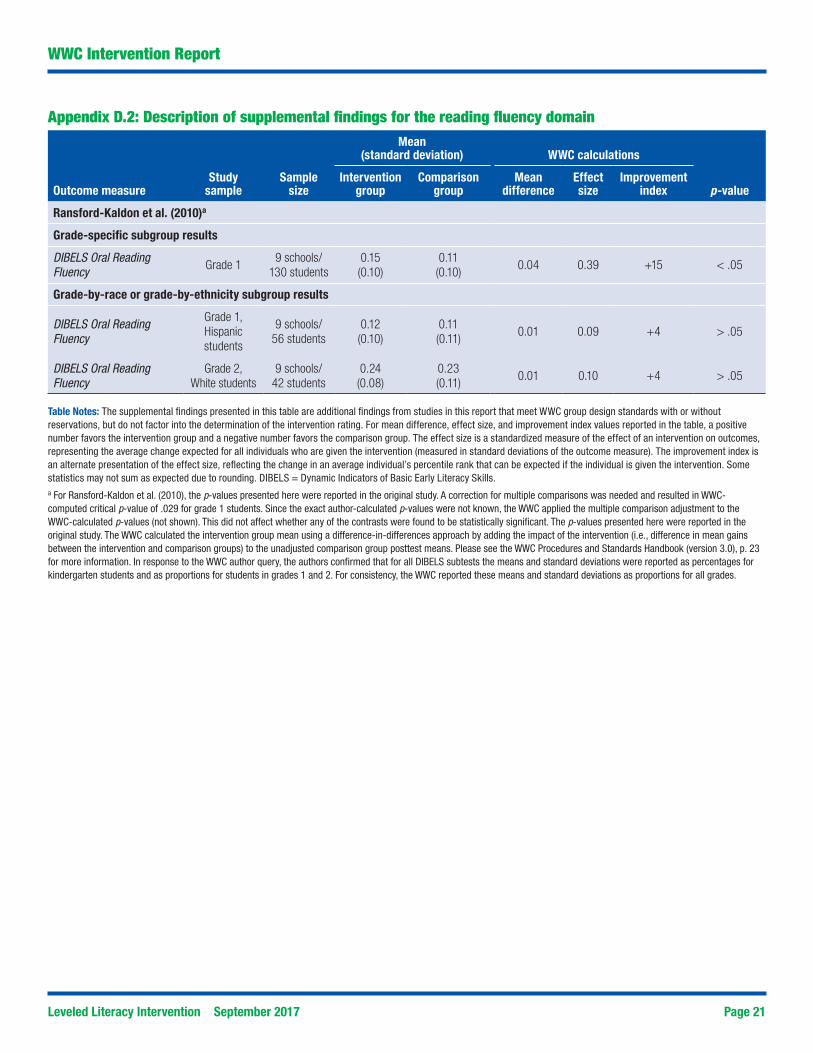
Appendix D.2: Description of supplemental findings for the reading fluency domain
Mean
(standard deviation) WWC calculations
Outcome measureStudy
sampleSample
sizeIntervention
groupComparison
groupMean
differenceEffect size
Improvement index p-value
Ransford-Kaldon et al. (2010)a
Grade-specific subgroup results
DIBELS Oral Reading Fluency Grade 1
9 schools/130 students
0.15(0.10)
0.11(0.10)
0.04 0.39 +15 < .05
Grade-by-race or grade-by-ethnicity subgroup results
DIBELS Oral Reading Fluency
Grade 1, Hispanic students
9 schools/56 students
0.12(0.10)
0.11(0.11)
0.01 0.09 +4 > .05
DIBELS Oral Reading Fluency
Grade 2, White students
9 schools/42 students
0.24(0.08)
0.23(0.11)
0.01 0.10 +4 > .05
WWC Intervention Report
Table Notes: The supplemental findings presented in this table are additional findings from studies in this report that meet WWC group design standards with or without reservations, but do not factor into the determination of the intervention rating. For mean difference, effect size, and improvement index values reported in the table, a positive number favors the intervention group and a negative number favors the comparison group. The effect size is a standardized measure of the effect of an intervention on outcomes, representing the average change expected for all individuals who are given the intervention (measured in standard deviations of the outcome measure). The improvement index is an alternate presentation of the effect size, reflecting the change in an average individual’s percentile rank that can be expected if the individual is given the intervention. Some statistics may not sum as expected due to rounding. DIBELS = Dynamic Indicators of Basic Early Literacy Skills. a For Ransford-Kaldon et al. (2010), the p-values presented here were reported in the original study. A correction for multiple comparisons was needed and resulted in WWC-computed critical p-value of .029 for grade 1 students. Since the exact author-calculated p-values were not known, the WWC applied the multiple comparison adjustment to the WWC-calculated p-values (not shown). This did not affect whether any of the contrasts were found to be statistically significant. The p-values presented here were reported in the original study. The WWC calculated the intervention group mean using a difference-in-differences approach by adding the impact of the intervention (i.e., difference in mean gains between the intervention and comparison groups) to the unadjusted comparison group posttest means. Please see the WWC Procedures and Standards Handbook (version 3.0), p. 23 for more information. In response to the WWC author query, the authors confirmed that for all DIBELS subtests the means and standard deviations were reported as percentages for kindergarten students and as proportions for students in grades 1 and 2. For consistency, the WWC reported these means and standard deviations as proportions for all grades.
Leveled Literacy Intervention September 2017 Page 22
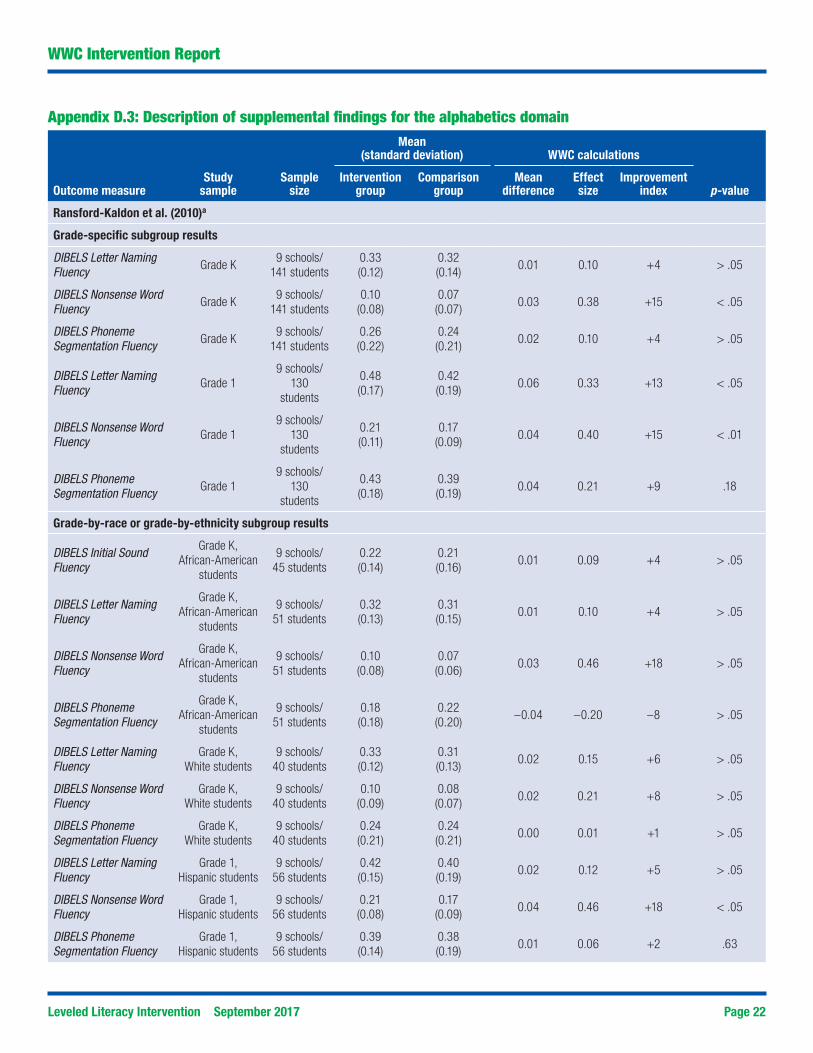
Appendix D.3: Description of supplemental findings for the alphabetics domain
WWC Intervention Report
Mean(standard deviation) WWC calculations
Outcome measureStudy
sampleSample
sizeIntervention
groupComparison
groupMean
differenceEffect size
Improvement index p-value
Ransford-Kaldon et al. (2010)a
Grade-specific subgroup results
DIBELS Letter Naming Fluency Grade K
9 schools/141 students
0.33(0.12)
0.32(0.14)
0.01 0.10 +4 > .05
DIBELS Nonsense Word Fluency Grade K
9 schools/141 students
0.10(0.08)
0.07(0.07)
0.03 0.38 +15 < .05
DIBELS Phoneme Segmentation Fluency Grade K
9 schools/141 students
0.26(0.22)
0.24(0.21)
0.02 0.10 +4 > .05
DIBELS Letter Naming Fluency Grade 1
9 schools/130
students
0.48(0.17)
0.42(0.19)
0.06 0.33 +13 < .05
DIBELS Nonsense Word Fluency Grade 1
9 schools/130
students
0.21(0.11)
0.17(0.09)
0.04 0.40 +15 < .01
DIBELS Phoneme Segmentation Fluency Grade 1
9 schools/130
students
0.43(0.18)
0.39(0.19)
0.04 0.21 +9 .18
Grade-by-race or grade-by-ethnicity subgroup results
DIBELS Initial Sound Fluency
Grade K, African-American
students
9 schools/45 students
0.22(0.14)
0.21(0.16)
0.01 0.09 +4 > .05
DIBELS Letter Naming Fluency
Grade K, African-American
students
9 schools/51 students
0.32(0.13)
0.31(0.15)
0.01 0.10 +4 > .05
DIBELS Nonsense Word Fluency
Grade K, African-American
students
9 schools/51 students
0.10(0.08)
0.07(0.06)
0.03 0.46 +18 > .05
DIBELS Phoneme Segmentation Fluency
Grade K, African-American
students
9 schools/51 students
0.18(0.18)
0.22(0.20)
–0.04 –0.20 –8 > .05
DIBELS Letter Naming Fluency
Grade K,White students
9 schools/40 students
0.33(0.12)
0.31(0.13)
0.02 0.15 +6 > .05
DIBELS Nonsense Word Fluency
Grade K,White students
9 schools/40 students
0.10(0.09)
0.08(0.07)
0.02 0.21 +8 > .05
DIBELS Phoneme Segmentation Fluency
Grade K,White students
9 schools/40 students
0.24(0.21)
0.24(0.21)
0.00 0.01 +1 > .05
DIBELS Letter Naming Fluency
Grade 1,Hispanic students
9 schools/56 students
0.42(0.15)
0.40(0.19)
0.02 0.12 +5 > .05
DIBELS Nonsense Word Fluency
Grade 1,Hispanic students
9 schools/56 students
0.21(0.08)
0.17(0.09)
0.04 0.46 +18 < .05
DIBELS Phoneme Segmentation Fluency
Grade 1,Hispanic students
9 schools/56 students
0.39(0.14)
0.38(0.19)
0.01 0.06 +2 .63
Leveled Literacy Intervention September 2017 Page 23
WWC Intervention Report
Mean
(standard deviation) WWC calculations
Outcome measureStudy
sampleSample
sizeIntervention
groupComparison
groupMean
differenceEffect size
Improvement index p-value
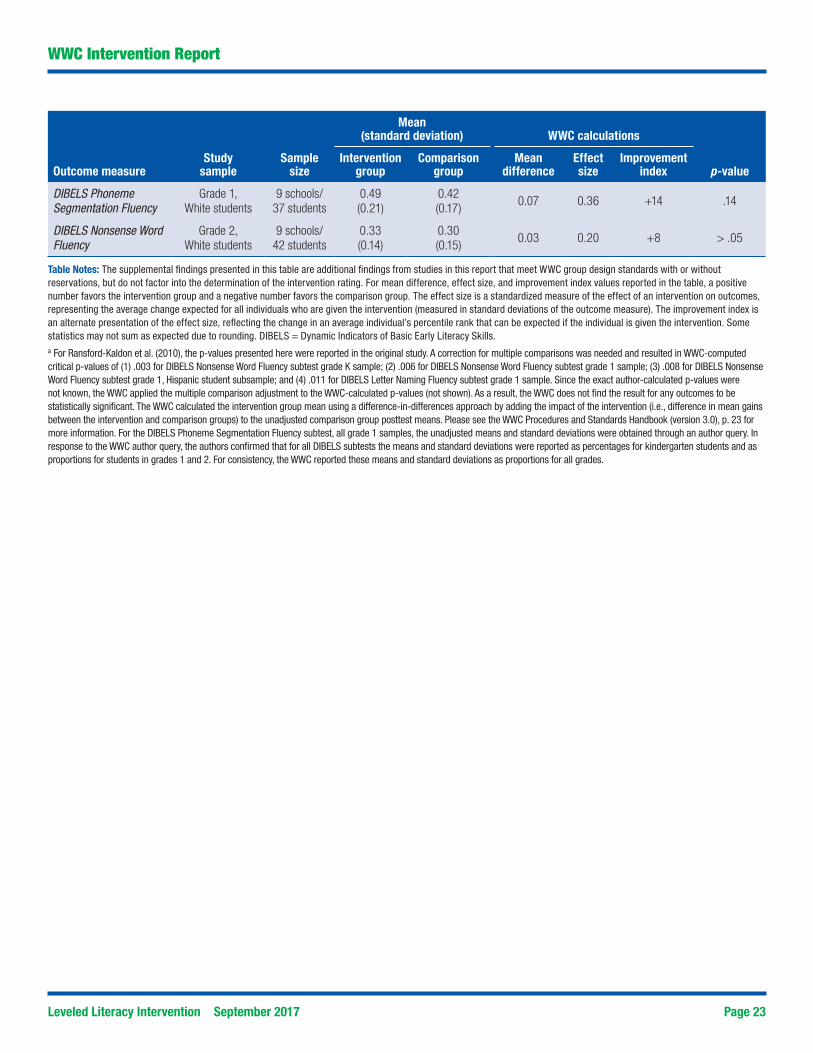
DIBELS Phoneme Segmentation Fluency
Grade 1, White students
9 schools/37 students
0.49(0.21)
0.42(0.17)
0.07 0.36 +14 .14
DIBELS Nonsense Word Fluency
Grade 2, White students
9 schools/42 students
0.33(0.14)
0.30(0.15)
0.03 0.20 +8 > .05
Table Notes: The supplemental findings presented in this table are additional findings from studies in this report that meet WWC group design standards with or without reservations, but do not factor into the determination of the intervention rating. For mean difference, effect size, and improvement index values reported in the table, a positive number favors the intervention group and a negative number favors the comparison group. The effect size is a standardized measure of the effect of an intervention on outcomes, representing the average change expected for all individuals who are given the intervention (measured in standard deviations of the outcome measure). The improvement index is an alternate presentation of the effect size, reflecting the change in an average individual’s percentile rank that can be expected if the individual is given the intervention. Some statistics may not sum as expected due to rounding. DIBELS = Dynamic Indicators of Basic Early Literacy Skills. a For Ransford-Kaldon et al. (2010), the p-values presented here were reported in the original study. A correction for multiple comparisons was needed and resulted in WWC-computed critical p-values of (1) .003 for DIBELS Nonsense Word Fluency subtest grade K sample; (2) .006 for DIBELS Nonsense Word Fluency subtest grade 1 sample; (3) .008 for DIBELS Nonsense Word Fluency subtest grade 1, Hispanic student subsample; and (4) .011 for DIBELS Letter Naming Fluency subtest grade 1 sample. Since the exact author-calculated p-values were not known, the WWC applied the multiple comparison adjustment to the WWC-calculated p-values (not shown). As a result, the WWC does not find the result for any outcomes to be statistically significant. The WWC calculated the intervention group mean using a difference-in-differences approach by adding the impact of the intervention (i.e., difference in mean gains between the intervention and comparison groups) to the unadjusted comparison group posttest means. Please see the WWC Procedures and Standards Handbook (version 3.0), p. 23 for more information. For the DIBELS Phoneme Segmentation Fluency subtest, all grade 1 samples, the unadjusted means and standard deviations were obtained through an author query. In response to the WWC author query, the authors confirmed that for all DIBELS subtests the means and standard deviations were reported as percentages for kindergarten students and as proportions for students in grades 1 and 2. For consistency, the WWC reported these means and standard deviations as proportions for all grades.
Leveled Literacy Intervention September 2017 Page 24
Endnotes
WWC Intervention Report
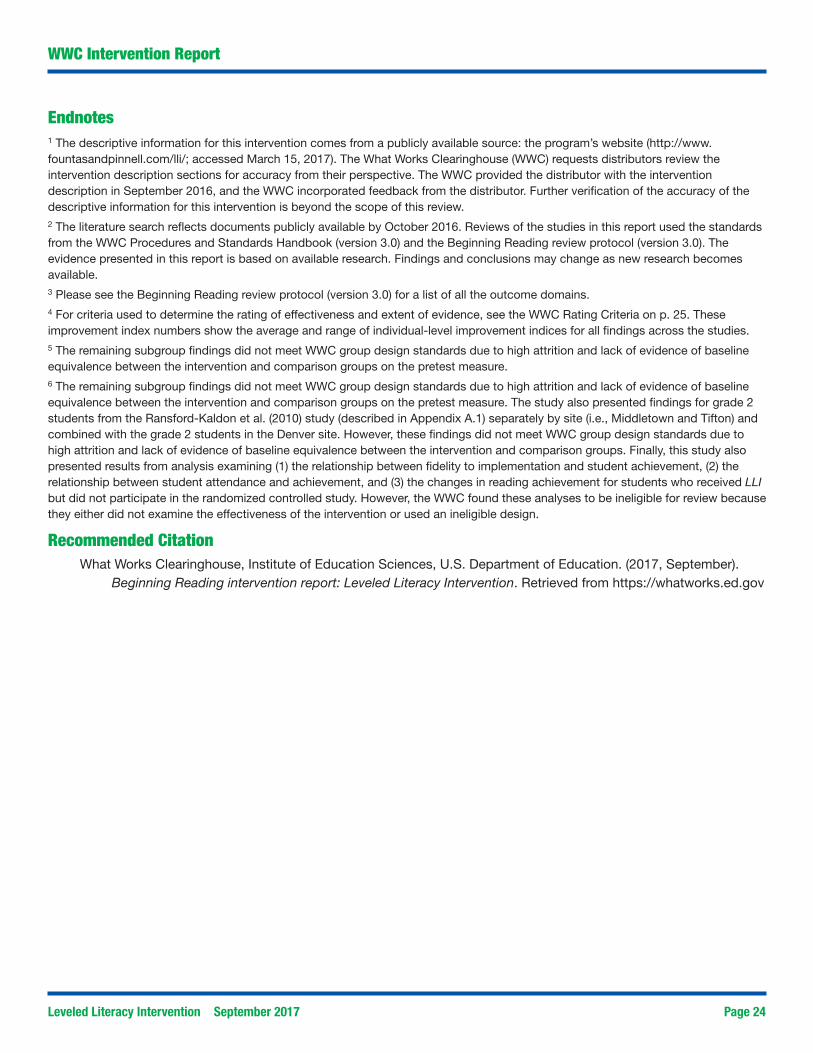
1 The descriptive information for this intervention comes from a publicly available source: the program’s website (http://www.fountasandpinnell.com/lli/; accessed March 15, 2017). The What Works Clearinghouse (WWC) requests distributors review the intervention description sections for accuracy from their perspective. The WWC provided the distributor with the intervention description in September 2016, and the WWC incorporated feedback from the distributor. Further verification of the accuracy of the descriptive information for this intervention is beyond the scope of this review. 2 The literature search reflects documents publicly available by October 2016. Reviews of the studies in this report used the standards from the WWC Procedures and Standards Handbook (version 3.0) and the Beginning Reading review protocol (version 3.0). The evidence presented in this report is based on available research. Findings and conclusions may change as new research becomes available.3 Please see the Beginning Reading review protocol (version 3.0) for a list of all the outcome domains.4 For criteria used to determine the rating of effectiveness and extent of evidence, see the WWC Rating Criteria on p. 25. These improvement index numbers show the average and range of individual-level improvement indices for all findings across the studies.5 The remaining subgroup findings did not meet WWC group design standards due to high attrition and lack of evidence of baseline equivalence between the intervention and comparison groups on the pretest measure.6 The remaining subgroup findings did not meet WWC group design standards due to high attrition and lack of evidence of baseline equivalence between the intervention and comparison groups on the pretest measure. The study also presented findings for grade 2 students from the Ransford-Kaldon et al. (2010) study (described in Appendix A.1) separately by site (i.e., Middletown and Tifton) and combined with the grade 2 students in the Denver site. However, these findings did not meet WWC group design standards due to high attrition and lack of evidence of baseline equivalence between the intervention and comparison groups. Finally, this study also presented results from analysis examining (1) the relationship between fidelity to implementation and student achievement, (2) the relationship between student attendance and achievement, and (3) the changes in reading achievement for students who received LLI but did not participate in the randomized controlled study. However, the WWC found these analyses to be ineligible for review because they either did not examine the effectiveness of the intervention or used an ineligible design.
Recommended CitationWhat Works Clearinghouse, Institute of Education Sciences, U.S. Department of Education. (2017, September).
Beginning Reading intervention report: Leveled Literacy Intervention. Retrieved from https://whatworks.ed.gov
Leveled Literacy Intervention September 2017 Page 25
WWC Intervention Report
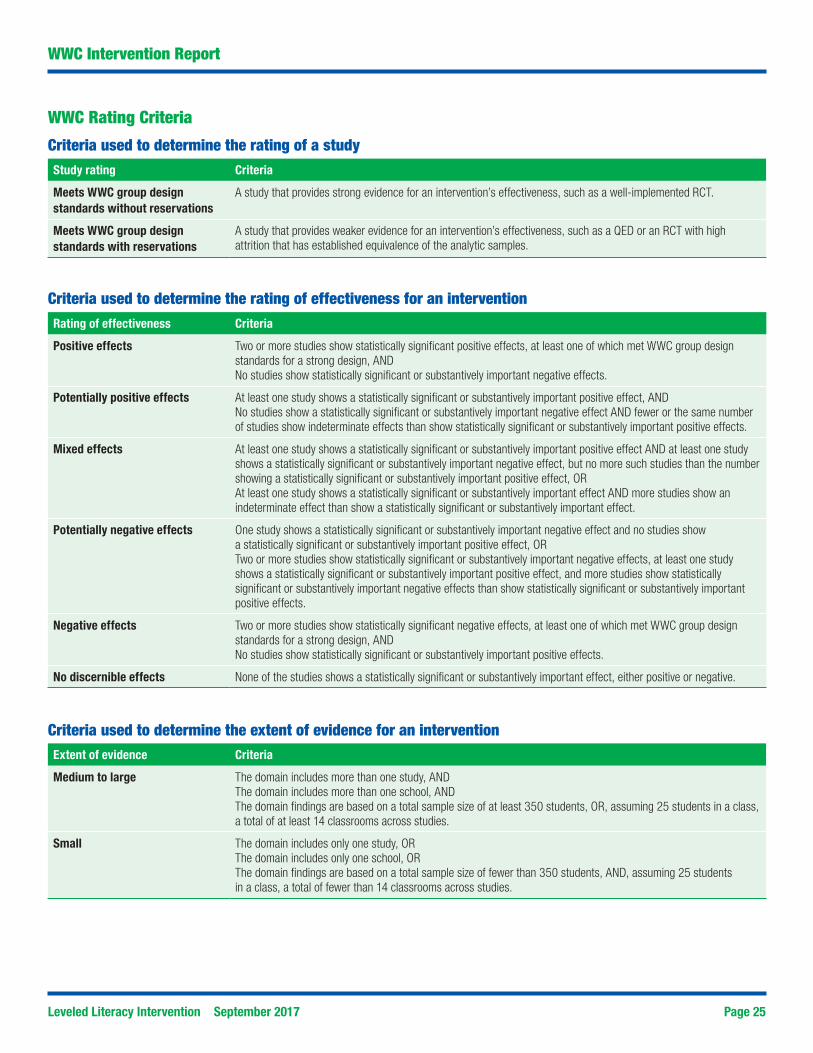
WWC Rating Criteria
Criteria used to determine the rating of a studyStudy rating Criteria
Meets WWC group design standards without reservations
A study that provides strong evidence for an intervention’s effectiveness, such as a well-implemented RCT.
Meets WWC group design standards with reservations
A study that provides weaker evidence for an intervention’s effectiveness, such as a QED or an RCT with high attrition that has established equivalence of the analytic samples.
Criteria used to determine the rating of effectiveness for an interventionRating of effectiveness Criteria
Positive effects Two or more studies show statistically significant positive effects, at least one of which met WWC group design standards for a strong design, ANDNo studies show statistically significant or substantively important negative effects.
Potentially positive effects At least one study shows a statistically significant or substantively important positive effect, ANDNo studies show a statistically significant or substantively important negative effect AND fewer or the same number of studies show indeterminate effects than show statistically significant or substantively important positive effects.
Mixed effects At least one study shows a statistically significant or substantively important positive effect AND at least one study shows a statistically significant or substantively important negative effect, but no more such studies than the number showing a statistically significant or substantively important positive effect, ORAt least one study shows a statistically significant or substantively important effect AND more studies show an indeterminate effect than show a statistically significant or substantively important effect.
Potentially negative effects One study shows a statistically significant or substantively important negative effect and no studies show a statistically significant or substantively important positive effect, ORTwo or more studies show statistically significant or substantively important negative effects, at least one study shows a statistically significant or substantively important positive effect, and more studies show statistically significant or substantively important negative effects than show statistically significant or substantively important positive effects.
Negative effects Two or more studies show statistically significant negative effects, at least one of which met WWC group design standards for a strong design, ANDNo studies show statistically significant or substantively important positive effects.
No discernible effects None of the studies shows a statistically significant or substantively important effect, either positive or negative.
Criteria used to determine the extent of evidence for an interventionExtent of evidence Criteria
Medium to large The domain includes more than one study, ANDThe domain includes more than one school, ANDThe domain findings are based on a total sample size of at least 350 students, OR, assuming 25 students in a class, a total of at least 14 classrooms across studies.
Small The domain includes only one study, ORThe domain includes only one school, ORThe domain findings are based on a total sample size of fewer than 350 students, AND, assuming 25 students in a class, a total of fewer than 14 classrooms across studies.
Leveled Literacy Intervention September 2017 Page 26
WWC Intervention Report
Glossary of Terms
Attrition Attrition occurs when an outcome variable is not available for all subjects initially assigned to the intervention and comparison groups. If a randomized controlled trial (RCT) or regression discontinuity design (RDD) study has high levels of attrition, the validity of the study results can be called into question. An RCT with high attrition cannot receive the highest rating of Meets WWC Group Design Standards without Reservations, but can receive a rating of Meets WWC Group Design Standards with Reservations if it establishes baseline equivalence of the analytic sample. Similarly, the highest rating an RDD with high attrition can receive is Meets WWC RDD Standards with Reservations.
For single-case design research, attrition occurs when an individual fails to complete all required phases or data points in an experiment, or when the case is a group and individuals leave the group. If a single-case design does not meet minimum requirements for phases and data points within phases, the study cannot receive the highest rating of Meets WWC Pilot Single-Case Design Standards without Reservations.
Baseline A point in time before the intervention was implemented in group design research and in regression discontinuity design studies. When a study is required to satisfy the baseline equivalence requirement, it must be done with characteristics of the analytic sample at baseline. In a single-case design experiment, the baseline condition is a period during which participants are not receiving the intervention.
Clustering adjustment An adjustment to the statistical significance of a finding when the units of assignment and analysis differ. When random assignment is carried out at the cluster level, outcomes for individual units within the same clusters may be correlated. When the analysis is conducted at the individual level rather than the cluster level, there is a mismatch between the unit of assignment and the unit of analysis, and this correlation must be accounted for when assessing the statistical significance of an impact estimate. If the correlation is not accounted for in a mismatched analysis, the study may be too likely to report statistically significant findings. To fairly assess an intervention’s effects, in cases where study authors have not corrected for the clustering, the WWC applies an adjustment for clustering when reporting statistical significance.
Confounding factor A confounding factor is a component of a study that is completely aligned with one of the study conditions, making it impossible to separate how much of the observed effect was due to the intervention and how much was due to the factor.
Design The method by which intervention and comparison groups are assigned (group design and regression discontinuity design) or the method by which an outcome measure is assessed repeatedly within and across different phases that are defined by the presence or absence of an intervention (single-case design). Designs eligible for WWC review are randomized controlled trials, quasi-experimental designs, regression discontinuity designs, and single-case designs.
Effect size The effect size is a measure of the magnitude of an effect. The WWC uses a standardized measure to facilitate comparisons across studies and outcomes.
Eligibility A study is eligible for review and inclusion in this report if it falls within the scope of the review protocol and uses either an experimental or matched comparison group design.
Equivalence A demonstration that the analytic sample groups are similar on observed characteristics defined in the review area protocol.
Leveled Literacy Intervention September 2017 Page 27
WWC Intervention Report
Glossary of Terms
Extent of evidence An indication of how much evidence from group design studies supports the findings in an intervention report. The extent of evidence categorization for intervention reports focuses on the number and sizes of studies of the intervention in order to give an indication of how broadly findings may be applied to different settings. There are two extent of evidence categories: small and medium to large.
• small: includes only one study, or one school, or findings based on a total sample size of less than 350 students and 14 classrooms (assuming 25 students in a class)
• medium to large: includes more than one study, more than one school, and findings based on a total sample of at least 350 students or 14 classrooms
Gain scores The result of subtracting the pretest from the posttest for each individual in the sample. Some studies analyze gain scores instead of the unadjusted outcome measure as a method of accounting for the baseline measure when estimating the effect of an intervention. The WWC reviews and reports findings from analyses of gain scores, but gain scores do not satisfy the WWC’s requirement for a statistical adjustment under the baseline equivalence requirement. This means that a study that must satisfy the baseline equivalence requirement and has baseline differences between 0.05 and 0.25 standard deviations Does Not Meet WWC Group Design Standards if the study’s only adjustment for the baseline measure was in the construction of the gain score.
Group design A study design in which outcomes for a group receiving an intervention are compared to those for a group not receiving the intervention. Comparison group designs eligible for WWC review are randomized controlled trials and quasi-experimental designs.
Improvement index Along a percentile distribution of individuals, the improvement index represents the gain or loss of the average individual due to the intervention. As the average individual starts at the 50th percentile, the measure ranges from –50 to +50.
Intervention An educational program, product, practice, or policy aimed at improving student outcomes.
Intervention report A summary of the findings of the highest-quality research on a given program, product, practice, or policy in education. The WWC searches for all research studies on an intervention, reviews each against design standards, and summarizes the findings of those that meet WWC design standards.
Multiple comparison adjustment
An adjustment to the statistical significance of results to account for multiple comparisons in a group design study. The WWC uses the Benjamini-Hochberg (BH) correction to adjust the statistical significance of results within an outcome domain when study authors perform multiple hypothesis tests without adjusting the p-value. The BH correction is used in three types of situations: studies that tested multiple outcome measures in the same outcome domain with a single comparison group; studies that tested a given outcome measure with multiple comparison groups; and studies that tested multiple outcome measures in the same outcome domain with multiple comparison groups. Because repeated tests of highly correlated constructs will lead to a greater likelihood of mistakenly concluding that the impact was different from zero, in all three situations, the WWC uses the BH correction to reduce the possibility of making this error. The WWC makes separate adjustments for primary and secondary findings.
Leveled Literacy Intervention September 2017 Page 28
WWC Intervention Report
Glossary of Terms
Outcome domain A group of closely-related outcomes. A domain is the organizing construct for a set of related outcomes through which studies claim effectiveness.
Quasi-experimental design (QED)
A quasi-experimental design (QED) is a research design in which study participants are assigned to intervention and comparison groups through a process that is not random.
Randomized controlled trial (RCT)
A randomized controlled trial (RCT) is an experiment in which eligible study participants are randomly assigned to intervention and comparison groups.
Rating of effectiveness For group design research, the WWC rates the effectiveness of an intervention in each domain based on the quality of the research design and the magnitude, statistical significance, and consistency in findings. For single-case design research, the WWC rates the effectiveness of an intervention in each domain based on the quality of the research design and the consistency of demonstrated effects. The criteria for the ratings of effectiveness are given in the WWC Rating Criteria on p. 25.
Regression discontinuity design
(RDD)
A design in which groups are created using a continuous scoring rule. For example, students may be assigned to a summer school program if they score below a preset point on a standardized test, or schools may be awarded a grant based on their score on an application. A regression line or curve is estimated for the intervention group and similarly for the comparison group, and an effect occurs if there is a discontinuity in the two regression lines at the cutoff.
Single-case design A research approach in which an outcome variable is measured repeatedly within and across different conditions that are defined by the presence or absence of an intervention.
Standard deviation The standard deviation of a measure shows how much variation exists across observations in the sample. A low standard deviation indicates that the observations in the sample tend to be very close to the mean; a high standard deviation indicates that the observations in the sample tend to be spread out over a large range of values.
Statistical significance Statistical significance is the probability that the difference between groups is a result of chance rather than a real difference between the groups. The WWC labels a finding statistically significant if the likelihood that the difference is due to chance is less than 5% (p < .05).
Study rating The result of the WWC assessment of a study. The rating is based on the strength of the evidence of the effectiveness of the educational intervention. Studies are given a rating of Meets WWC Design Standards without Reservations, Meets WWC Design Standards with Reservations, or Does Not Meet WWC Design Standards, based on the assessment of the study against the appropriate design standards. The WWC has design standards for group design, single-case design, and regression discontinuity design studies.
Substantively important A substantively important finding is one that has an effect size of 0.25 or greater, regardless of statistical significance.
Systematic review A review of existing literature on a topic that is identified and reviewed using explicit methods. A WWC systematic review has five steps: 1) developing a review protocol; 2) searching the literature; 3) reviewing studies, including screening studies for eligibility, reviewing the methodological quality of each study, and reporting on high quality studies and their findings; 4) combining findings within and across studies; and 5) summarizing the review.
Please see the WWC Procedures and Standards Handbook (version 3.0) for additional details.
Leveled Literacy Intervention September 2017 Page 29
WWC Intervention Report
Intervention Report
Practice Guide
Quick Review
Single Study Review
An intervention report summarizes the findings of high-quality research on a given program, practice, or policy in education. The WWC searches for all research studies on an intervention, reviews each against evidence standards, and summarizes the findings of those that meet standards.
This intervention report was prepared for the WWC by Mathematica Policy Research under contract ED-IES-13-C-0010.