Embed Size (px)
Citation preview

www.aodhealth.orgwww.aodhealth.org 11
Update on Update on Alcohol, Other Alcohol, Other
Drugs, and HealthDrugs, and Health
March–April 2012March–April 2012

www.aodhealth.orgwww.aodhealth.org 22
Studies on Studies on Health OutcomesHealth Outcomes

www.aodhealth.orgwww.aodhealth.org 33
Medical Inpatients with Medical Inpatients with Substance Use Disorders Substance Use Disorders Are More Likely to Have Are More Likely to Have Acute Care Readmission Acute Care Readmission
than Those without than Those without Substance Use DisordersSubstance Use Disorders
Walley AY, et al. Walley AY, et al. J Addict Med. 2012;6(1):50–56.J Addict Med. 2012;6(1):50–56.Summary by Jeanette M. Tetrault, MDSummary by Jeanette M. Tetrault, MD

www.aodhealth.orgwww.aodhealth.org 44
Objectives/MethodsObjectives/Methods Patients with substance use disorders Patients with substance use disorders
(SUDs) frequently use acute medical care (SUDs) frequently use acute medical care services (AMCS) (emergency department services (AMCS) (emergency department visits or hospitalizations). Hospital visits or hospitalizations). Hospital discharge provides an opportunity to discharge provides an opportunity to reduce hospital readmission through reduce hospital readmission through linkage to specialized care, especially for linkage to specialized care, especially for patients with SUDs. patients with SUDs.
This study assessed whether the diagnosis This study assessed whether the diagnosis of an SUD during medical hospitalization of an SUD during medical hospitalization was associated with recurrent AMCS use. was associated with recurrent AMCS use.

www.aodhealth.orgwww.aodhealth.org 55
Objectives/MethodsObjectives/Methods (cont’d) (cont’d)
The authors examined data from Project RED, a The authors examined data from Project RED, a randomized trial of reengineered discharge randomized trial of reengineered discharge services among 738 general medical inpatients services among 738 general medical inpatients at a single institution. The discharge intervention at a single institution. The discharge intervention did not contain services specifically tailored to did not contain services specifically tailored to patients with SUDs.patients with SUDs.
The main outcomes were rate and risk of AMCS The main outcomes were rate and risk of AMCS use within 30 days of discharge as assessed by use within 30 days of discharge as assessed by medical record review and self-report. medical record review and self-report.
www.aodhealth.orgwww.aodhealth.org 66
ResultsResults Seventeen percent of patients had an SUD.Seventeen percent of patients had an SUD.
Patients with an SUD had higher rate of Patients with an SUD had higher rate of AMCS use at 30 days (0.63 versus 0.32 AMCS use at 30 days (0.63 versus 0.32 events per patient) and had an increased events per patient) and had an increased risk of AMCS use (33% versus 22%). risk of AMCS use (33% versus 22%).
Subgroup analysis revealed that drug use Subgroup analysis revealed that drug use disorders or a combination of drug and disorders or a combination of drug and alcohol use disorders resulted in higher alcohol use disorders resulted in higher AMCS use than alcohol diagnoses alone. AMCS use than alcohol diagnoses alone.
www.aodhealth.orgwww.aodhealth.org 77
CommentsComments Despite the inherent limitations of Despite the inherent limitations of
reliance on self-report, International reliance on self-report, International Statistical Classification (ICD-9) coding, Statistical Classification (ICD-9) coding, and single institution data, these results and single institution data, these results support the hypothesis that SUDs place support the hypothesis that SUDs place medical inpatients at higher risk for medical inpatients at higher risk for recurrent AMCS use.recurrent AMCS use.
A discharge plan tailored to patients with A discharge plan tailored to patients with SUDs may help reduce readmission rates. SUDs may help reduce readmission rates.

www.aodhealth.orgwww.aodhealth.org 88
Marijuana Use Is Associated Marijuana Use Is Associated with an Increased Risk of with an Increased Risk of Motor Vehicle AccidentsMotor Vehicle Accidents
Asbridge M, et alAsbridge M, et al. . BMJ.BMJ. February 9, 2012;344:e536. February 9, 2012;344:e536.Summary by Summary by Hillary Kunins, MD, MPH, MSHillary Kunins, MD, MPH, MS

99
Objectives/MethodsObjectives/Methods This systematic review and meta-analysis This systematic review and meta-analysis
examined the association between recent examined the association between recent marijuana use and motor vehicle accidents marijuana use and motor vehicle accidents (MVAs).(MVAs).
Eligibility was limited to cohort studies with Eligibility was limited to cohort studies with comparison groups and case-control studies comparison groups and case-control studies published in any language. The main outcome published in any language. The main outcome was fatal or nonfatal MVA. Recent cannabis use was fatal or nonfatal MVA. Recent cannabis use among drivers was determined by toxicological among drivers was determined by toxicological testing or self-report. testing or self-report.
Using a predefined search strategy, the authors Using a predefined search strategy, the authors identified 4 high-quality and 5 medium-quality identified 4 high-quality and 5 medium-quality studies using the Newcastle-Ottawa scale.studies using the Newcastle-Ottawa scale.
www.aodhealth.orgwww.aodhealth.org
1010
ResultsResults Six of 9 studies found a positive association Six of 9 studies found a positive association
between recent marijuana use and MVAs, while between recent marijuana use and MVAs, while 3 of 9 found no association.3 of 9 found no association.
Odds ratios (ORs) for individual studies ranged Odds ratios (ORs) for individual studies ranged from 0.82 to 7.2. The pooled OR for the from 0.82 to 7.2. The pooled OR for the association between recent marijuana use and association between recent marijuana use and MVAs was 1.9, but studies were heterogeneous.MVAs was 1.9, but studies were heterogeneous.
The OR was 2.2 for high-quality studies and 1.8 The OR was 2.2 for high-quality studies and 1.8 for medium-quality studies. for medium-quality studies.
The OR for fatal collisions was significant (2.1; The OR for fatal collisions was significant (2.1; 95% CI, 1.31–3.36), but the OR for nonfatal 95% CI, 1.31–3.36), but the OR for nonfatal collisions was not (1.74; 95% CI, 0.88–3.46).collisions was not (1.74; 95% CI, 0.88–3.46).
www.aodhealth.orgwww.aodhealth.org
www.aodhealth.orgwww.aodhealth.org 1111
CommentsComments Overall, this study found an association between Overall, this study found an association between
recent marijuana use and MVAs. recent marijuana use and MVAs.
Because of the heterogeneity of the studies, the Because of the heterogeneity of the studies, the pooled OR should not be considered a definitive pooled OR should not be considered a definitive estimate of risk. An additional limitation is the estimate of risk. An additional limitation is the absence of data to assess a “dose” relationship absence of data to assess a “dose” relationship between marijuana use and MVAs. between marijuana use and MVAs.
Therefore, these results cannot offer guidance Therefore, these results cannot offer guidance as to whether there is a safe threshold of as to whether there is a safe threshold of marijuana use while driving. marijuana use while driving.

www.aodhealth.orgwww.aodhealth.org 1212
The Prevention Paradox The Prevention Paradox Applies to Alcohol Use and Applies to Alcohol Use and
Problems among Problems among AdolescentsAdolescents
Romelsjö A, et al. Romelsjö A, et al. Eur J Public Health. Eur J Public Health. February 24, 2012 February 24, 2012 [Epub ahead of print]; doi 10.1093/eurpub/ckr178.[Epub ahead of print]; doi 10.1093/eurpub/ckr178.
Summary by Nicolas Bertholet, MD, MScSummary by Nicolas Bertholet, MD, MSc
1313
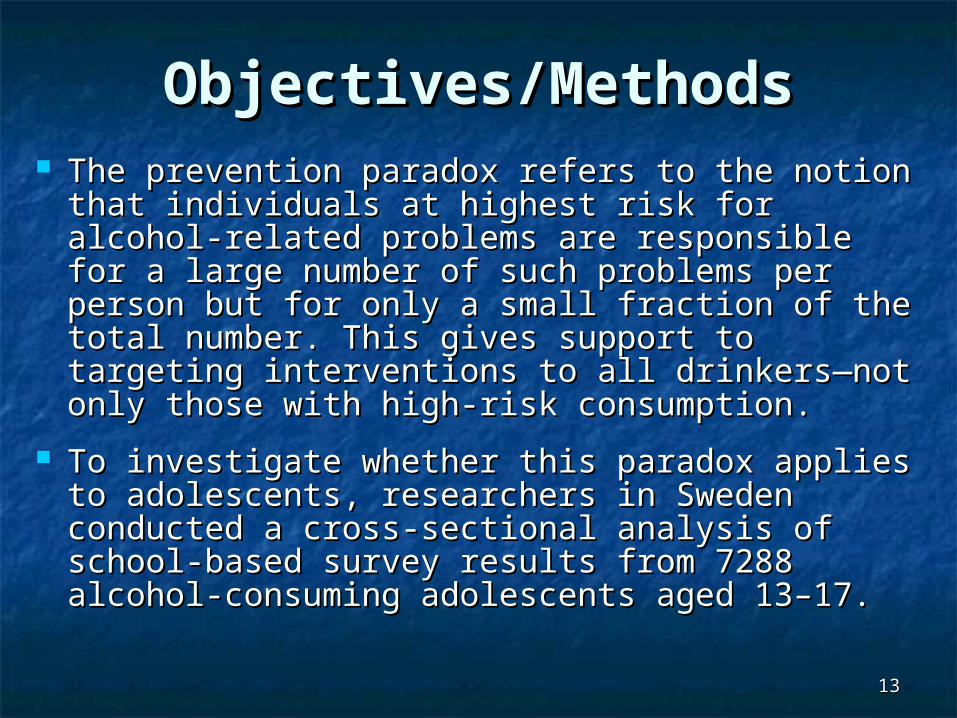
Objectives/MethodsObjectives/Methods The prevention paradox refers to the notion The prevention paradox refers to the notion
that individuals at highest risk for alcohol-that individuals at highest risk for alcohol-related problems are responsible for a large related problems are responsible for a large number of such problems per person but for number of such problems per person but for only a small fraction of the total number. only a small fraction of the total number. This gives support to targeting interventions This gives support to targeting interventions to all drinkers—not only those with high-risk to all drinkers—not only those with high-risk consumption. consumption.
To investigate whether this paradox applies To investigate whether this paradox applies to adolescents, researchers in Sweden to adolescents, researchers in Sweden conducted a cross-sectional analysis of conducted a cross-sectional analysis of school-based survey results from 7288 school-based survey results from 7288 alcohol-consuming adolescents aged 13–17. alcohol-consuming adolescents aged 13–17.
1414
Objectives/Methods Objectives/Methods (cont’d)(cont’d)
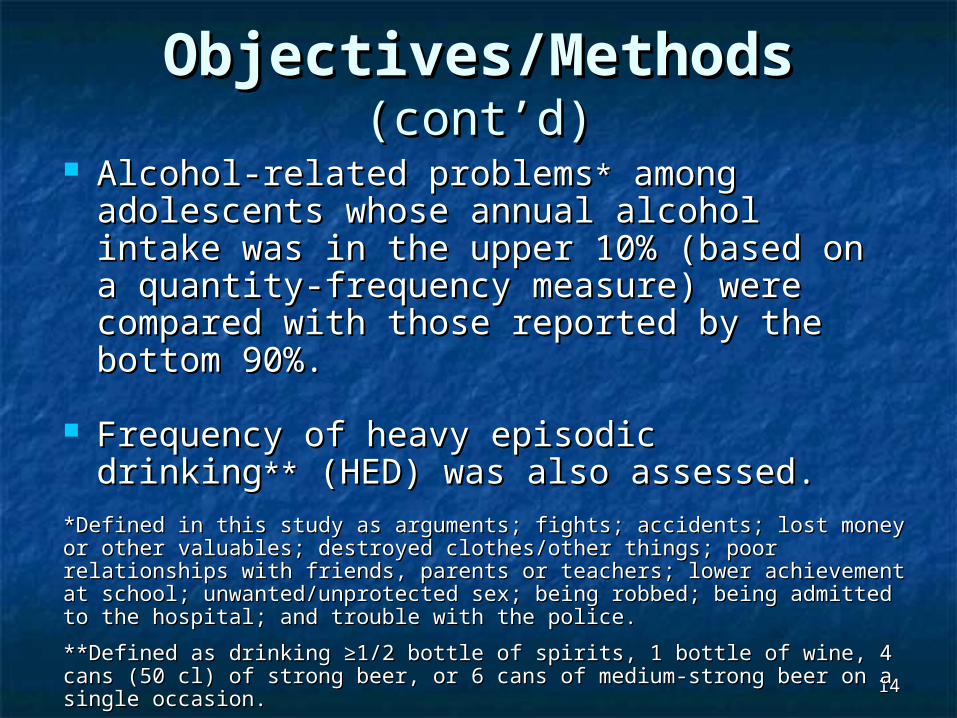
Alcohol-related problemsAlcohol-related problems** among among adolescents whose annual alcohol intake adolescents whose annual alcohol intake was in the upper 10% (based on a was in the upper 10% (based on a quantity-frequency measure) were quantity-frequency measure) were compared with those reported by the compared with those reported by the bottom 90%.bottom 90%.
Frequency of heavy episodic drinkingFrequency of heavy episodic drinking**** (HED) was also assessed. (HED) was also assessed.
*Defined in this study as arguments; fights; accidents; lost money or other *Defined in this study as arguments; fights; accidents; lost money or other valuables; destroyed clothes/other things; poor relationships with friends, valuables; destroyed clothes/other things; poor relationships with friends, parents or teachers; lower achievement at school; unwanted/unprotected sex; parents or teachers; lower achievement at school; unwanted/unprotected sex; being robbed; being admitted to the hospital; and trouble with the police.being robbed; being admitted to the hospital; and trouble with the police.
**Defined as drinking ≥1/2 bottle of spirits, 1 bottle of wine, 4 cans (50 cl) of **Defined as drinking ≥1/2 bottle of spirits, 1 bottle of wine, 4 cans (50 cl) of strong beer, or 6 cans of medium-strong beer on a single occasion.strong beer, or 6 cans of medium-strong beer on a single occasion.

www.aodhealth.orgwww.aodhealth.org 1515
ResultsResults
The bottom 90% of consumers accounted The bottom 90% of consumers accounted for the majority of alcohol-related problems for the majority of alcohol-related problems among boys and girls at all ages (61–77%). among boys and girls at all ages (61–77%).
Age 13 Age 13 (n=817)(n=817)
Age 17 Age 17 (n=3355)(n=3355)
Mean past-year alcohol consumption (liters)Mean past-year alcohol consumption (liters)
BoysBoys 0.70.7 7.87.8
GirlsGirls 0.80.8 4.54.5
Mean past-year alcohol consumption (liters)Mean past-year alcohol consumption (liters)
BoysBoys 1.51.5 4.04.0
GirlsGirls 2.22.2 4.64.6
www.aodhealth.orgwww.aodhealth.org 1616
ResultsResults (cont’d) (cont’d)
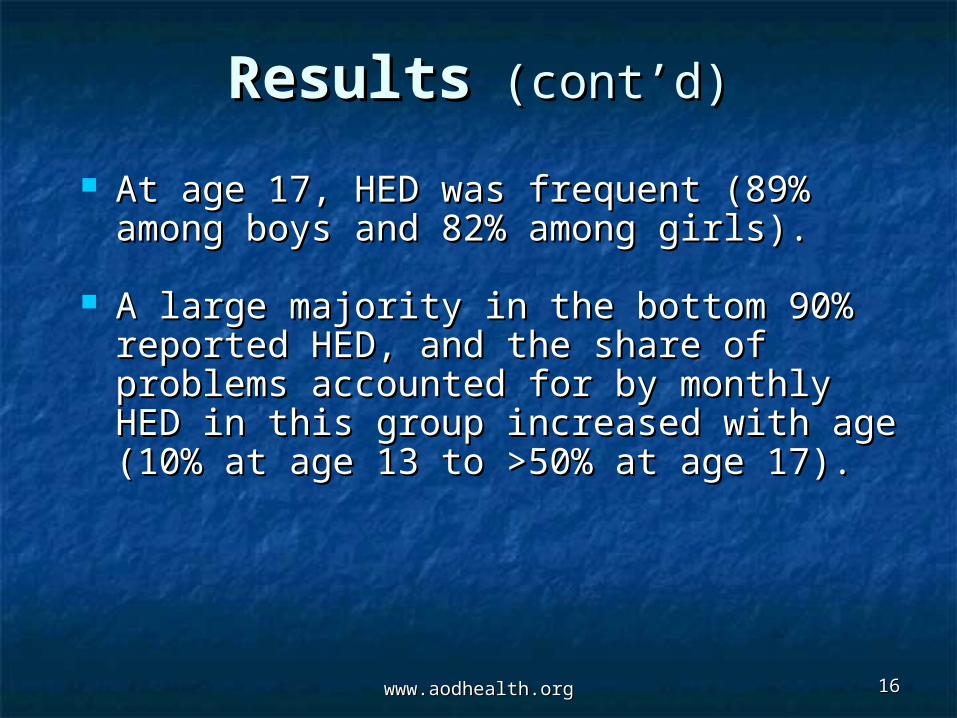
At age 17, HED was frequent (89% At age 17, HED was frequent (89% among boys and 82% among girls).among boys and 82% among girls).
A large majority in the bottom 90% A large majority in the bottom 90% reported HED, and the share of problems reported HED, and the share of problems accounted for by monthly HED in this accounted for by monthly HED in this group increased with age (10% at age 13 group increased with age (10% at age 13 to >50% at age 17).to >50% at age 17).
www.aodhealth.orgwww.aodhealth.org 1717
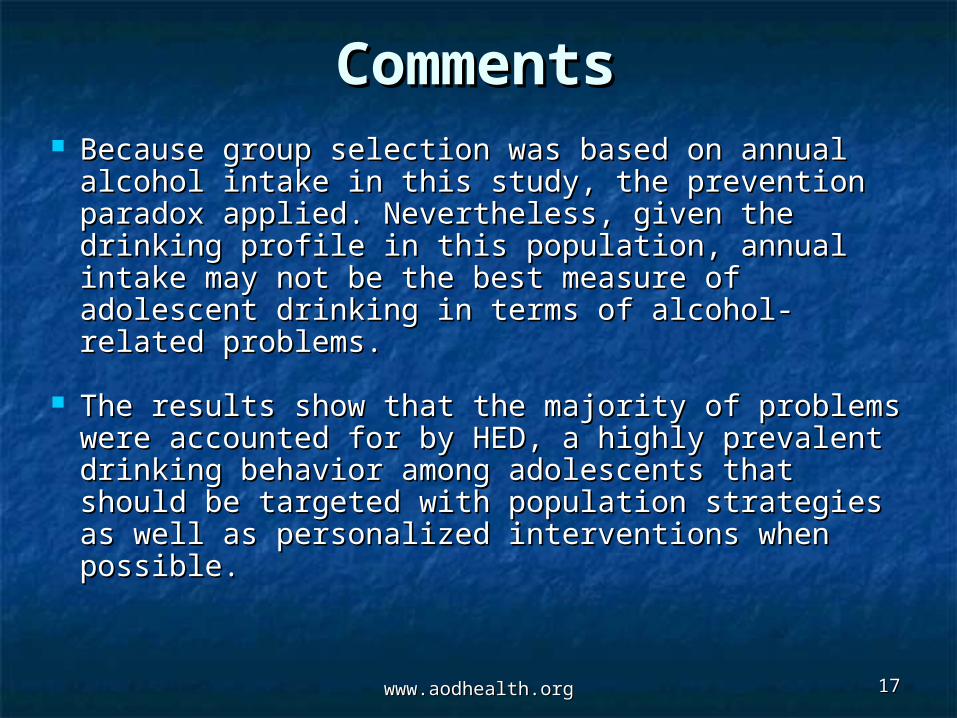
CommentsComments Because group selection was based on annual Because group selection was based on annual
alcohol intake in this study, the prevention alcohol intake in this study, the prevention paradox applied. Nevertheless, given the paradox applied. Nevertheless, given the drinking profile in this population, annual intake drinking profile in this population, annual intake may not be the best measure of adolescent may not be the best measure of adolescent drinking in terms of alcohol-related problems. drinking in terms of alcohol-related problems.
The results show that the majority of problems The results show that the majority of problems were accounted for by HED, a highly prevalent were accounted for by HED, a highly prevalent drinking behavior among adolescents that should drinking behavior among adolescents that should be targeted with population strategies as well as be targeted with population strategies as well as personalized interventions when possible.personalized interventions when possible.

www.aodhealth.orgwww.aodhealth.org 1818
Feldman HS, et al. Feldman HS, et al. Alcohol Clin Exp Res.Alcohol Clin Exp Res. 2012;36(4):670– 2012;36(4):670–676.676.
Summary by Kevin L. Kraemer, MD, MScSummary by Kevin L. Kraemer, MD, MSc
Pattern and Timing of Pattern and Timing of Prenatal Alcohol Exposure Prenatal Alcohol Exposure Is Associated with Specific Is Associated with Specific
Alcohol-Related Birth Alcohol-Related Birth Defects and Growth Defects and Growth
DeficienciesDeficiencies

www.aodhealth.orgwww.aodhealth.org 1919
Objectives/MethodsObjectives/Methods The association between pattern and timing of The association between pattern and timing of
prenatal alcohol exposure and specific alcohol-prenatal alcohol exposure and specific alcohol-related birth defects and growth deficiencies is related birth defects and growth deficiencies is uncertain.uncertain.
Researchers analyzed alcohol-consumption data Researchers analyzed alcohol-consumption data from 992 pregnant women* enrolled between from 992 pregnant women* enrolled between 1978–2005 in the California Teratogen Information 1978–2005 in the California Teratogen Information Service and Clinical Research Program. Service and Clinical Research Program.
Alcohol-consumption quantity and frequency were Alcohol-consumption quantity and frequency were assessed every 3 months during pregnancy. Live-assessed every 3 months during pregnancy. Live-born singleton infants underwent examination by a born singleton infants underwent examination by a dysmorphologist who was blinded to prenatal dysmorphologist who was blinded to prenatal exposures.exposures.
*Mean age, 31 years; 54% were white, and the mean gestational age at *Mean age, 31 years; 54% were white, and the mean gestational age at enrollment was 13 weeks.enrollment was 13 weeks.
www.aodhealth.orgwww.aodhealth.org
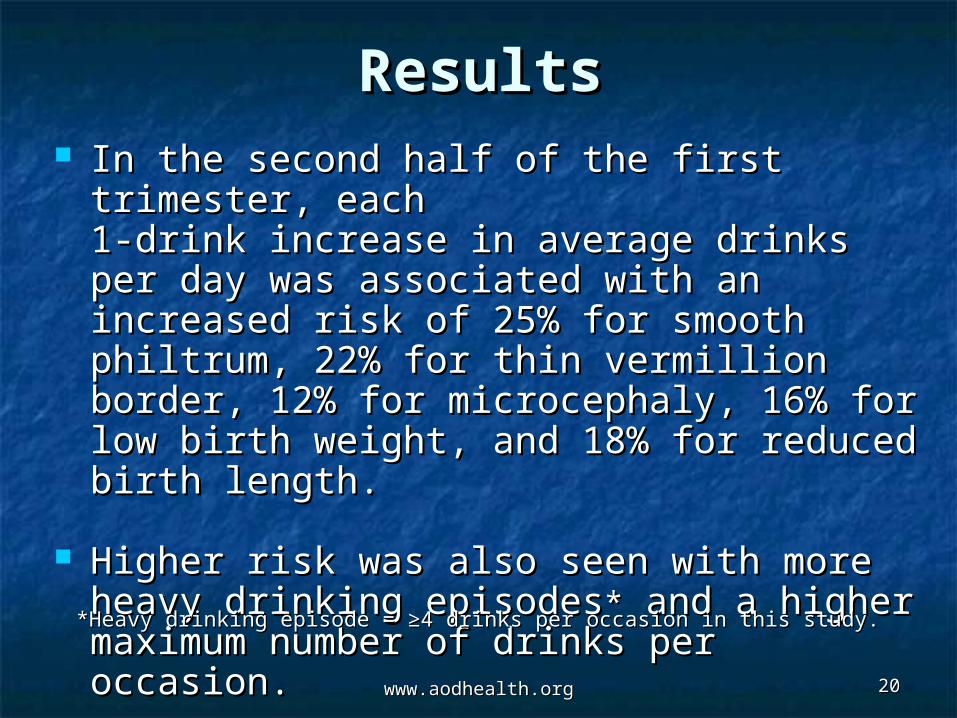
ResultsResults In the second half of the first trimester, In the second half of the first trimester,
each each 1-drink increase in average drinks per day 1-drink increase in average drinks per day was associated with an increased risk of was associated with an increased risk of 25% for smooth philtrum, 22% for thin 25% for smooth philtrum, 22% for thin vermillion border, 12% for microcephaly, vermillion border, 12% for microcephaly, 16% for low birth weight, and 18% for 16% for low birth weight, and 18% for reduced birth length.reduced birth length.
Higher risk was also seen with more heavy Higher risk was also seen with more heavy drinking episodesdrinking episodes** and a higher maximum and a higher maximum number of drinks per occasion.number of drinks per occasion.
2020
*Heavy drinking episode = ≥4 drinks per occasion in this study.*Heavy drinking episode = ≥4 drinks per occasion in this study.

www.aodhealth.orgwww.aodhealth.org
ResultsResults (cont’d) (cont’d) In the second trimester, higher average drinks In the second trimester, higher average drinks
per day and number of heavy drinking episodes per day and number of heavy drinking episodes were associated with greater risk for smooth were associated with greater risk for smooth philtrum and reduced birth weight and length, philtrum and reduced birth weight and length, and higher maximum drinks per occasion was and higher maximum drinks per occasion was associated with increased risk for smooth associated with increased risk for smooth philtrum and reduced birth length.philtrum and reduced birth length.
In the third trimester, higher average drinks per In the third trimester, higher average drinks per day was associated with reduced birth length, day was associated with reduced birth length, and higher maximum drinks per occasion was and higher maximum drinks per occasion was associated with greater risk for smooth philtrum associated with greater risk for smooth philtrum and reduced birth length.and reduced birth length.
Models (not included in the paper) did not show Models (not included in the paper) did not show a lower alcohol use threshold of no risk.a lower alcohol use threshold of no risk.
2121
www.aodhealth.orgwww.aodhealth.org 2222
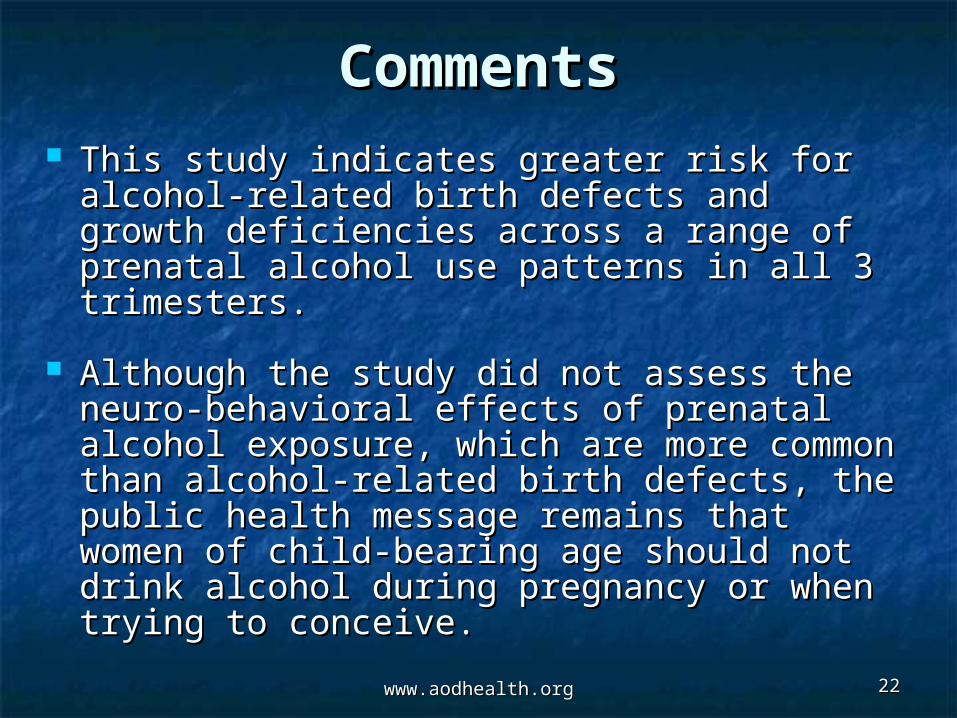
CommentsComments This study indicates greater risk for This study indicates greater risk for
alcohol-related birth defects and growth alcohol-related birth defects and growth deficiencies across a range of prenatal deficiencies across a range of prenatal alcohol use patterns in all 3 trimesters.alcohol use patterns in all 3 trimesters.
Although the study did not assess the Although the study did not assess the neuro-behavioral effects of prenatal alcohol neuro-behavioral effects of prenatal alcohol exposure, which are more common than exposure, which are more common than alcohol-related birth defects, the public alcohol-related birth defects, the public health message remains that women of health message remains that women of child-bearing age should not drink alcohol child-bearing age should not drink alcohol during pregnancy or when trying to during pregnancy or when trying to conceive.conceive.
www.aodhealth.orgwww.aodhealth.org 2323
Au Yeung SL, et al. Au Yeung SL, et al. Am J Epidemiol.Am J Epidemiol. February 1, 2012 February 1, 2012 [Epub ahead of print]; doi:10.1093/aje/kwr462.[Epub ahead of print]; doi:10.1093/aje/kwr462.
Summary by R. Curtis Ellison, MDSummary by R. Curtis Ellison, MD
No Association between No Association between Moderate Alcohol Intake and Moderate Alcohol Intake and
Improved Cognitive Functioning Improved Cognitive Functioning Seen in a Large Cohort Study Seen in a Large Cohort Study
Using Innovative MethodsUsing Innovative Methods
2424
Objectives/MethodsObjectives/Methods
Most prospective observational studies have Most prospective observational studies have shown that moderate alcohol use is shown that moderate alcohol use is associated with slightly better cognitive associated with slightly better cognitive function. function.
However, there is always concern about However, there is always concern about confounding from other lifestyle factors (i.e. confounding from other lifestyle factors (i.e. the better function being a result of the better function being a result of something unrelated to drinking). something unrelated to drinking).
2525
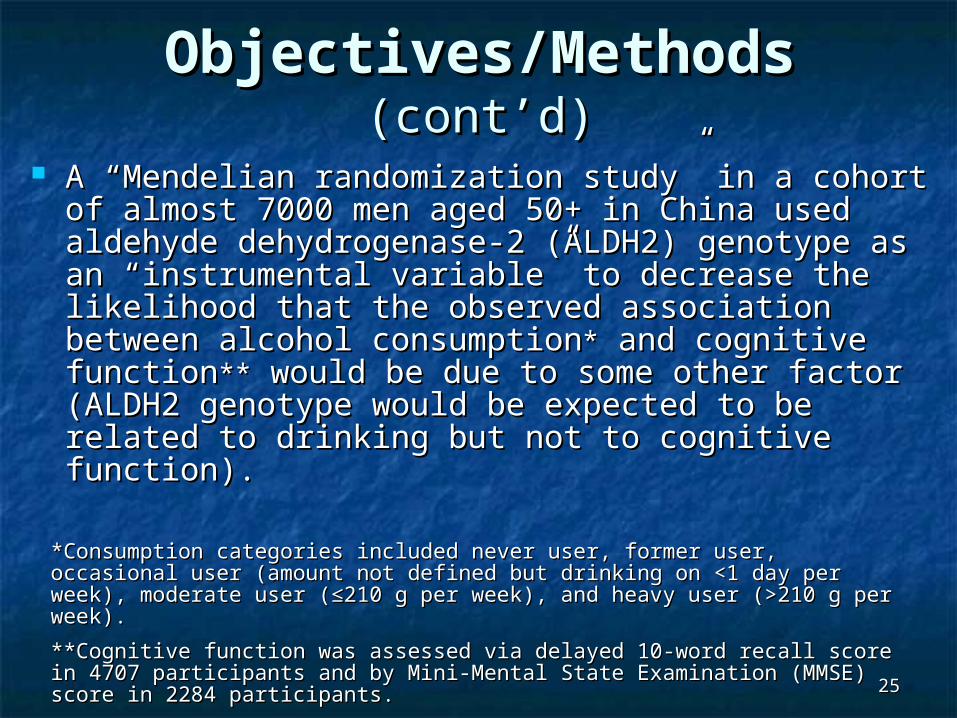
Objectives/MethodsObjectives/Methods (cont’d)(cont’d)
A “Mendelian randomization study” in a cohort A “Mendelian randomization study” in a cohort of almost 7000 men aged 50+ in China used of almost 7000 men aged 50+ in China used aldehyde dehydrogenase-2 (ALDH2) genotype aldehyde dehydrogenase-2 (ALDH2) genotype as an “instrumental variable” to decrease the as an “instrumental variable” to decrease the likelihood that the observed association likelihood that the observed association between alcohol consumptionbetween alcohol consumption** and cognitive and cognitive functionfunction**** would be due to some other factor would be due to some other factor (ALDH2 genotype would be expected to be (ALDH2 genotype would be expected to be related to drinking but not to cognitive function).related to drinking but not to cognitive function).
*Consumption categories included never user, former user, occasional user *Consumption categories included never user, former user, occasional user (amount not defined but drinking on <1 day per week), moderate user (≤210 g (amount not defined but drinking on <1 day per week), moderate user (≤210 g per week), and heavy user (>210 g per week).per week), and heavy user (>210 g per week).
**Cognitive function was assessed via delayed 10-word recall score in 4707 **Cognitive function was assessed via delayed 10-word recall score in 4707 participants and by Mini-Mental State Examination (MMSE) score in 2284 participants and by Mini-Mental State Examination (MMSE) score in 2284 participants.participants.
2626www.aodhealth.orgwww.aodhealth.org
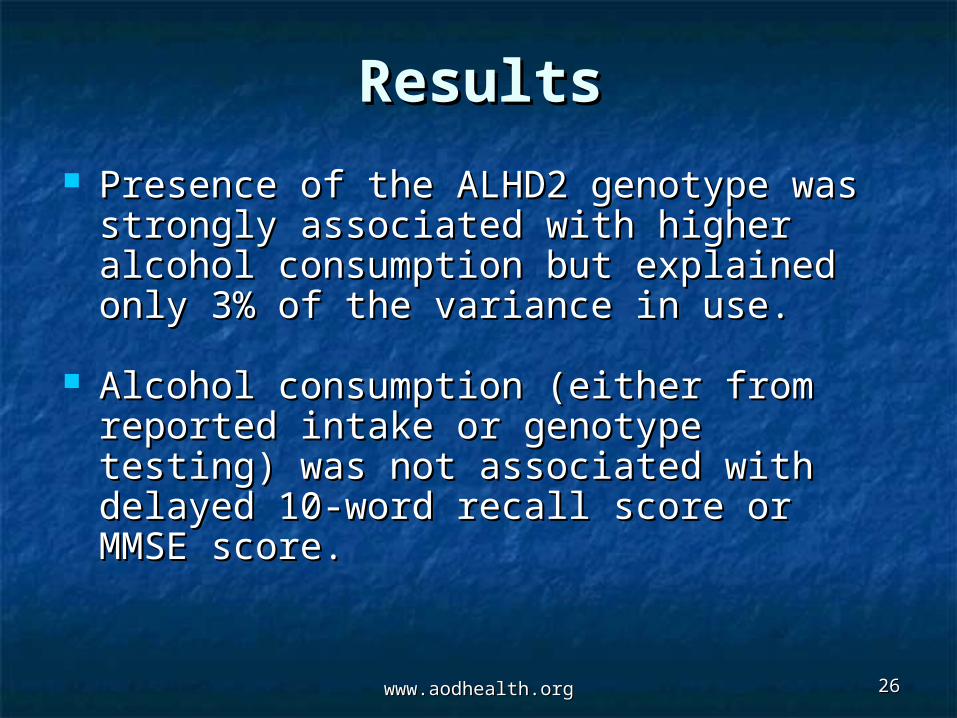
ResultsResults
Presence of the ALHD2 genotype was Presence of the ALHD2 genotype was strongly associated with higher alcohol strongly associated with higher alcohol consumption but explained only 3% of consumption but explained only 3% of the variance in use.the variance in use.
Alcohol consumption (either from Alcohol consumption (either from reported intake or genotype testing) was reported intake or genotype testing) was not associated with delayed 10-word not associated with delayed 10-word recall score or MMSE score. recall score or MMSE score.

www.aodhealth.orgwww.aodhealth.org 2727
CommentsComments This study showed little effect of reported This study showed little effect of reported
alcohol intake on cognitive function. alcohol intake on cognitive function.
It is unfortunate that the authors did not It is unfortunate that the authors did not use measures of cognitive functioning use measures of cognitive functioning shown to be more accurate (e.g., the shown to be more accurate (e.g., the Montreal Cognitive Assessment) or Montreal Cognitive Assessment) or measures that adjust for education and measures that adjust for education and socioeconomic status (e.g., the Wechsler socioeconomic status (e.g., the Wechsler Adult Intelligence Scale). Adult Intelligence Scale).
In addition, the primary beverage In addition, the primary beverage consumed in the cohort was rice wine, consumed in the cohort was rice wine, which contains no polyphenols. which contains no polyphenols.

www.aodhealth.orgwww.aodhealth.org 2828
CommentsComments (cont’d) (cont’d)
Although Mendelian randomization Although Mendelian randomization techniques are designed to offer unbiased techniques are designed to offer unbiased estimates of effect, the instrumental estimates of effect, the instrumental variable used should have a strong variable used should have a strong correlation with the outcome (i.e., alcohol correlation with the outcome (i.e., alcohol consumption); in this study, it did not.consumption); in this study, it did not.
As stated by the authors, causality should As stated by the authors, causality should be verified in a variety of settings using be verified in a variety of settings using different kinds of evidence, including different kinds of evidence, including experimental or genetic studies, rather experimental or genetic studies, rather than relying on observational studies.than relying on observational studies.

www.aodhealth.orgwww.aodhealth.org 2929
Studies on Studies on HIV and HCVHIV and HCV

www.aodhealth.orgwww.aodhealth.org 3030
In the US, Deaths from HCV In the US, Deaths from HCV Now Exceed Those from HIVNow Exceed Those from HIV
Ly KN, et alLy KN, et al. . Ann Intern Med.Ann Intern Med. 2012;156(4): 271–278. 2012;156(4): 271–278.Summary by Summary by Judith Tsui, MD, MPHJudith Tsui, MD, MPH
3131
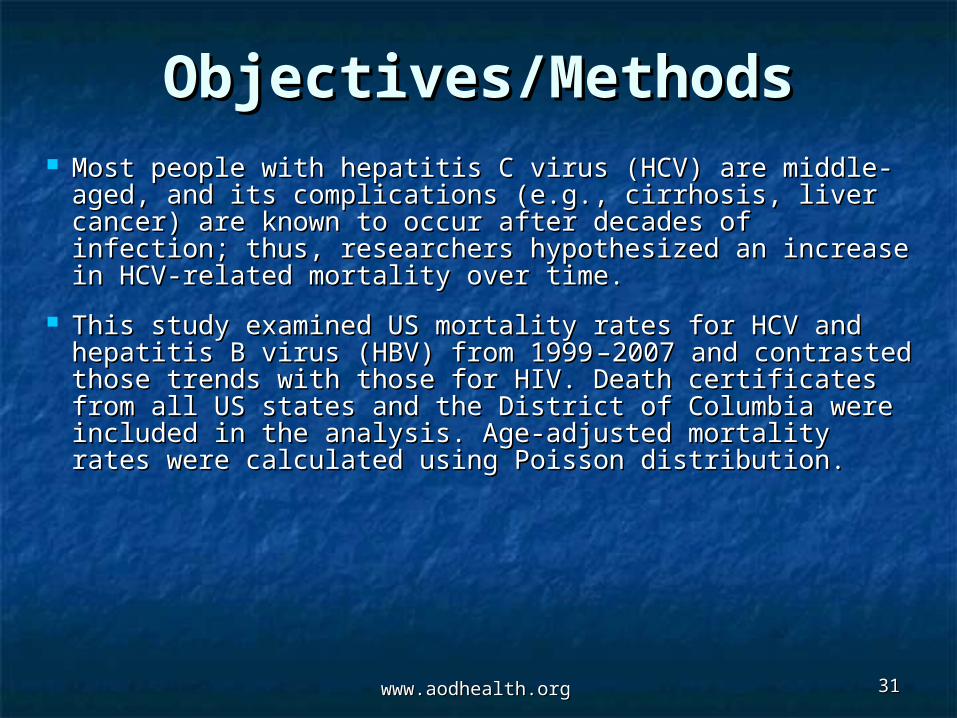
Objectives/MethodsObjectives/Methods Most people with hepatitis C virus (HCV) are middle-Most people with hepatitis C virus (HCV) are middle-
aged, and its complications (e.g., cirrhosis, liver cancer) aged, and its complications (e.g., cirrhosis, liver cancer) are known to occur after decades of infection; thus, are known to occur after decades of infection; thus, researchers hypothesized an increase in HCV-related researchers hypothesized an increase in HCV-related mortality over time. mortality over time.
This study examined US mortality rates for HCV and This study examined US mortality rates for HCV and hepatitis B virus (HBV) from 1999hepatitis B virus (HBV) from 1999 –2007 and contrasted –2007 and contrasted those trends with those for HIV. Death certificates from those trends with those for HIV. Death certificates from all US states and the District of Columbia were included all US states and the District of Columbia were included in the analysis. Age-adjusted mortality rates were in the analysis. Age-adjusted mortality rates were calculated using Poisson distribution. calculated using Poisson distribution.
www.aodhealth.orgwww.aodhealth.org
www.aodhealth.orgwww.aodhealth.org 3232
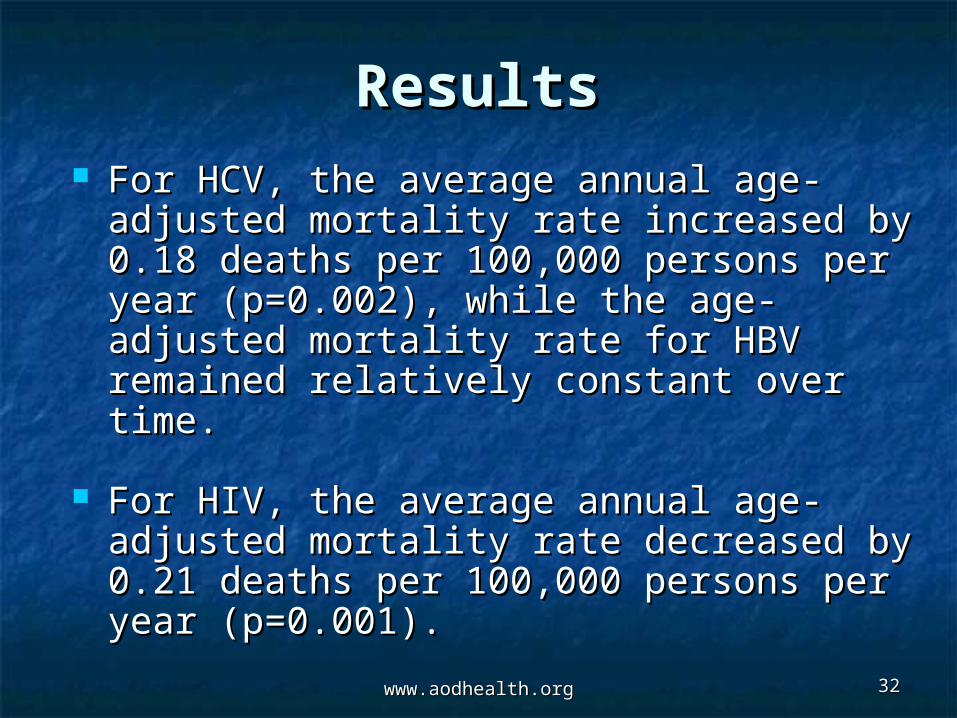
ResultsResults For HCV, the average annual age-adjusted For HCV, the average annual age-adjusted
mortality rate increased by 0.18 deaths per mortality rate increased by 0.18 deaths per 100,000 persons per year (p=0.002), while 100,000 persons per year (p=0.002), while the age-adjusted mortality rate for HBV the age-adjusted mortality rate for HBV remained relatively constant over time.remained relatively constant over time.
For HIV, the average annual age-adjusted For HIV, the average annual age-adjusted mortality rate decreased by 0.21 deaths per mortality rate decreased by 0.21 deaths per 100,000 persons per year (p=0.001).100,000 persons per year (p=0.001).
www.aodhealth.orgwww.aodhealth.org 3333
ResultsResults (cont’d) (cont’d)
Before 2007, the number of deaths from HIV Before 2007, the number of deaths from HIV exceeded those from HCV and HBV. After exceeded those from HCV and HBV. After 2007, the number of deaths from HCV 2007, the number of deaths from HCV (15,106) exceeded those from HIV (12,734) (15,106) exceeded those from HIV (12,734) and HBV (1815).and HBV (1815).
Most deaths from HCV were among people Most deaths from HCV were among people aged 45–65, with alcohol being the third aged 45–65, with alcohol being the third most common comorbid condition for most common comorbid condition for deaths from HCV (after chronic liver disease deaths from HCV (after chronic liver disease and HBV coinfection).and HBV coinfection).
www.aodhealth.orgwww.aodhealth.org 3434
CommentsComments
As of 2007, HCV superseded HIV as a As of 2007, HCV superseded HIV as a cause of death in the US. Alcohol is an cause of death in the US. Alcohol is an important co-factor for many HCV-related important co-factor for many HCV-related deaths, and injection drug use is a major deaths, and injection drug use is a major risk factor for contracting HCV.risk factor for contracting HCV.
Use of death-certificate data for cause of Use of death-certificate data for cause of death was a limitation in this study; death was a limitation in this study; however, this is less of problem when however, this is less of problem when analyzing trends since biases should be analyzing trends since biases should be relatively constant over time.relatively constant over time.

www.aodhealth.orgwww.aodhealth.org 3535
Increased Risk of Overdose Increased Risk of Overdose Death among People with HIV Death among People with HIV
InfectionInfection
Green TC, et al. Green TC, et al. AIDS. AIDS. 2012;26(4):403–417.2012;26(4):403–417.Summary by Alexander Y. Walley, MD, MScSummary by Alexander Y. Walley, MD, MSc

www.aodhealth.orgwww.aodhealth.org 3636
Objectives/MethodsObjectives/Methods
Injection drug use (IDU) and HIV infection Injection drug use (IDU) and HIV infection are overlapping epidemics, and overdose is are overlapping epidemics, and overdose is the most common cause of death among the most common cause of death among people with IDU.people with IDU.
Researchers conducted a meta-analysis and Researchers conducted a meta-analysis and systematic review to assess the relationship systematic review to assess the relationship between overdose and HIV infection. between overdose and HIV infection. Twenty-seven studies were found containing Twenty-seven studies were found containing enough information to calculate the relative enough information to calculate the relative risk of overdose death by HIV infection risk of overdose death by HIV infection status. Twenty-four of the studies status. Twenty-four of the studies determined HIV status via biological testing.determined HIV status via biological testing.

www.aodhealth.orgwww.aodhealth.org 3737
Results Results For the meta-analysis, the pooled relative risk For the meta-analysis, the pooled relative risk
of overdose death for HIV-infected people of overdose death for HIV-infected people (compared with those not infected) was 1.60 in (compared with those not infected) was 1.60 in all studies and 1.74 in the 24 studies with all studies and 1.74 in the 24 studies with biological testing. For the 16 studies including biological testing. For the 16 studies including only people with IDU, the relative risk was 1.48.only people with IDU, the relative risk was 1.48.
Potential causal mechanisms for overdose Potential causal mechanisms for overdose identified in the systematic review included identified in the systematic review included reduced pulmonary function, reduced hepatic reduced pulmonary function, reduced hepatic function, and high-risk behaviors. Protective function, and high-risk behaviors. Protective factors included enrollment in opioid agonist factors included enrollment in opioid agonist treatment, while poverty and incarceration treatment, while poverty and incarceration were associated with increased overdose risk.were associated with increased overdose risk.
www.aodhealth.orgwww.aodhealth.org 3838
CommentsComments Despite substantial heterogeneity in study Despite substantial heterogeneity in study
designs, this meta-analysis confirmed that designs, this meta-analysis confirmed that people with HIV infection have a higher people with HIV infection have a higher risk of overdose death than those not risk of overdose death than those not infected with HIV.infected with HIV.
Because all overdoses are preventable, Because all overdoses are preventable, HIV care providers should educate patients HIV care providers should educate patients with IDU on how to prevent, recognize, and with IDU on how to prevent, recognize, and respond to an overdose. respond to an overdose.
www.aodhealth.orgwww.aodhealth.org 3939
O'Leary MC, et al. O'Leary MC, et al. Drug Alcohol Depend.Drug Alcohol Depend. November 30, November 30, 2011 [Epub ahead of print]; 2011 [Epub ahead of print];
doi:10.1016/j.drugalcdep.2011.11.008.doi:10.1016/j.drugalcdep.2011.11.008.Summary by Daniel Fuster, MD, PhD, & Richard Saitz, Summary by Daniel Fuster, MD, PhD, & Richard Saitz,
MD, MPHMD, MPH
Knowledge of Positive HCV Knowledge of Positive HCV Status ReducedStatus Reduced Alcohol Alcohol
Consumption in People with Consumption in People with Injection Drug UseInjection Drug Use
www.aodhealth.orgwww.aodhealth.org 4040
Objectives/MethodsObjectives/Methods Patients infected with hepatitis C virus (HCV) Patients infected with hepatitis C virus (HCV)
are encouraged to abstain from drinking, as are encouraged to abstain from drinking, as heavy alcohol use increases the risk of end-heavy alcohol use increases the risk of end-stage liver disease and decreases the likelihood stage liver disease and decreases the likelihood of response to HCV antiviral therapy.of response to HCV antiviral therapy.
Investigators from Glasgow, Scotland, Investigators from Glasgow, Scotland, performed a cross-sectional survey to determine performed a cross-sectional survey to determine whether people with injection drug use (IDU) whether people with injection drug use (IDU) attending harm-reduction services adhered to attending harm-reduction services adhered to lower risk drinking guidelines. Ninety-seven lower risk drinking guidelines. Ninety-seven percent of respondents (n=780) provided an percent of respondents (n=780) provided an anonymous oral fluid sample for HCV detection.anonymous oral fluid sample for HCV detection.
www.aodhealth.orgwww.aodhealth.org 4141
ResultsResults Of those who submitted fluid samples, 506 Of those who submitted fluid samples, 506
(65%) tested positive for HCV; 277 of those (65%) tested positive for HCV; 277 of those who tested positive were unaware of their who tested positive were unaware of their HCV status or had self-reported as HCV-HCV status or had self-reported as HCV-negative.negative.
Among participants who tested positive, Among participants who tested positive, 65% drank alcohol, and 29% drank risky 65% drank alcohol, and 29% drank risky amounts.amounts.**
Among participants who tested negative, Among participants who tested negative, 61% drank alcohol, and 18% drank risky 61% drank alcohol, and 18% drank risky amounts.amounts.
*Risky amounts were defined in this study as >14 (8 g ethanol) units per week *Risky amounts were defined in this study as >14 (8 g ethanol) units per week for women and >21 units per week for men.for women and >21 units per week for men.
www.aodhealth.orgwww.aodhealth.org 4242
ResultsResults (cont’d) (cont’d)
People with IDU who self-reported being People with IDU who self-reported being infected with HCV were less likely to drink infected with HCV were less likely to drink than those who self-reported as HCV than those who self-reported as HCV negative or “status not known” (adjusted negative or “status not known” (adjusted odd ratio, 0.70).odd ratio, 0.70).
The proportion of participants who drank The proportion of participants who drank any amount was lower than that in the any amount was lower than that in the Scottish general population; however, the Scottish general population; however, the proportion who drank risky amounts was proportion who drank risky amounts was similar to that in the general population similar to that in the general population among men and slightly higher among among men and slightly higher among women.women.

www.aodhealth.orgwww.aodhealth.org 4343
CommentsComments This cross-sectional study found a high This cross-sectional study found a high
proportion of HCV-infected patients with IDU proportion of HCV-infected patients with IDU in Scotland not only drink but also drink risky in Scotland not only drink but also drink risky amounts, putting themselves at increased risk amounts, putting themselves at increased risk for end-stage liver disease and death.for end-stage liver disease and death.
Furthermore, many people with IDU were Furthermore, many people with IDU were unaware of their HCV status, while those who unaware of their HCV status, while those who were aware drank less than others. These were aware drank less than others. These results stress the need to implement results stress the need to implement measures aimed at detecting HCV infection in measures aimed at detecting HCV infection in people with IDU and making them aware of people with IDU and making them aware of the risks associated with alcohol consumption.the risks associated with alcohol consumption.

www.aodhealth.orgwww.aodhealth.org 4444
Knowledge of Positive HCV Knowledge of Positive HCV Status Does Not Decrease Status Does Not Decrease Risky Behaviors in People Risky Behaviors in People
Who Inject DrugsWho Inject Drugs
Korthuis PT, et al.Korthuis PT, et al. Addict Behav. Addict Behav. 2012;37(4):552–555.2012;37(4):552–555.Summary by Darius A. Rastegar, MDSummary by Darius A. Rastegar, MD
www.aodhealth.orgwww.aodhealth.org 4545
Objectives/MethodsObjectives/Methods In this secondary analysis of data from a trial In this secondary analysis of data from a trial
comparing strategies to increase HIV testing, comparing strategies to increase HIV testing, researchers investigated the association between researchers investigated the association between self-reported awareness of HCV infection status self-reported awareness of HCV infection status and injection-drug risk behaviors.and injection-drug risk behaviors.
Subjects included 1281 people enrolled in Subjects included 1281 people enrolled in substance abuse treatment who reported either substance abuse treatment who reported either unknown or negative HIV status at baseline.unknown or negative HIV status at baseline.
The 244 subjects who also reported injection The 244 subjects who also reported injection drug use in the past 6 months were included in drug use in the past 6 months were included in this analysis.this analysis.
www.aodhealth.orgwww.aodhealth.org 4646
Results Results Ninety-two subjects (38%) reported being Ninety-two subjects (38%) reported being
HCV positive, 55 (23%) reported being HCV positive, 55 (23%) reported being HCV negative, and 97 (40%) reported HCV negative, and 97 (40%) reported their HCV status was unknown. their HCV status was unknown.
Compared with those whose HCV status Compared with those whose HCV status was negative or unknown, subjects who was negative or unknown, subjects who reported being HCV positive were older, reported being HCV positive were older, more likely to be women, more likely to more likely to be women, more likely to be enrolled in opioid agonist treatment, be enrolled in opioid agonist treatment, and less likely to have been recently and less likely to have been recently incarcerated.incarcerated.
www.aodhealth.orgwww.aodhealth.org 4747
ResultsResults (cont’d) (cont’d)
More than one-third of subjects (39%) More than one-third of subjects (39%) reported recent syringe/needle sharing. reported recent syringe/needle sharing.
In adjusted analyses, HCV-positive In adjusted analyses, HCV-positive subjects were more likely to have shared subjects were more likely to have shared syringes/ needles than subjects whose syringes/ needles than subjects whose HCV status was negative or unknown HCV status was negative or unknown (adjusted odds ratio, 2.37).(adjusted odds ratio, 2.37).
www.aodhealth.orgwww.aodhealth.org 4848
CommentsComments It is concerning that people who used injection It is concerning that people who used injection
drugs who knew they were HCV positive were drugs who knew they were HCV positive were more likely to engage in risky behaviors.more likely to engage in risky behaviors.
It is likely that subjects who get tested and are It is likely that subjects who get tested and are infected with HCV engaged in more risky infected with HCV engaged in more risky behaviors at baseline, and while they may well behaviors at baseline, and while they may well have reduced their risky behaviors after have reduced their risky behaviors after learning of their infection, they nevertheless learning of their infection, they nevertheless have higher rates than those who are not have higher rates than those who are not infected or who do not know if they are infected or who do not know if they are infected. infected.
These results suggest increased testing alone These results suggest increased testing alone will not be sufficient to prevent new HCV will not be sufficient to prevent new HCV infections.infections.