Embed Size (px)
Citation preview

www.bea.gov
Integrated Industry-Level Production Account for the United
States: Intellectual Property Products
and the 2007 NAICSMatthew Russell, Jon D. Samuels, Erich H. Strassner
(BEA)
Steven Rosenthal, Lisa Usher (BLS)
3rd World KLEMS ConferenceMay 19, 2014

www.bea.gov 2
Motivation
▪ Long-standing call for statistics on the sources of growth Solow (1957), Denison (1967), Griliches and Jorgenson
(1967) Postwar Recovery, Big Slump, IT Boom, the Great
Recession “… differences between the BEA and BLS estimates have
led many researchers to construct their own measures …” -Jorgenson and Landefeld (2006) in A New Architecture for the U.S. National Accounts
▪ The Advisory Committee on Measuring Innovation in the 21st Century: A Report to the Secretary of Commerce (January 2008) “Develop annual, industry-level measures of total factor
productivity ...”

www.bea.gov
Productivity statistics integrated with GDP
▪ This project: Incorporates comprehensive revision of U.S. National Accounts R&D and entertainment originals capital
▪ Results on sources of growth 1998-2012: R&D capital contributed about ½ as much as
software capital over the 1998-2012 period Much of the contribution of R&D capital comes
from R&D intensive industries Including R&D and entertainment originals
reduces growth rate of MFP from 0.51% to 0.44% per year
3

www.bea.gov
Productivity statistics integrated with GDP
▪ Analysis of the ongoing recovery
The smaller contribution of capital input relative to the pre-crisis period more than accounts for the slower growth during the recovery
Non-college labor contributes positively in contrast to negative contributions in the pre-crisis and crisis periods
4

www.bea.gov
Aggregate results: VA growth decomposition 1998-2012
5

www.bea.gov
Aggregate results: Sources of growth by sub period
6

www.bea.gov
From aggregate to Industry sources of growth analysis
Requires an industry-level production account Industry-level outputs and inputs in current and
constant prices
Symmetric treatment of outputs, intermediate inputs, and primary inputs
Consistent with aggregate GDP constructed within an Input-Output Framework Gross output, intermediate input, value added: BEA Capital input: BLS, based on BEA Fixed Assets Labor input: Hours from BLS, Composition from BEA
7
Q P Q P Q P Q P Q P Q PY Y K K L L X X VA VA X X

www.bea.gov
Gross output growth and sources
8

www.bea.gov
Gross output growth and sources—top 10
9

www.bea.gov
Industry origins of aggregate growth
▪From industry to aggregate:
Direct aggregation of industries (Jorgenson, Ho, Samuels, Stiroh, 2007) Contributions of industries to aggregate
value added growth Contributions of industries to the aggregate
contribution of capital and labor inputs Contributions of industries to aggregate
MFP growth
Compare industry sources of growth over the recovery period to the pre-crisis period
10

www.bea.gov
Contributions to aggregate VA by industry
11

www.bea.gov
Contributions to aggregate Capital by industry
12

www.bea.gov
Contributions to aggregate Labor by industry
13

www.bea.gov
Contributions to aggregate MFP by industry
14

www.bea.gov
Aggregate results: MFP growth decomposition
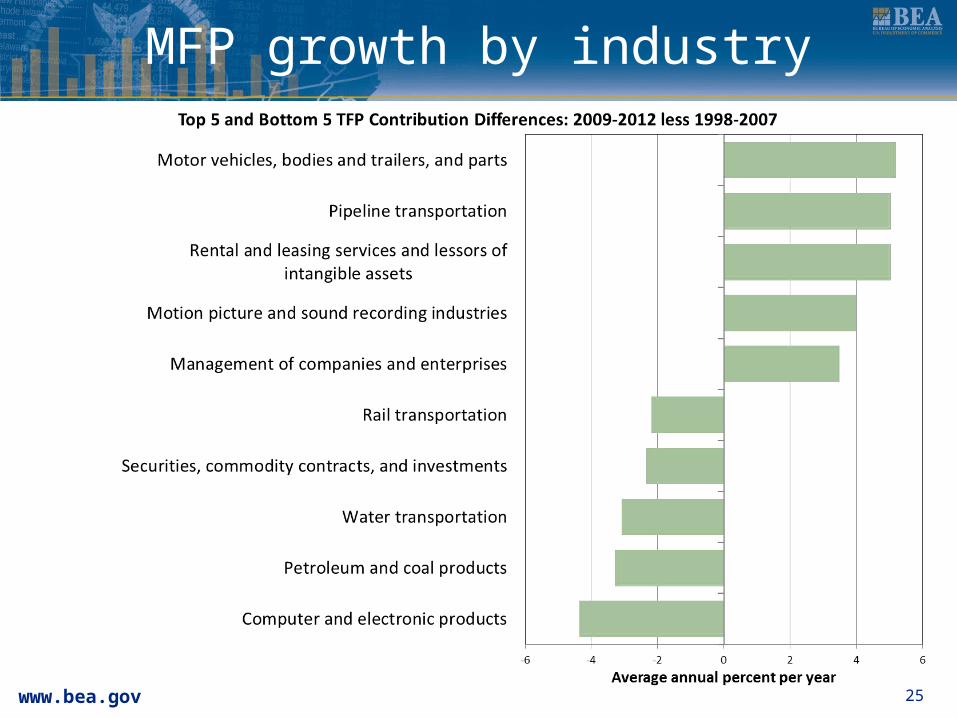
15▪ Computers and electronic products about 65% of aggregate
MFP growth!

www.bea.gov
Conclusions and next steps
▪ Findings: Between 1998-2012 R&D capital services contributed
about half as much as software capital services to GDP growth
Comparing ongoing recovery to 1998-2007: major difference is contribution of capital input, concentrated in housing, trade, banking and contribution of Noncollege labor has picked up
▪ Update plans … Explore alternative data sources for labor composition Incorporate methods into BEA systems Plan for regular updates, along with annual revisions Extend historical time series following JHS (2014)
16

www.bea.gov
Extra Slides
17
www.bea.gov
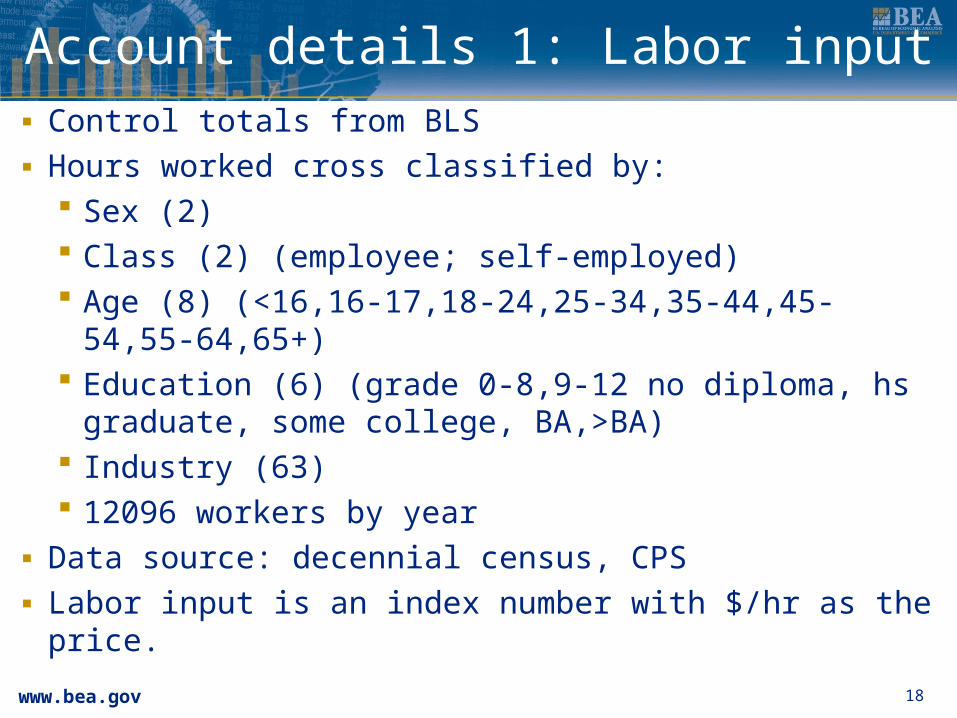
Account details 1: Labor input▪ Control totals from BLS▪ Hours worked cross classified by:
Sex (2) Class (2) (employee; self-employed) Age (8) (<16,16-17,18-24,25-34,35-44,45-54,55-
64,65+) Education (6) (grade 0-8,9-12 no diploma, hs
graduate, some college, BA,>BA) Industry (63) 12096 workers by year
▪ Data source: decennial census, CPS▪ Labor input is an index number with $/hr as the price.
18

www.bea.gov
Account details 2: Capital input
▪Productive stock and capital services from BLS
▪Capital input is index number of productive stocks by asset for each industry
▪Key concept: capital services prices are the imputed Jorgensonian user cost
▪86 asset types for fixed business equipment and software, structures, inventories, and land
19

www.bea.gov
Industry-level output and intermediate input
▪Source: BEA GDP-by-industry data 1998-2012
20

www.bea.gov
Industry-level capital input K services: BLS, based on BEA Fixed Assets
21

www.bea.gov
Industry-level capital input
22

www.bea.gov
Industry-level labor input Labor hours: BLS, based on BLS survey data Labor composition: BEA
23

www.bea.gov
Industry-level labor input
24
www.bea.gov
MFP growth by industry
25