Embed Size (px)
Citation preview
www.bioalgorithms.infoAn Introduction to Bioinformatics Algorithms
Clustering
An Introduction to Bioinformatics Algorithms www.bioalgorithms.info
Outline
• Microarrays• Hierarchical Clustering• K-Means Clustering• Corrupted Cliques Problem• CAST Clustering Algorithm
An Introduction to Bioinformatics Algorithms www.bioalgorithms.info
Applications of Clustering
• Viewing and analyzing vast amounts of biological data as a whole set can be perplexing
• It is easier to interpret the data if they are partitioned into clusters combining similar data points.
An Introduction to Bioinformatics Algorithms www.bioalgorithms.info
Inferring Gene Functionality• Researchers want to know the functions of newly
sequenced genes• Simply comparing the new gene sequences to
known DNA sequences often does not give away the function of gene
• For 40% of sequenced genes, functionality cannot be ascertained by only comparing to sequences of other known genes
• Microarrays allow biologists to infer gene function even when sequence similarity alone is insufficient to infer function.
An Introduction to Bioinformatics Algorithms www.bioalgorithms.info
Microarrays and Expression Analysis
• Microarrays measure the activity (expression level) of the genes under varying conditions/time points
• Expression level is estimated by measuring the amount of mRNA for that particular gene• A gene is active if it is being transcribed• More mRNA usually indicates more gene
activity
An Introduction to Bioinformatics Algorithms www.bioalgorithms.info
Microarray Experiments
• Produce cDNA from mRNA (DNA is more stable)• Attach phosphor to cDNA to see when a particular
gene is expressed• Different color phosphors are available to compare
many samples at once• Hybridize cDNA over the micro array• Scan the microarray with a phosphor-illuminating laser• Illumination reveals transcribed genes • Scan microarray multiple times for the different color
phosphor’s
An Introduction to Bioinformatics Algorithms www.bioalgorithms.info
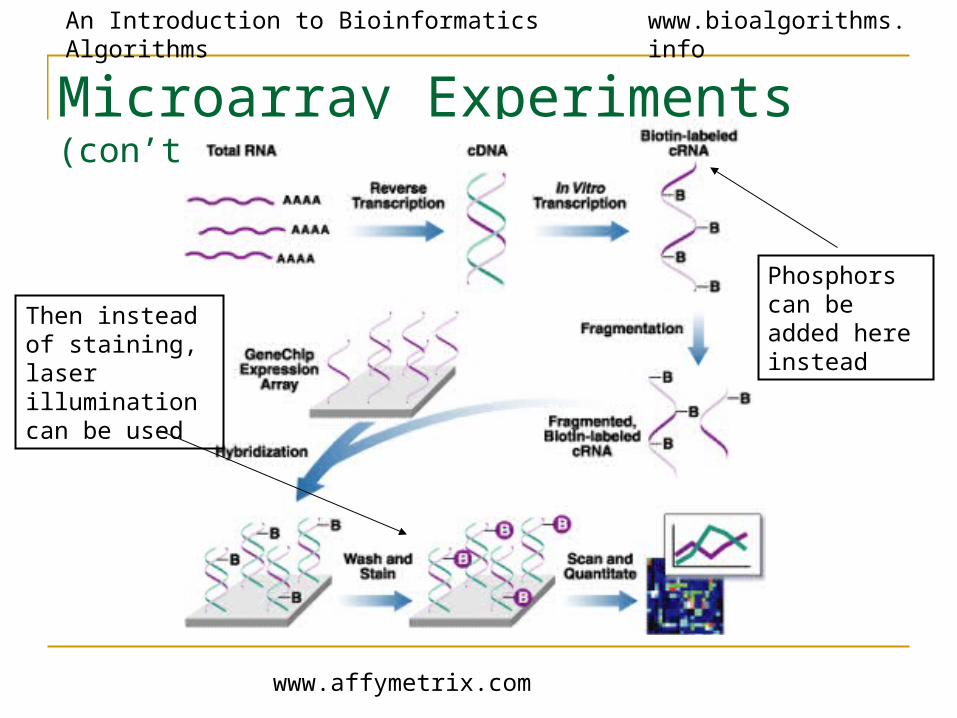
Microarray Experiments (con’t)
www.affymetrix.com
Phosphors can be added here instead
Then instead of staining, laser illumination can be used
An Introduction to Bioinformatics Algorithms www.bioalgorithms.info
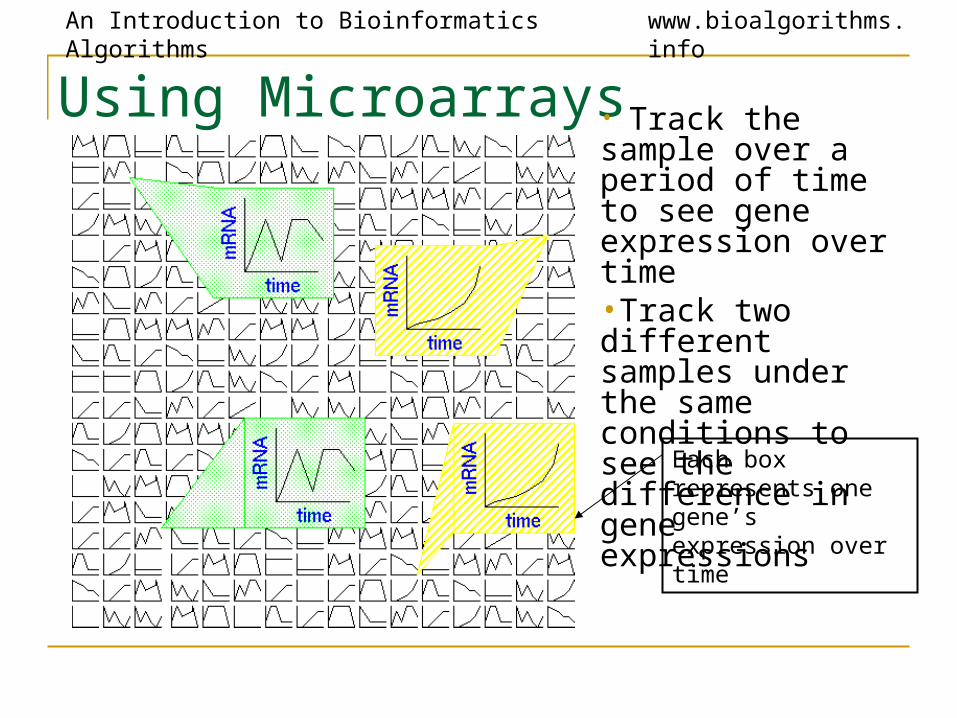
Using Microarrays
Each box represents one gene’s expression over time
• Track the sample over a period of time to see gene expression over time•Track two different samples under the same conditions to see the difference in gene expressions
An Introduction to Bioinformatics Algorithms www.bioalgorithms.info
Using Microarrays (cont’d)
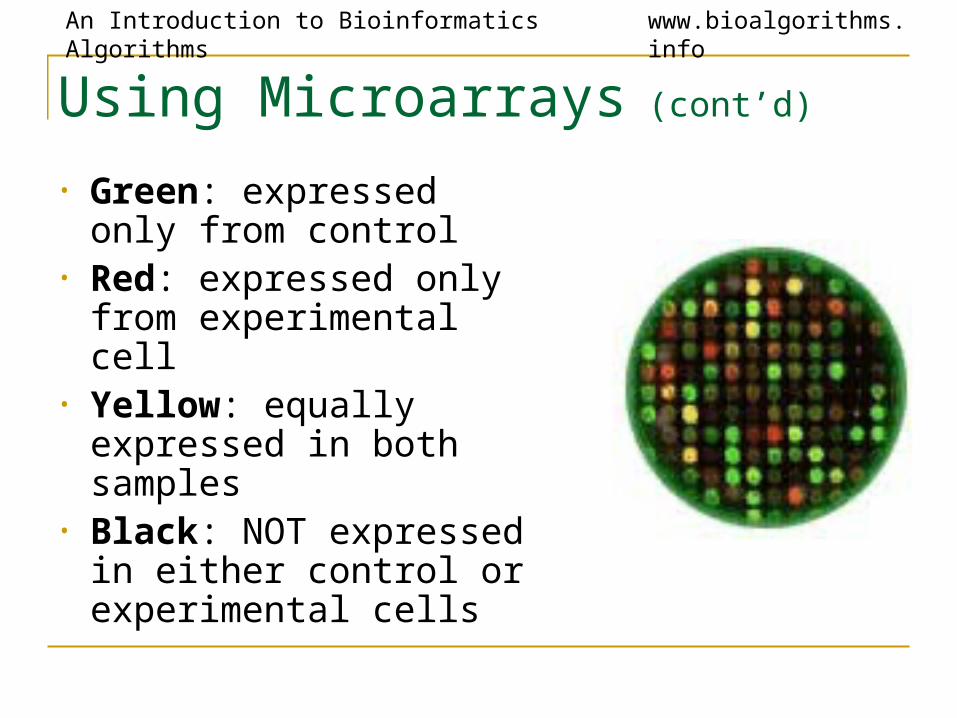
• Green: expressed only from control
• Red: expressed only from experimental cell
• Yellow: equally expressed in both samples
• Black: NOT expressed in either control or experimental cells
An Introduction to Bioinformatics Algorithms www.bioalgorithms.info
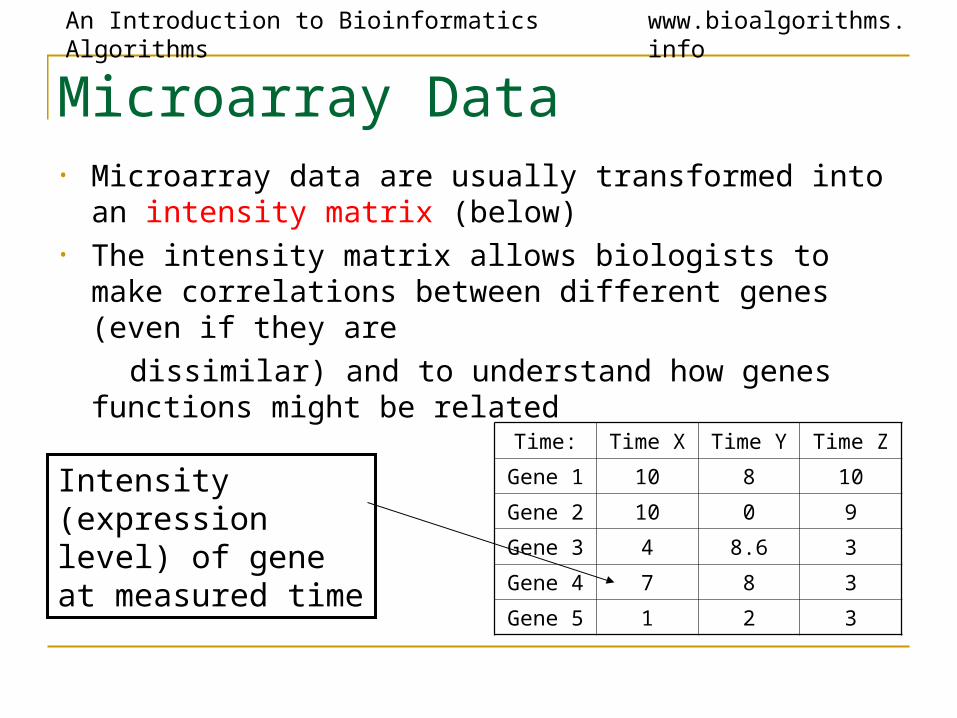
Microarray Data • Microarray data are usually transformed into an intensity
matrix (below)• The intensity matrix allows biologists to make
correlations between different genes (even if they are
dissimilar) and to understand how genes functions might be related
Time: Time X Time Y Time Z
Gene 1 10 8 10
Gene 2 10 0 9
Gene 3 4 8.6 3
Gene 4 7 8 3
Gene 5 1 2 3
Intensity (expression level) of gene at measured time
An Introduction to Bioinformatics Algorithms www.bioalgorithms.info
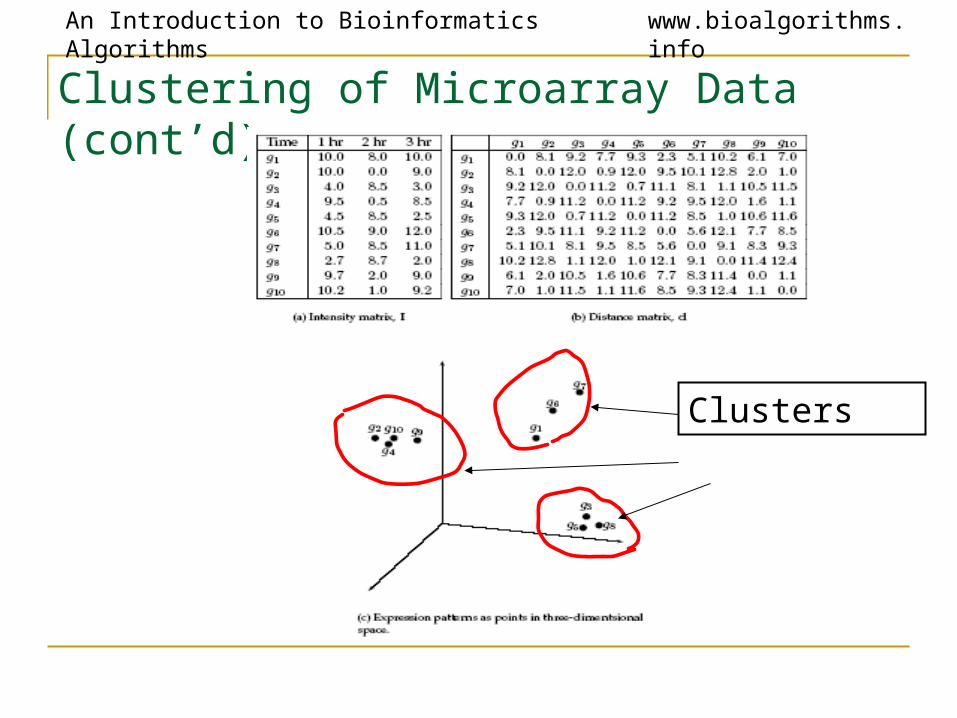
Clustering of Microarray Data • Plot each datum as a point in N-dimensional
space• Make a distance matrix for the distance
between every two gene points in the N-dimensional space
• Genes with a small distance share the same expression characteristics and might be functionally related or similar.
• Clustering reveal groups of functionally related genes
An Introduction to Bioinformatics Algorithms www.bioalgorithms.info
Clustering of Microarray Data (cont’d)
Clusters
An Introduction to Bioinformatics Algorithms www.bioalgorithms.info
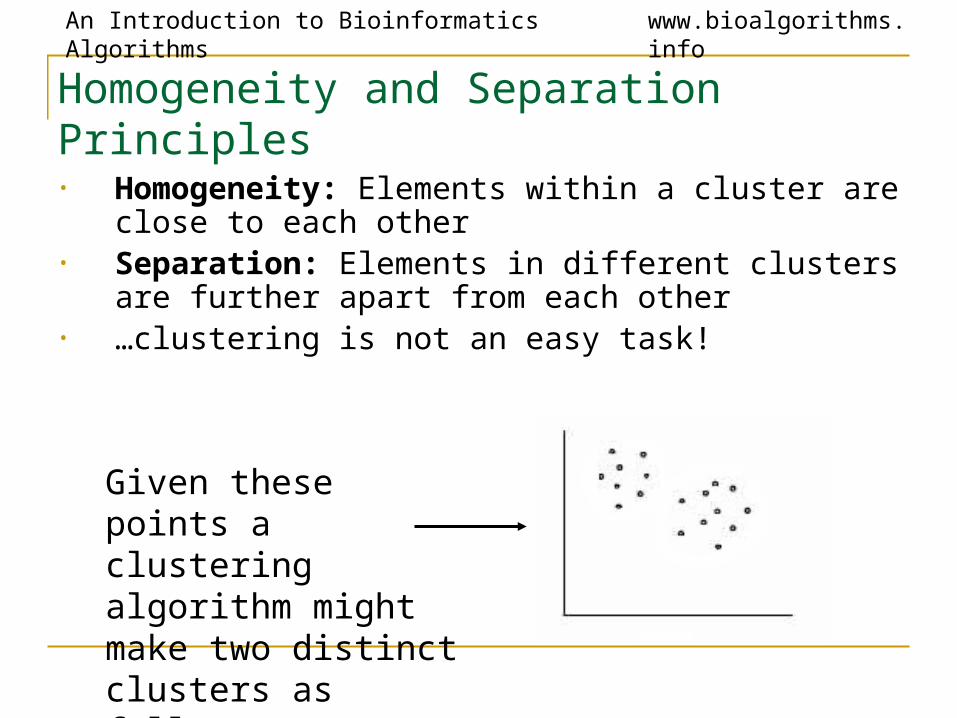
Homogeneity and Separation Principles
• Homogeneity: Elements within a cluster are close to each other
• Separation: Elements in different clusters are further apart from each other
• …clustering is not an easy task!
Given these points a clustering algorithm might make two distinct clusters as follows
An Introduction to Bioinformatics Algorithms www.bioalgorithms.info
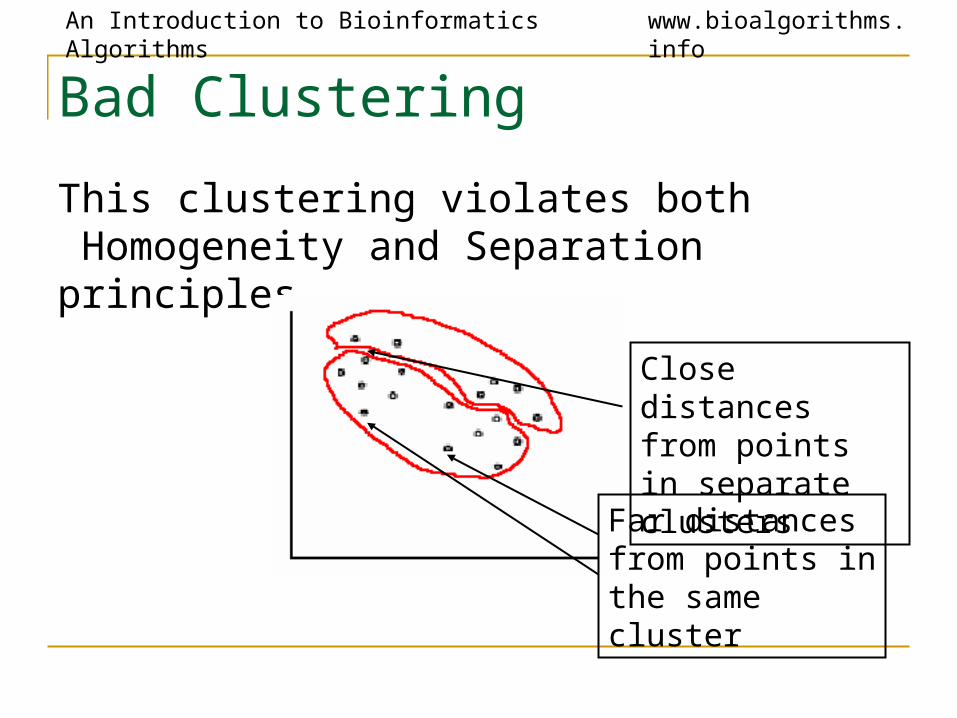
Bad Clustering
This clustering violates both Homogeneity and Separation principles
Close distances from points in separate clusters
Far distances from points in the same cluster
An Introduction to Bioinformatics Algorithms www.bioalgorithms.info
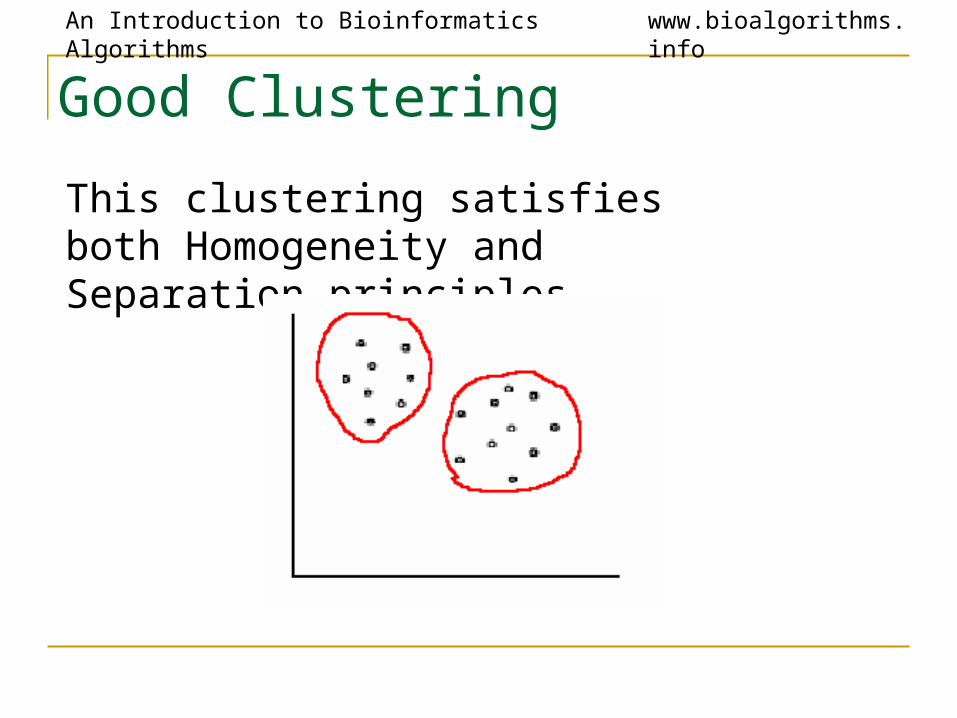
Good Clustering
This clustering satisfies both Homogeneity and Separation principles
An Introduction to Bioinformatics Algorithms www.bioalgorithms.info
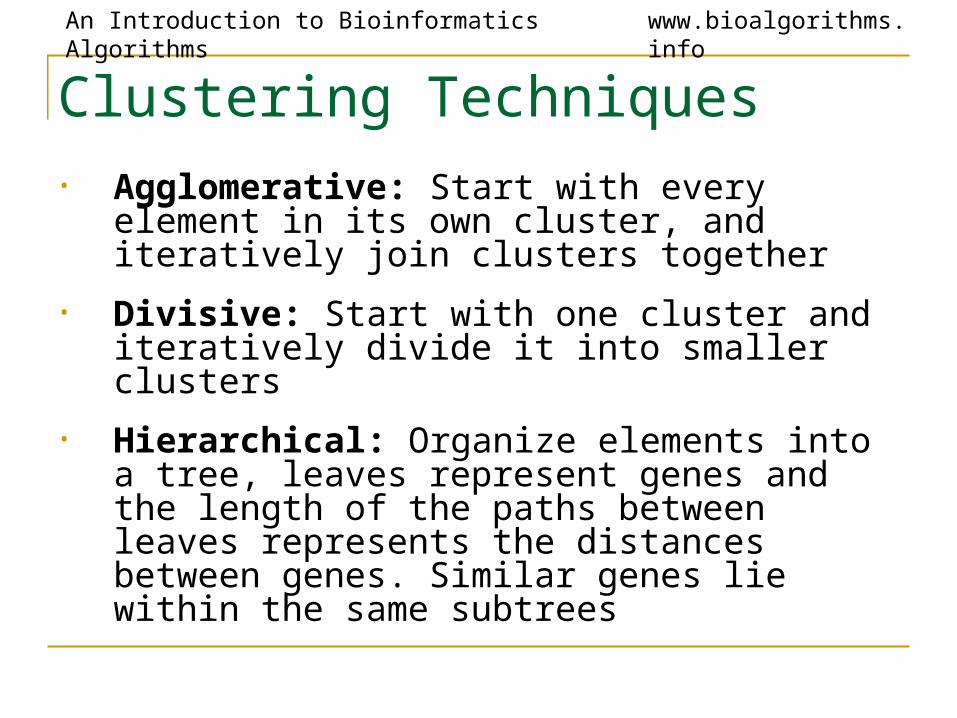
Clustering Techniques• Agglomerative: Start with every element in
its own cluster, and iteratively join clusters together
• Divisive: Start with one cluster and iteratively divide it into smaller clusters
• Hierarchical: Organize elements into a tree, leaves represent genes and the length of the paths between leaves represents the distances between genes. Similar genes lie within the same subtrees
An Introduction to Bioinformatics Algorithms www.bioalgorithms.info
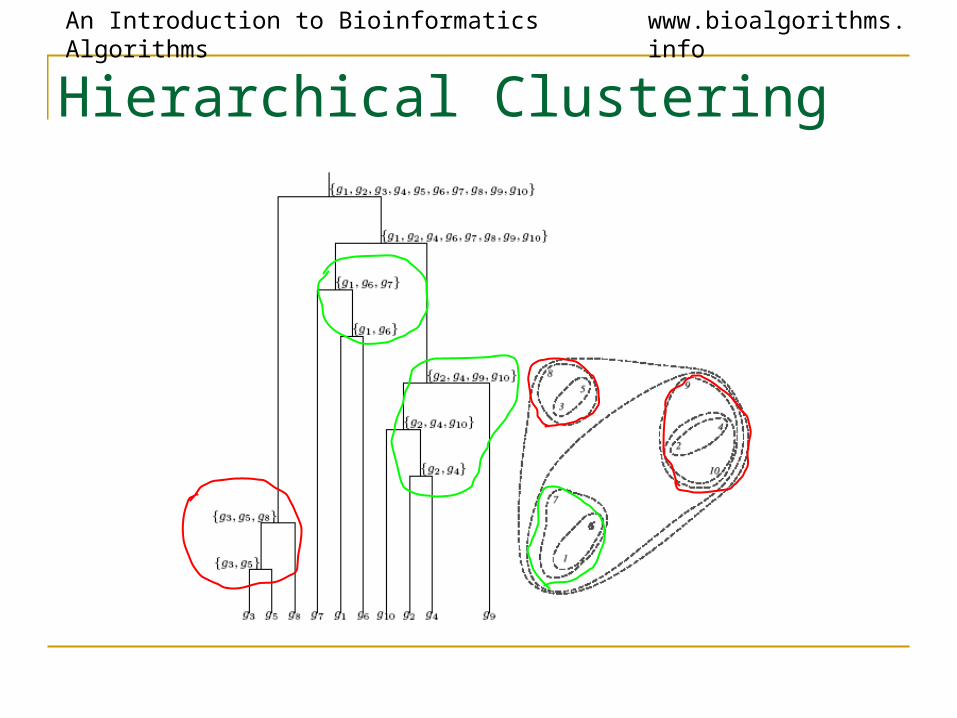
Hierarchical Clustering
An Introduction to Bioinformatics Algorithms www.bioalgorithms.info
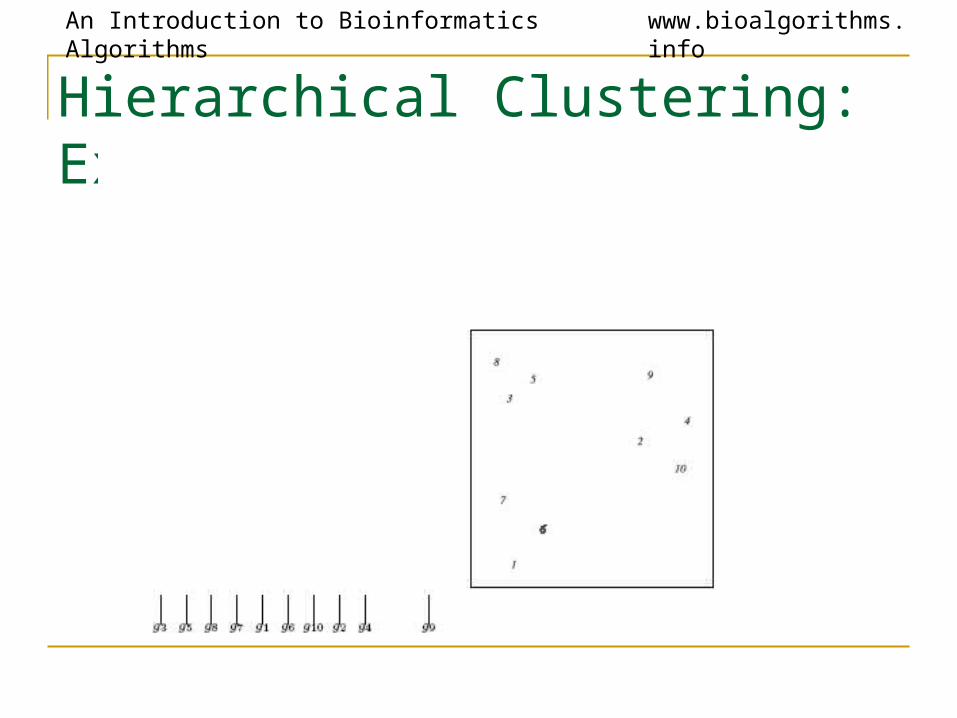
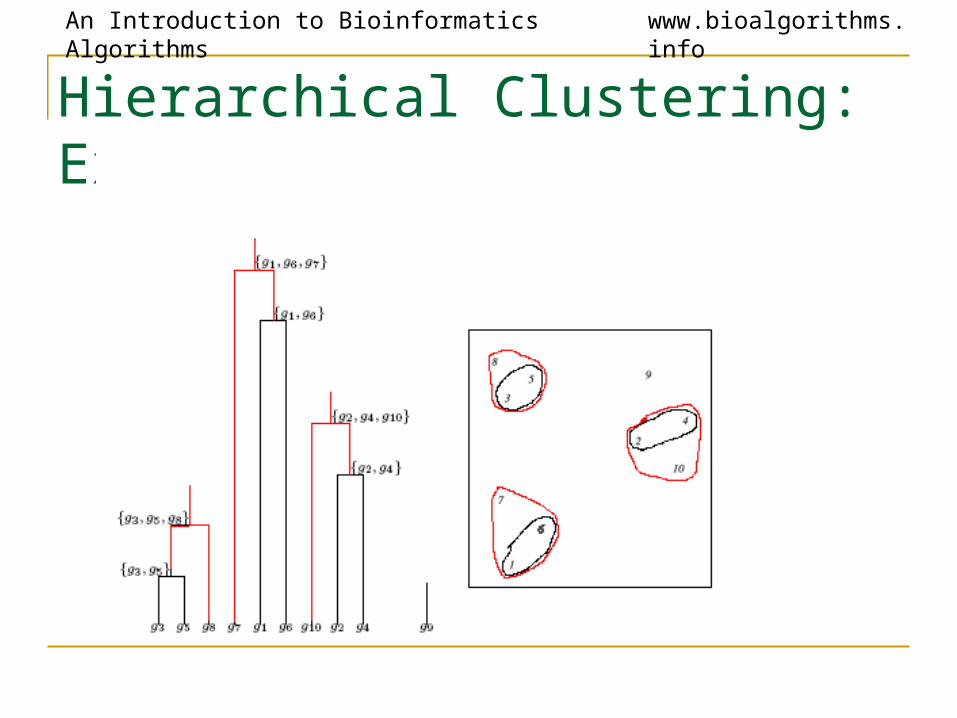
Hierarchical Clustering: Example
An Introduction to Bioinformatics Algorithms www.bioalgorithms.info
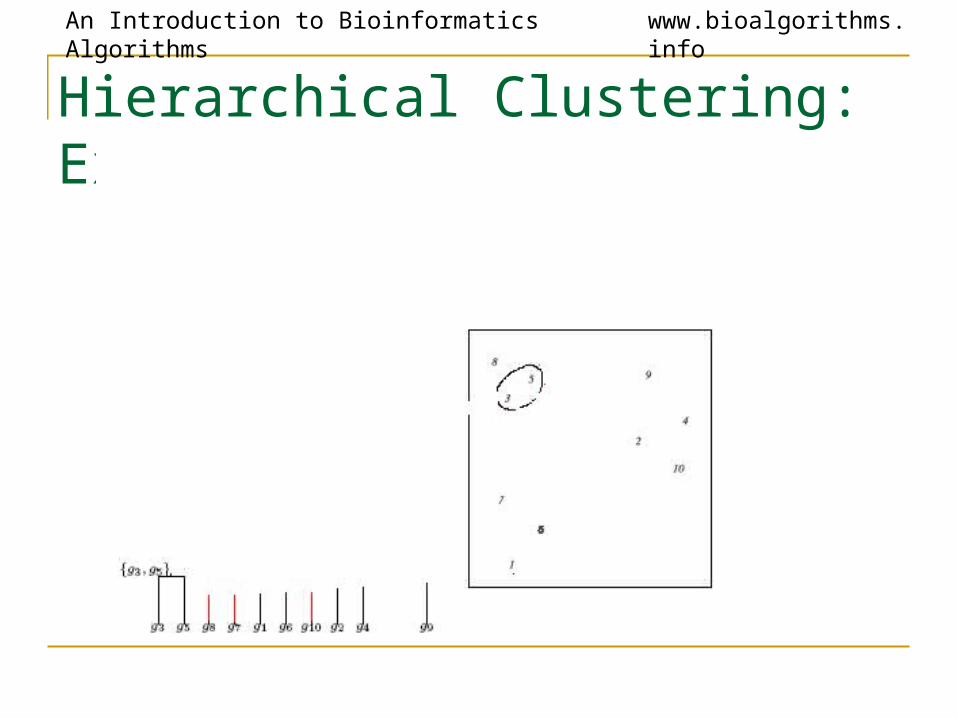
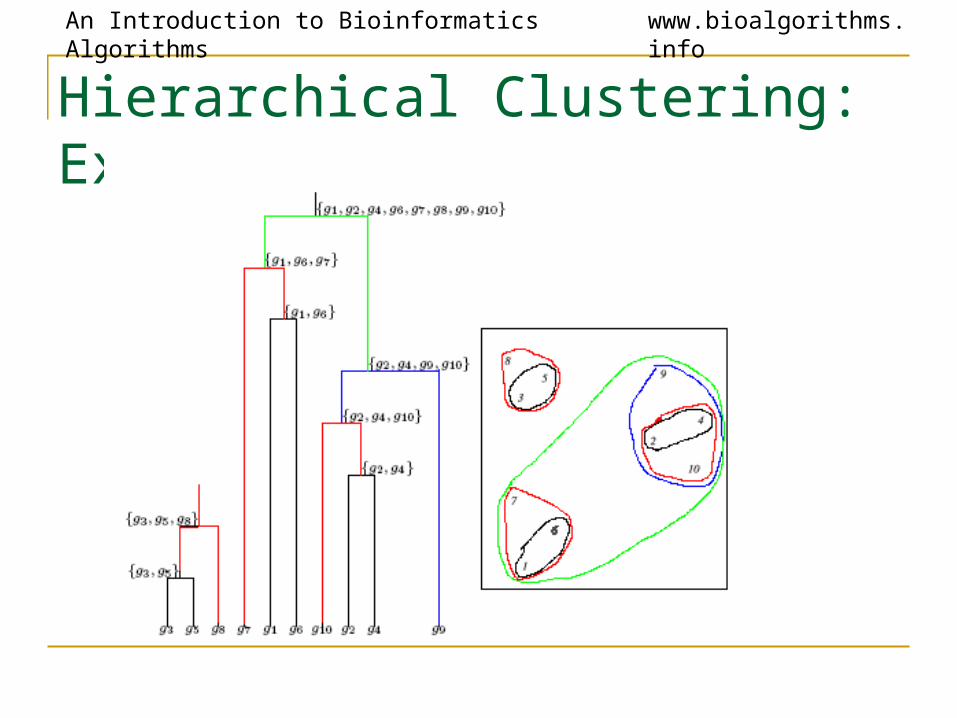
Hierarchical Clustering: Example
An Introduction to Bioinformatics Algorithms www.bioalgorithms.info
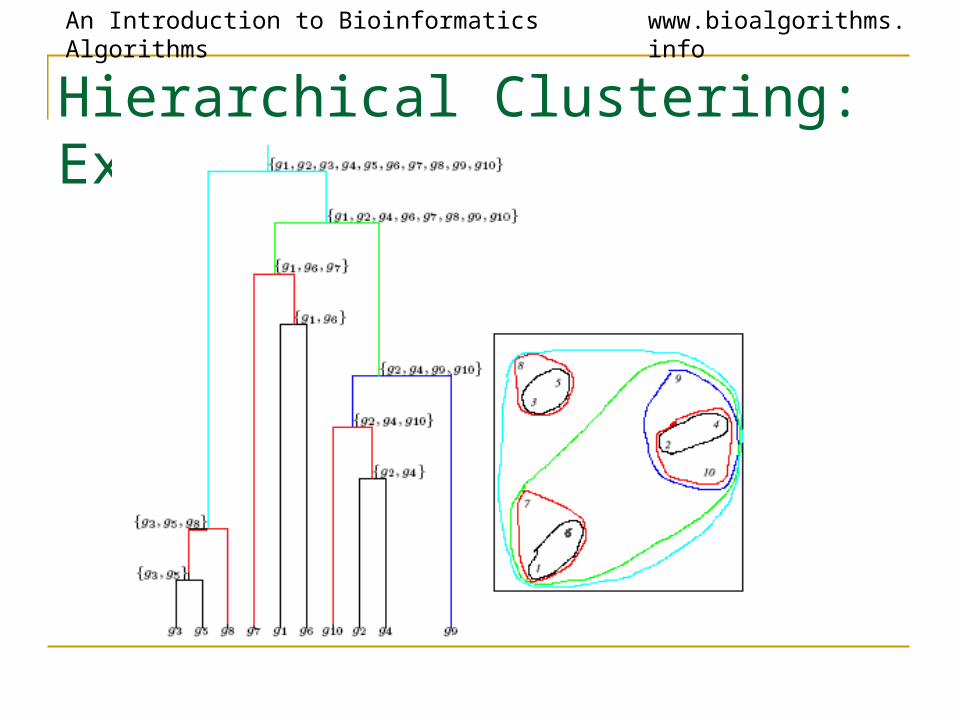
Hierarchical Clustering: Example
An Introduction to Bioinformatics Algorithms www.bioalgorithms.info
Hierarchical Clustering: Example
An Introduction to Bioinformatics Algorithms www.bioalgorithms.info
Hierarchical Clustering: Example
An Introduction to Bioinformatics Algorithms www.bioalgorithms.info
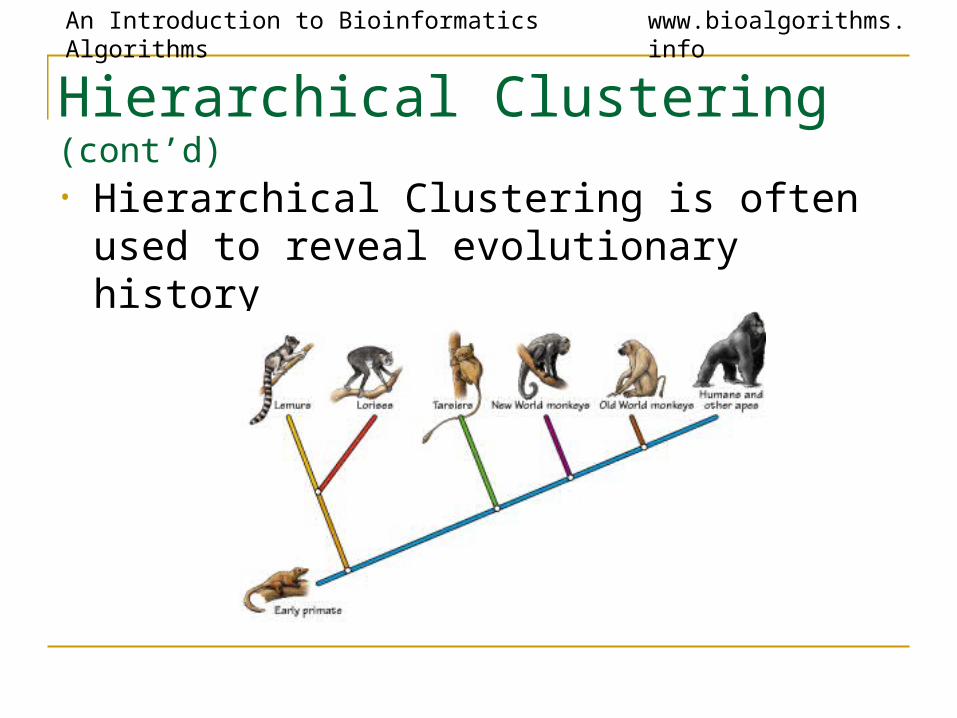
Hierarchical Clustering (cont’d)
• Hierarchical Clustering is often used to reveal evolutionary history
An Introduction to Bioinformatics Algorithms www.bioalgorithms.info
Hierarchical Clustering Algorithm
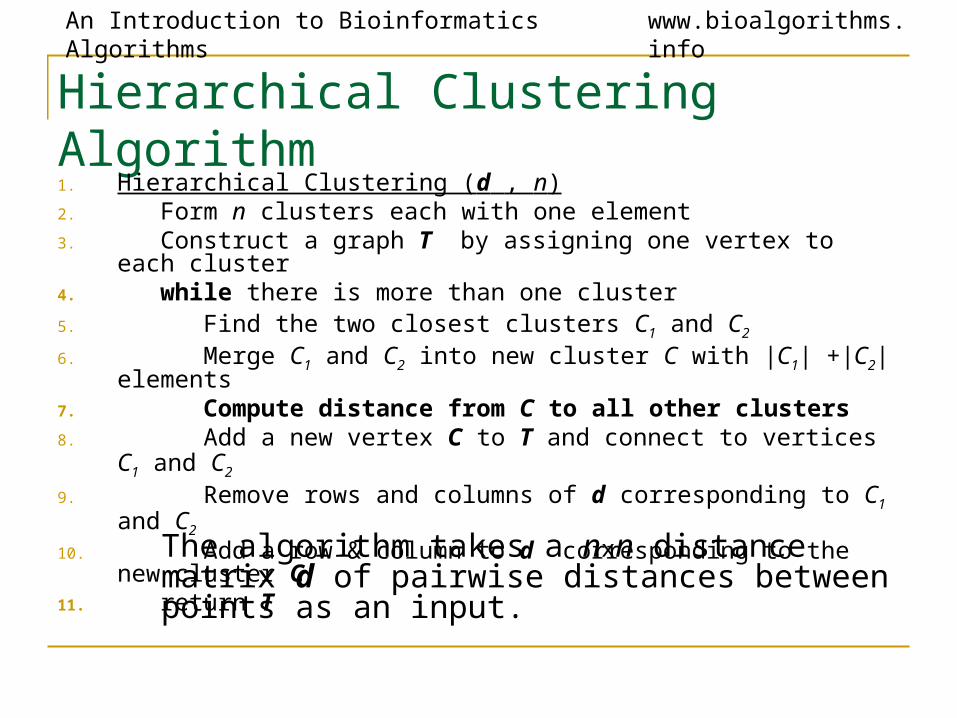
1. Hierarchical Clustering (d , n)2. Form n clusters each with one element3. Construct a graph T by assigning one vertex to each cluster4. while there is more than one cluster5. Find the two closest clusters C1 and C2
6. Merge C1 and C2 into new cluster C with |C1| +|C2| elements7. Compute distance from C to all other clusters8. Add a new vertex C to T and connect to vertices C1 and C2
9. Remove rows and columns of d corresponding to C1 and C2
10. Add a row & column to d corresponding to the new cluster C11. return T
The algorithm takes a nxn distance matrix d of pairwise distances between points as an input.
An Introduction to Bioinformatics Algorithms www.bioalgorithms.info
Hierarchical Clustering Algorithm
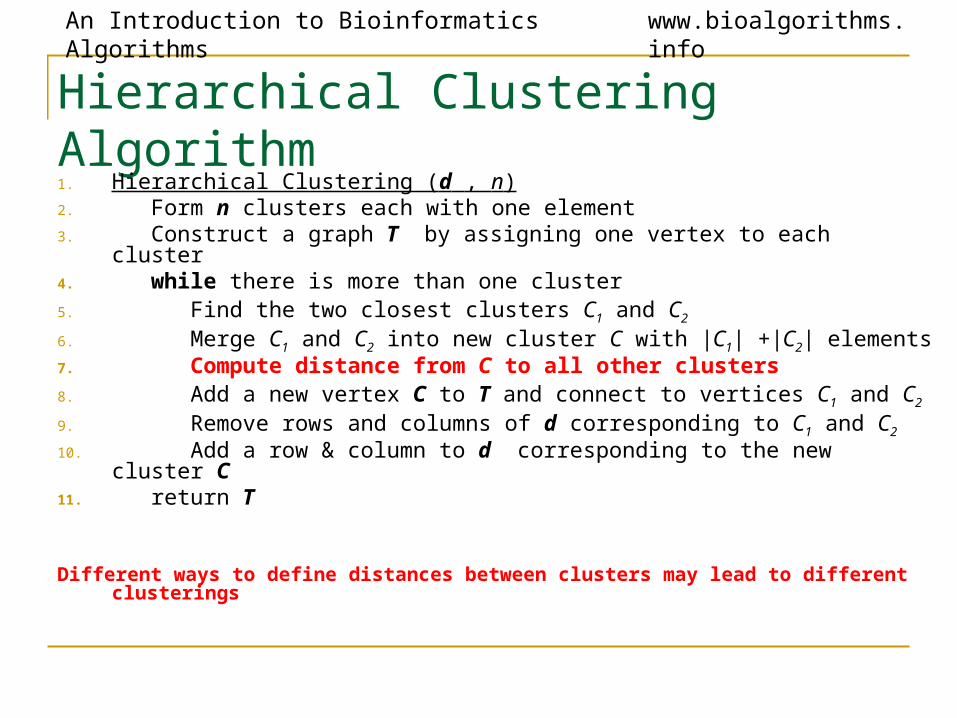
1. Hierarchical Clustering (d , n)2. Form n clusters each with one element3. Construct a graph T by assigning one vertex to each cluster4. while there is more than one cluster5. Find the two closest clusters C1 and C2
6. Merge C1 and C2 into new cluster C with |C1| +|C2| elements7. Compute distance from C to all other clusters8. Add a new vertex C to T and connect to vertices C1 and C2
9. Remove rows and columns of d corresponding to C1 and C2
10. Add a row & column to d corresponding to the new cluster C11. return T
Different ways to define distances between clusters may lead to different clusterings
An Introduction to Bioinformatics Algorithms www.bioalgorithms.info
Hierarchical Clustering: Recomputing Distances
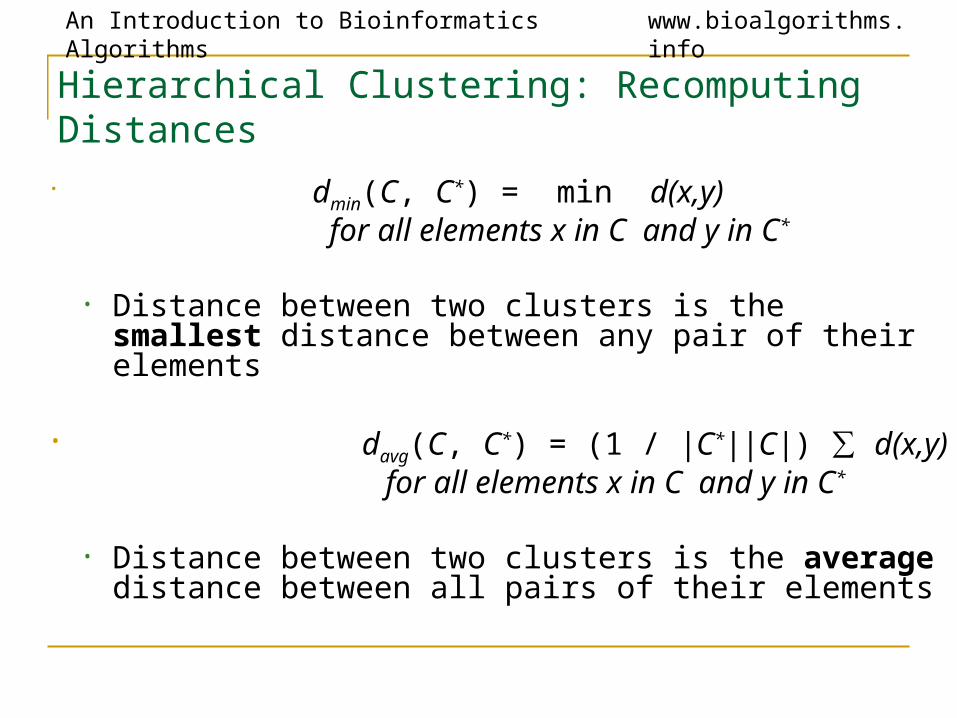
• dmin(C, C*) = min d(x,y) for all elements x in C and y in C*
• Distance between two clusters is the smallest distance between any pair of their elements
• davg(C, C*) = (1 / |C*||C|) ∑ d(x,y) for all elements x in C and y in C*
• Distance between two clusters is the average distance between all pairs of their elements
An Introduction to Bioinformatics Algorithms www.bioalgorithms.info
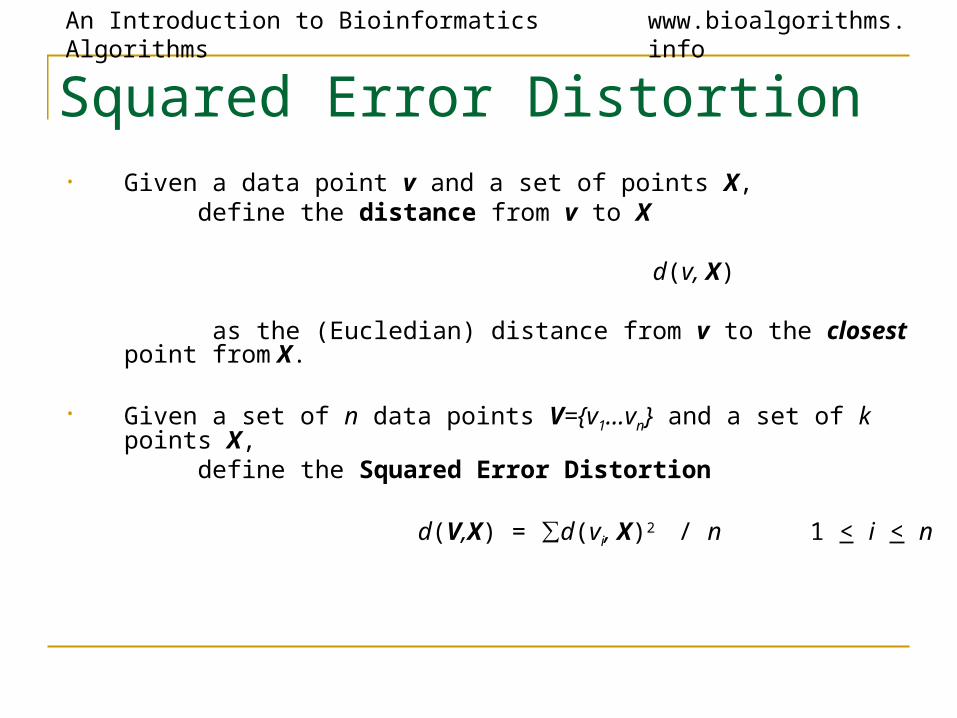
Squared Error Distortion• Given a data point v and a set of points X, define the distance from v to X
d(v, X)
as the (Eucledian) distance from v to the closest point from X.
• Given a set of n data points V={v1…vn} and a set of k points X, define the Squared Error Distortion
d(V,X) = ∑d(vi, X)2 / n 1 < i < n
An Introduction to Bioinformatics Algorithms www.bioalgorithms.info
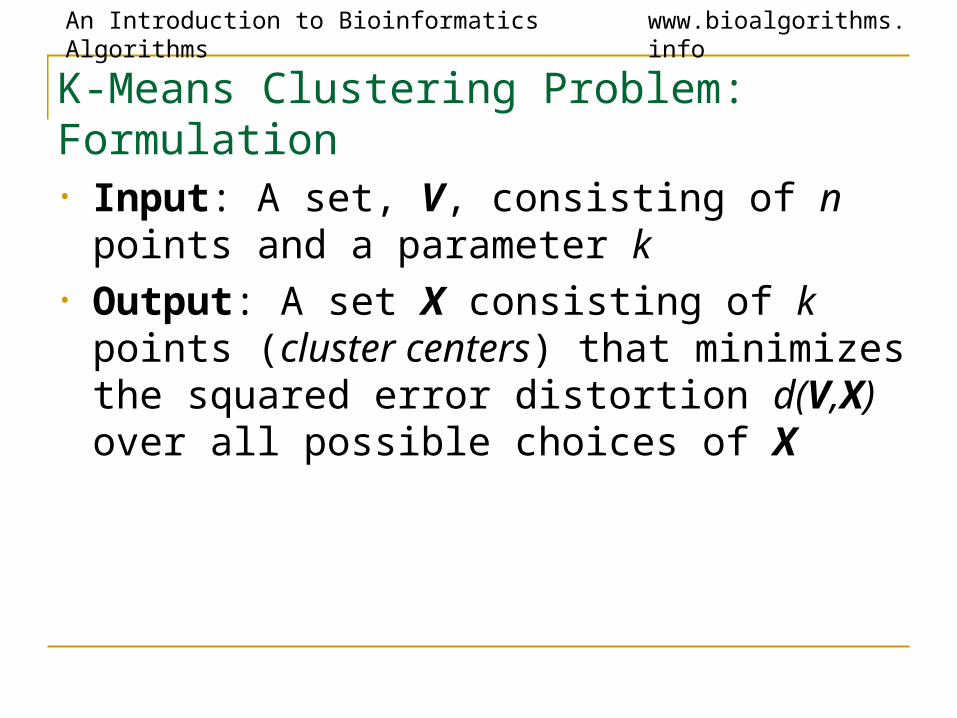
K-Means Clustering Problem: Formulation• Input: A set, V, consisting of n points and a
parameter k• Output: A set X consisting of k points (cluster
centers) that minimizes the squared error distortion d(V,X) over all possible choices of X
An Introduction to Bioinformatics Algorithms www.bioalgorithms.info
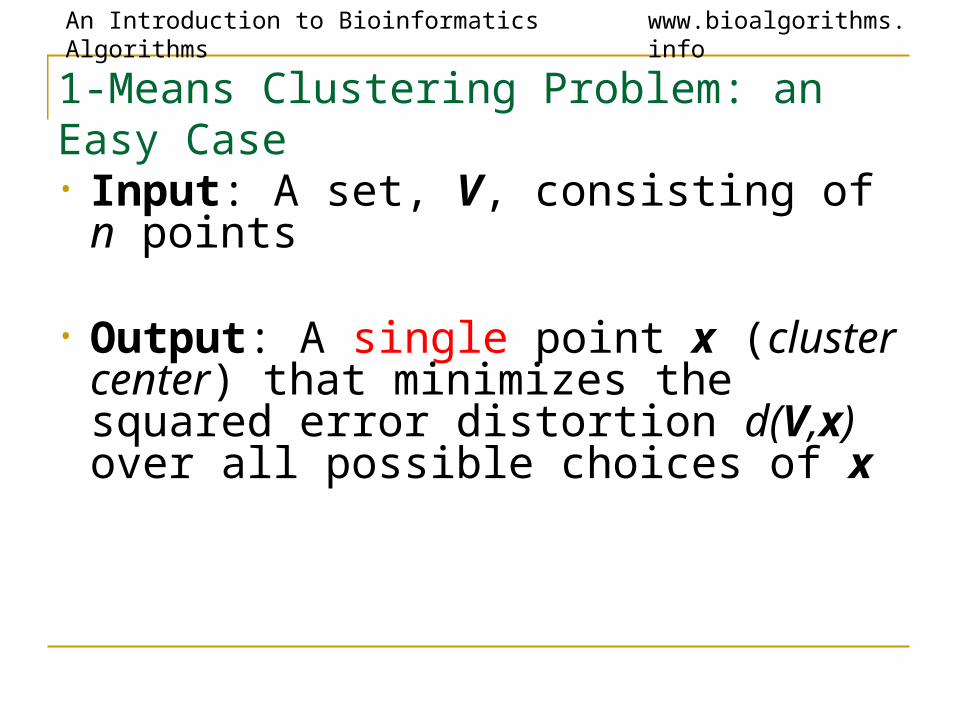
1-Means Clustering Problem: an Easy Case• Input: A set, V, consisting of n points
• Output: A single point x (cluster center) that minimizes the squared error distortion d(V,x) over all possible choices of x
An Introduction to Bioinformatics Algorithms www.bioalgorithms.info
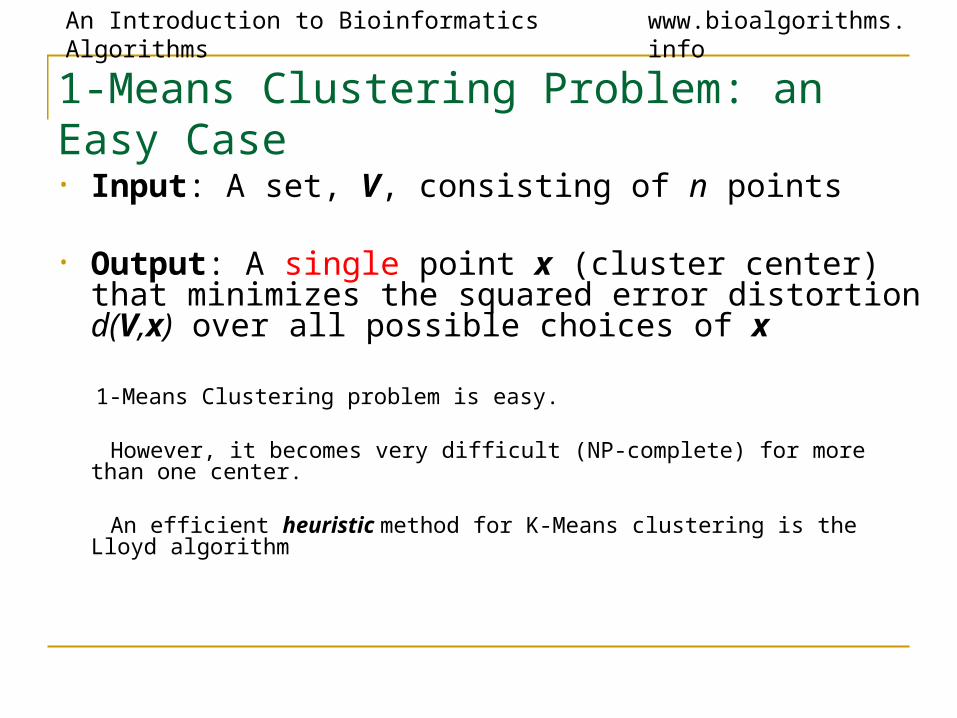
1-Means Clustering Problem: an Easy Case• Input: A set, V, consisting of n points
• Output: A single point x (cluster center) that minimizes the squared error distortion d(V,x) over all possible choices of x
1-Means Clustering problem is easy.
However, it becomes very difficult (NP-complete) for more than one center.
An efficient heuristic method for K-Means clustering is the Lloyd algorithm
An Introduction to Bioinformatics Algorithms www.bioalgorithms.info
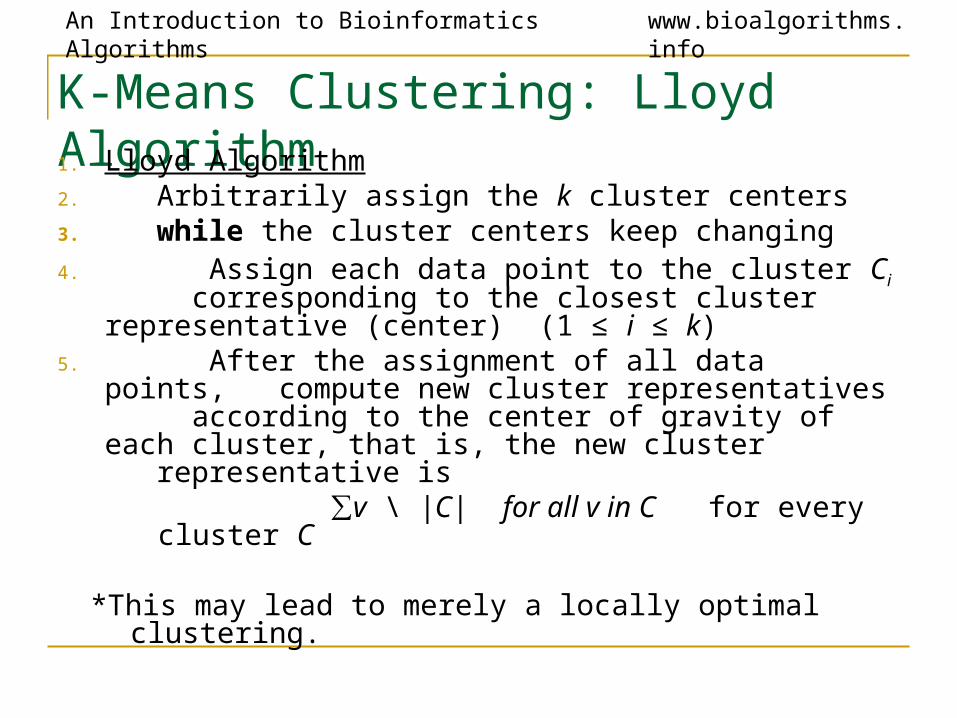
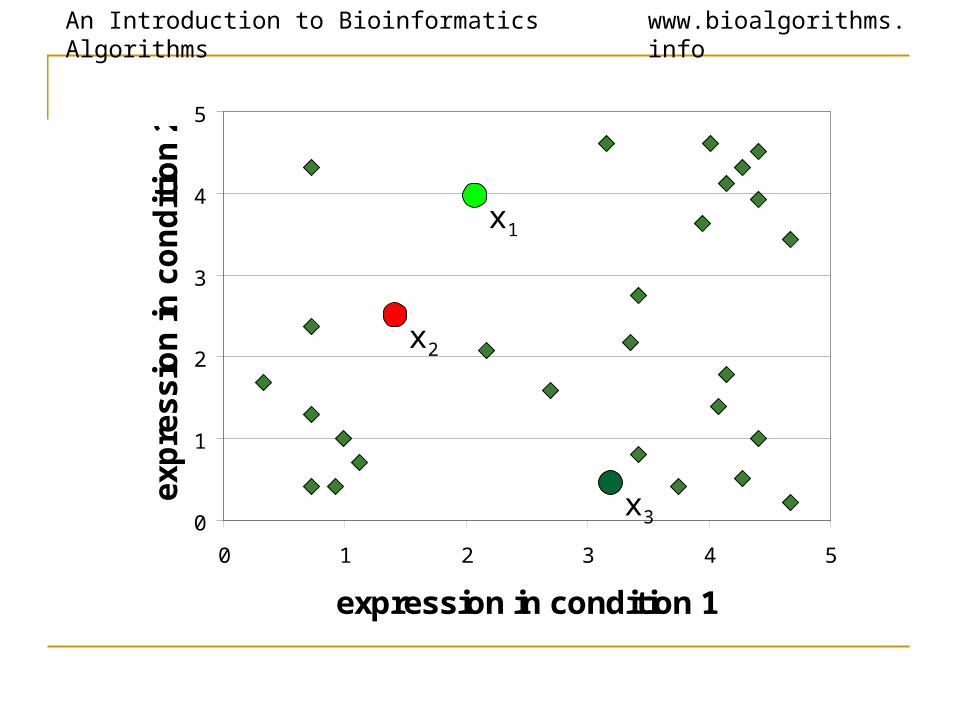
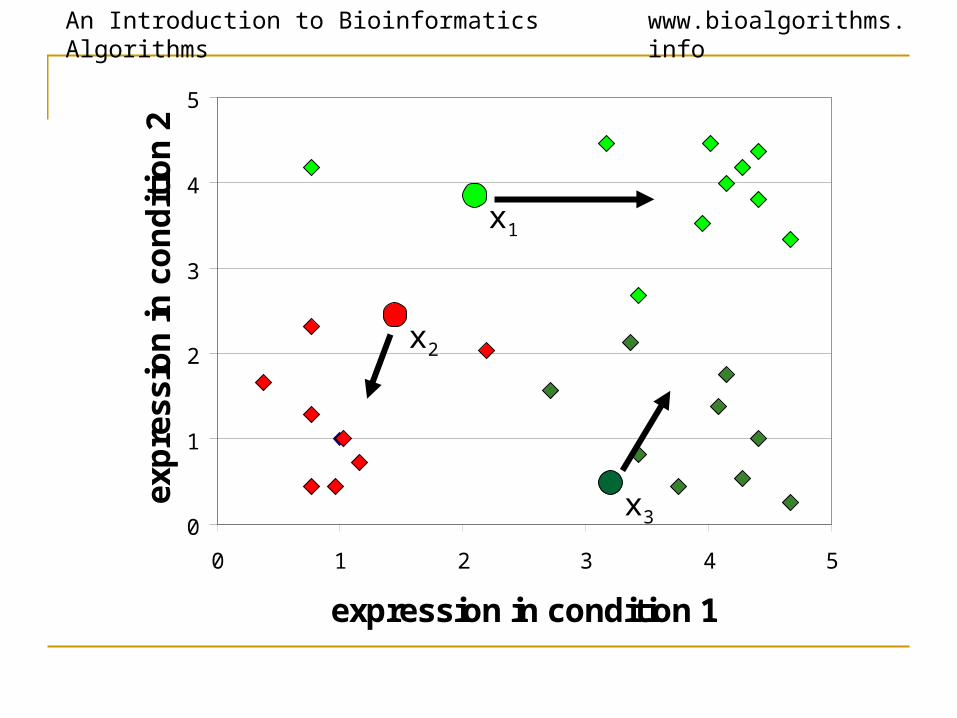
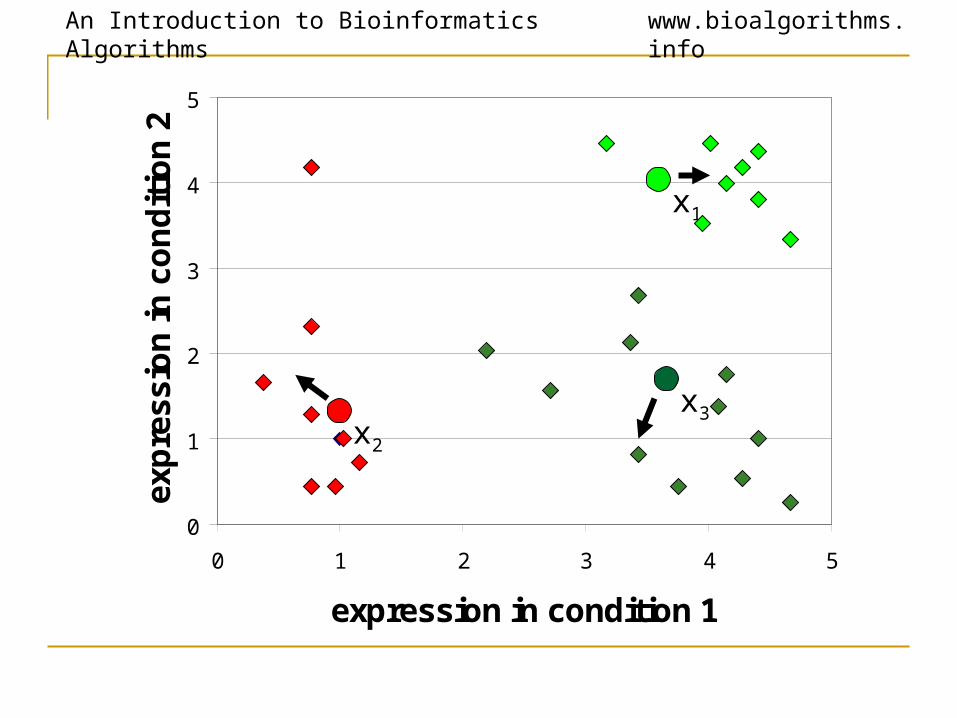
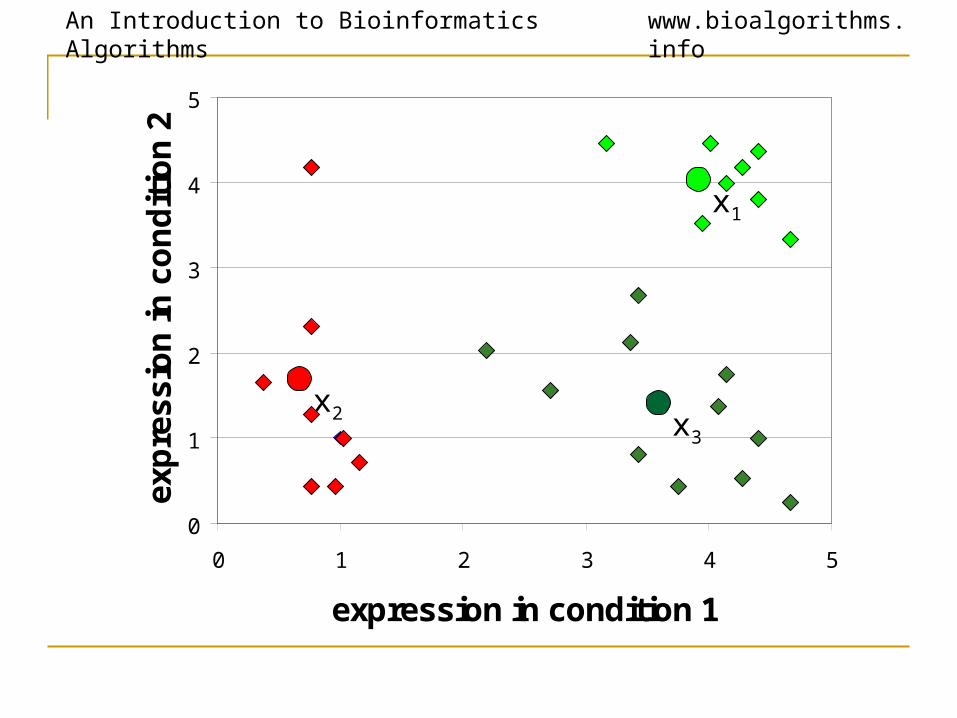
K-Means Clustering: Lloyd Algorithm1. Lloyd Algorithm2. Arbitrarily assign the k cluster centers3. while the cluster centers keep changing4. Assign each data point to the cluster Ci
corresponding to the closest cluster representative (center) (1 ≤ i ≤ k)
5. After the assignment of all data points, compute new cluster representatives according to the center of gravity of each cluster, that is, the new cluster
representative is ∑v \ |C| for all v in C for every cluster C
*This may lead to merely a locally optimal clustering.
An Introduction to Bioinformatics Algorithms www.bioalgorithms.info
0
1
2
3
4
5
0 1 2 3 4 5
expression in condition 1
exp
ressio
n in
co
nd
itio
n 2
x1
x2
x3
An Introduction to Bioinformatics Algorithms www.bioalgorithms.info
0
1
2
3
4
5
0 1 2 3 4 5
expression in condition 1
exp
ress
ion
in c
on
dit
ion
2
x1
x2
x3
An Introduction to Bioinformatics Algorithms www.bioalgorithms.info
0
1
2
3
4
5
0 1 2 3 4 5
expression in condition 1
exp
ress
ion
in c
on
dit
ion
2
x1
x2
x3
An Introduction to Bioinformatics Algorithms www.bioalgorithms.info
0
1
2
3
4
5
0 1 2 3 4 5
expression in condition 1
exp
ress
ion
in c
on
dit
ion
2
x1
x2 x3
An Introduction to Bioinformatics Algorithms www.bioalgorithms.info
Conservative K-Means Algorithm• Lloyd algorithm is fast but in each iteration it
moves many data points, not necessarily causing better convergence.
• A more conservative method would be to move one point at a time only if it improves the overall clustering cost
• The smaller the clustering cost of a partition of data points is the better that clustering is
• Different methods (e.g., the squared error distortion) can be used to measure this clustering cost
An Introduction to Bioinformatics Algorithms www.bioalgorithms.info
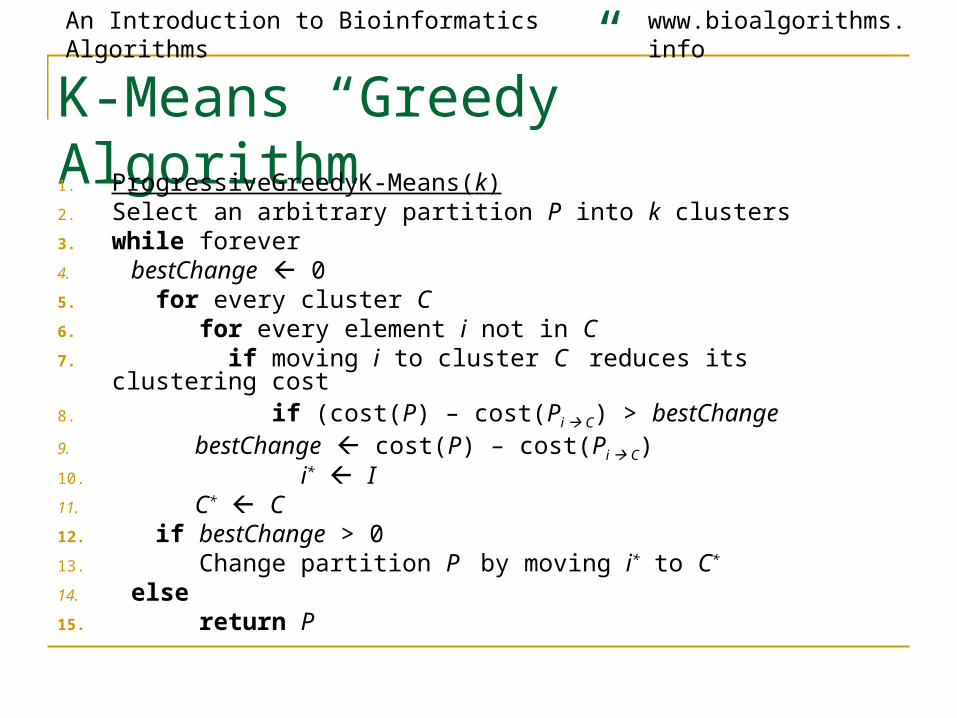
K-Means “Greedy” Algorithm1. ProgressiveGreedyK-Means(k)2. Select an arbitrary partition P into k clusters3. while forever4. bestChange 05. for every cluster C6. for every element i not in C7. if moving i to cluster C reduces its clustering cost8. if (cost(P) – cost(Pi C) > bestChange9. bestChange cost(P) – cost(Pi C) 10. i* I11. C* C12. if bestChange > 013. Change partition P by moving i* to C*
14. else15. return P

An Introduction to Bioinformatics Algorithms www.bioalgorithms.info
Clique Graphs
• A clique is a graph with every vertex connected to every other vertex
• A clique graph is a graph where each connected component is a clique
An Introduction to Bioinformatics Algorithms www.bioalgorithms.info
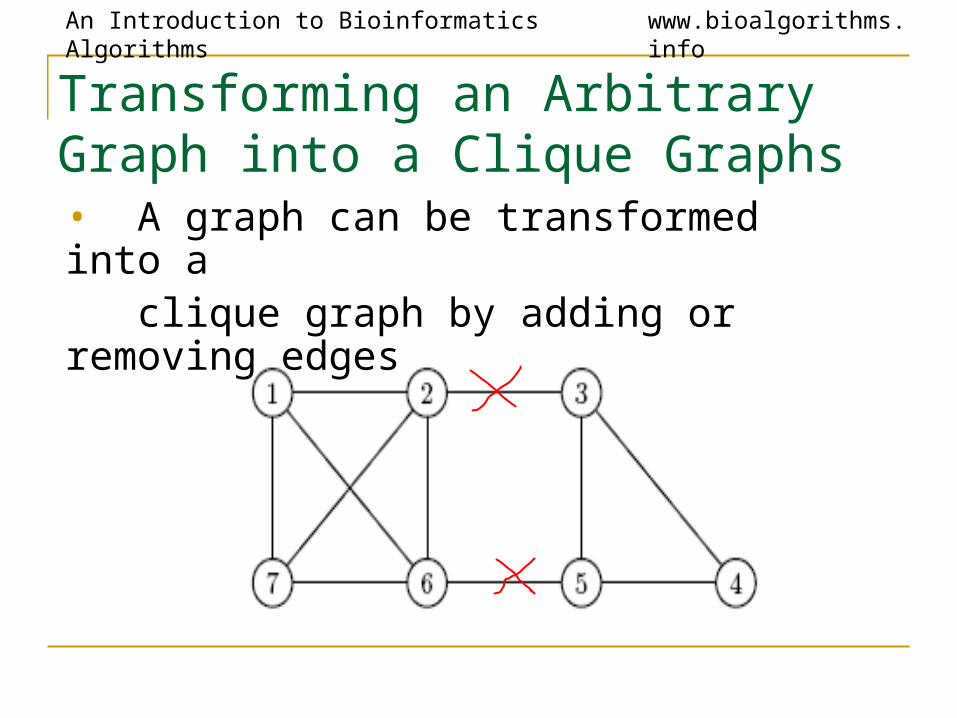
Transforming an Arbitrary Graph into a Clique Graphs
• A graph can be transformed into a clique graph by adding or removing edges
An Introduction to Bioinformatics Algorithms www.bioalgorithms.info
Corrupted Cliques Problem
Input: A graph G
Output: The smallest number of additions and removals of edges that will transform G into a clique graph
An Introduction to Bioinformatics Algorithms www.bioalgorithms.info
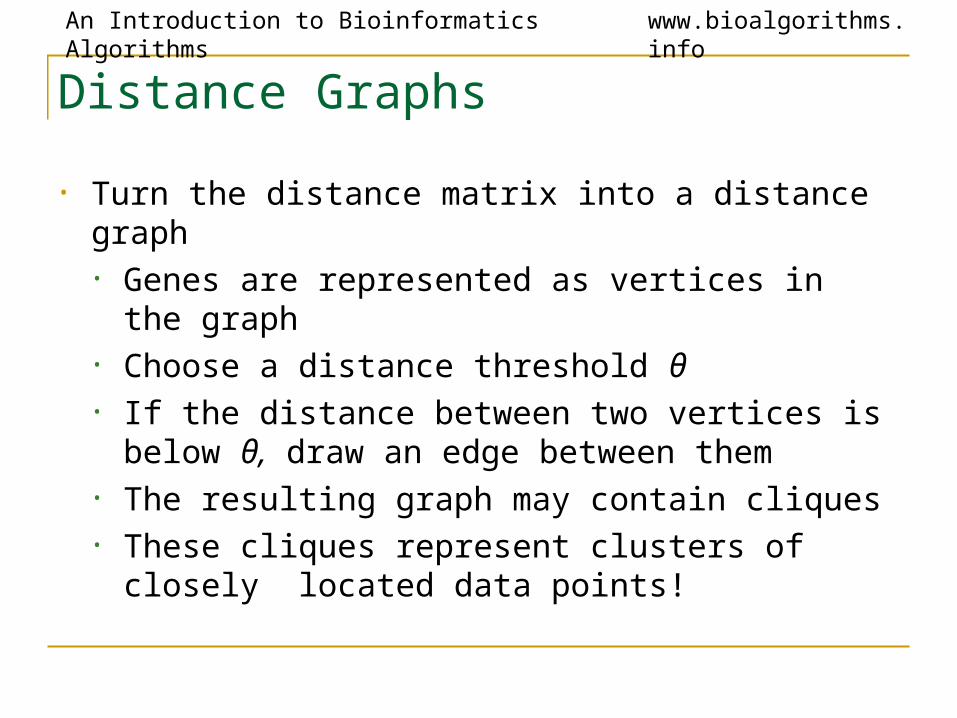
Distance Graphs
• Turn the distance matrix into a distance graph• Genes are represented as vertices in the graph• Choose a distance threshold θ• If the distance between two vertices is below θ,
draw an edge between them• The resulting graph may contain cliques• These cliques represent clusters of closely
located data points!
An Introduction to Bioinformatics Algorithms www.bioalgorithms.info
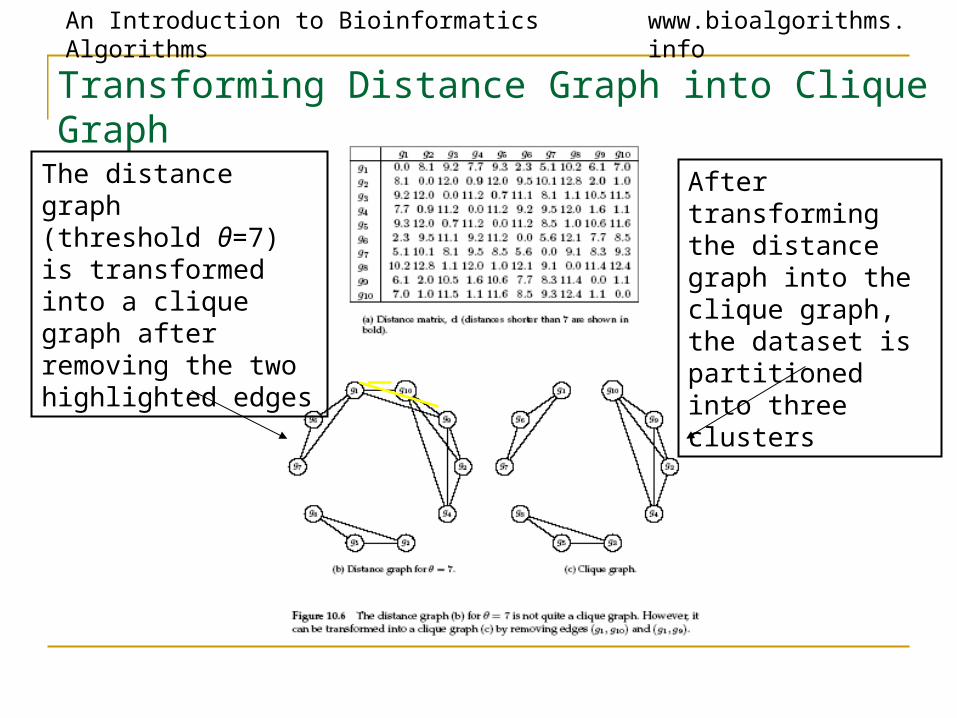
Transforming Distance Graph into Clique Graph
The distance graph (threshold θ=7) is transformed into a clique graph after removing the two highlighted edges
After transforming the distance graph into the clique graph, the dataset is partitioned into three clusters
An Introduction to Bioinformatics Algorithms www.bioalgorithms.info
Heuristics for Corrupted Clique Problem• Corrupted Cliques problem is NP-Hard, some heuristics
exist to approximately solve it:• CAST (Cluster Affinity Search Technique): a practical
and fast algorithm:• CAST is based on the notion of genes close to cluster
C or distant from cluster C• Distance between gene i and cluster C: d(i,C) = average distance between gene i and all genes in C
Gene i is close to cluster C if d(i,C)< θ and distant otherwise
An Introduction to Bioinformatics Algorithms www.bioalgorithms.info
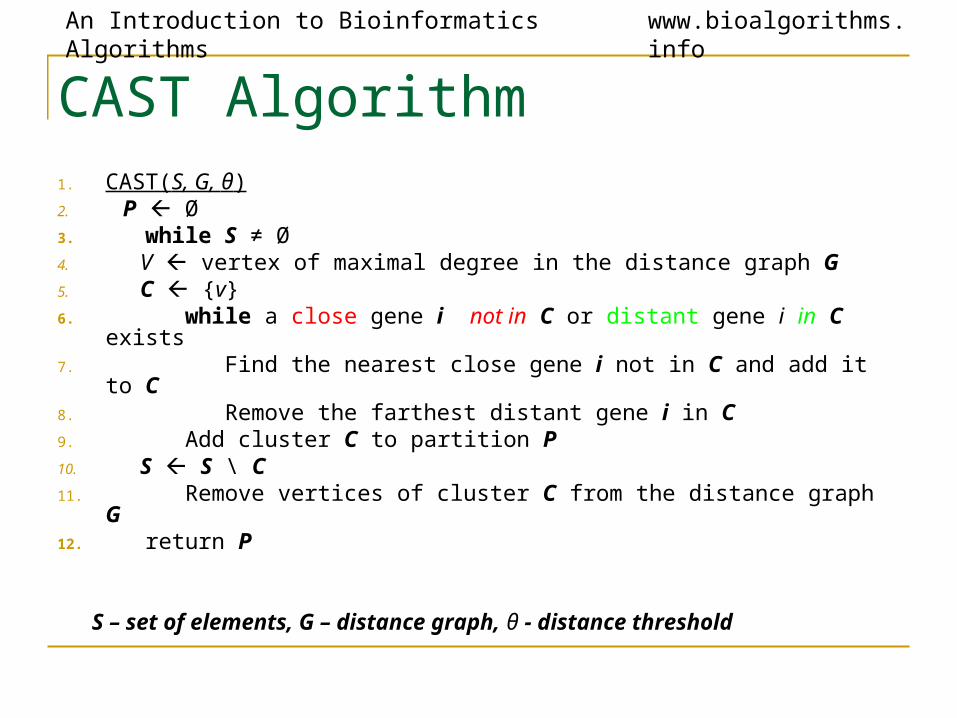
CAST Algorithm1. CAST(S, G, θ)2. P Ø3. while S ≠ Ø4. V vertex of maximal degree in the distance graph G5. C {v}6. while a close gene i not in C or distant gene i in C exists7. Find the nearest close gene i not in C and add it to C8. Remove the farthest distant gene i in C9. Add cluster C to partition P10. S S \ C11. Remove vertices of cluster C from the distance graph G12. return P
S – set of elements, G – distance graph, θ - distance threshold
An Introduction to Bioinformatics Algorithms www.bioalgorithms.info
References• http://ihome.cuhk.edu.hk/~b400559/array.html#Glos
saries• http://www.umanitoba.ca/faculties/afs/plant_science/
COURSES/bioinformatics/lec12/lec12.1.html• http://www.genetics.wustl.edu/bio5488/lecture_note
s_2004/microarray_2.ppt - For Clustering Example


![BMC Bioinformatics BioMed Central - Virginia Tech · BMC Bioinformatics 2008, ... i.e. conventional agglomerative Hierarchical Clustering (HC) [2], KMC [18 ... Matlab code implementing](https://img.pdfslide.net/doc/110x75/5ac0038b7f8b9a5a4e8b7b72/bmc-bioinformatics-biomed-central-virginia-bioinformatics-2008-ie-conventional.jpg)