Embed Size (px)
Citation preview
www.everybabymatters.org.uk
www.everybabymatters.org.uk
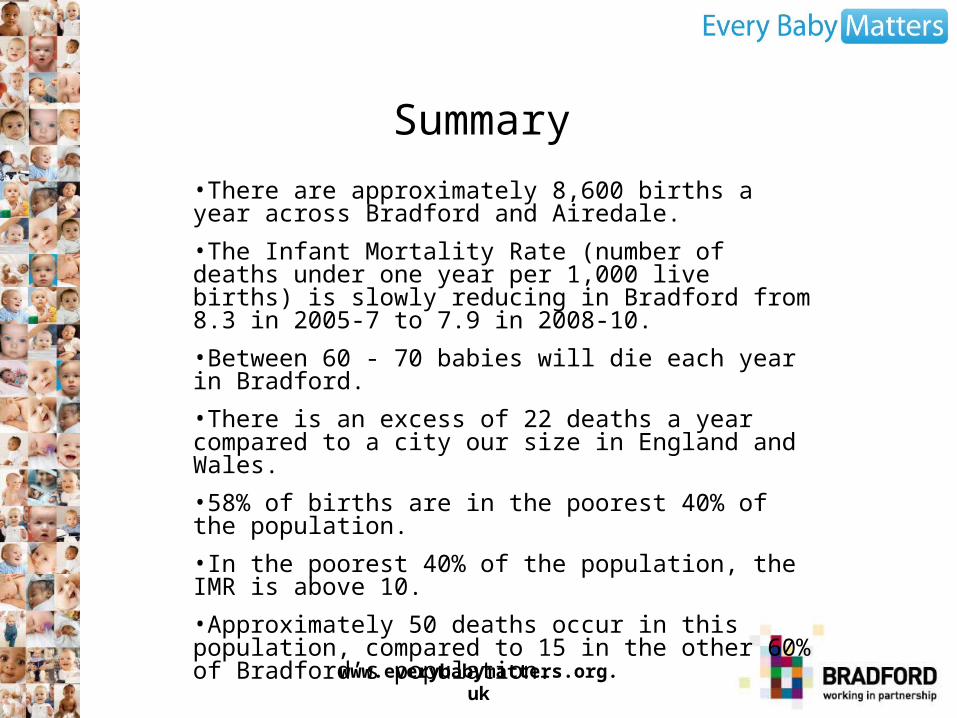
•There are approximately 8,600 births a year across Bradford and Airedale.
•The Infant Mortality Rate (number of deaths under one year per 1,000 live births) is slowly reducing in Bradford from 8.3 in 2005-7 to 7.9 in 2008-10.
•Between 60 - 70 babies will die each year in Bradford.
•There is an excess of 22 deaths a year compared to a city our size in England and Wales.
•58% of births are in the poorest 40% of the population.
•In the poorest 40% of the population, the IMR is above 10.
•Approximately 50 deaths occur in this population, compared to 15 in the other 60% of Bradford’s population.
Summary
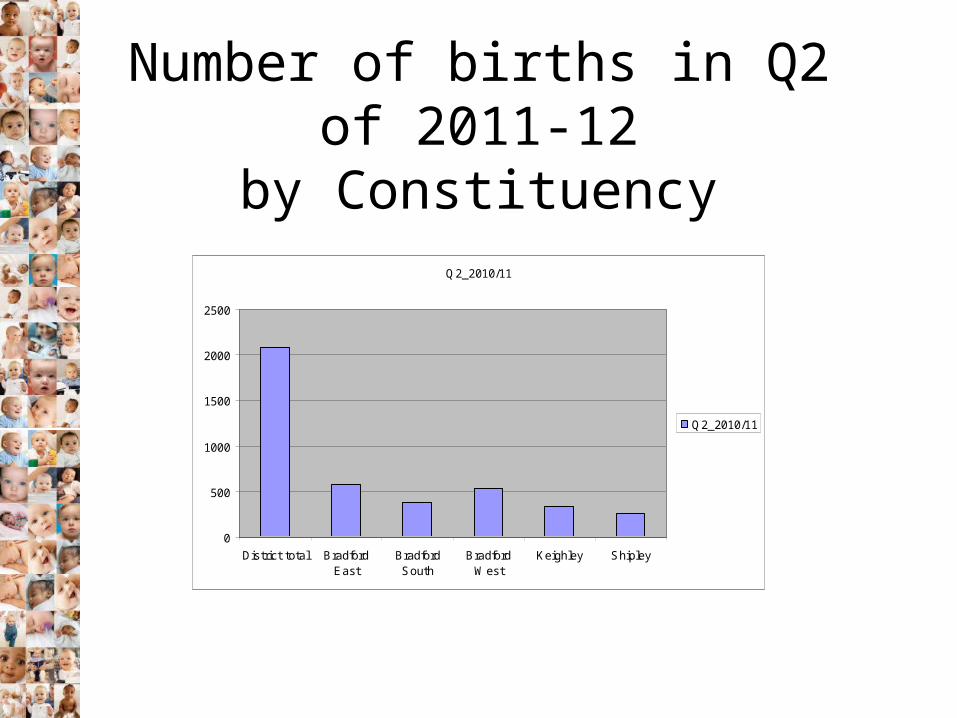
Number of births in Q2 of 2011-12by Constituency
Q2_2010/11
0
500
1000
1500
2000
2500
District total BradfordEast
BradfordSouth
BradfordWest
Keighley Shipley
Q2_2010/11
www.everybabymatters.org.uk
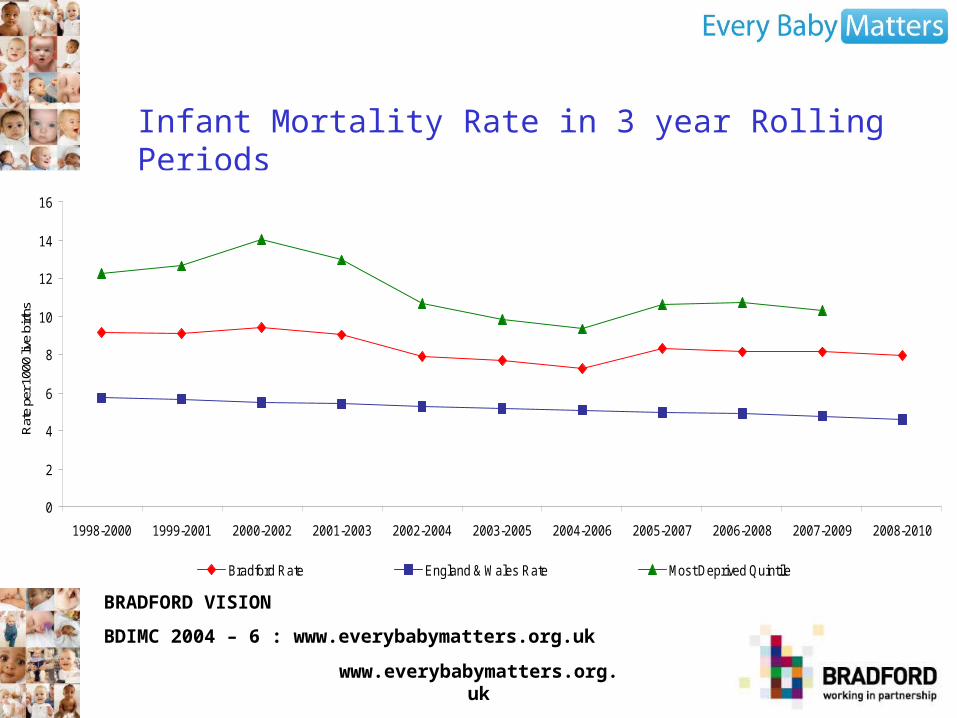
Infant Mortality Rate in 3 year Rolling Periods
BRADFORD VISION
BDIMC 2004 – 6 : www.everybabymatters.org.uk
0
2
4
6
8
10
12
14
16
1998-2000 1999-2001 2000-2002 2001-2003 2002-2004 2003-2005 2004-2006 2005-2007 2006-2008 2007-2009 2008-2010
Rat
e pe
r 100
0 liv
e bi
rths
Bradford Rate England & Wales Rate Most Deprived Quintile
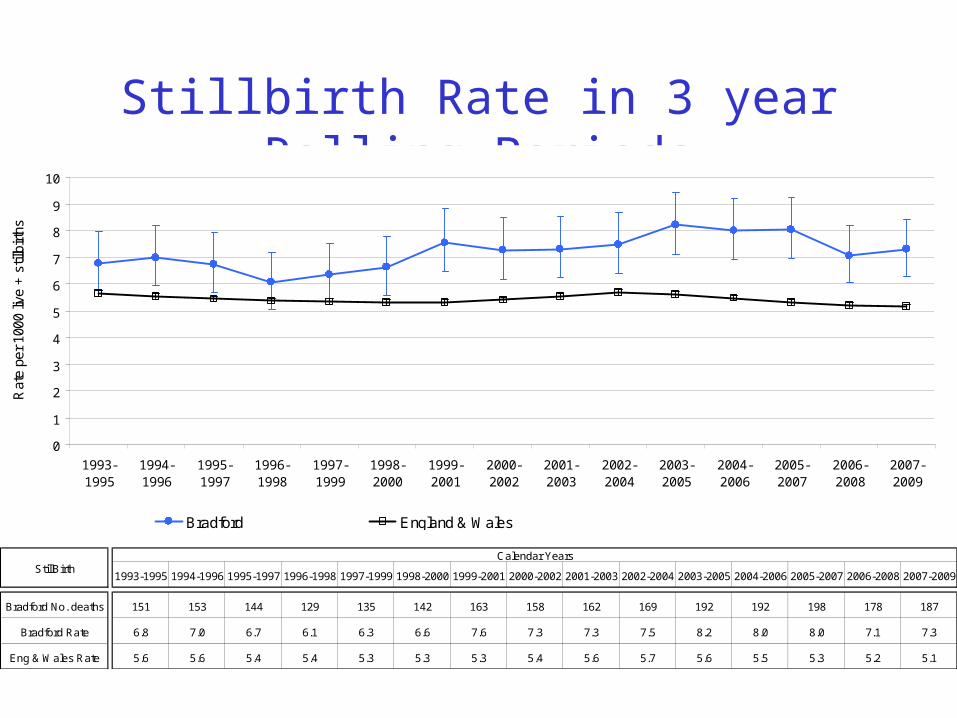
Stillbirth Rate in 3 year Rolling Periods
0
1
2
3
4
5
6
7
8
9
10
1993-1995
1994-1996
1995-1997
1996-1998
1997-1999
1998-2000
1999-2001
2000-2002
2001-2003
2002-2004
2003-2005
2004-2006
2005-2007
2006-2008
2007-2009
Rat
e pe
r 10
00 li
ve +
stil
lbirt
hs
Bradford England & Wales
1993-1995 1994-1996 1995-1997 1996-1998 1997-1999 1998-2000 1999-2001 2000-2002 2001-2003 2002-2004 2003-2005 2004-2006 2005-2007 2006-2008 2007-2009
Bradford No. deaths 151 153 144 129 135 142 163 158 162 169 192 192 198 178 187
Bradford Rate 6.8 7.0 6.7 6.1 6.3 6.6 7.6 7.3 7.3 7.5 8.2 8.0 8.0 7.1 7.3
Eng & Wales Rate 5.6 5.6 5.4 5.4 5.3 5.3 5.3 5.4 5.6 5.7 5.6 5.5 5.3 5.2 5.1
Calendar YearsStillBirth
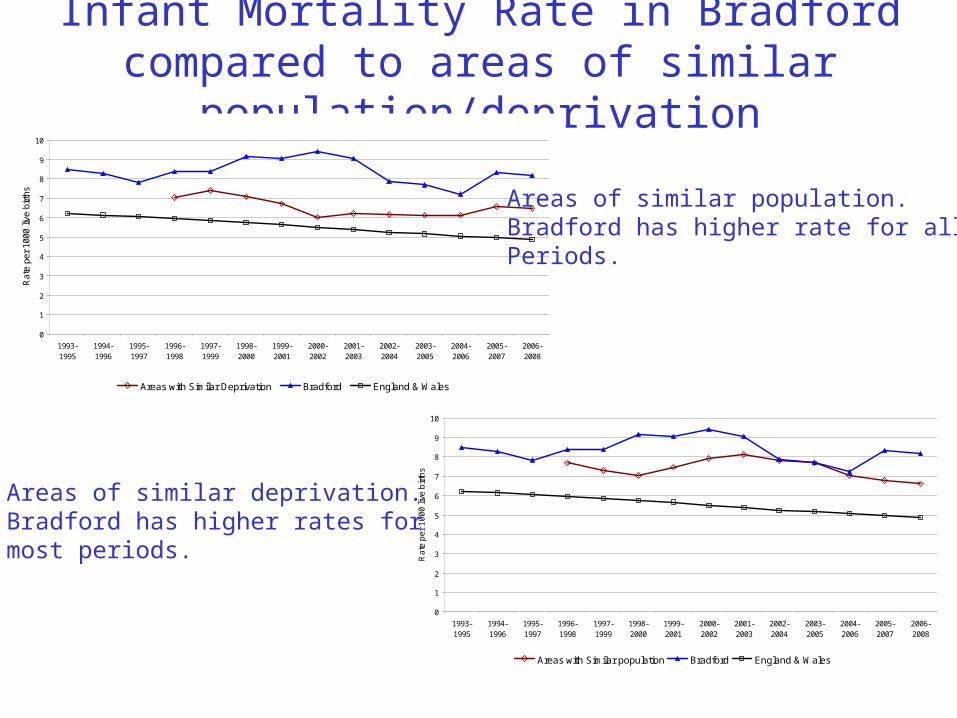
Infant Mortality Rate in Bradford compared to areas of similar population/deprivation
0
1
2
3
4
5
6
7
8
9
10
1993-1995
1994-1996
1995-1997
1996-1998
1997-1999
1998-2000
1999-2001
2000-2002
2001-2003
2002-2004
2003-2005
2004-2006
2005-2007
2006-2008
Rat
e pe
r 10
00 li
ve b
irths
Areas with Similar Deprivation Bradford England & Wales
0
1
2
3
4
5
6
7
8
9
10
1993-1995
1994-1996
1995-1997
1996-1998
1997-1999
1998-2000
1999-2001
2000-2002
2001-2003
2002-2004
2003-2005
2004-2006
2005-2007
2006-2008
Ra
te p
er
10
00
live
bir
ths
Areas with Similar population Bradford England & Wales
Areas of similar population. Bradford has higher rate for all Periods.
Areas of similar deprivation. Bradford has higher rates for most periods.
www.everybabymatters.org.uk
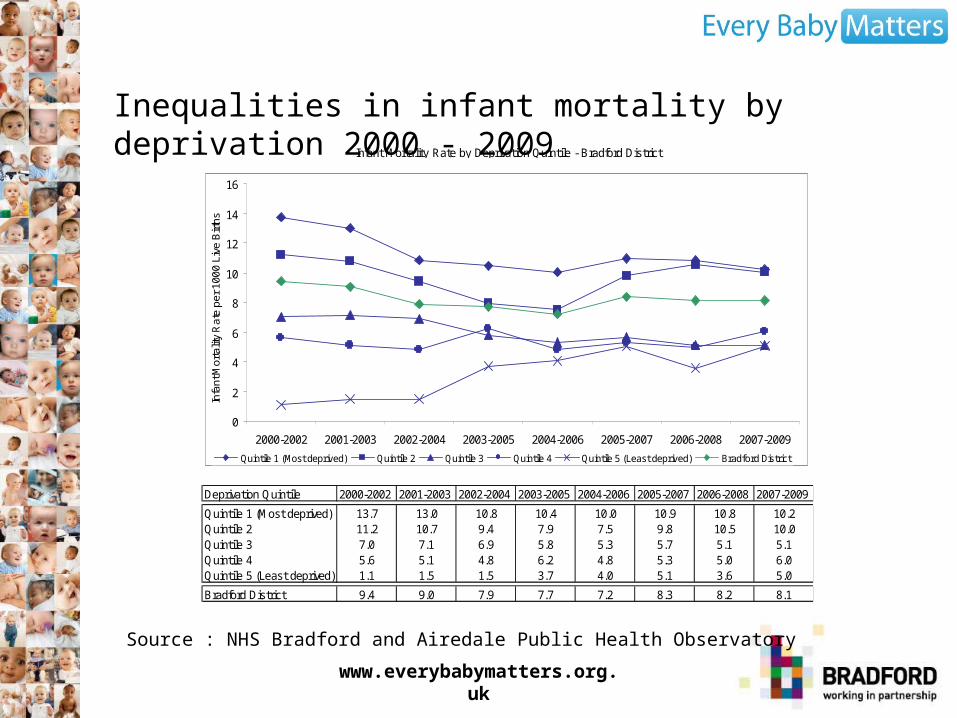
Inequalities in infant mortality by deprivation 2000 - 2009
Deprivation Quintile 2000-2002 2001-2003 2002-2004 2003-2005 2004-2006 2005-2007 2006-2008 2007-2009
Quintile 1 (Most deprived) 13.7 13.0 10.8 10.4 10.0 10.9 10.8 10.2Quintile 2 11.2 10.7 9.4 7.9 7.5 9.8 10.5 10.0Quintile 3 7.0 7.1 6.9 5.8 5.3 5.7 5.1 5.1Quintile 4 5.6 5.1 4.8 6.2 4.8 5.3 5.0 6.0Quintile 5 (Least deprived) 1.1 1.5 1.5 3.7 4.0 5.1 3.6 5.0
Bradford District 9.4 9.0 7.9 7.7 7.2 8.3 8.2 8.1
Infant Mortality Rate by Deprivation Quintile - Bradford District
0
2
4
6
8
10
12
14
16
2000-2002 2001-2003 2002-2004 2003-2005 2004-2006 2005-2007 2006-2008 2007-2009
Infa
nt M
orta
lity
Rat
e pe
r 100
0 Li
ve B
irths
Quintile 1 (Most deprived) Quintile 2 Quintile 3 Quintile 4 Quintile 5 (Least deprived) Bradford District
Source : NHS Bradford and Airedale Public Health Observatory
www.everybabymatters.org.uk
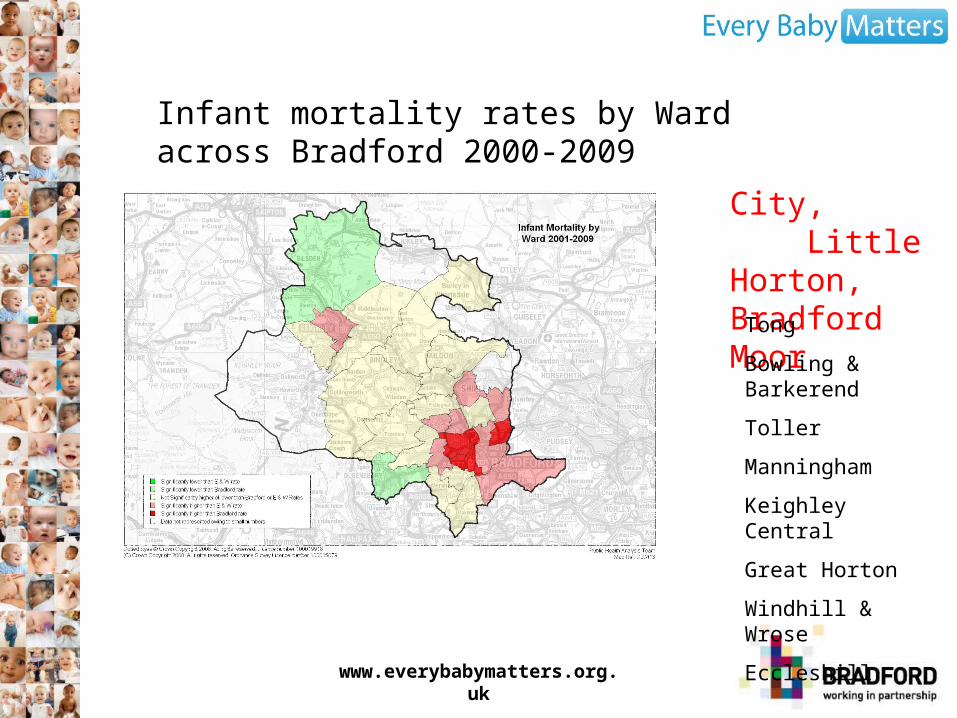
Infant mortality rates by Ward across Bradford 2000-2009
City, Little Horton, Bradford Moor
Tong
Bowling & Barkerend
Toller
Manningham
Keighley Central
Great Horton
Windhill & Wrose
Eccleshill
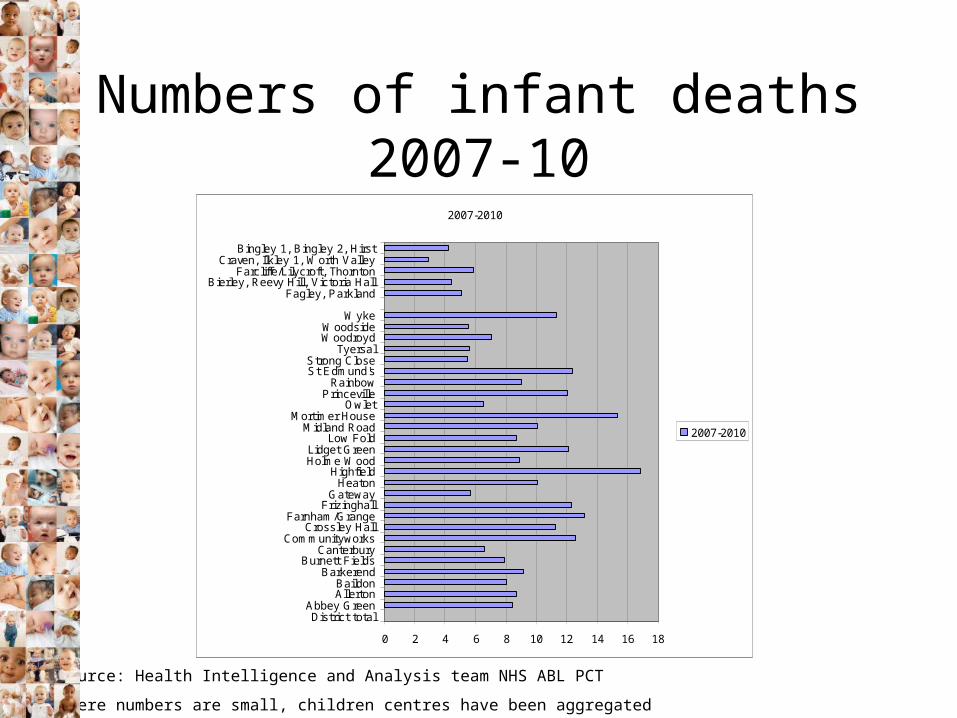
Numbers of infant deaths 2007-102007-2010
0 2 4 6 8 10 12 14 16 18
District totalAbbey Green
AllertonBaildon
BarkerendBurnett Fields
CanterburyCommunityworks
Crossley HallFarnham/Grange
FrizinghallGateway
HeatonHighfield
Holme WoodLidget Green
Low FoldMidland Road
Mortimer HouseOwlet
PrincevilleRainbow
St Edmund'sStrong Close
TyersalWoodroydWoodside
Wyke
Fagley, ParklandBierley, Reevy Hill, Victoria Hall
Farcliffe/Lilycroft, ThorntonCraven, Ilkley 1, Worth Valley
Bingley 1, Bingley 2, Hirst
2007-2010
Source: Health Intelligence and Analysis team NHS ABL PCT
Where numbers are small, children centres have been aggregated
www.everybabymatters.org.uk
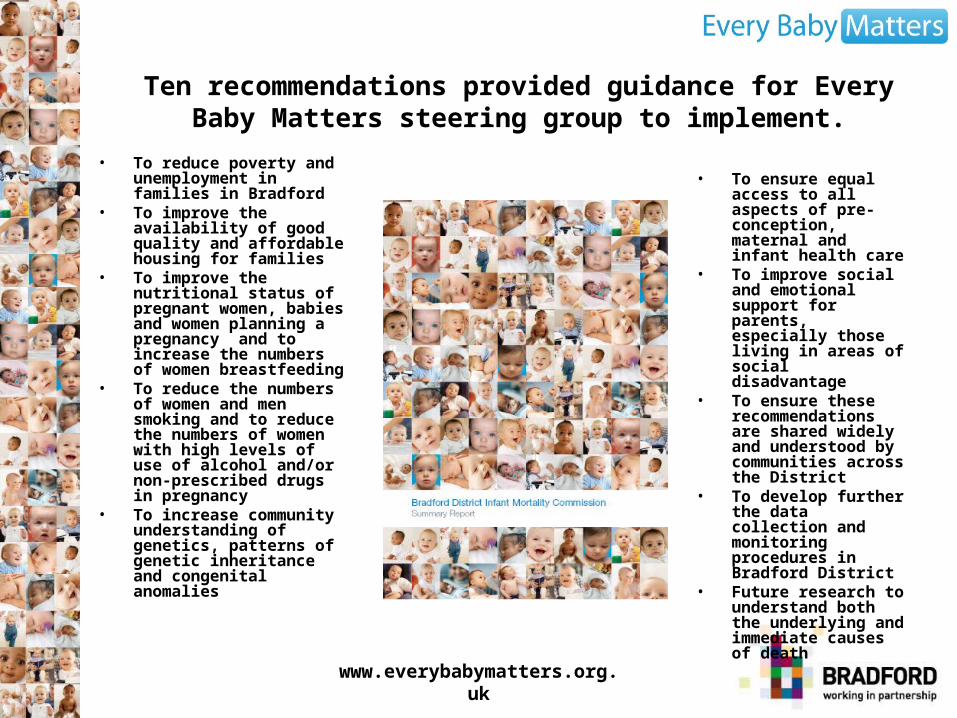
Ten recommendations provided guidance for Every Baby Matters steering group to implement.
• To reduce poverty and unemployment in families in Bradford
• To improve the availability of good quality and affordable housing for families
• To improve the nutritional status of pregnant women, babies and women planning a pregnancy and to increase the numbers of women breastfeeding
• To reduce the numbers of women and men smoking and to reduce the numbers of women with high levels of use of alcohol and/or non-prescribed drugs in pregnancy
• To increase community understanding of genetics, patterns of genetic inheritance and congenital anomalies
• To ensure equal access to all aspects of pre-conception, maternal and infant health care
• To improve social and emotional support for parents, especially those living in areas of social disadvantage
• To ensure these recommendations are shared widely and understood by communities across the District
• To develop further the data collection and monitoring procedures in Bradford District
• Future research to understand both the underlying and immediate causes of death
www.everybabymatters.org.uk
• Child poverty (including unemployment, education & housing) – Recommendations 1 & 2
• Nutrition and breast feeding (Recommendations 3a & 3b)
• Early access to pre-conception , maternity and infant care & prevention and early intervention for at risk families (Recommendations 4 & 5)
• Smoking, alcohol and substance misuse (Recommendations 6a & 6b)
• Genetic inheritance awareness (Recommendation 7)
Key areas of action in the plan
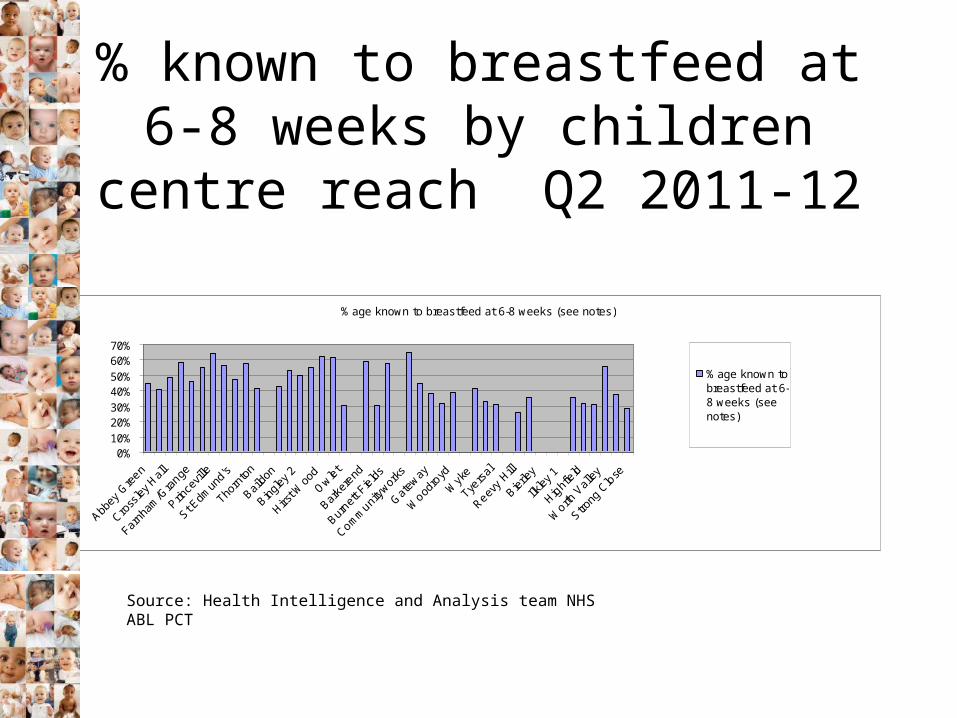
% known to breastfeed at 6-8 weeks by children centre reach Q2 2011-
12
%age known to breastfeed at 6-8 weeks (see notes)
0%10%20%30%40%50%60%70%
%age known tobreastfeed at 6-8 weeks (seenotes)
Source: Health Intelligence and Analysis team NHS ABL PCT
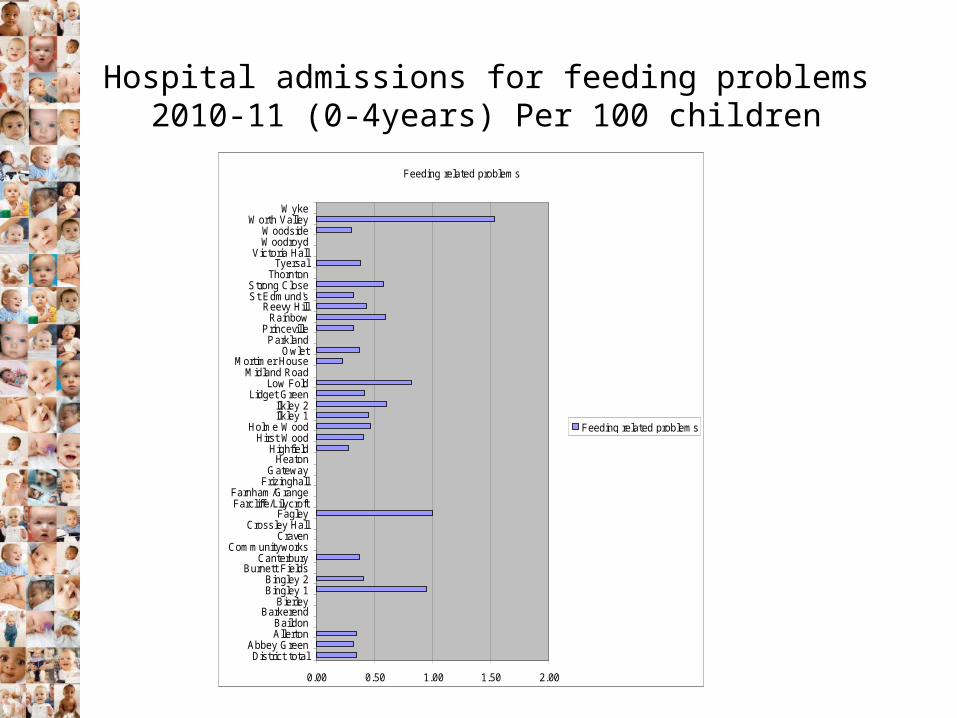
Hospital admissions for feeding problems 2010-11 (0-4years) Per 100 children
Feeding related problems
0.00 0.50 1.00 1.50 2.00
District totalAbbey Green
AllertonBaildon
BarkerendBierley
Bingley 1Bingley 2
Burnett FieldsCanterbury
CommunityworksCraven
Crossley HallFagley
Farcliffe/LilycroftFarnham/Grange
FrizinghallGateway
HeatonHighfield
Hirst WoodHolme Wood
Ilkley 1Ilkley 2
Lidget GreenLow Fold
Midland RoadMortimer House
OwletParkland
PrincevilleRainbow
Reevy HillSt Edmund'sStrong Close
ThorntonTyersal
Victoria HallWoodroydWoodside
Worth ValleyWyke
Feeding related problems
www.everybabymatters.org.uk
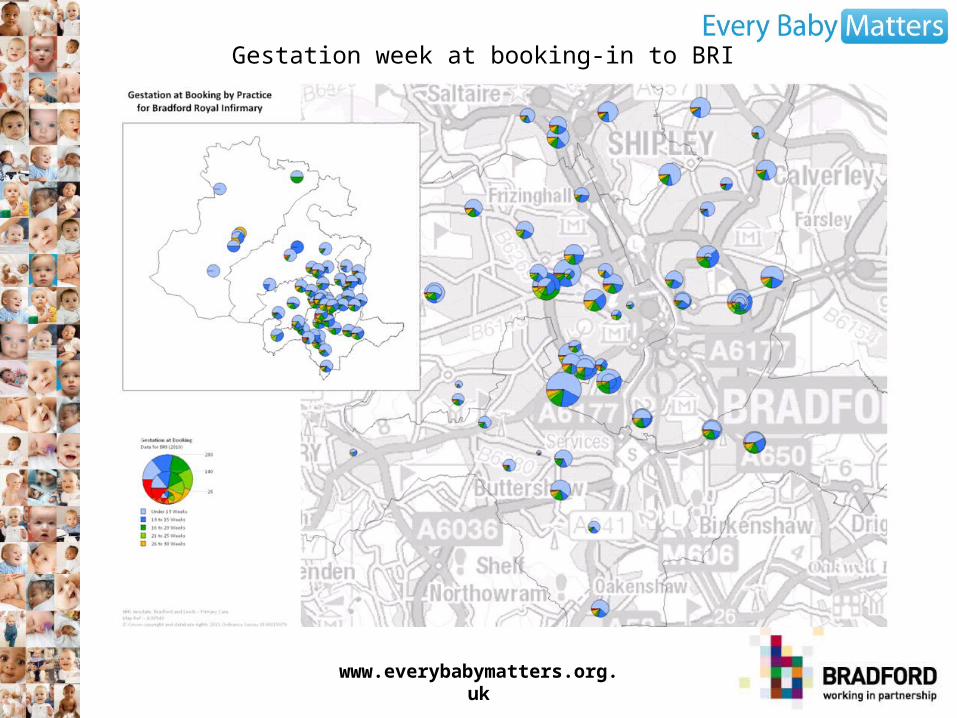
Gestation week at booking-in to BRI
www.everybabymatters.org.uk
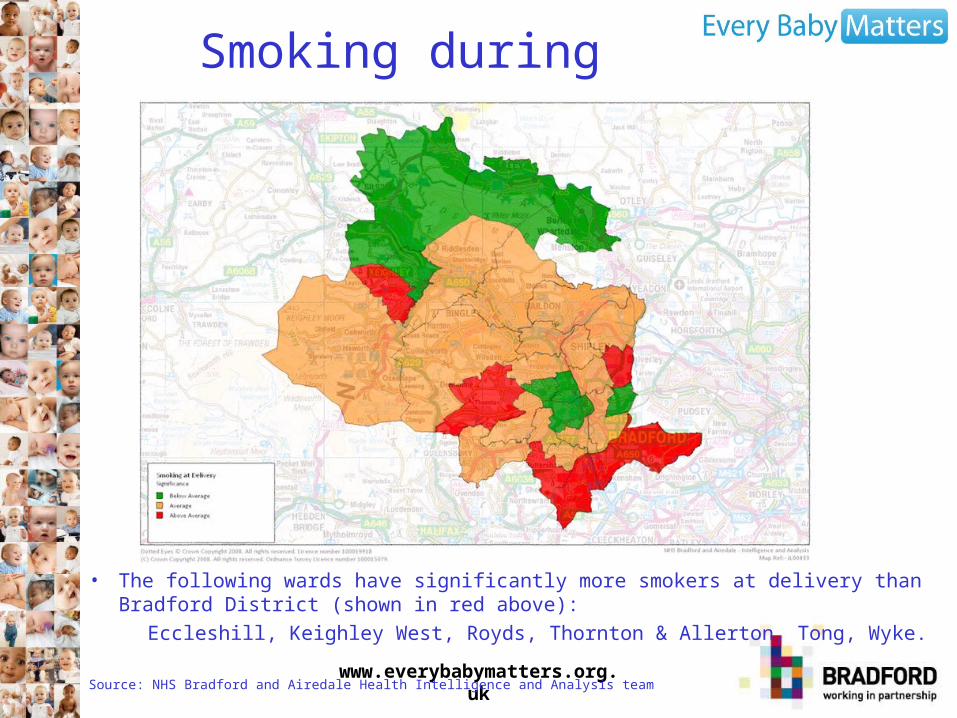
Smoking during Pregnancy
• The following wards have significantly more smokers at delivery than Bradford District (shown in red above):
Eccleshill, Keighley West, Royds, Thornton & Allerton, Tong, Wyke.
Source: NHS Bradford and Airedale Health Intelligence and Analysis team
www.everybabymatters.org.uk