Embed Size (px)
Citation preview
ww
w.f
ore
x2
trad
ein
dia
.weeb
ly.c
om
http://forex2tradeindia.weebly.com/Email : -
Your Success
Story Begins from
HERE
Vol.01
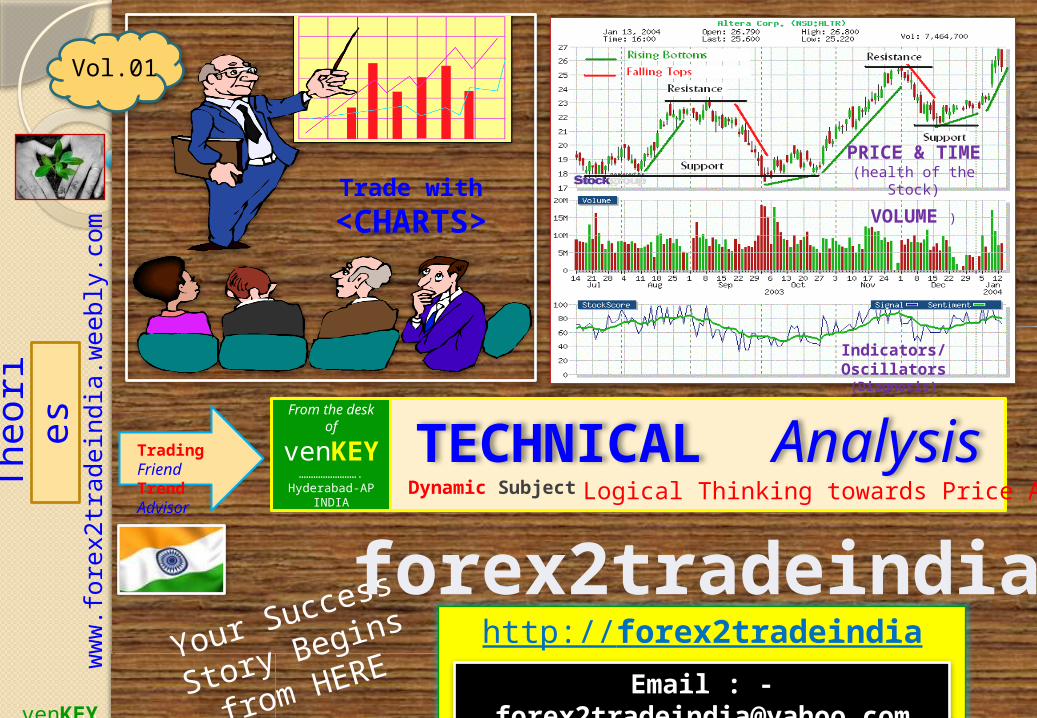
TECHNICAL AnalysisLogical Thinking towards Price ActionDynamic Subject
From the desk of
venKEY
…………………….Hyderabad-AP
INDIA
Trading FriendTrend Advisor
venKE
Y
Th
eori
es
PRICE & TIME(health of the Stock)
VOLUME )
Indicators/Oscillators(Diagnosis)
Trade with
<CHARTS>
forex2tradeindia
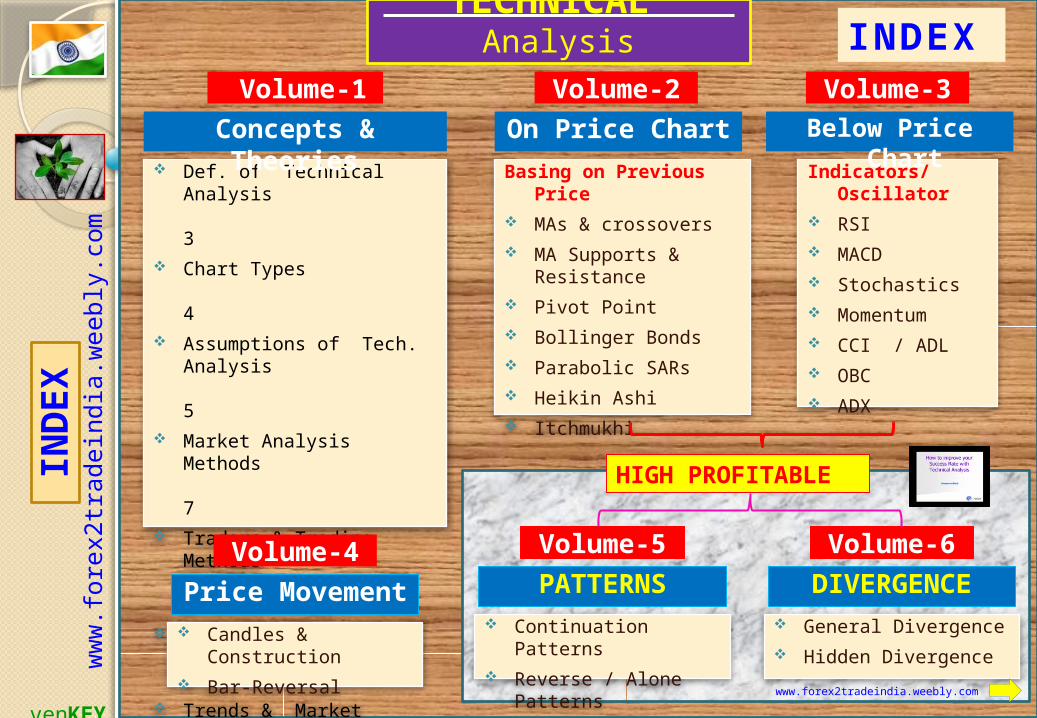
Def. of Technical Analysis
3 Chart Types
4 Assumptions of Tech.
Analysis
5 Market Analysis Methods
7 Traders & Trading Methods
8 Dow Theory
9 Trends & Market Stages
12 Trend Reversal
14 Counter Trend
15 Trend Lines
16 Support & Resistance
18 Gap Theory (imp.)
19
ww
w.f
ore
x2
trad
ein
dia
.weeb
ly.c
om
TECHNICAL Analysis
Basing on Previous Price
MAs & crossovers MA Supports &
Resistance Pivot Point Bollinger Bonds Parabolic SARs Heikin Ashi Itchmukhi
Indicators/Oscillator
RSI MACD Stochastics Momentum CCI / ADL OBC ADX
Volume-1
Concepts & Theories
Volume-2
On Price Chart
Volume-3
Candles & Construction
Bar-Reversal
Price Movement
Volume-4
Below Price Chart
venKE
Y
INDEXIN
DEX
Continuation Patterns Reverse / Alone
Patterns
PATTERNS
Volume-5
General Divergence Hidden Divergence
DIVERGENCE
Volume-6
HIGH PROFITABLE
www.forex2tradeindia.weebly.com
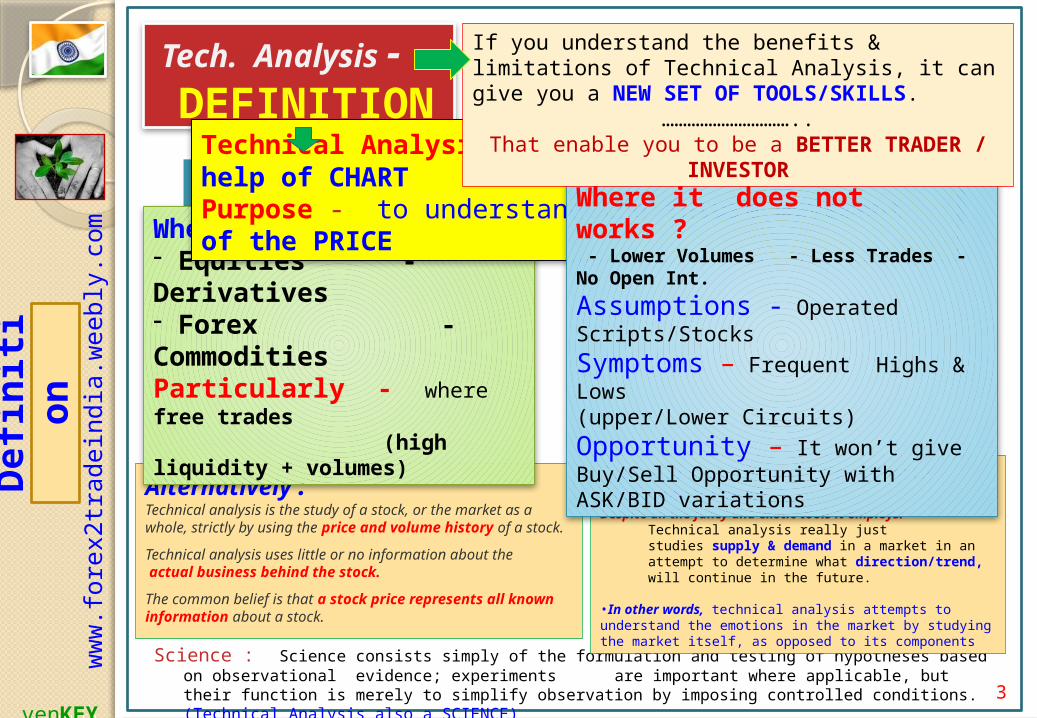
Tech. Analysis
- DEFINITION
Alternatively : Technical analysis is the study of a stock, or the market as a whole, strictly by using the price and volume history of a stock.
Technical analysis uses little or no information about the actual business behind the stock.
The common belief is that a stock price represents all known information about a stock.
ww
w.f
ore
x2
trad
ein
dia
.weeb
ly.c
om
Science : Science consists simply of the formulation and testing of hypotheses based on observational evidence; experiments are important where applicable, but their function is merely to simplify observation by imposing controlled conditions. (Technical Analysis also a SCIENCE)
Technical analysis is an alternative to fundamental analysis.Despite all the fancy and exotic tools it employs:
Technical analysis really just studies supply & demand in a market in an attempt to determine what direction/trend, will continue in the future.
•In other words, technical analysis attempts to understand the emotions in the market by studying the market itself, as opposed to its components
Where it works ? - Equities - Derivatives- Forex - Commodities Particularly - where free trades (high liquidity + volumes)
Technical Analysis - Study of prices with the help of CHARTPurpose - to understand the future movement of the PRICE
Where it does not works ? - Lower Volumes - Less Trades - No Open Int.
Assumptions - Operated Scripts/StocksSymptoms – Frequent Highs & Lows(upper/Lower Circuits)Opportunity – It won’t give Buy/Sell Opportunity with ASK/BID variations
If you understand the benefits & limitations of Technical Analysis, it can give you a NEW SET OF TOOLS/SKILLS.
…………………………..That enable you to be a BETTER TRADER /
INVESTOR
venKE
Y
Defi
nit
ion
3
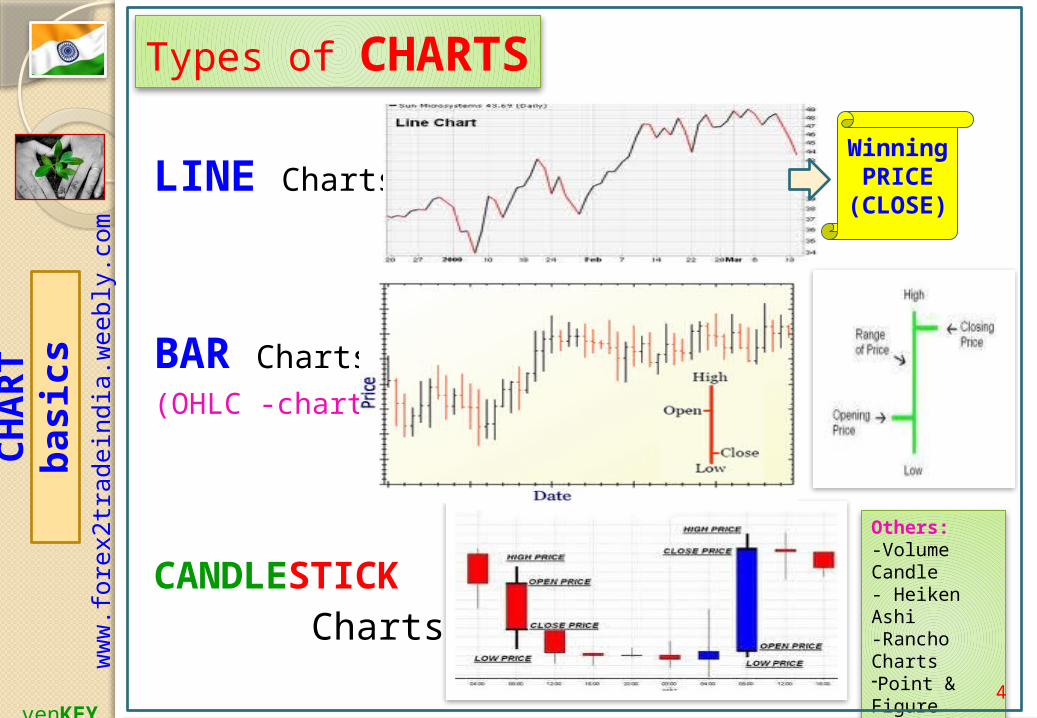
Types of CHARTS
LINE Charts
BAR Charts(OHLC -charts)
CANDLESTICK Charts
Others:-Volume Candle- Heiken Ashi-Rancho Charts-Point & Figure &Other charts
ww
w.f
ore
x2
trad
ein
dia
.weeb
ly.c
om
venKE
Y
CH
AR
T
basic
s
4
Winning PRICE
(CLOSE)
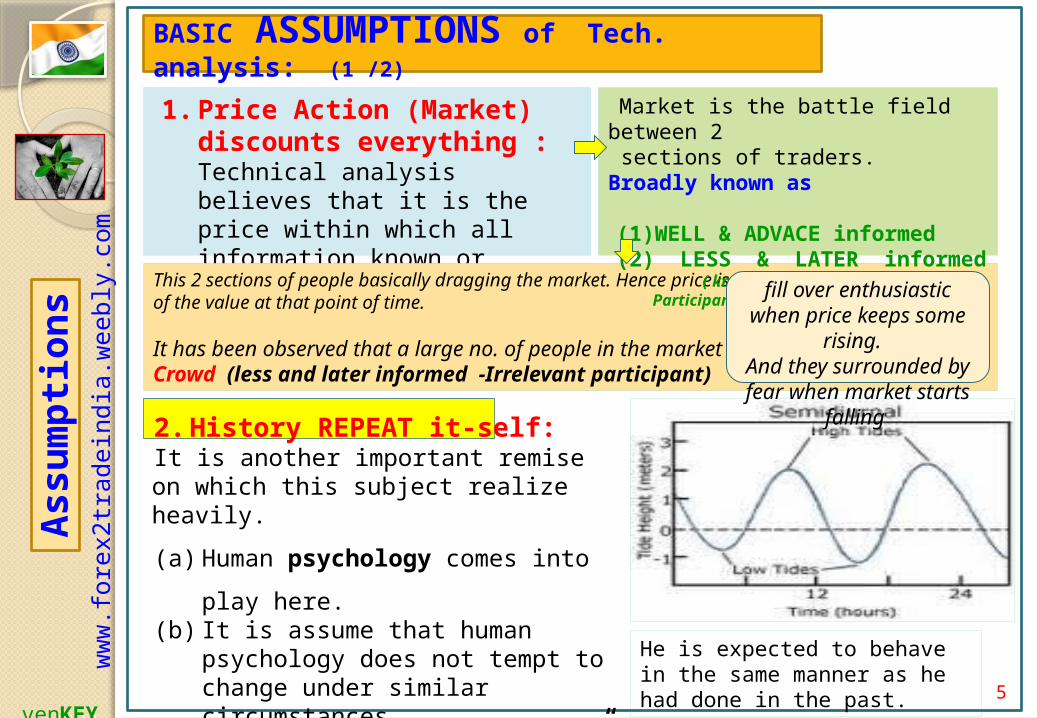
1. Price Action (Market) discounts everything : Technical analysis believes that it is the price within which all information known or unknown is available.
ww
w.f
ore
x2
trad
ein
dia
.weeb
ly.c
om
This 2 sections of people basically dragging the market. Hence price is the censusof the value at that point of time.
It has been observed that a large no. of people in the market known asCrowd (less and later informed -Irrelevant participant)
Market is the battle field between 2 sections of traders. Broadly known as
(1)WELL & ADVACE informed(2) LESS & LATER informed ( known as CROWD/Irrelevant
Participant)
BASIC ASSUMPTIONS of Tech. analysis: (1 /2)
He is expected to behave in the same manner as he had done in the past.
2. History REPEAT it-self: It is another important remise on which this subject realize heavily.
(a) Human psychology comes into
play here.(b) It is assume that human
psychology does not tempt to change under similar circumstances..
(c) According to “Law of Nature” nothing is last forever
venKE
Y
Assu
mp
tion
s
5
fill over enthusiastic when price keeps
some rising. And they surrounded by fear when market
starts falling
ww
w.f
ore
x2
trad
ein
dia
.weeb
ly.c
om
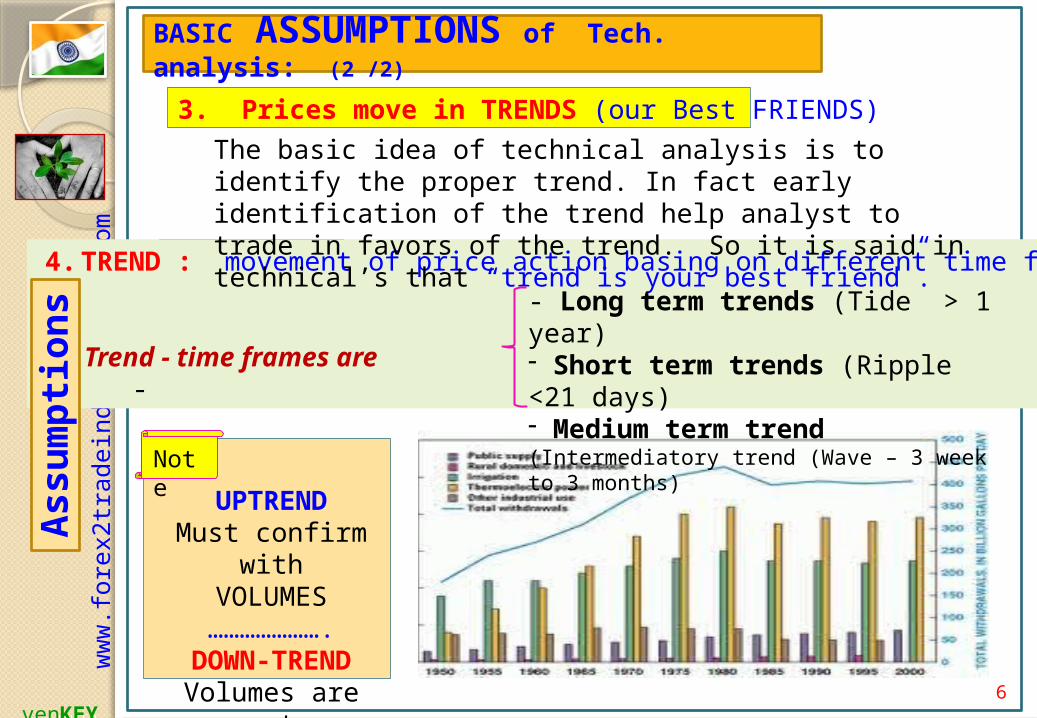
4. TREND : movement of price action basing on different time frames
Trend - time frames are-
3. Prices move in TRENDS (our Best FRIENDS)
The basic idea of technical analysis is to identify the proper trend. In fact early identification of the trend help analyst to trade in favors of the trend. So it is said in technical’s that “trend is your best friend”.
UPTREND
Must confirm with
VOLUMES………………….
DOWN-TREND
Volumes are not particular
venKE
Y
- Long term trends (Tide > 1 year)- Short term trends (Ripple <21 days)- Medium term trend (Intermediatory trend (Wave – 3 week to 3 months)
Assu
mp
tion
s
6
BASIC ASSUMPTIONS of Tech. analysis: (2 /2)
Note
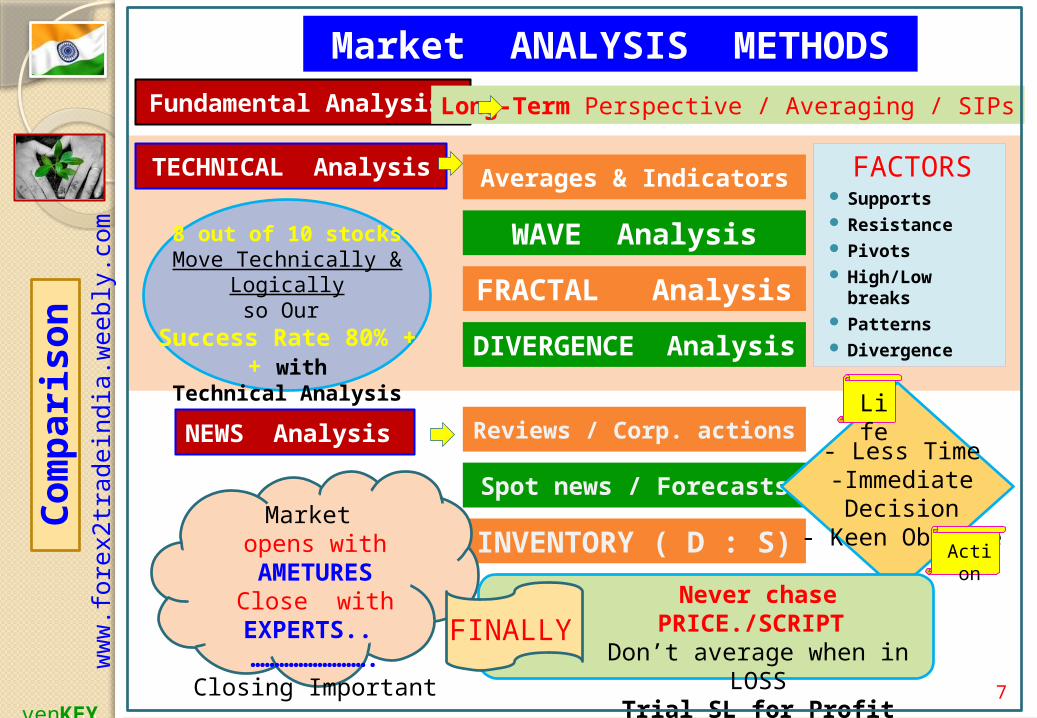
Market ANALYSIS METHODS
ww
w.f
ore
x2
trad
ein
dia
.weeb
ly.c
om
FACTORS Supports Resistance Pivots High/Low
breaks Patterns Divergence
Fundamental Analysis
TECHNICAL Analysis
NEWS Analysis
Averages & Indicators
WAVE Analysis
FRACTAL Analysis
DIVERGENCE Analysis
Reviews / Corp. actions
Spot news / Forecasts
INVENTORY ( D : S)
- Less Time-Immediate
Decision- Keen Observe
8 out of 10 stocksMove Technically &
Logicallyso Our
Success Rate 80% ++ with
Technical Analysis
Long-Term Perspective / Averaging / SIPs
Market opens with AMETURESClose with EXPERTS..
…………………….Closing Important
Never chase PRICE./SCRIPT
Don’t average when in LOSS
Trial SL for Profit locking
FINALLY
venKE
Y
Com
pari
son
7
Life
Action
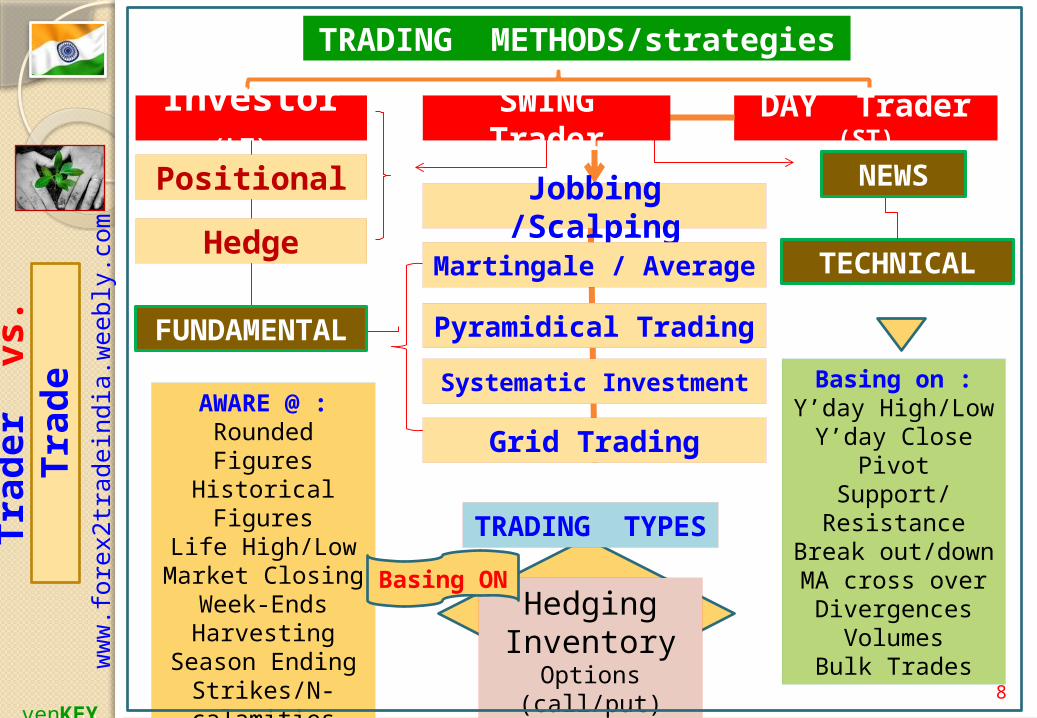
TRADING METHODS/strategies
ww
w.f
ore
x2
trad
ein
dia
.weeb
ly.c
om
Investor
(LT) DAY Trader
(ST)
FUNDAMENTAL
TECHNICAL
NEWS
TRADING TYPES
Basing on :Y’day High/Low
Y’day ClosePivot
Support/Resistance
Break out/downMA cross overDivergences
VolumesBulk Trades
AWARE @ :Rounded Figures
Historical Figures
Life High/LowMarket Closing
Week-EndsHarvesting
Season EndingStrikes/N-calamities
Dollar fluctuation
HedgingInventory
Options (call/put)
Positional
Hedge
Basing ON
SWING Trader
Jobbing /Scalping
Martingale / Average
Pyramidical Trading
Systematic Investment
Grid Trading
venKE
Y
Trad
er
vs.
Trad
e
8
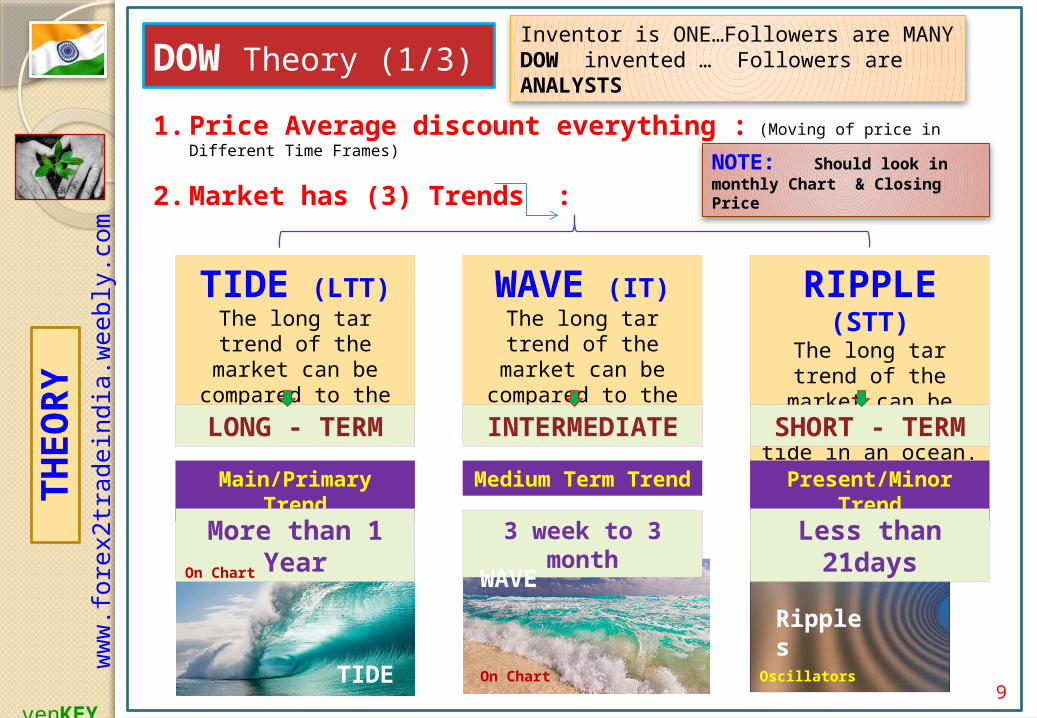
Inventor is ONE…Followers are MANYDOW invented … Followers are ANALYSTS
NOTE: Should look in monthly Chart & Closing Price
ww
w.f
ore
x2
trad
ein
dia
.weeb
ly.c
om
TIDE (LTT)The long tar trend of the market can be compared to the tide in an ocean.
LONG - TERM
Main/Primary Trend
More than 1 Year
WAVE (IT)The long tar trend of the market can be compared to the tide in an ocean.
INTERMEDIATE
Medium Term Trend
3 week to 3 month
RIPPLE (STT)
The long tar trend of the market can be compared to the tide in an ocean.SHORT - TERM
Present/Minor Trend
Less than 21days
1. Price Average discount everything : (Moving of price in Different Time Frames)
2. Market has (3) Trends :
DOW Theory (1/3)
venKE
Y
TH
EO
RY
9TIDE
WAVE Ripple
s
On Chart
On Chart Oscillators
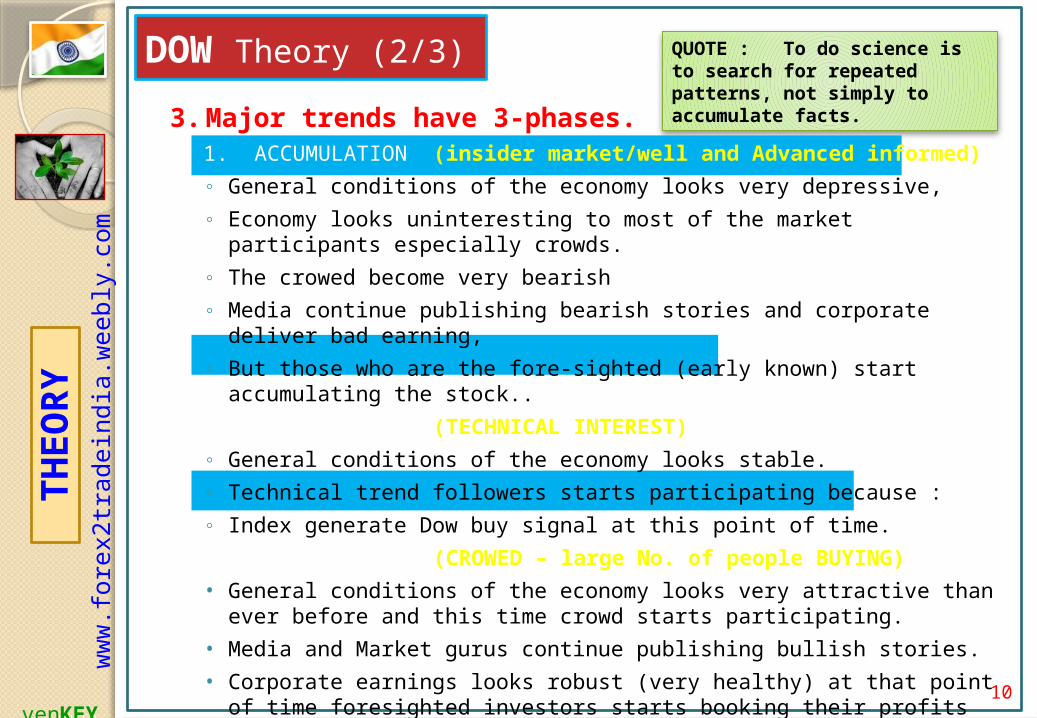
DOW Theory (2/3) QUOTE : To do science is to search for repeated patterns, not simply to accumulate facts.3. Major trends have 3-phases.
1. ACCUMULATION (insider market/well and Advanced informed)
◦ General conditions of the economy looks very depressive,
◦ Economy looks uninteresting to most of the market participants especially crowds.
◦ The crowed become very bearish
◦ Media continue publishing bearish stories and corporate deliver bad earning,
◦ But those who are the fore-sighted (early known) start accumulating the stock..
2. CONSOLIDATION (TECHNICAL INTEREST)
◦ General conditions of the economy looks stable.
◦ Technical trend followers starts participating because :
◦ Index generate Dow buy signal at this point of time.
3. DISTRIBUTION (CROWED – large No. of people BUYING)
• General conditions of the economy looks very attractive than ever before and this time crowd starts participating.
• Media and Market gurus continue publishing bullish stories.
• Corporate earnings looks robust (very healthy) at that point of time foresighted investors starts booking their profits (distributions –selling of accumulated stocks)
Because they bought shares when nobody want to buy… now they selling shares where crowed want to buy.
venKE
Y
ww
w.f
ore
x2
trad
ein
dia
.weeb
ly.c
om
TH
EO
RY
10
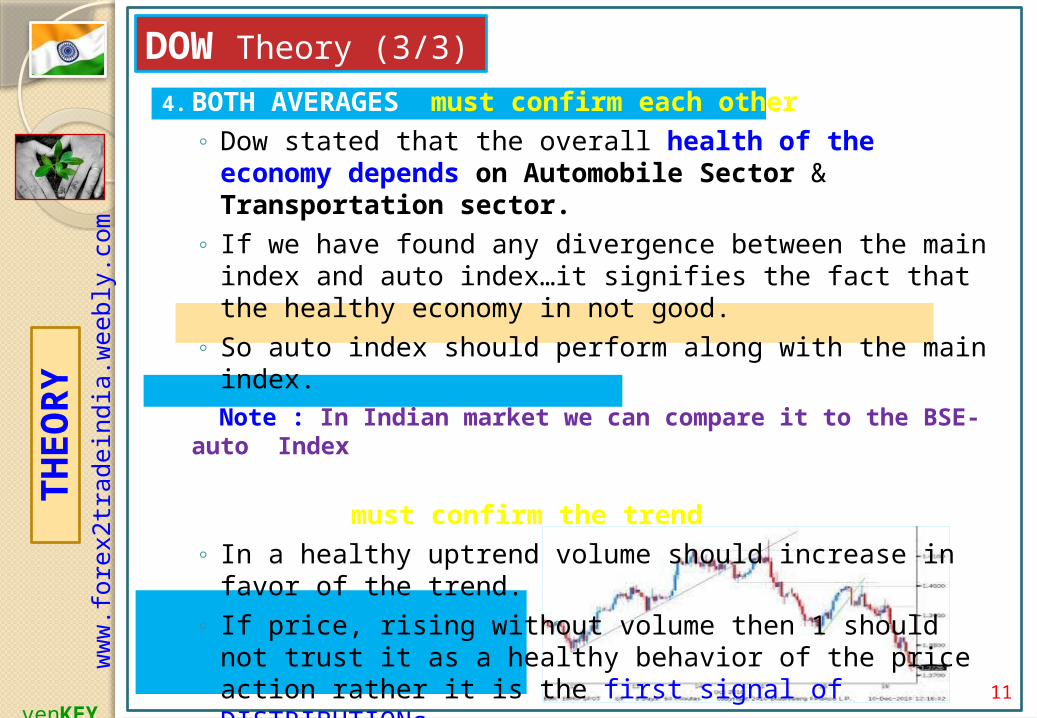
DOW Theory (3/3)
4. BOTH AVERAGES must confirm each other ◦ Dow stated that the overall health of the economy
depends on Automobile Sector & Transportation sector.
◦ If we have found any divergence between the main index and auto index…it signifies the fact that the healthy economy in not good.
◦ So auto index should perform along with the main index.
Note : In Indian market we can compare it to the BSE-auto Index
5.VOLUME must confirm the trend◦ In a healthy uptrend volume should increase in favor of
the trend. ◦ If price, rising without volume then 1 should not trust it
as a healthy behavior of the price action rather it is the first signal of DISTRIBUTIONs.
6. Trends once in motions shall be
assumed to be continue unless
it gives a reversal signal.
venKE
Y
ww
w.f
ore
x2
trad
ein
dia
.weeb
ly.c
om
TH
EO
RY
11
12
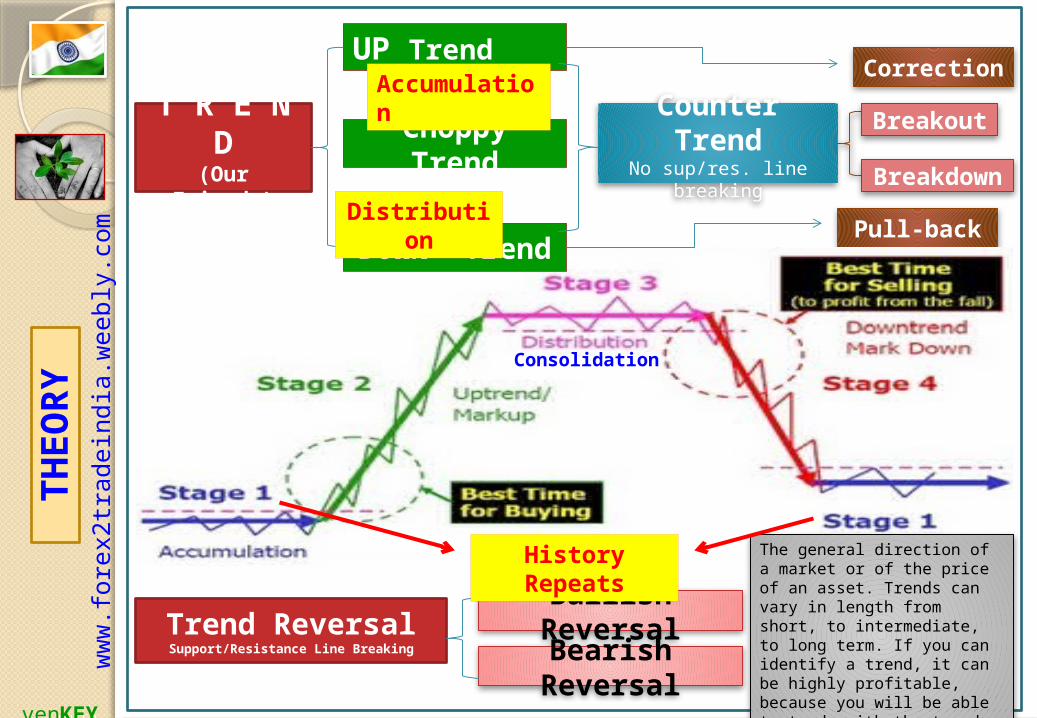
Correction
Pull-back
Counter Trend
No sup/res. line breaking
The general direction of a market or of the price of an asset. Trends can vary in length from short, to intermediate, to long term. If you can identify a trend, it can be highly profitable, because you will be able to trade with the trend
Trend ReversalSupport/Resistance Line Breaking
Bullish ReversalBearish Reversal
T R E N D
(Our Friends)
UP Trend
Choppy Trend
DOWN Trend
Breakout
Breakdown
Accumulation
Distribution
Consolidation
History Repeats
venKE
Y
ww
w.f
ore
x2
trad
ein
dia
.weeb
ly.c
om
TH
EO
RY
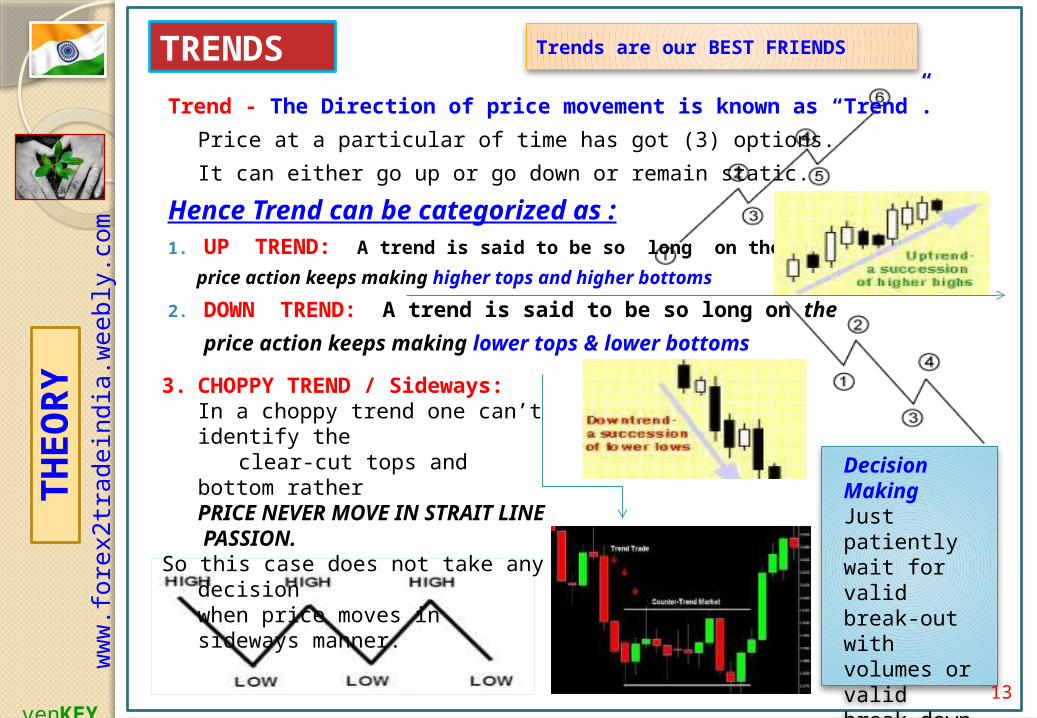
TRENDS Trends are our BEST FRIENDS
Decision MakingJust patiently wait for valid break-out with volumes or valid break-down (no need of volumes)
3. CHOPPY TREND / Sideways:In a choppy trend one can’t identify the
clear-cut tops and bottom rather PRICE NEVER MOVE IN STRAIT LINE PASSION.
So this case does not take any decision when price moves in sideways manner.
13 venKE
Y
ww
w.f
ore
x2
trad
ein
dia
.weeb
ly.c
om
TH
EO
RY
Trend - The Direction of price movement is known as “Trend”.
Price at a particular of time has got (3) options.
It can either go up or go down or remain static.
Hence Trend can be categorized as :1. UP TREND: A trend is said to be so long on the
price action keeps making higher tops and higher bottoms
2. DOWN TREND: A trend is said to be so long on the
price action keeps making lower tops & lower bottoms
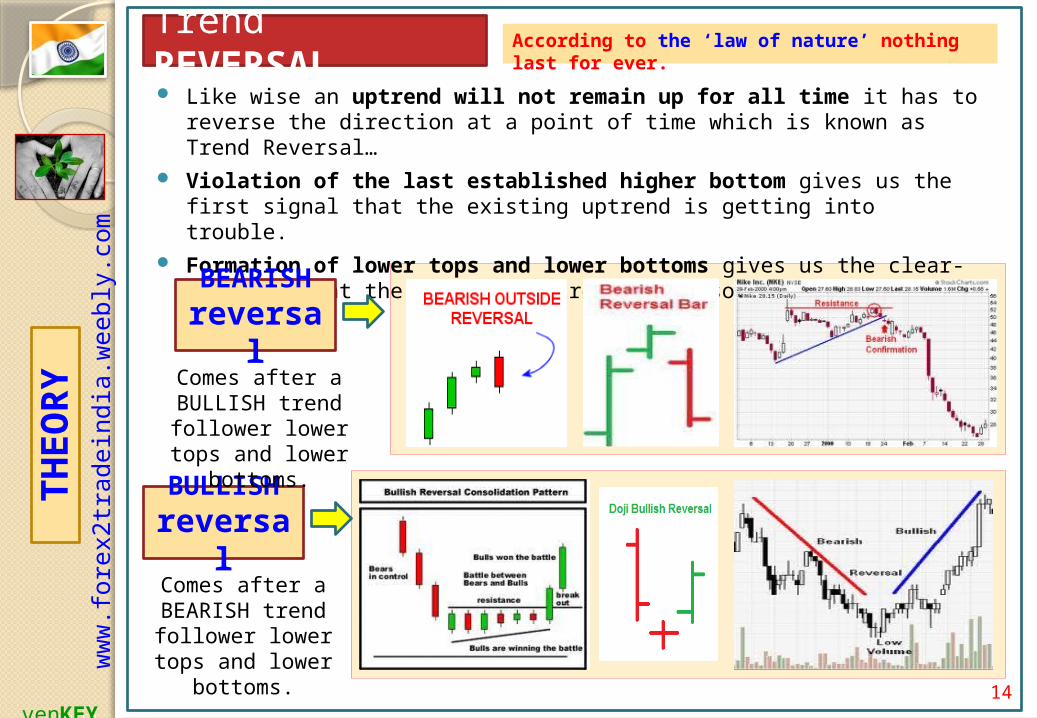
Like wise an uptrend will not remain up for all time it has to reverse the direction at a point of time which is known as Trend Reversal…
Violation of the last established higher bottom gives us the first signal that the existing uptrend is getting into trouble.
Formation of lower tops and lower bottoms gives us the clear-cut idea that the existing uptrend is consolidating to down-trend.
Trend REVERSAL
BEARISHreversa
l
BULLISHreversa
l
According to the ‘law of nature’ nothing last for ever.
Comes after a BULLISH trend
follower lower tops and lower bottoms.
Comes after a BEARISH trend
follower lower tops and lower bottoms.
14 venKE
Y
ww
w.f
ore
x2
trad
ein
dia
.weeb
ly.c
om
TH
EO
RY
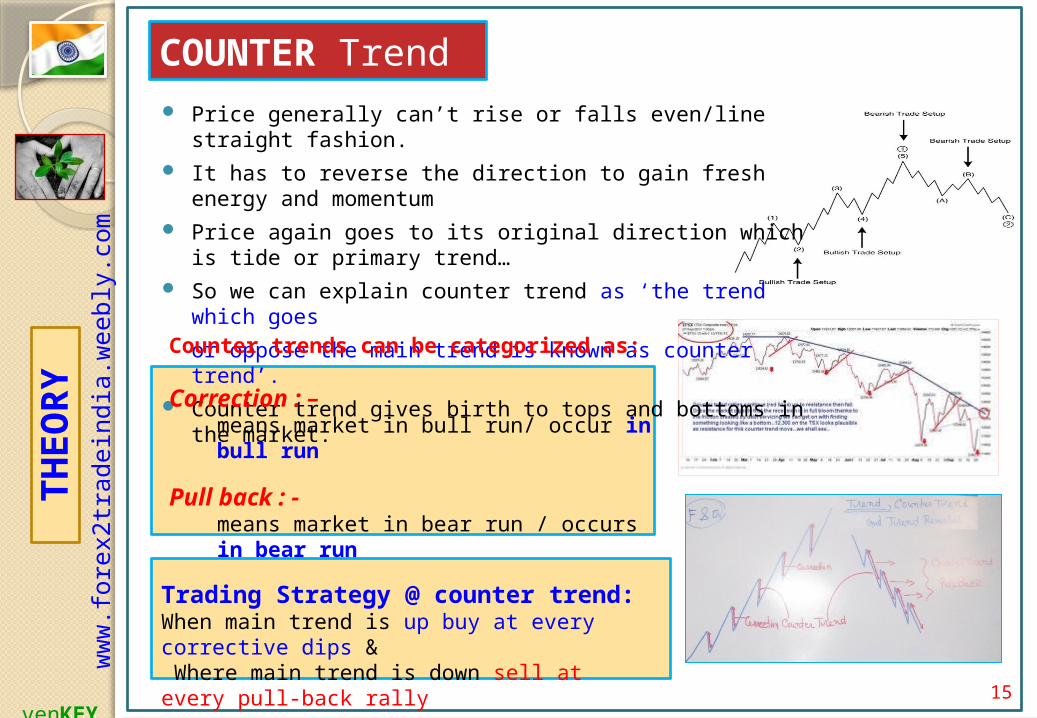
COUNTER Trend Price generally can’t rise or falls even/line straight fashion. It has to reverse the direction to gain fresh energy and
momentum Price again goes to its original direction which is tide or
primary trend… So we can explain counter trend as ‘the trend which goes
or oppose the main trend is known as counter trend’. Counter trend gives birth to tops and bottoms in the
market.
Trading Strategy @ counter trend:When main trend is up buy at every corrective dips & Where main trend is down sell at every pull-back rally
Counter trends can be categorized as:
Correction : – means market in bull run/ occur in bull run
Pull back : - means market in bear run / occurs in bear run
15 venKE
Y
ww
w.f
ore
x2
trad
ein
dia
.weeb
ly.c
om
TH
EO
RY
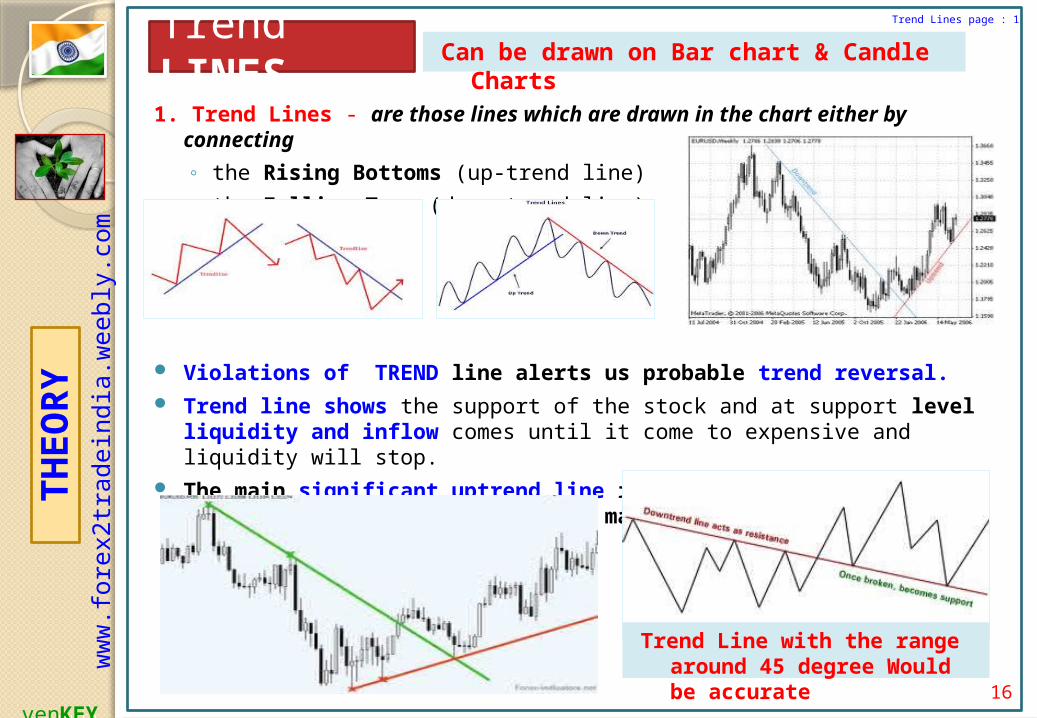
1. Trend Lines - are those lines which are drawn in the chart either by connecting
◦ the Rising Bottoms (up-trend line)
◦ the Falling Tops (down-trend line)
Violations of TREND line alerts us probable trend reversal. Trend line shows the support of the stock and at support level
liquidity and inflow comes until it come to expensive and liquidity will stop.
The main significant uptrend line is ‘it acts as a STRONG support / resistance as the case may be’
Trend LINES
Trend Lines page : 1
Can be drawn on Bar chart & Candle Charts
Trend Line with the range around 45 degree Would be accurate 16
venKEY
ww
w.f
ore
x2
trad
ein
dia
.weeb
ly.c
om
TH
EO
RY
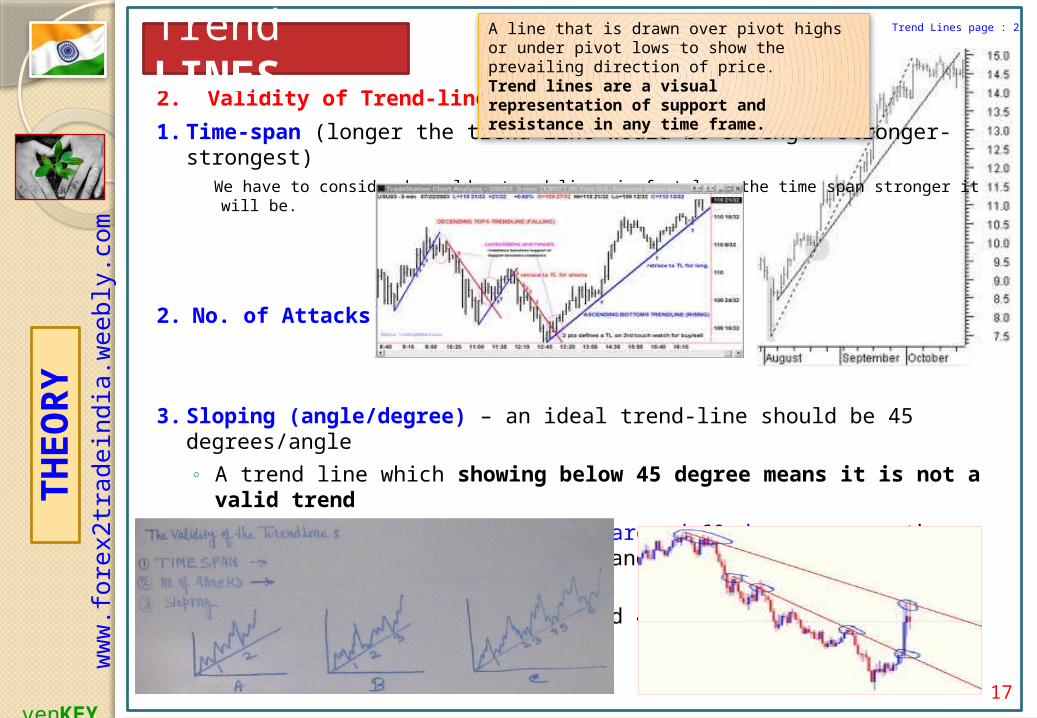
2. Validity of Trend-line:
1. Time-span (longer the trend line would be strength-stronger-strongest) We have to consider how old a trend-line… in fact long the time span stronger it will be.
2. No. of Attacks :
3. Sloping (angle/degree) – an ideal trend-line should be 45 degrees/angle
◦ A trend line which showing below 45 degree means it is not a valid trend
◦ A trend line which is above or around 60 degree means the price of such stock is running and ready to sour/need retracement.
◦ Trend-line with the range around 45 degrees would be accurate.
A line that is drawn over pivot highs or under pivot lows to show the prevailing direction of price. Trend lines are a visual representation of support and resistance in any time frame.
Trend Lines page : 2Trend LINES
17 venKE
Y
ww
w.f
ore
x2
trad
ein
dia
.weeb
ly.c
om
TH
EO
RY
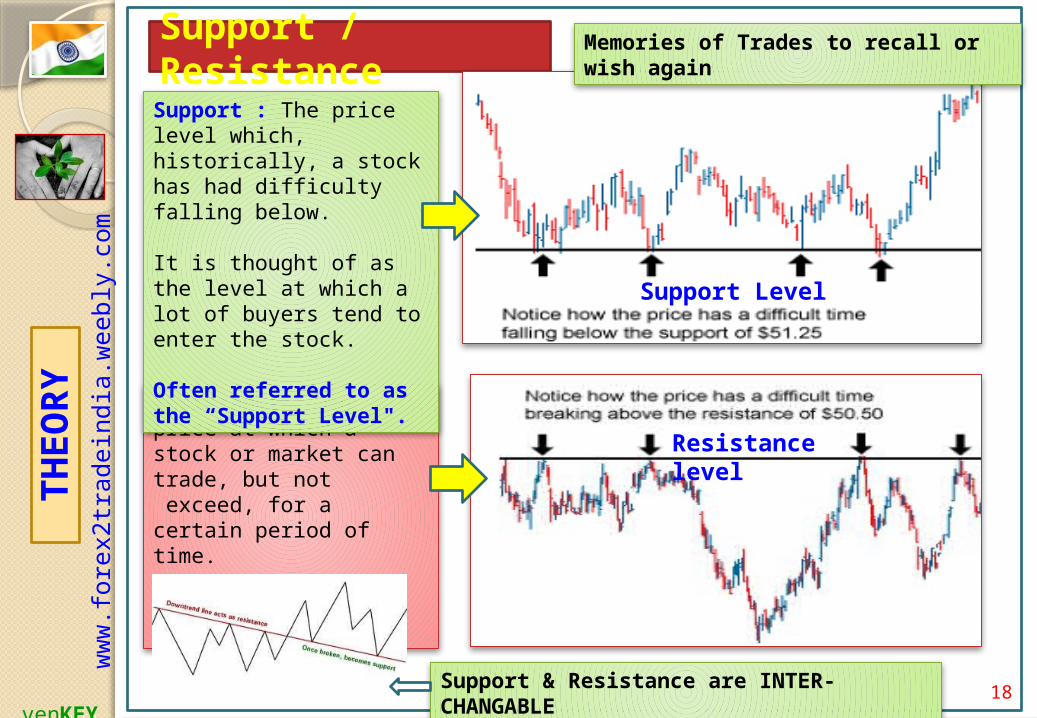
Support / Resistance
Resistance: The price at which a stock or market can trade, but not exceed, for a certain period of time.
Often referred to as “Resistance Level".
Support : The price level which, historically, a stock has had difficulty falling below.
It is thought of as the level at which a lot of buyers tend to enter the stock.
Often referred to as the “Support Level".
Memories of Trades to recall or wish again
Support & Resistance are INTER-CHANGABLE
Support Level
Resistance level
venKE
Y
ww
w.f
ore
x2
trad
ein
dia
.weeb
ly.c
om
TH
EO
RY
18
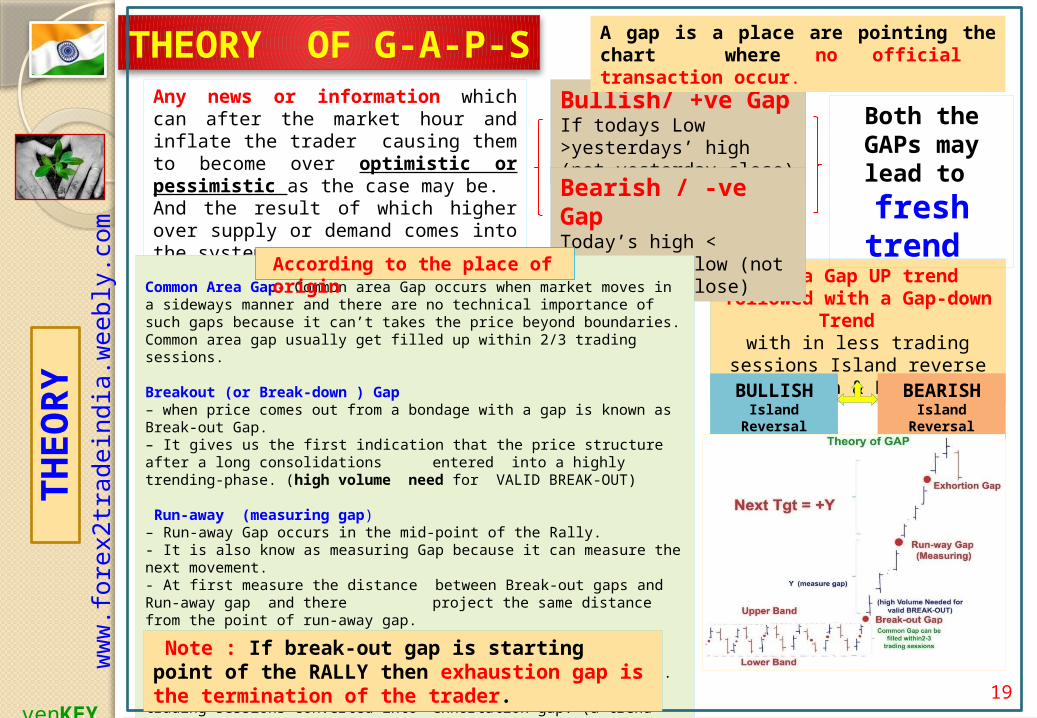
Any news or information which can after the market hour and inflate the trader causing them to become over optimistic or pessimistic as the case may be. And the result of which higher over supply or demand comes into the system. Which causing a GAP in the chart.
THEORY OF G-A-P-S
If a Gap UP trend followed with a Gap-down
Trend with in less trading sessions
Island reverse (Bullish & Bearish)
Bullish/ +ve Gap If todays Low >yesterdays’ high (not yesterday close)Bearish / -ve Gap Today’s high < yesterdays’ low (not yesterdays close)
Both the GAPs may lead to
fresh trend
Common Area Gap- Common area Gap occurs when market moves in a sideways manner and there are no technical importance of such gaps because it can’t takes the price beyond boundaries. Common area gap usually get filled up within 2/3 trading sessions. Breakout (or Break-down ) Gap – when price comes out from a bondage with a gap is known as Break-out Gap. – It gives us the first indication that the price structure after a long consolidations entered into a highly trending-phase. (high volume need for VALID BREAK-OUT) Run-away (measuring gap) – Run-away Gap occurs in the mid-point of the Rally. - It is also know as measuring Gap because it can measure the next movement. - At first measure the distance between Break-out gaps and Run-away gap and there project the same distance from the point of run-away gap. Exhortation of Gap – Exhaustions gaps is nothing but a converged run-away gap . - Any run-away gap which gets filled-up within 3-4 trading sessions converted into exhortation gap. (a trend where going to take reversal)
Note : If break-out gap is starting point of the RALLY then exhaustion gap is the termination of the trader.
A gap is a place are pointing the chart where no official transaction occur.
According to the place of origin
BULLISHIsland
Reversal
BEARISHIsland
Reversal
19 venKE
Y
ww
w.f
ore
x2
trad
ein
dia
.weeb
ly.c
om
TH
EO
RY
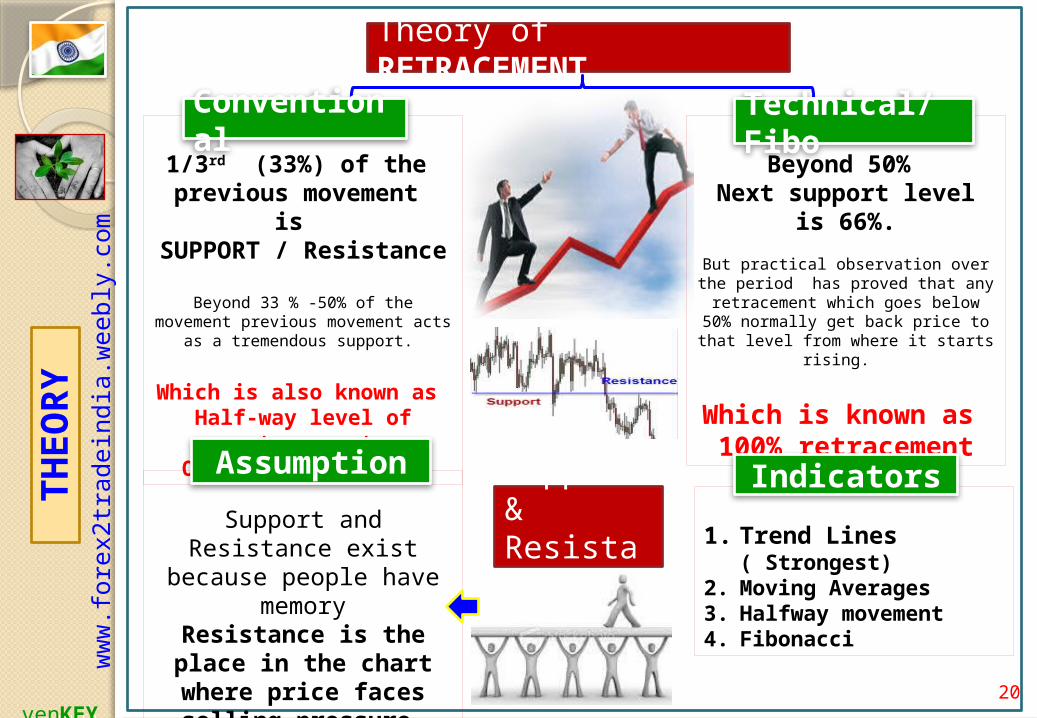
Beyond 50% Next support level is
66%.
But practical observation over the period has proved that any
retracement which goes below 50% normally get back price to that level
from where it starts rising.
Which is known as 100% retracement
Theory of RETRACEMENT
ww
w.f
ore
x2
trad
ein
dia
.weeb
ly.c
om
venKE
Y
1/3rd (33%) of the previous movement
is SUPPORT / Resistance
Beyond 33 % -50% of the movement previous movement acts as a
tremendous support.
Which is also known as Half-way level of
retracementOr 50% retracement.
Conventional
Technical/Fibo
20
TH
EO
RY
1. Trend Lines ( Strongest)
2. Moving Averages3. Halfway movement4. Fibonacci
IndicatorsSupport & Resistances
Support and Resistance exist because people
have memoryResistance is the place in the chart where price faces selling pressure from the bears.
Assumption
ww
w.f
ore
x2
trad
ein
dia
.weeb
ly.c
om
venKE
Y
21
TH
EO
RYKeep a hold of your plan. You should forge a plan according to which you will invest your money with the addition of strict rules that should never be broken whatever the circumstances. Strict rules will help eliminate emotions like hope, greed, fear and many other emotions that could prove destructive on the market.
Do not invest all your capital in one particular investment. 10-20% of your capital in one transaction should be enough.
Do not change the level of your stop loss with hope that the market will change direction. Hope will lose you money and should be eliminated.
Cut losses as soon as possible. On the other hand do not fear losses. They are part of the game.
Do not be afraid to earn money. Hold winning positions as long as possible. Remember that before opening a position you should have an aim. If this aim is fulfilled then you may close your position, never earlier.
Do not force yourself to open a market position. If you do not see anything happening, just take a break.
Always evaluate how much you can earn in comparison to what you can lose. Try to hold at least a 3:1 relation.
Note down all your transactions. Analyze both the winning and losing transactions. By doing so you will not only understand your mistakes but you will understand your emotions when making different decisions.
Do not invest in a group. The more opinions, the more emotions. Does this mean that you should not read the analysts comments and reports? No, but it does mean that if you have a planned position, then do not change your decision upon reading some analysts differing opinion. Why should you be wrong? And remember, analysts are not always good traders.
How to survive on investment markets
Investors should keep in mind that both technical and fundamental analysis are not enough to earn money on investment markets. Investors often forget about two significant aspects. The first is the management of our capital and the second is market psychology. Here are a set of basic rules that will help you achieve your goals in the world of investment.Rules:Always open positions in the direction of the trend. Never break this rule even if it helps you earn money a few times. Break this rule and you will learn that the market is the ruler of the world of investments and unfortunately not the investor.