Embed Size (px)
Citation preview

www.njctl.org
2012-11-26
6th Grade
Dependent & Independent
Variables

Dependent and Independent
VariablesReturn to Table of Contents
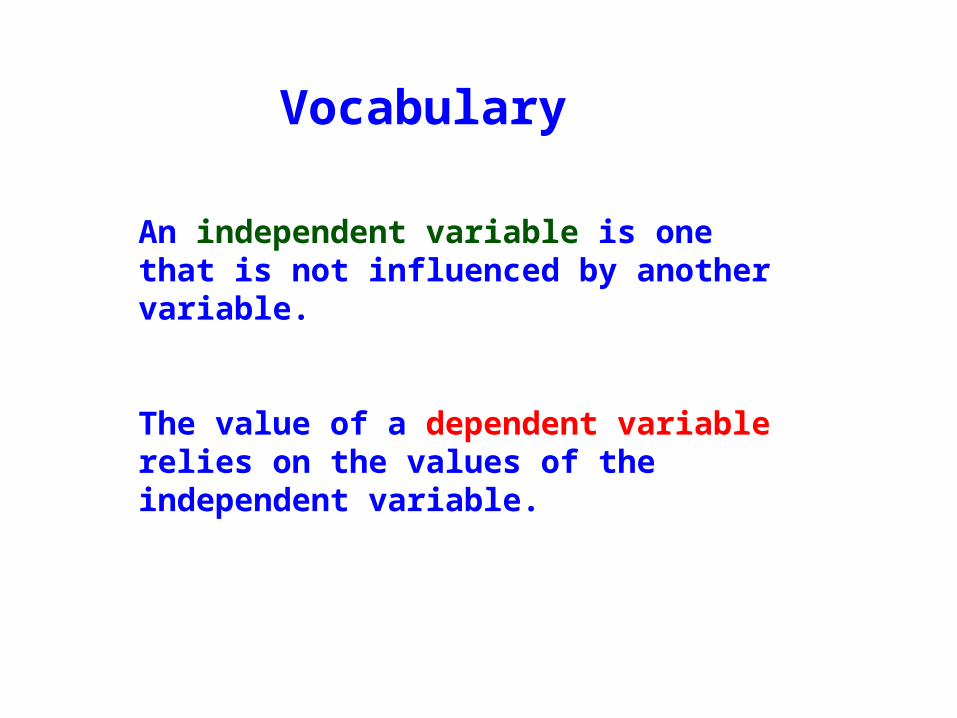
An independent variable is one that is not influenced by another variable.
The value of a dependent variable relies on the values of the independent variable.
Vocabulary

Frank earns $8 per hour mowing his neighbors' lawns.
The amount of money he earns m, depends on how many hours he works h.
The more hours he works, the more money he earns.
Therefore the dependent variable is money m,and the independent variable is hours h.
The amount of hours he works does not rely on the money he earns.
Example

Independent Dependent
how far you drive how much gas you use
weight of child amount of dosage
Tired you are How you study
Try to guess the missing variable.
With your group, try to think of at least three examples of independent and dependent variables?
Independent DependentClick
Equations and Tables
Return to Table of Contents

The relationship between dependent and independent variables can be
represented with a table.
Independent Dependent
Input Output
The independent variable is always in the left column, and the dependent
variable is always in the right column.
The relationship between independent & dependent variables and input & output works like a machine.

The value of the output relies on 1. The value of the input 2. The ruleInput
Output
Rule
The rule is the relationship between the input and the output.
It says what happens to the input inside the machine.
The value of the output always depends on the value of the input.

n 2n
20
40
100 200
80
40click
click
click
The value of n is the input.Given the value for n, find the output using the given rule.
Input Output

x + 15
$53
$70
$115
The manager of the department store raised the price $15 on each video game.
$100
$38
x
Price after mark up
$55
Original price
Can you find an expression (rule) that will satisfy the total cost of the video game if given the original
price?
click
click
click
click

Graphing Equations

You have learned that equations and tables are two ways to represent real-life scenarios.
Equations and tables can also be graphed to represent a real-life scenario.
Example:
A cafeteria has an automatic waffle-making machine. The table shows the relationship between the time in hours (x) and the number of waffles the machine can make (y).
(x) (y)
1 50
2 100
3 150
4 200
5 250

(x) (y)
1 50
2 100
3 150
4 200
5 250
The equation for this scenario is y = 50x
Each hour, 50 waffles are made.
This scenario can be represented with a graph.
When graphing:
The independent variable is always across the x axis.
The dependent variable is always up the y axis.
The value of y depends on the value of x.
y is dependent x is independent

Time(x)
Waffles Made
(y)
1 50
2 100
3 150
4 200
5 250
Once you have represented the equation in a function table, you can utilize the independent and dependent variable values as coordinates.
Plot the coordinates from the table below to graph the scenario.