Embed Size (px)
Citation preview

www.regionalsustainability.org
Ecological Footprints
and SCP
John Barrett
Stockholm Environment Institute
Sustainable Consumption and Production Programme

www.regionalsustainability.org
Content
• Adapt National Footprint Accounts to make it more relevant to SCP
• Make this relevant to Devolved Countries and Local Authorities
– Eco-Budget Project
– Scotland’s Global Footprint Project
– Resources and Energy Analysis Programme

www.regionalsustainability.org
UK Policy
• One Planet Economy (Chapter 3 of SDS)
• Scottish Sustainable Development Strategy
• Sustainable Consumption and Production Framework
• Decoupling Economy from Environment
• Concern related imports of goods and services

www.regionalsustainability.org
Relevant to Devolved Countries and Local Authorities
• How can Scotland contribute to a “One Planet Economy”
• What understanding do we have of the consumption in Scotland?
• How effective might be different policies be?
• Transport, Housing, Energy Efficiency, Procurement, Waste
• Closer or further away from our goal?

www.regionalsustainability.org
UK Accounts to Local Level
• Robust approach to move from National to Local
• Used in Scottish LAs
• Using Input-Output Tables to understand indirect flows
• Allocating the Carbon Dioxide Emissions and EF to expenditure
• Employing Local Data to Calculate the EF of all local authority areas

www.regionalsustainability.org
The Result
• Detailed understanding of the impact of consumption patterns by 70 categories
• Carbon Dioxide Emissions and EF of every devolved country, regional and local authority area in the UK
• Breakdown of Carbon Dioxide Emissions and EF by 54 socio-demographic groups
• Model that has a significant number of applications at devolved country and local level (policy and communication)
• Under Eco-Budget Project, Scot – Material Flow Accounts for UK, Scotland, Wales and regions

www.regionalsustainability.org
Carbon Dioxide Analysis
14.510.3 11.311.5
0
2
4
6
8
10
12
14
16
UK Wales
CO
2 em
issi
ons
per c
apita
in o
ne y
ear [
t/cap
] .
Producerresponsibility(territorial emissions)
Consumerresponsibility
www.regionalsustainability.org
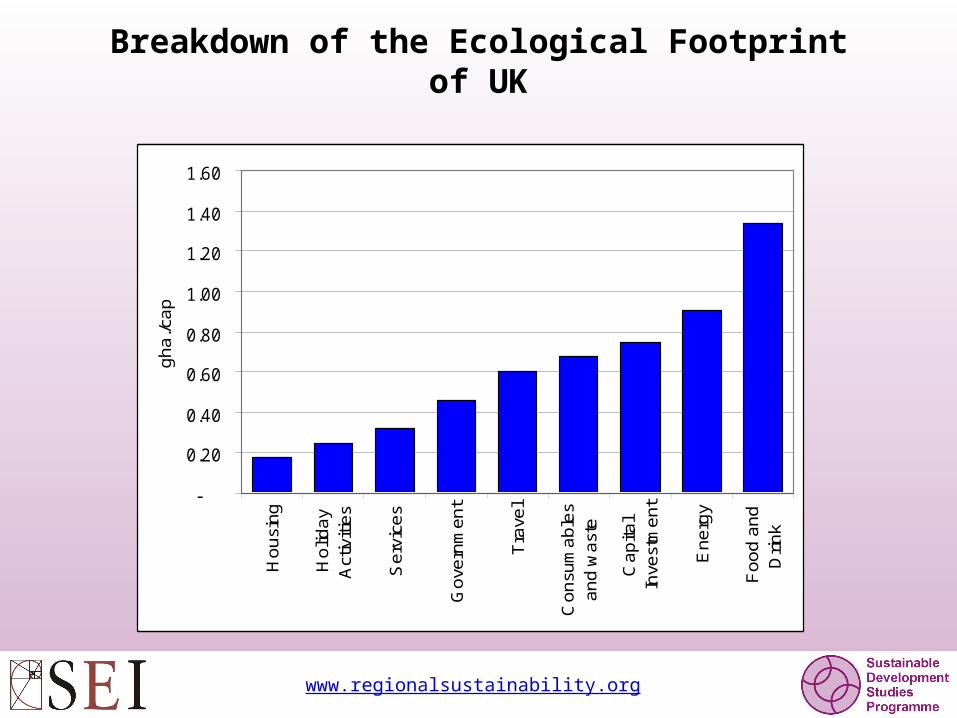
Breakdown of the Ecological Footprint of UK
-
0.20
0.40
0.60
0.80
1.00
1.20
1.40
1.60
Ho
usi
ng
Ho
lida
yA
ctiv
itie
s
Se
rvic
es
Go
vern
me
nt
Tra
vel
Co
nsu
ma
ble
sa
nd
wa
ste
Ca
pita
lIn
vest
me
nt
En
erg
y
Fo
od
an
dD
rin
k
gh
a./c
ap

www.regionalsustainability.org
Transport Ecological Footprint
-
0.05
0.10
0.15
0.20
0.25
0.30
0.35
0.40
0.45
0.50
Mo
torc
ycle
Oth
er
Pu
blic
No
n L
oca
lB
us T
axi
Lo
cal B
us
Va
n /
Lo
rry
Ra
il
Ca
r
gh
a./c
ap

www.regionalsustainability.org
Car Footprint by Purpose
-
0.01
0.02
0.03
0.04
0.05
0.06
0.07
0.08
0.09
0.10
Ho
lida
ys a
nd
Da
y tr
ipd
Ed
uct
aio
n a
nd
Esc
ort
Bu
sin
ess
Sp
ort
an
dE
nte
rta
inm
en
t
Pe
rso
na
lB
usi
ne
ss
Vis
itin
gF
rie
nd
s
Esc
ort
Co
mm
utin
g
Sh
op
pin
g
gh
a./c
ap

www.regionalsustainability.org
EF results for Selected Local Areas
- 2.00 4.00 6.00 8.00
Keningston
Barking
UK
gha./cap
Food and Drink
Energy
Travel
Housing
Consumables and waste
Services
Holiday Activities
Capital Investment
Government
www.regionalsustainability.org
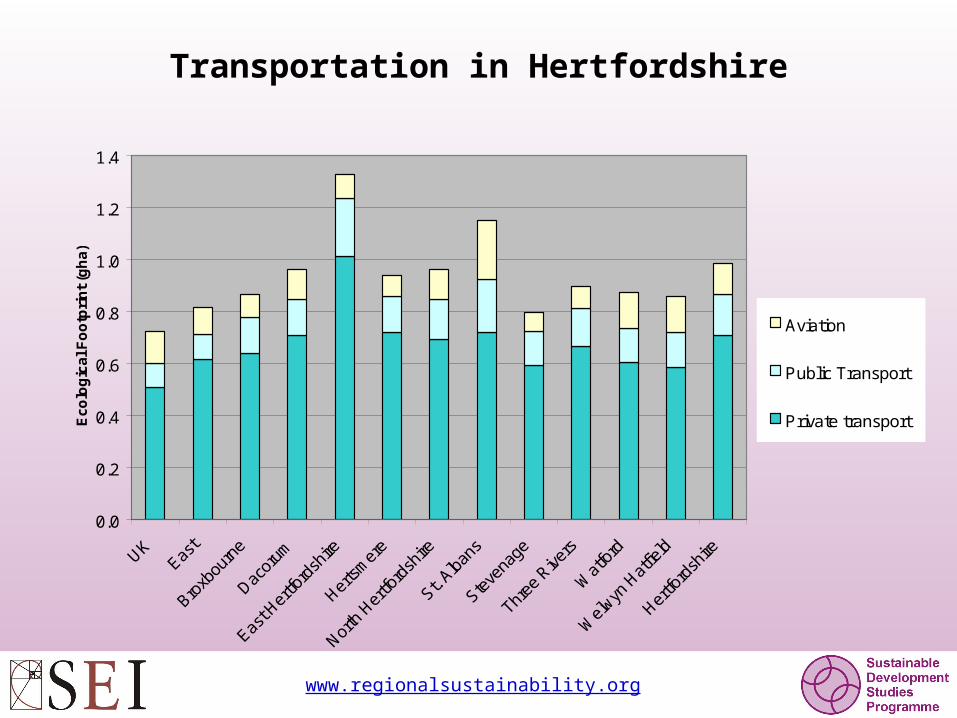
Transportation in Hertfordshire
0.0
0.2
0.4
0.6
0.8
1.0
1.2
1.4
Ec
olo
gic
al
Fo
otp
rin
t (g
ha
)
Aviation
Public Transport
Private transport

www.regionalsustainability.org
Group Description Group Description
1 Wealthy Achievers, Suburban Areas
10 Skilled workers, home owning areas
2 Affluent Greys, Rural Communities
11 New Home Owners, Mature Communities
3 Prosperous Pensioners, Retirement Areas
12 White collar workers, better off multi-ethnic areas
4 Affluent Executives, Family Areas
13 Older people, less prosperous areas
5 Well-off workers, family areas
14 Council Estate Residents, Better-off homes
6 Affluent Urbanites, Town and City Areas
15 Council estate residents, high unemployment
7 Prosperous Professionals, Metropolitan areas
16 Council estate residents, greatest hardship
8 Better-off executive, inner city areas
17 Multi-Ethnic, low income areas
9 Comfortable middle agers, mature home owning areas
-
0.1
0.1
0.2
0.2
0.3
0.3
0.4
0.4
0.5
1
2
3
4
5
6
7
8
9
10
11
12
13
14
15
16
17
Ave
rage
Max
imum
Min
imum
EF
/cap
.
Holidays
-
0.1
0.2
0.3
0.4
0.5
0.6
0.7
0.8
1
2
3
4
5
6
7
8
9
10
11
12
13
14
15
16
17
Ave
rage
Max
imum
Min
imum
EF
/cap
.
Transport

www.regionalsustainability.org
Sustainable Diets
Diet Composition
0
0.2
0.4
0.6
0.8
1
1.2
1.4
DEWI GARETH PATRICK
Diet Scenarios
Eco
log
ical
Fo
otp
rin
t (g
ha)
Beverages
Cereals
Confectionary
Bread
Fruit
Vegetables
Sugar & Preserves
Fats & Oils
Eggs
Fish
Meat
Cheese
Milk & Cream

www.regionalsustainability.org
Transport
In the Wales Ecological Footprint Project the following policies were analysed;
1. Increasing car use
2. ‘Intra-Wales Air Service’
3. Demand Side Management

www.regionalsustainability.org
Sustainable Living
-
0.50
1.00
1.50
2.00
2.50
3.00
3.50
4.00
4.50
Typical UK New 2002 EcoHom esExc.
BedZED Keen BedZED
EF
/ca
p.
Energy Transport Building a HouseW ater Food ConsumablesServices Holidays

www.regionalsustainability.org
York EF Projections and Target
York Target – Reduce the EF to 3.5 gha/capita by 2033

www.regionalsustainability.org
Other Applications
• Strategic Environmental Assessment
• Community Regeneration
• Sustainable Procurement
• Behavioural Change

www.regionalsustainability.org
Releasing Data
• In January
– EF of all Local Authority Areas
– Carbon dioxide emissions of consumption for LAAs
– Standardised report of all findings
– PowerPoint presentation of findings
• In March
– Same for Scotland and UK regions
– Complete mass balance of Scotland
– Eco-Budget Report

www.regionalsustainability.org
Resources and Energy Analysis Resources and Energy Analysis
ProgrammeProgramme
Developed under “Eco-Budget UK” ProjectReleased around March
Being tested in Scotland

www.regionalsustainability.org

www.regionalsustainability.org
www.regionalsustainability.org
www.sei.se/reap