Embed Size (px)
Citation preview
ScienceDirect
Available online at www.sciencedirect.com
Available online at www.sciencedirect.com
ScienceDirect
Structural Integrity Procedia 00 (2016) 000–000 www.elsevier.com/locate/procedia
2452-3216 © 2016 The Authors. Published by Elsevier B.V. Peer-review under responsibility of the Scientific Committee of PCF 2016.
XV Portuguese Conference on Fracture, PCF 2016, 10-12 February 2016, Paço de Arcos, Portugal
Thermo-mechanical modeling of a high pressure turbine blade of an airplane gas turbine engine
P. Brandãoa, V. Infanteb, A.M. Deusc* aDepartment of Mechanical Engineering, Instituto Superior Técnico, Universidade de Lisboa, Av. Rovisco Pais, 1, 1049-001 Lisboa,
Portugal bIDMEC, Department of Mechanical Engineering, Instituto Superior Técnico, Universidade de Lisboa, Av. Rovisco Pais, 1, 1049-001 Lisboa,
Portugal cCeFEMA, Department of Mechanical Engineering, Instituto Superior Técnico, Universidade de Lisboa, Av. Rovisco Pais, 1, 1049-001 Lisboa,
Portugal
Abstract
During their operation, modern aircraft engine components are subjected to increasingly demanding operating conditions, especially the high pressure turbine (HPT) blades. Such conditions cause these parts to undergo different types of time-dependent degradation, one of which is creep. A model using the finite element method (FEM) was developed, in order to be able to predict the creep behaviour of HPT blades. Flight data records (FDR) for a specific aircraft, provided by a commercial aviation company, were used to obtain thermal and mechanical data for three different flight cycles. In order to create the 3D model needed for the FEM analysis, a HPT blade scrap was scanned, and its chemical composition and material properties were obtained. The data that was gathered was fed into the FEM model and different simulations were run, first with a simplified 3D rectangular block shape, in order to better establish the model, and then with the real 3D mesh obtained from the blade scrap. The overall expected behaviour in terms of displacement was observed, in particular at the trailing edge of the blade. Therefore such a model can be useful in the goal of predicting turbine blade life, given a set of FDR data. © 2016 The Authors. Published by Elsevier B.V. Peer-review under responsibility of the Scientific Committee of PCF 2016.
Keywords: High Pressure Turbine Blade; Creep; Finite Element Method; 3D Model; Simulation.
* Corresponding author. Tel.: +351 218419991.
E-mail address: [email protected]
Procedia Structural Integrity 2 (2016) 2982–2988
Copyright © 2016 The Authors. Published by Elsevier B.V. This is an open access article under the CC BY-NC-ND license (http://creativecommons.org/licenses/by-nc-nd/4.0/).Peer review under responsibility of the Scientific Committee of ECF21.10.1016/j.prostr.2016.06.373
10.1016/j.prostr.2016.06.373
Available online at www.sciencedirect.com
ScienceDirect
Structural Integrity Procedia 00 (2016) 000–000 www.elsevier.com/locate/procedia
2452-3216 © 2016 The Authors. Published by Elsevier B.V. Peer-review under responsibility of the Scientific Committee of ECF21.
21st European Conference on Fracture, ECF21, 20-24 June 2016, Catania, Italy
Analysis of the impact of position in fatigue cracks on the fracture toughness of thick-walled pressure vessel material Nedeljko Vukojevića, Nenad Gubeljakb*, Muamer Terzica, Fuad Hadžikadunića
aFaculty of mechanical engeneering, Fakultetska 1, 72000 Zenica, Bosnia and Herzegovina bFaculty of mechanical engeneering, Smetanova ulica 17, 2000 Maribor, Slovenia
Abstract
The testing of fracture toughness thick-walled pressure vessel material showed a vast range of different results. Pressure vessels were made by hot plastic deformation treatment. Three sets of specimens were cut-out from the vessel, each having a same orientation of fatigue cracks in relation to the vessel axis. Fracture toughness tests were performed on the SENB specimens in accordance with ASTM 1820-11. The results showed a large range of different results, even within each sets of specimens. The results of fracture toughness in the initiation zone of stable crack growth were processed by means of Weibull statistical analysis. Based on these results of a direction distribution coefficient m was obtained and results reliability interval of fracture toughness was defined.
© 2016 The Authors. Published by Elsevier B.V. Peer-review under responsibility of the Scientific Committee of ECF21.
Keywords: Fracture toughness; Pressure vessel; Weibull distribution; Metalography.
1. Introduction
Determination of fracture toughness of large structures, especially structures were made by hot plastic deformation treatment (forging) can result in a large vast range of the test results. Research presented in this paper are focused on getting a more complete picture of the fracture mechanics parameters of material thick-walled pressure vessels. Taking samples for testing of such structures means very often destruction of structures or parts of structures that is not always possible. Samples are usually taken from the available
* Corresponding author. Tel.: +386-(0)31-659-279; fax: +386-(0)2-220-7990.
E-mail address: [email protected]
Copyright © 2016 The Authors. Published by Elsevier B.V. This is an open access article under the CC BY-NC-ND license (http://creativecommons.org/licenses/by-nc-nd/4.0/).Peer-review under responsibility of the Scientific Committee of ECF21.
Nedeljko Vukojević et al. / Procedia Structural Integrity 2 (2016) 2982–2988 29832 Author name / Structural Integrity Procedia 00 (2016) 000–000
structural parts or parts that will lead to the destruction of the subject matter. If it is already possible to take samples then the question is where to take, and whether the results of the tests on these samples relevant to the assessment of complete pressure vessels.
Nomenclature
do outer diameter of vessel, [mm] di inner diameter of vessel, [mm] t thickness of vessel, [mm] i number of the test-sample (between 1 and N) [-] N the total number of samples [-] YS yield strength, [MPa] KIc stress intensity factor [MPa·m1/2] ac critical crack length [mm] E Young's modulus of elasticity [GPa] JIc critical J-integral [N/mm] Poisson coefficient [-] V specimen volume [mm3] Ku min. value of stress intensity factor where the probability of fracture zero [MPa·m1/2] Ko normalizing factor that satisfies the probability of the existence of Ps=0,3679; (ln·ln(1/0,3679)=0) m Weibull module [-] B specimen thickness [mm] W effective width of specimen [mm] L specimen length [mm]
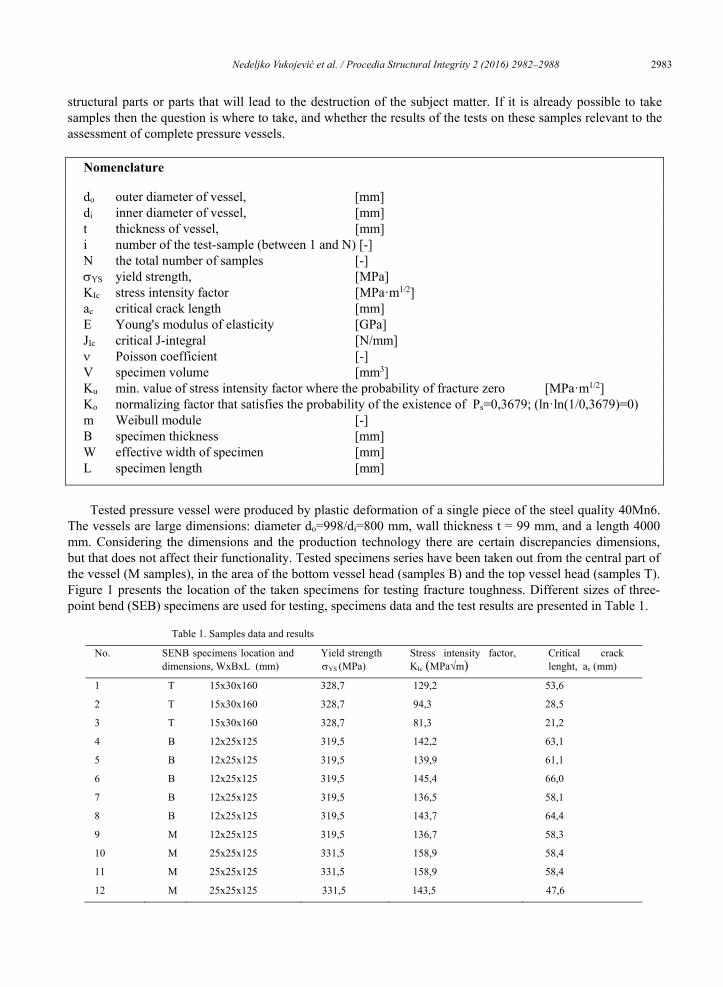
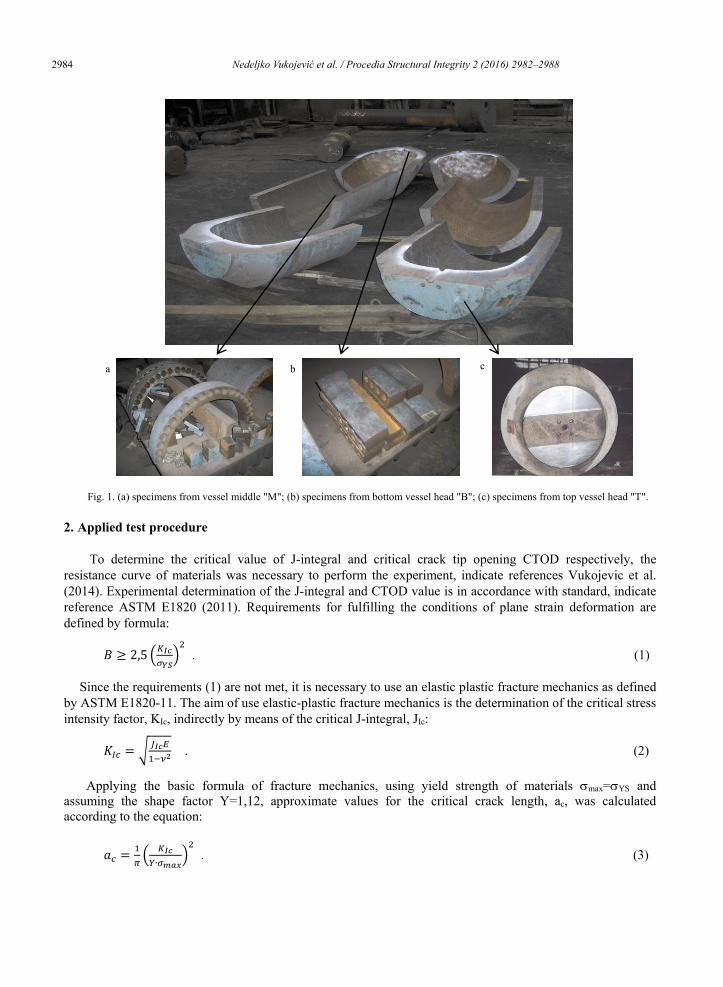
Tested pressure vessel were produced by plastic deformation of a single piece of the steel quality 40Mn6.
The vessels are large dimensions: diameter do=998/di=800 mm, wall thickness t = 99 mm, and a length 4000 mm. Considering the dimensions and the production technology there are certain discrepancies dimensions, but that does not affect their functionality. Tested specimens series have been taken out from the central part of the vessel (M samples), in the area of the bottom vessel head (samples B) and the top vessel head (samples T). Figure 1 presents the location of the taken specimens for testing fracture toughness. Different sizes of three-point bend (SEB) specimens are used for testing, specimens data and the test results are presented in Table 1.
Table 1. Samples data and results
No. SENB specimens location and dimensions, WxBxL (mm)
Yield strength YS (MPa)
Stress intensity factor, KIc (MPa√m)
Critical crack lenght, ac (mm)
1 T 15x30x160 328,7 129,2 53,6
2 T 15x30x160 328,7 94,3 28,5
3 T 15x30x160 328,7 81,3 21,2
4 B 12x25x125 319,5 142,2 63,1
5 B 12x25x125 319,5 139,9 61,1
6 B 12x25x125 319,5 145,4 66,0
7 B 12x25x125 319,5 136,5 58,1
8 B 12x25x125 319,5 143,7 64,4
9 M 12x25x125 319,5 136,7 58,3
10 M 25x25x125 331,5 158,9 58,4
11 M 25x25x125 331,5 158,9 58,4
12 M 25x25x125 331,5 143,5 47,6
2984 Nedeljko Vukojević et al. / Procedia Structural Integrity 2 (2016) 2982–2988 Author name / Structural Integrity Procedia 00 (2016) 000–000 3
Fig. 1. (a) specimens from vessel middle "M"; (b) specimens from bottom vessel head "B"; (c) specimens from top vessel head "T".
2. Applied test procedure
To determine the critical value of J-integral and critical crack tip opening CTOD respectively, the resistance curve of materials was necessary to perform the experiment, indicate references Vukojevic et al. (2014). Experimental determination of the J-integral and CTOD value is in accordance with standard, indicate reference ASTM E1820 (2011). Requirements for fulfilling the conditions of plane strain deformation are defined by formula:
. (1)
Since the requirements (1) are not met, it is necessary to use an elastic plastic fracture mechanics as defined by ASTM E1820-11. The aim of use elastic-plastic fracture mechanics is the determination of the critical stress intensity factor, KIc, indirectly by means of the critical J-integral, JIc:
. (2)
Applying the basic formula of fracture mechanics, using yield strength of materials max=YS and assuming the shape factor Y=1,12, approximate values for the critical crack length, ac, was calculated according to the equation:
. (3)
a c b
Nedeljko Vukojević et al. / Procedia Structural Integrity 2 (2016) 2982–2988 29854 Author name / Structural Integrity Procedia 00 (2016) 000–000
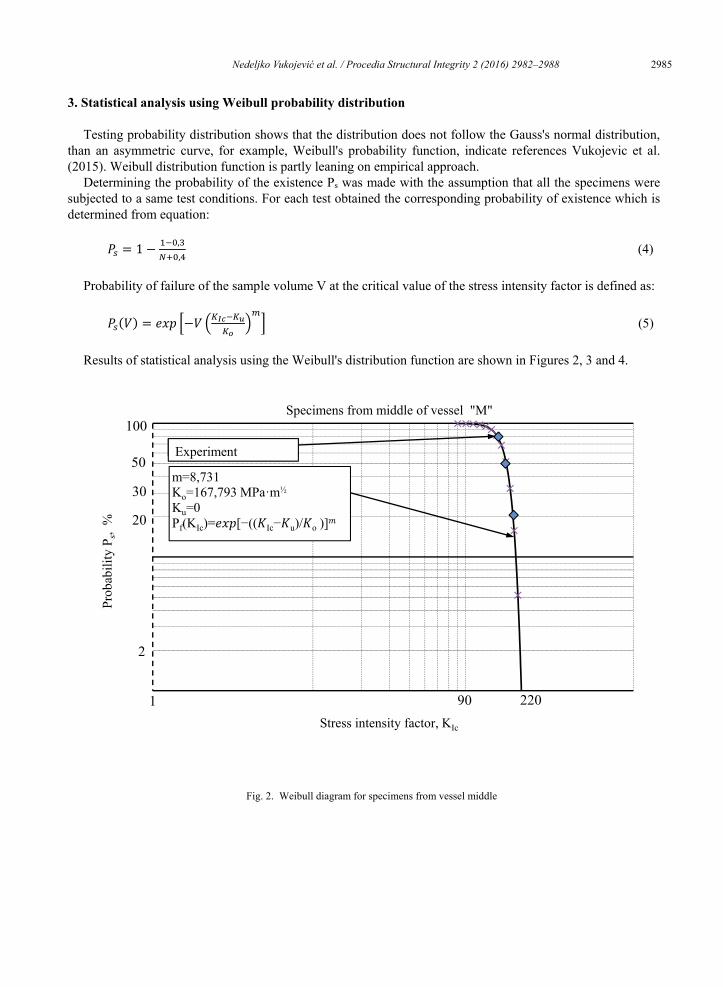
3. Statistical analysis using Weibull probability distribution
Testing probability distribution shows that the distribution does not follow the Gauss's normal distribution, than an asymmetric curve, for example, Weibull's probability function, indicate references Vukojevic et al. (2015). Weibull distribution function is partly leaning on empirical approach.
Determining the probability of the existence Ps was made with the assumption that all the specimens were subjected to a same test conditions. For each test obtained the corresponding probability of existence which is determined from equation:
(4)
Probability of failure of the sample volume V at the critical value of the stress intensity factor is defined as:
(5)
Results of statistical analysis using the Weibull's distribution function are shown in Figures 2, 3 and 4.
Fig. 2. Weibull diagram for specimens from vessel middle
Prob
abili
ty P
s, %
Stress intensity factor, KIc
90
20
30
2
220
Specimens from middle of vessel "M"
Experiment50
100
1
m=8,731Ko=167,793 MPa·m½
Ku=0Pf(KIc)= [−(( Ic− u)/ o )]
Experiment
2986 Nedeljko Vukojević et al. / Procedia Structural Integrity 2 (2016) 2982–2988 Author name / Structural Integrity Procedia 00 (2016) 000–000 5
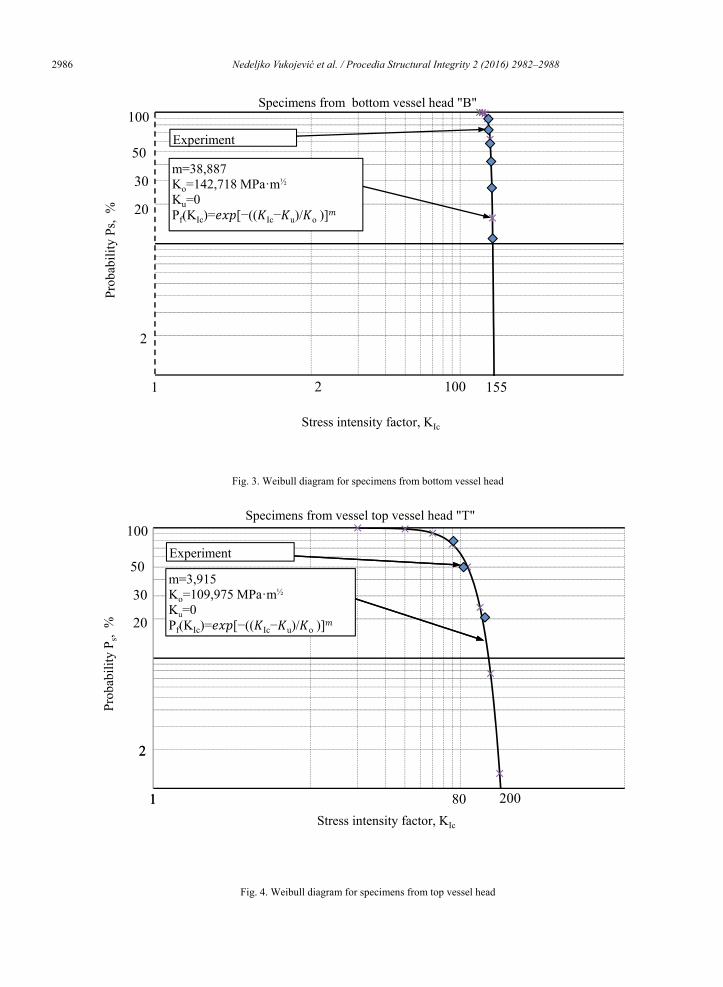
Fig. 3. Weibull diagram for specimens from bottom vessel head
Fig. 4. Weibull diagram for specimens from top vessel head
Prob
abili
ty P
s, %
Stress intensity factor, KIc
100
20
30
2
2 155
m=38,887Ko=142,718 MPa·m½
Ku=0Pf(KIc)= [−(( Ic− u)/ o )]
Experiment50
100
1
Specimens from bottom vessel head "B"Pr
obab
ility
Ps,
%
Stress intensity factor, KIc
20
30
2
200
50
100
1
Specimens from vessel top vessel head "T"
80
2
m=3,915Ko=109,975 MPa·m½
Ku=0Pf(KIc)= [−(( Ic− u)/ o )]
Experiment
1

Nedeljko Vukojević et al. / Procedia Structural Integrity 2 (2016) 2982–2988 29876 Author name / Structural Integrity Procedia 00 (2016) 000–000
Statistical analysis shows the reliability of the obtained results of fracture toughness parameters. The higher value of the Weibull's coefficient m means higher reliability and less wastage of value, while the value Ko represents mean value of the distribution. Reliability curve obtained by Weibull's distribution shows the interval 99% probability of the measured fracture toughness appear in the distribution interval. Thus, from the curve presented in Fig.2, Fig. 3 and Fig. 4, its obvious the widest interval for the measured values of toughness have specimens taken out from top vessel head "T" (KIc = 20180 MPa√m) in Fig. 4. Reliability interval is narrowest for the tested specimens taken out from the bottom of the vessel head "B" (KIc = 120155MPa√m), Figure 3. For the middle part of the vessel, specimens marked with "M", the reliability interval of KIc is within 90200 MPa√m, as shown in Figure 2.
Based on statistical analysis could be considered to be the most critical part is top vessel head ("T" specimen).
4. Metallography of tested specimens
Metallographic tests were performed on three samples to determine the microstructure in the plane of the fracture. Charpy specimens taken from three characteristic parts of the vessel were used. The tests were performed according to standard, indicate reference ASTM E407(2007) on the optical microscope OLYMPUS type PMG3 with increment x100. Fig. 5 shows the microstructure of the analyzed samples.
Fig. 5. (a) specimens from vessel middle "M"; (b) specimens from bottom vessel head "B"; (c) specimens from top vessel head "T".
On all three analyzed samples was observed ferrite-pearlite microstructure. A sample from plate were
located on the top vessel head "T" is visible presence of Widmansttaten ferrite, and individual presence of something larger ferrite grains compared to samples from the middle of the vessel "M" and samples taken out from the bottom vessel head "B.
The presence of coarse grain structure and the structure of sharp edges, typical Widmansttaten's structure, are caused lower values of fracture toughness samples of the "T" in comparison with the samples from the bottom vessel head "B" and samples of "M" located in the middle of the cylindrical part of the vessel.
Part of the plate taken from top vessel head (samples "T") was, in the production process of hot plastic deformation, exposed the least deformation, which was caused coarse structure. Other parts were exposed longitudinal and radial deformation and multiple plastic transformation created a fine grained ferrite-pearlite structure and longitudinally orientated grain.
This fine grained structure is reflected in the higher values of fracture toughness as shown results of tested samples taken from middle of the vessel and from bottom vessel head.
5. Conclusion
The analysis of the results according to the location of specimens sampling, it is clear that the results of calculated critical cracks lengths are worst for specimens taken out form top vessel head (plate of the top vessel head marked with "T"). This part of the structure was only possible to take the test samples, without destruction of structure. As shown in Table 1, row 3 critical crack length is 21,2 mm (min. value) it's significantly lower than the results of the minimal critical crack length obtained from samples taken from the
a b c

2988 Nedeljko Vukojević et al. / Procedia Structural Integrity 2 (2016) 2982–2988 Author name / Structural Integrity Procedia 00 (2016) 000–000 7
middle of the vessel "M" (ac=58,1 mm) and from the bottom vessel head "B" (ac=47.6mm). This research was clearly demonstrated that large structures, where are not possible to take samples without
totally destruction or damage, determining the critical values of fracture toughness, and therefore the critical crack size can give unreliable data for the final assessment of safety. In this case, conservative result was obtained, which influenced the increased safety, but on the other side it's also possible to get a result that could lead to the adoption of wrong conclusion.
References
Vukojević N., Hadžikadunić F., Gubeljak N., 2014. Diagnostics and Analysis Of The Influence Of Cracks On The Integrity Of The Thick-Walled Pressure Vessels", 6th International Scientific and Expert Conference TEAM 2014, Technique, Education, Agriculture & Management, Kecskemét, Hungary, 434-439.
Vukojević, N., Hadžikadunić, F., Talić-Čikmiš, A., Imamović, M., Terzić, M., 2015. Statistical analysis of fracture mechanics parameters of large structure, 19th International Research/Expert Conference Trends in the Development of Machinery and Associated Technology - TMT 2015. Barcelona, Spain, 297-300.
ASTM E 1820, 2011. Standard Test Method for Measurement of Fracture Toughness, USA. ASTM E407, 2007. Standard Practice for Microetching Metals and Alloy, USA.