Embed Size (px)
Citation preview
www.ubos.org1
A PRESENTATION ON THE STATUS OF ECONOMIC STATISTICS (MANUFACTURING) IN UGANDA
By
John Bonaventure Musoke
Senior Statistician

www.ubos.org2
“A CANDLE LOOSES NOTHING BY LIGHTING ANOTHER CANDLE”
Prof. Ssenteza Kajubi
www.ubos.org3
Content
The Business Register 2001/2002 and 2006/7
Uganda Business Inquiry 2000/2001 Index of Industrial Production (IoP – M) Producer Price Index (PPI) Challenges
www.ubos.org4
The Business Register 2001/2002
Defn: A business register is a record of all active business establishments. Essentially it contains structural information about each business.
Objectives
- Create a comprehensive list of businesses- Provide a frame for future business surveys
www.ubos.org5
The Business Register …..
Prior to the start of the Registration exercise an attempt was made to compile the register from administrative sources;
- The Uganda Revenue Authority- Uganda manufacturers Association (UMA)- Uganda Investment Authority etc.
www.ubos.org6
The Business Register …..
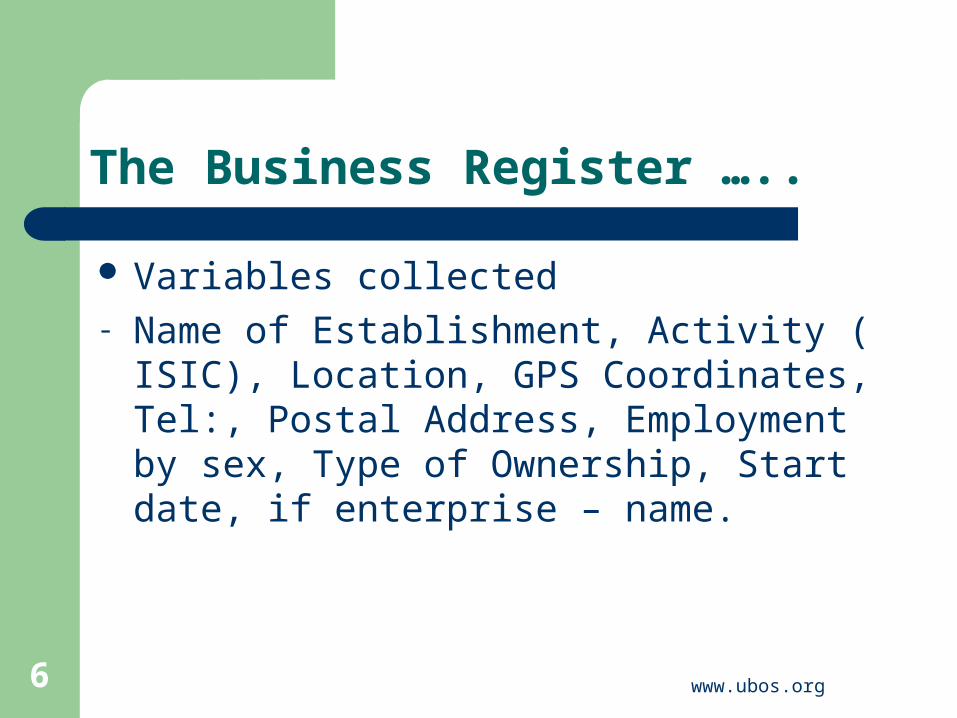
Variables collected- Name of Establishment, Activity ( ISIC),
Location, GPS Coordinates, Tel:, Postal Address, Employment by sex, Type of Ownership, Start date, if enterprise – name.
www.ubos.org7
The Business Register …..
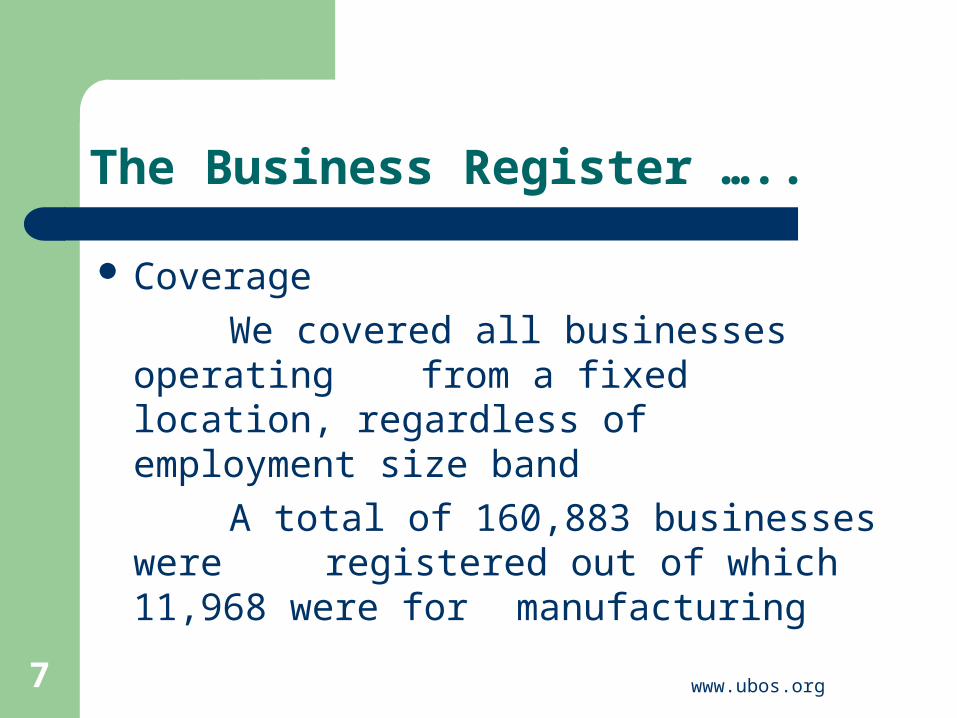
Coverage
We covered all businesses operating from a fixed location, regardless of employment size band
A total of 160,883 businesses were registered out of which 11,968 were for manufacturing

www.ubos.org8
THE UGANDA BUSINESS INQUIRY (UBI) 2000/2001
Defn: This is an economic survey covering all sectors in the economy for the financial year 2000/2001
www.ubos.org9
UBI Cont………
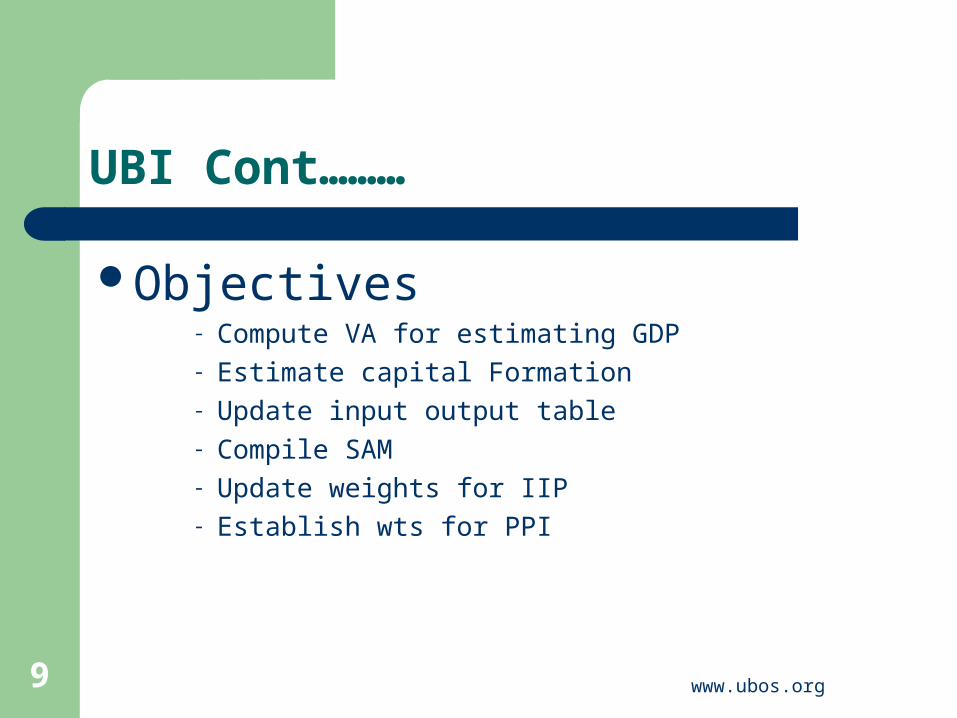
Objectives- Compute VA for estimating GDP- Estimate capital Formation- Update input output table- Compile SAM- Update weights for IIP- Establish wts for PPI
www.ubos.org10
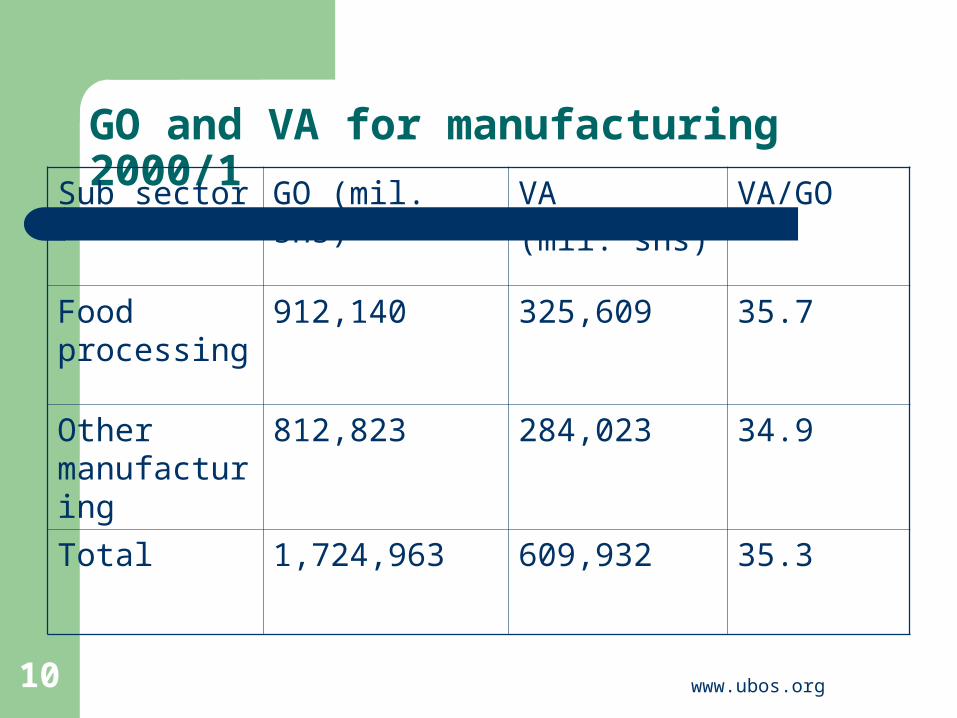
GO and VA for manufacturing 2000/1Sub sector GO (mil. shs) VA
(mil. shs)
VA/GO
Food processing
912,140 325,609 35.7
Other manufacturing
812,823 284,023 34.9
Total 1,724,963 609,932 35.3
www.ubos.org11
Annual Business Inquiry 2006/7
In order to produce high frequency data that can enable us update these important indicators we are now carrying out an ABI with ref. yr 2006/7. We finished data collection and have just finished data entry. A draft report is expected around July 2009.
www.ubos.org12
Index of Production (Manufacturing)
By John B. Musoke
www.ubos.org13
Historical Background of IIP
Work started in 1990 after the Census of Business Establishments (COBE)
The IIP was based mostly on measuring quantities of production for products available in the base period.
www.ubos.org14
Errors within the IIP System
Challenges encountered in using Quantity to measure volume change….
- Establishments that close- New Establishments and products- Non Homogeneous products- Conversion factor related problems or
problems related to human error
www.ubos.org15
Index of Production (IoP)
Index rebranded IoP to expand and Cover- Manufacturing- Services- Utilities- Mining
www.ubos.org16
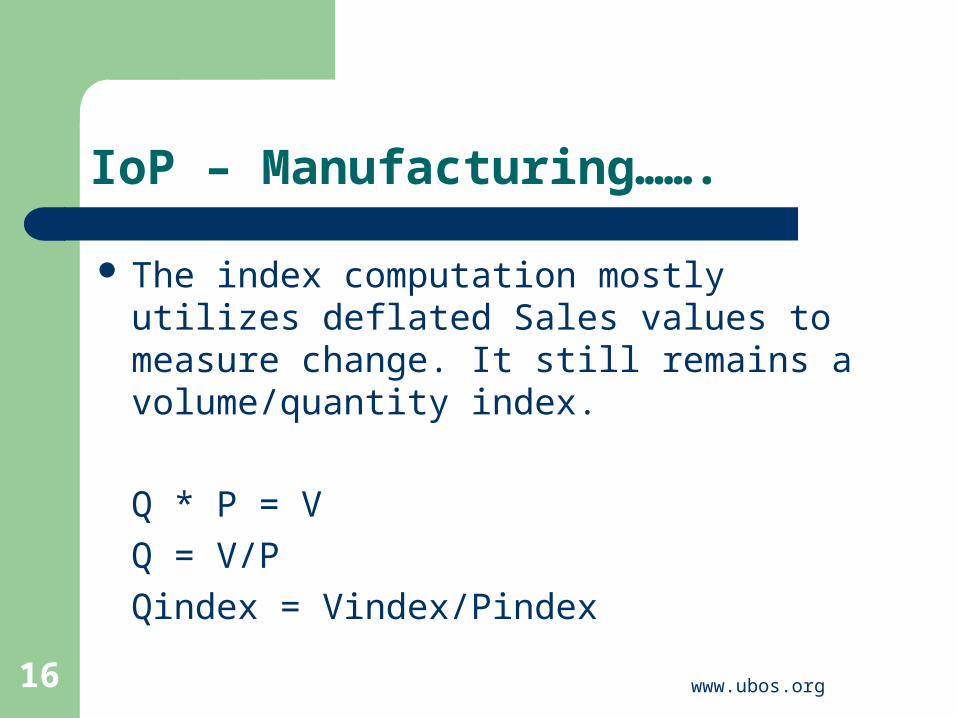
IoP – Manufacturing…….
The index computation mostly utilizes deflated Sales values to measure change. It still remains a volume/quantity index.
Q * P = V
Q = V/P
Qindex = Vindex/Pindex
www.ubos.org17
IoP – Manufacturing…….
Just as PPI, data for IoP is collected from formal manufacturing across the country majority of it coming from the industrial belt of Uganda C:\Documents and Settings\john.musoke.UBOS.000\My Documents\Maps\ugandan map1.doc
www.ubos.org18
IoP – Manufacturing…….
Monthly data is collected on a quarterly basis but entered by month in an Excel data file.(IoP DATA SALES)
There are three sources of data:-- Survey data- VAT data- Quantities data from mandated Authorities
www.ubos.org19
IoP – Manufacturing…….
The index is derived in two steps: First, for each “basic heading” (product or
activity group) a value index is compiled by adding total turnover for each business (no weighting – full coverage assumed)
The value index is then divided by a corresponding price index (PPI)
This operation delivers volume indices at “basic heading” level
www.ubos.org20
IoP – Manufacturing…….
Second, these basic level indices are combined using the Laspeyres formula into the major Divisions/Groups and all Manufacturing.
The weights used to aggregate are based on gross value added taken from the UBI

www.ubos.org21
IoP – Manufacturing…….
The index is based on 2002 Until June 2004, the basic heading indices
were based on the old system (quantities) From July 2004 onwards, deflated turnover
has been adopted in most cases The new indices are “linked” to the old before
being aggregated.
www.ubos.org22
IoP – Manufacturing…….
Quality control (Sales are much more variable than prices and more subject to error)
We calculate the response rates based on known (or assumed) average values of turnover in the previous 12 months and impute for non-respondents.
We check the month-to-month change in sales values and query large changes
www.ubos.org23
IoP – Manufacturing…….
Challenges- Correcting outliers with VAT data.- Reliability of monthly series- Using survey data – small economy- Using survey data – few estabs.

www.ubos.org24
UGANDAS EXPERIENCEUGANDAS EXPERIENCEUGANDAS EXPERIENCEUGANDAS EXPERIENCE
WITH THE PRODUCER PRICE INDEX (LUSAKA 4th – 7th May 2009)
www.ubos.org25
What is a Producer Price Index (PPI)?
PPI is a PRICE index (number) used to measure the rate of change in the prices of goods and services bought and sold by producers.
PPIs can differently be calculated to suit specific goals thus we have a PPI for Manufacturing
PPIs for Mining and Quarrying, Agriculture, Hotels and Utilities are in the initial stages of development.
www.ubos.org26
Output PPI.. UBOS started compiling PPIs (Manufacturing) in
2004.What is generated is an output PPI which measures the rate of change in the prices of products sold as they leave the producer.
The PPI generated is categorized btn.
- the Local Market (PPI for Local Market)
- for goods and services produced for export, (PPI for Exports)- And PPI combined which combines the two above
www.ubos.org27
Which PPI are we measuring?
PPI-M measures both goods produced for the local market and those produced for export.
This PPI covers the ‘formal’ Manufacturing sector It measures the change in the effective unit selling
prices received by manufacturers for products sold for both the home market and for exports.
www.ubos.org28
PPI - M cont…
Products are priced at Basic Price
Basic Price is the price per unit of goods/ services receivable by the producer. Because the producer does not receive taxes on products but does receive subsidies. Taxes on products (excise, non-refundable VAT, taxes on exports, etc) are excluded, while subsidies on products are included.
www.ubos.org29
Methodology & Sample Size determination
WHY PPI was generated? Out of the UBI which was conducted in 2000/01, the
Bureau then had comprehensive data on Value Added (VA) and Gross Output (GO) for establishments. The data on GO was then used for generating weights for PPI-M.
www.ubos.org30
Methodology Ctd The PPI Manufacturing is based on a sample of establishments with 10 or more employees as reported during the UBI.
A wide range of representative products were selected in July 2004
PPI-M covers all ISIC Manufacturing Divisions from 15 to 37 (Table of ISIC)
www.ubos.org31
Methodology Ctd
A sample of 200 establishments as of now are covered in the PPI with close to 600 products.
The sampling method used was Probability Proportional to size combined with Concentration of businesses and personal judgment based on previous data/information.
There are 36 main headings based on 4-digit ISIC.
www.ubos.org32
Challenges before
- Establishments that close- Inclusion of new establishments and
products- Non Homogeneous products- Conversion factor related problems or
problems related to human error
www.ubos.org33
Methodology Contd…
These are collapsed into 21 groups. Closely related activity codes producing almost homogenous commodities are grouped together to form the 21 as shown in the table.
Which are later put into 8 major headings which are re-grouped to suit the requirements in National Accounts.
www.ubos.org34
Challenges after
- Correcting outliers within VAT data files.- Variability of monthly sales/ turnover series- Using survey data – respondent fatigue- Using survey data – few establishments- Need for specialized respondents- Harmonizing data collection within UBOS
and without
www.ubos.org35
Challenges cont…
Getting transaction prices (actual) other than price-list prices.

www.ubos.org36

www.ubos.org37
PLOT 9 COLVILLE STREET
P.O BOX 7186KAMPALA
TEL.041-706000
FAX041-237553
Websitewww.ubos.org
WELCOME TO UGANDA WELCOME TO STATISTICS HOUSE