Embed Size (px)
Citation preview

www.wv.doe.gov
Annual Site Environmental Report (ASER)Calendar Year 2011
West Valley Demonstration Project
Presented by:
John Rendall, Regulatory Strategy Manager
November 14, 2012
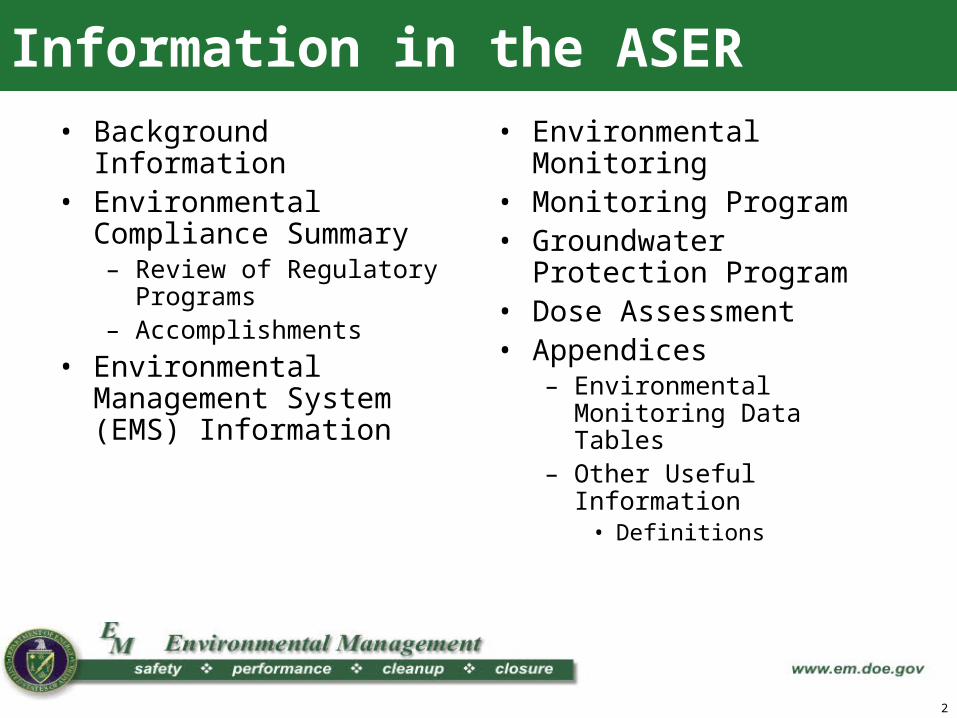
• Background Information• Environmental Compliance
Summary– Review of Regulatory
Programs– Accomplishments
• Environmental Management System (EMS) Information
• Environmental Monitoring • Monitoring Program• Groundwater Protection
Program• Dose Assessment• Appendices
– Environmental Monitoring Data Tables
– Other Useful Information• Definitions
Information in the ASER
2
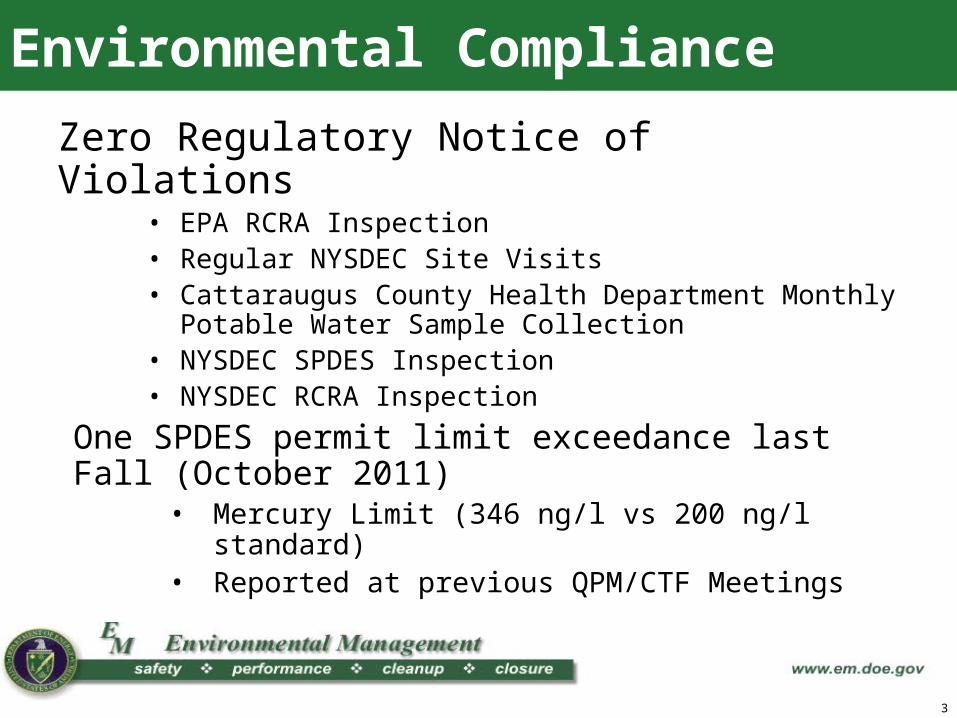
Environmental Compliance
Zero Regulatory Notice of Violations• EPA RCRA Inspection• Regular NYSDEC Site Visits• Cattaraugus County Health Department Monthly
Potable Water Sample Collection • NYSDEC SPDES Inspection• NYSDEC RCRA Inspection
One SPDES permit limit exceedance last Fall (October 2011)
• Mercury Limit (346 ng/l vs 200 ng/l standard)• Reported at previous QPM/CTF Meetings
3
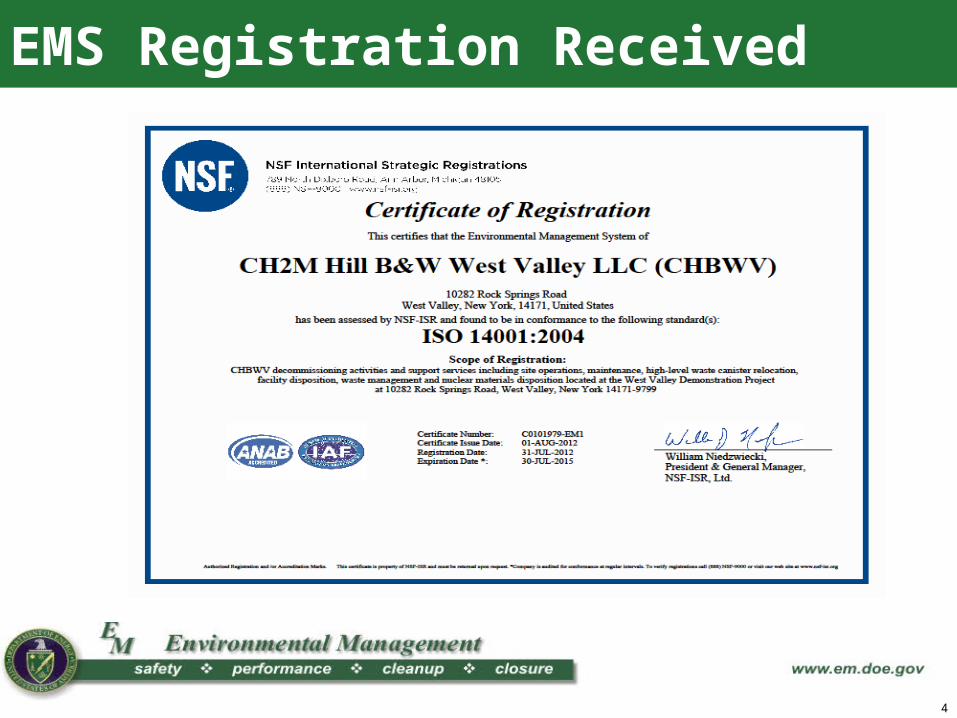
EMS Registration Received
4
• Comply with environmental requirements• Minimize generation of wastes without path for disposition• Protect and conserve WVDP natural resources• Establish environmental targets and objectives
– Regulatory Closures (RCRA, SPDES, NESHAPs)– Conservation (e.g., “green” purchases, energy usage reductions)
• Consider Stakeholder Input (e.g., CTF, QPM participation)• Monitor potential environmental impacts• Commitment to continuous EMS improvement • Communicate Environmental Policy• EMS performance verified through independent third party
audits
EMS – Implementation of Environmental Policy
5
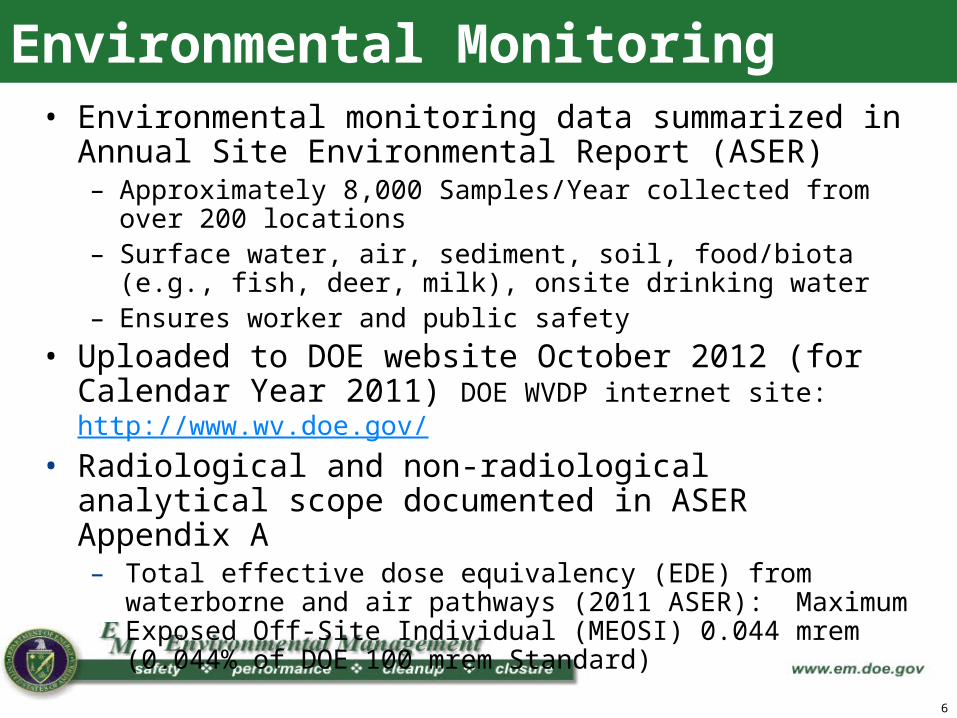
Environmental Monitoring• Environmental monitoring data summarized in Annual Site
Environmental Report (ASER) – Approximately 8,000 Samples/Year collected from over 200
locations– Surface water, air, sediment, soil, food/biota (e.g., fish, deer, milk),
onsite drinking water– Ensures worker and public safety
• Uploaded to DOE website October 2012 (for Calendar Year 2011) DOE WVDP internet site: http://www.wv.doe.gov/
• Radiological and non-radiological analytical scope documented in ASER Appendix A – Total effective dose equivalency (EDE) from waterborne and air
pathways (2011 ASER): Maximum Exposed Off-Site Individual (MEOSI) 0.044 mrem (0.044% of DOE 100 mrem Standard)
6
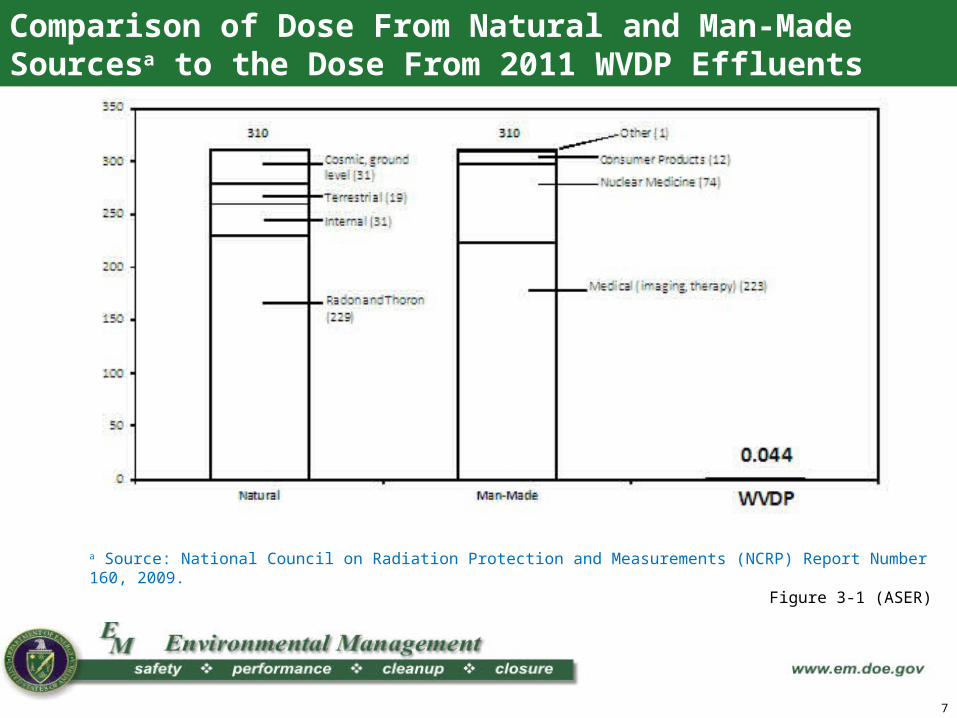
Comparison of Dose From Natural and Man-Made Sourcesa to the Dose From 2011 WVDP Effluents
a Source: National Council on Radiation Protection and Measurements (NCRP) Report Number 160, 2009.
Figure 3-1 (ASER)
7
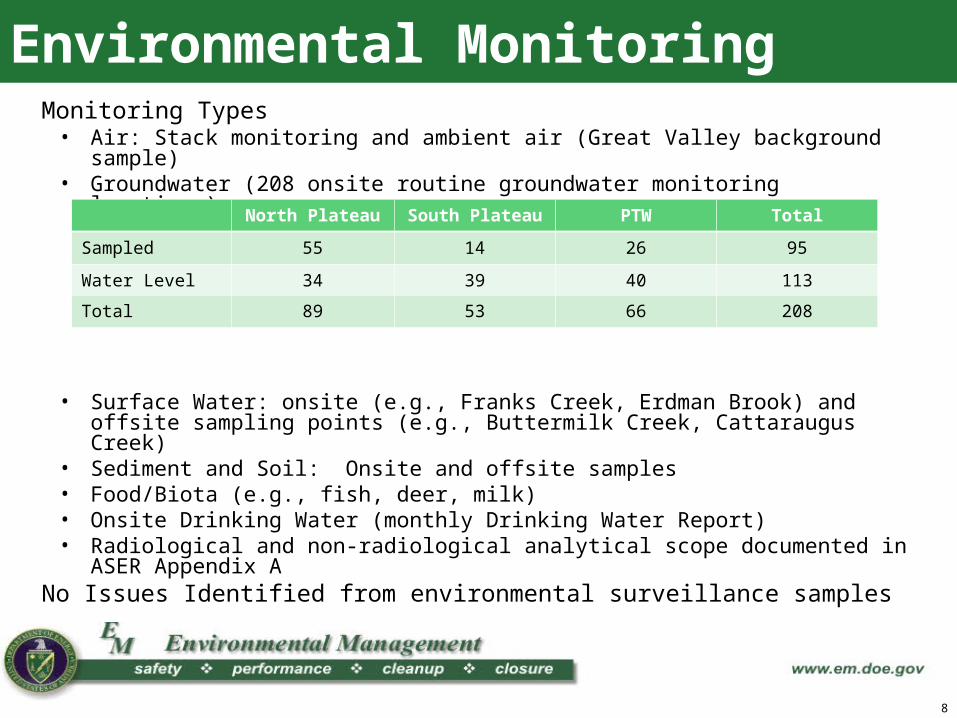
Environmental MonitoringMonitoring Types
• Air: Stack monitoring and ambient air (Great Valley background sample)• Groundwater (208 onsite routine groundwater monitoring locations)
• Surface Water: onsite (e.g., Franks Creek, Erdman Brook) and offsite sampling points (e.g., Buttermilk Creek, Cattaraugus Creek)
• Sediment and Soil: Onsite and offsite samples • Food/Biota (e.g., fish, deer, milk)• Onsite Drinking Water (monthly Drinking Water Report)• Radiological and non-radiological analytical scope documented in ASER
Appendix A No Issues Identified from environmental surveillance samples
North Plateau South Plateau PTW Total
Sampled 55 14 26 95
Water Level 34 39 40 113
Total 89 53 66 208
8
Environmental MonitoringLiquid Effluent• Site Sewage Treatment Plant (STP)
- Non-radiological discharge• Primarily discharges Mon - Thu
• Low-Level Waste Treatment Facility (from Lagoon 3)- Batch discharges (~ six discharges/year)- Monthly reporting to NYSDEC
Stormwater Discharges• 19 Stormwater discharge outfallsSite Drainage Points•Natural drainage from northeast swamp•Upgradient Permeable Treatment Wall installed in 2010Plant Ventilation Stacks• 7 Stacks and up to 15 portable ventilation units• Extremely low emissions (less than 0.02% of standard)• 0.0017 mrem/yr vs 10 mrem/yr standard (for Maximum
Exposed Offsite Individual, MEOSI)
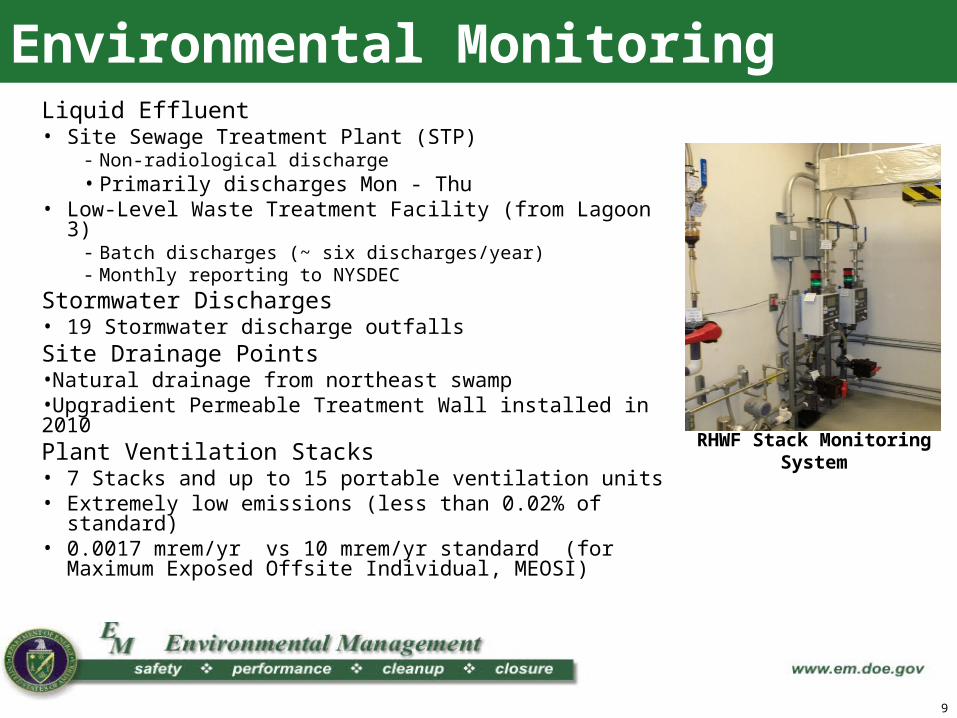
RHWF Stack Monitoring System
9
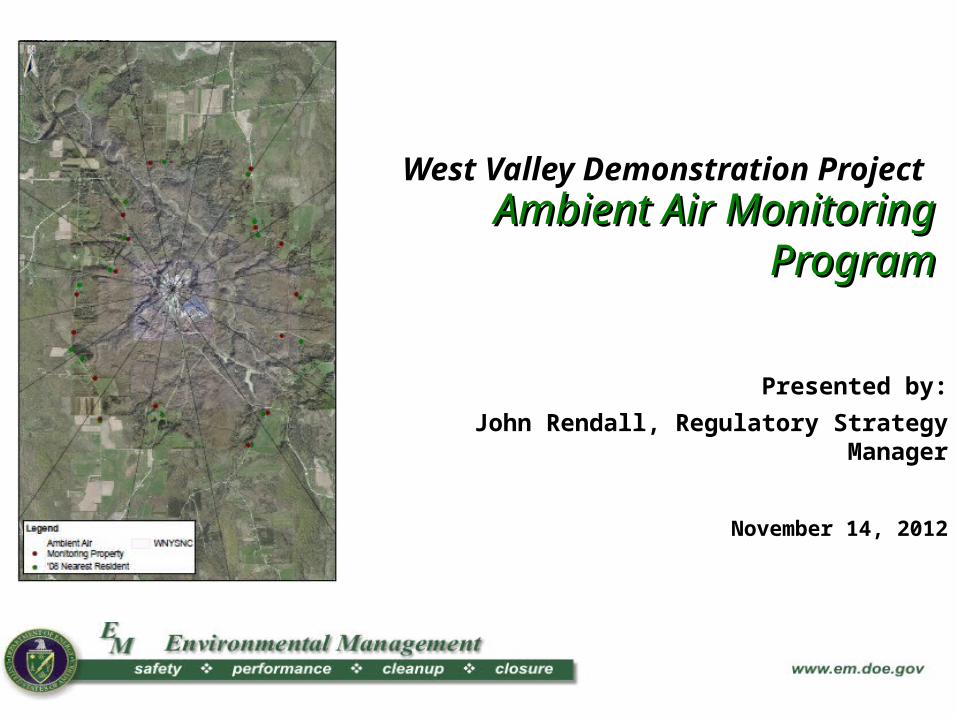
Ambient Air Monitoring ProgramAmbient Air Monitoring Program
West Valley Demonstration Project
Presented by:
John Rendall, Regulatory Strategy Manager
November 14, 2012
Ambient air network operating• Monitoring program initiated October 1, 2012
Background and 16 stations on NYSERDA and private properties
• Small units (2’x3’x7’)
• Located approximately 1 mile or less from site
Objective of Ambient Monitoring Program• Monitor diffuse source emissions
• Collect ambient air data in proximity to nearest receptors
• Augment existing monitor and model approach
Ambient Air Monitoring Update
11
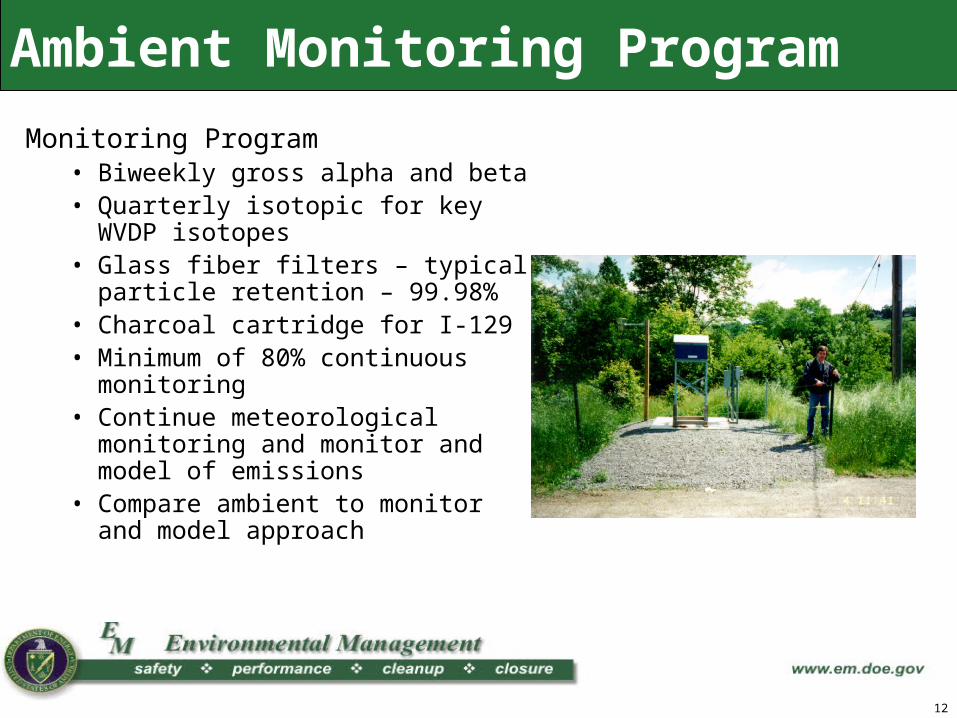
Monitoring Program• Biweekly gross alpha and beta• Quarterly isotopic for key WVDP
isotopes • Glass fiber filters – typical particle
retention – 99.98%• Charcoal cartridge for I-129• Minimum of 80% continuous
monitoring • Continue meteorological monitoring
and monitor and model of emissions
• Compare ambient to monitor and model approach
Ambient Monitoring Program
12
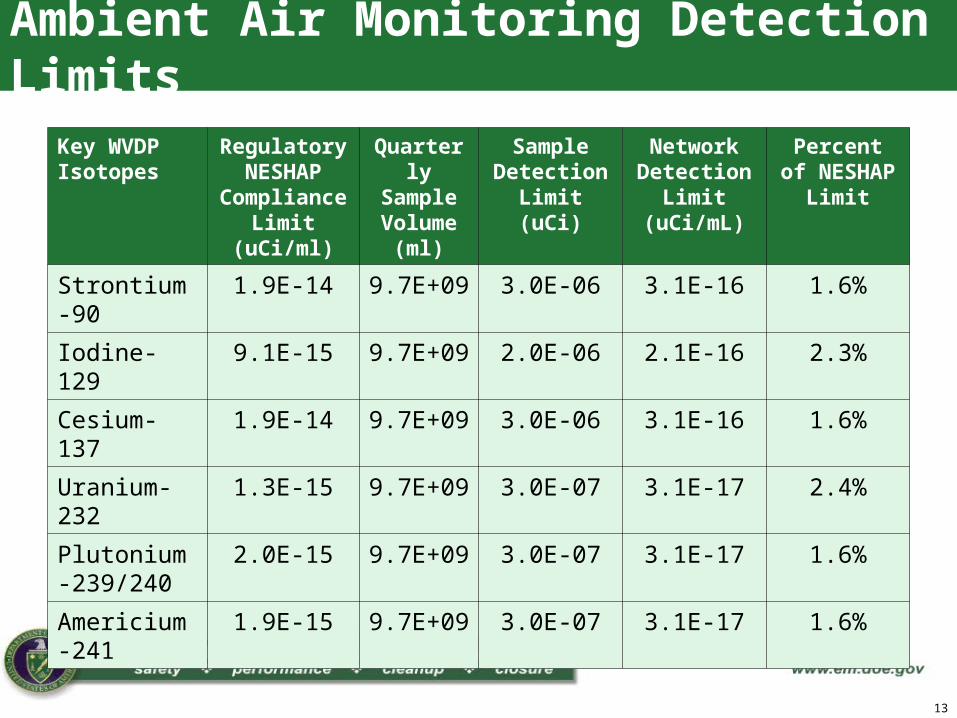
Key WVDP Isotopes
Regulatory NESHAP
Compliance Limit
(uCi/ml)
QuarterlySampleVolume
(ml)
Sample Detection Limit (uCi)
Network Detection
Limit (uCi/mL)
Percent of NESHAP
Limit
Strontium-90 1.9E-14 9.7E+09 3.0E-06 3.1E-16 1.6%
Iodine-129 9.1E-15 9.7E+09 2.0E-06 2.1E-16 2.3%
Cesium-137 1.9E-14 9.7E+09 3.0E-06 3.1E-16 1.6%
Uranium-232 1.3E-15 9.7E+09 3.0E-07 3.1E-17 2.4%
Plutonium-239/240
2.0E-15 9.7E+09 3.0E-07 3.1E-17 1.6%
Americium-241
1.9E-15 9.7E+09 3.0E-07 3.1E-17 1.6%
Ambient Air Monitoring Detection Limits
13
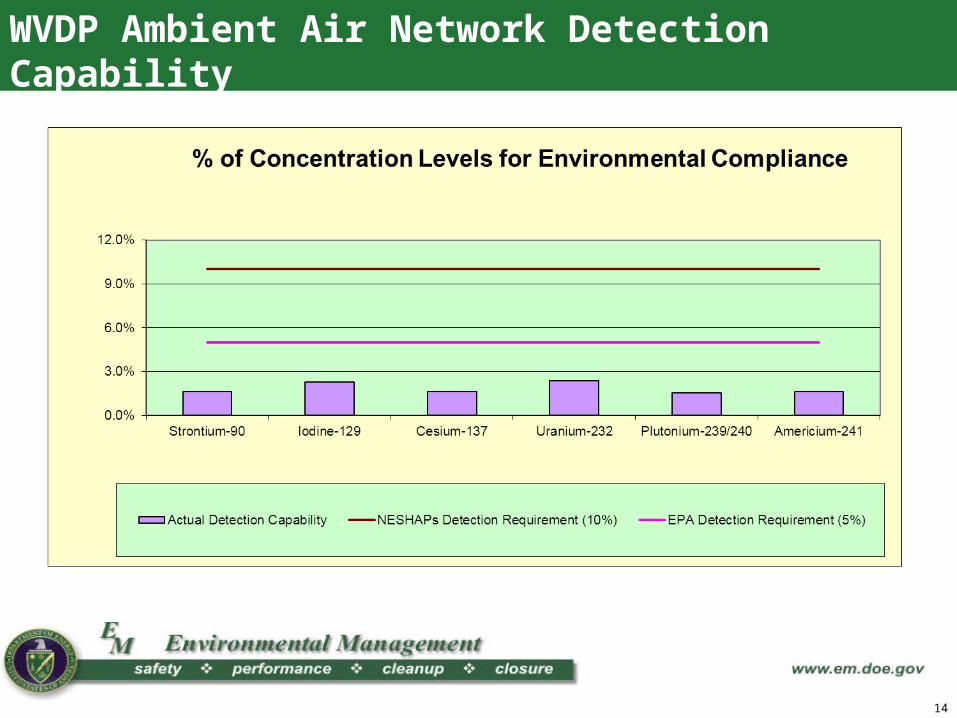
WVDP Ambient Air Network Detection Capability
14