Embed Size (px)
Citation preview

X-ray diffraction peak profiles from threading dislocations in GaN epitaxial films
V. M. Kaganer, O. Brandt, A. Trampert, and K. H. PloogPaul-Drude-Institut für Festkörperelektronik, Hausvogteiplatz 5–7, D-10117 Berlin, Germany
�Received 20 October 2004; revised manuscript received 22 December 2004; published 13 July 2005�
We analyze the line shape of x-ray diffraction profiles of GaN epitaxial layers with large densities ofrandomly distributed threading dislocations. The peaks are Gaussian only in the central, most intense part ofthe peak, while the tails obey a power law. The q−3 decay typical for random dislocations is observed in therocking curves with open detector. The entire profile is well fitted by a restricted random dislocation distribu-tion. The densities of both edge and screw threading dislocations and the ranges of dislocation correlations areobtained.
DOI: 10.1103/PhysRevB.72.045423 PACS number�s�: 61.10.Nz, 61.12.Bt, 61.72.Ff, 68.55.�a
I. INTRODUCTION
GaN epitaxial layers grown on different substrates �e.g.,Al2O3, SiC, or Si� possess very large densities of threadingdislocations which cross the layer along its normal, from thelayer-substrate interface to the surface.1 The threading dislo-cation density depends only marginally on the substrate ma-terial �and hence on the misfit between the substrate and thelayer� but rather on the growth technique and conditions. For�0001� oriented layers of wurtzite GaN, the overwhelmingmajority of dislocations are of edge type with Burgers vec-
tors b= 13 �112̄0�. Their density2–5 is typically 108–1010 cm−2.
The density of screw dislocations with Burgers vector b= �0001� is one to two orders of magnitude lower than thedensity of edge dislocations.
In the present paper, we study the profiles of x-ray dif-fraction peaks from GaN epitaxial films which contain edgeand screw threading dislocations uniformly distributed overthe film. Our aim is to develop a reliable method for analyz-ing dislocation correlations in such a system and to deter-mine the dislocation densities. Our analysis is not restrictedto GaN films and can be applied to any layer with threadingdislocations. Note that GaN epitaxial films may possess, incontrast to the samples studied here, a mosaic �granular orcolumnar� structure. We do not include mosaicity in ouranalysis, since our samples are not mosaic, but briefly dis-cuss ways to extend our approach and take mosaicity intoaccount.
The dislocation density can be measured directly by plan-view transmission electron microscopy �TEM�. The actualvirtue of TEM is not the accurate determination of the dislo-cation density, but rather the possibility to determine the typeof the dislocation distribution �e.g., random vs granular/columnar structure�. It is of limited statistical significanceconsidering the small area covered by TEM micrographs.Alternatively, x-ray diffraction can be used to detect the lat-tice distortions due to the presence of dislocations averagedover a large sample area. In principle, both the dislocationdistribution and the actual dislocation density may be ob-tained from x-ray diffraction profiles.
The impact of screw and edge threading dislocations onthe width of the x-ray reflections in the limiting cases oflattice planes parallel and perpendicular to the surface is
commonly referred to as tilt and twist, respectively.2–6 Thisdesignation stems from the model of misoriented blocks5
which is not appropriate for distortions caused by randomlydistributed dislocations. In this case, the description in termsof mean-squared distortions7 is actually more adequate.
The symmetric Bragg reflections from GaN layers arecomparatively narrow, since they are not influenced by thepresence of edge dislocations. Edge dislocations produce dis-tortions within lattice planes parallel to the surface but do notdisturb positions of these planes along the layer normal. Thehighest sensitivity to edge dislocations is obtained by diffrac-tion from lattice planes perpendicular to the surface. Thisdiffraction geometry requires grazing incidence illuminationand is thus commonly performed at a synchrotron.8,9 An al-ternative geometry that can easily be realized in the labora-tory is the skew geometry,4,6 which is a quasisymmetric �theincident and the diffracted waves have the same angles to thesurface� noncoplanar �the surface normal does not lie in theplane defined by the incident and the diffracted waves� ge-ometry, as shown in Fig. 1. By measuring different reflec-tions with increasing lattice plane inclination, one can ex-trapolate to lattice planes perpendicular to the surface.4,6 Asingle reflection with a large inclination can be regarded as afigure of merit.3 A four-circle diffractometer10 is required forskew geometry measurements, since the sample has to betilted with respect to its surface normal. Coplanar asymmet-ric reflections on a three-circle diffractometer are much lesssensitive to edge dislocations since they only partially touchthe lattice distortions parallel to the surface plane.4
FIG. 1. Sketch of skew geometry x-ray diffraction. The latticeplanes of the actual reflection are depicted in the left bottom part ofthe figure. The incident wave Kin and the diffracted wave Kout makethe same angle � to the sample surface. The scattering vector Qmakes an angle � to the sample surface.
PHYSICAL REVIEW B 72, 045423 �2005�
1098-0121/2005/72�4�/045423�12�/$23.00 ©2005 The American Physical Society045423-1
The full width at half maximum �FWHM� of the diffrac-tion peak depends not only on the dislocation density, butalso on the correlations between dislocations. Furthermore, itdepends on the mutual orientations of the scattering vector,dislocation line direction, and the Burgers vector direction,which have not been taken into consideration in previousdiffraction studies of GaN layers. In the present paper, weanalyze the entire line shape of the diffraction profiles, andparticularly their tails. These tails are due to scattering in theclose vicinity of the dislocation lines and are not influencedby the correlations between dislocations. They follow univer-sal power laws and can be used to determine the dislocationdensity. We fit the entire diffraction peak profile to the nu-merical Fourier transform of the pair correlation function andsimultaneously obtain dislocation densities and the range ofdislocation correlations.
II. BACKGROUND
X-ray diffraction is a well-established technique to ana-lyze crystal lattice imperfections.11,12 The conventional andwidely used methods �also in GaN studies5� are based on acomparison of the diffraction peak widths of differentreflections.13–15 They aim to separate two contributions to thepeak broadening, the finite size of the crystalline domains�grains� in the sample and the nonuniform strain within eachdomain owing to lattice defects. The strain broadening of adiffraction peak is proportional to the length of the scatteringvector, while the size effect does not depend on it. Thus,comparing the peak widths of reflections of successive ordersin the so-called Williamson-Hall plot, one can separate bothcontributions. The separation method assumes that all peaksare Gaussian,14,15 or all Lorentzian.13 This is certainly nottrue, and the methods based on the peak width give onlyrough, albeit instructive, estimates of the crystal perfection.A recent development16–18 includes corrections for given ori-entations of the dislocation lines and Burgers vectors withrespect to the scattering vector.
The next milestone was the Fourier analysis of the diffrac-tion peak profile proposed by Warren and Averbach.19,20 Thestarting point of their analysis is the average over grain ori-entations in powder diffraction. The corresponding integra-tion of the scattered intensity in reciprocal space is equiva-lent to a one-dimensional cut of the correlation function inreal space. We note that the powder diffraction literature doesnot use the term correlation function but refers to the Fouriercoefficients of the intensity. We use the solid-state physicsterminology where this quantity is commonly called the paircorrelation function. In crystallography, the same function isreferred to as Patterson function.
The ansatz of the Warren-Averbach analysis is the as-sumption that the correlation function is a product of twoindependent terms describing the size and the strain effects,respectively. Furthermore, it is assumed that the finite sizesof the grains give rise to a Lorentzian peak �exponential cor-relation function� while nonuniform strain is described by aGaussian function. With these assumptions, the size andstrain effects are separated by differentiation of the Fourier-transformed peak profile. In many cases, the latter step is not
sufficiently accurate, since it has to rely on a few Fouriercoefficients obtained from noisy experimental data.Balzar21,22 suggested avoiding this difficulty by directly fit-ting the peak profile to a convolution of a Lorentzian and aGaussian, which is the Voigt function. The experimentalpeak profiles are not always described by the Voigt functionand various other analytical functions were suggested on apurely phenomenological basis.23,24
The assumption that nonuniform strain gives rise to aGaussian correlation function looks plausible, taking into ac-count the stochastic nature of this strain originating fromrandomly distributed lattice defects. However, Krivoglaz andRyboshapka12,25 have shown that this is not true for randomdislocations, which are the most common and most impor-tant source of strain. Rather, they found that the slow��r−1� decay of the strain with the distance r from the dislo-cation line gives rise to a correlation function
G�x� = exp�− C�x2 lnL
�x� . �1�
Here C1 is a dimensionless factor depending on the orien-tations of the dislocation line and Burgers vector with respectto the x direction �an arbitrary direction along which thecorrelations are measured�. Its dependence on the scatteringvector Q and the Burgers vector b is given by C� �Q ·b�2.The dislocation density � is defined as a total length of thedislocation lines per unit volume. For straight dislocations, �is equal to the number of dislocations crossing the unit areaof a plane perpendicular to the dislocation lines. �1 isanother dimensionless factor, for uncorrelated dislocations�= Q ·b /2�.
For completely random and uncorrelated dislocations, L isthe crystal size, so that formally the diffraction peak width ofan infinite crystal with random uncorrelated dislocationstends to infinity.12 Wilkens26–28 pointed out that this diver-gence has the same origin as the divergence of elastic energyof a crystal with dislocations: the elastic energy is propor-tional to �b2 ln L /a, where � is the shear modulus, b is thelength of the Burgers vector, and a is the lattice spacing. Hesuggested that the system can drastically reduce elastic en-ergy by a very minor rearrangement in the dislocation en-semble: the positions of the dislocations remain random buttheir Burgers vectors are correlated, so that the total Burgersvector in a region exceeding some characteristic scale iszero. Then, the dislocations screen each other and the elasticenergy, as well as the diffraction peak width, remain finite.Wilkens introduced a “restricted random distribution” of dis-locations by subdividing the crystal into cells, such that thetotal Burgers vector in each cell is zero. He found26–28 thatthe functional form of Eq. �1� does not change but L shouldbe understood as a finite size of the cells. Krivoglaz et al.12,29
showed that the same result is valid for a broad class ofcorrelated dislocation distributions with screening.
We note also the two-dimensional crystal as a limitingcase of dislocation screening. Here the elastic energy of dis-locations is to be compared with the entropic term −TS,where T is temperature and the entropy S=ln�L /a�2 is thenumber of lattice sites where the dislocation can be placed.
KAGANER et al. PHYSICAL REVIEW B 72, 045423 �2005�
045423-2

Both elastic energy and entropy terms are proportional toln L. As a result, above some temperature Tm, dislocationsare generated by unbinding of thermally excited dislocationpairs, giving rise to the dislocation mediated melting.30,31
The calculation of the correlation function in this highly cor-related dislocation system32 shows that the logarithmic termin Eq. �1� vanishes.
Fourier transformation of the correlation function �1�yields a Gaussian shape only in the central part of the peak.The range of the Gaussian peak shape is given by a dimen-sionless factor
M = L�� �2�
and increases when M is increased. The intensity distributionnotably deviates from the Gaussian shape at the tails of thediffraction peak.
The tails of the diffraction peak due to dislocations followa universal law I�q��q−3, which can be obtained from Fou-rier transformation of Eq. �1�.33 The q−3 law is due to the factthat at large q, the scattering takes place in the strained re-gions close to dislocation lines, where the lattice is sostrongly misoriented that the Bragg law is locally satisfiedfor the wave vector q. Calculation of the volume of theseregions give the q−3 dependence.12,33,34 The q−3 asymptote isvery general property of the scattering from dislocationstrain field, and is realized for any dislocation distribution atlarge enough q. In particular, it is valid for dislocation walls�small angle domain boundaries� at wave vectors q exceed-ing the inverse mean distance between dislocations in thewall.12
Groma and co-workers33,35,36 developed methods for thepeak profile analysis based on a calculation of the restrictedmoments of I�q�. In particular, the second-order restrictedmoment v�q�=�−q
q q2I�q�dq is proportional to ln q, whichthey used to determine the mean dislocation density. Higher-order moments describe fluctuations of the dislocation den-sity.
GaN epitaxial films comprise a well-defined systemwhere threading dislocations are aligned perpendicular to thesurface plane. The film is oriented, contrary to a powder.However, the advantage of powder diffraction, that allowsone to treat the problem in terms of a one-dimensional cor-relation function, can be preserved by making the measure-ments with an open detector. These give rise to an averagevery similar to the powder average, Fig. 2. The intensity isintegrated over directions of the outgoing beam, instead ofthe integration over directions of the diffraction vector. Theintegrations in reciprocal space give rise to cuts in real space,which are different for the two cases under consideration.The coordinate x in Eq. �1� runs along the direction of theoutgoing wave in case of the oriented sample with open de-tector and in the direction of the diffraction vector for thecase of powder diffraction. This fact introduces a geometricalcorrection in the orientational factor C. The skew diffractiongeometry used for the measurements gives rise to furthercorrections, which are calculated below.
Our approach consists of a direct fit of the measured in-tensities by the numerical Fourier transformation of the cor-relation function �1�, thus avoiding any transformation of the
experimental data. We expect that such a calculation is lessinfluenced by the noise in the experimental data and is morereliable. As shown below, we find good agreement betweenmeasured and calculated peak profiles. From the fits, we re-liably obtain both the dislocation densities and the correla-tion range in the restricted random dislocation distribution.
III. THEORY
The intensity of x-ray scattering from a crystal disturbedby distortion fields of lattice defects12 can be represented as aFourier transform
I�q� = G�r�exp�iq · r�dr �3�
of the pair correlation function
G�r� = �exp�iQ · �U�r� − U�0���� . �4�
Here Q=Kout−Kin is the scattering vector �Kin and Kout arethe wave vectors of the incident and scattered waves, respec-tively� and q=Q−Q0 is a small deviation of Q from thenearest reciprocal lattice vector Q0, so that qQ. U�r� is thesum of displacements produced by all defects of the crystalat a given point r. If all defects are of the same type, one canrepresent the total displacement as a sum U�r�=�Ru�r−R�,where u�r� is the displacement produced at point r by adefect placed at origin and R are the positions of defects.Extension to the case of several defect types is straightfor-ward. The angular brackets �¯� denote the average over thestatistics of the defect distribution. Equation �4� implies aninfinite and statistically uniform sample, so that the choice oforigin is arbitrary. When finite size effects are essential, asfor example for misfit dislocations in epitaxial layers,37 thecorrelation function G�r1 ,r2� depends on the difference of
FIG. 2. Scattering geometries of powder diffraction �a� and dif-fraction from an oriented sample with wide open detector �b�. In thecase of powder diffraction, both incoming and outgoing beams arecollimated and the scattering angle is fixed. Different grains giverise to different orientations of the reciprocal lattice vector Q0.Equivalently, one can fix the direction of Q0 but rotate the incidentand outgoing beams while keeping the angle between them fixed.This latter representation is shown in �a�. Summation of intensitiesfrom differently oriented grains is the integration over a sphereshown by the broken line that can be replaced by a plane perpen-dicular to Q0. The position of the plane is given by the wave vectorq parallel to Q0. In the case of an oriented sample and wide opendetector, the directions of the incoming beam and of the reciprocallattice vector Q0 are fixed. The integration over directions of theoutgoing beam is performed over a sphere that can be replaced bythe plane perpendicular to kout. The position of the plane is given bythe wave vector q that is now parallel to kout.
X-RAY DIFFRACTION PEAK PROFILES FROM… PHYSICAL REVIEW B 72, 045423 �2005�
045423-3

displacements U�r1�−U�r2� and Eq. �3� contains the expo-nent exp�iq · �r1−r2��.
In the case of large dislocation densities considered in thepresent paper, the diffraction peaks are broad, and the corre-lation function �4� has to be calculated for small distancesr= r. On the other hand, the dislocation distortions decayvery slowly �as R−1� and the main contribution to the corre-lation function is due to remote dislocations, Rr. Then, thedifference of displacements can be expanded as Taylor seriesQ · �u�R+r�−u�R����r · � ��Q ·u�R��=riQj�uj /�Ri. Con-sidering dislocation positions R as Gaussian random vari-ables, one can perform the statistical average as
G�r� = exp�−�
2 �riQj�uj/�Ri�2dR� , �5�
where � is the dislocation density. We note that the use ofGaussian statistics is justified only in the present case oflarge dislocation densities. One cannot generalize Eq. �5� asG�r�=exp�− 1
2 �Q · �U�r�−U�0���2�. This latter formula failsto treat the discontinuity of the dislocation displacement bythe Burgers vector b that arises when the medium is cutalong a half-plane to introduce the dislocation. In contrast,Eq. �4� does not have a discontinuity since the product Q0 ·bis a multiple of 2� as a product of a lattice vector and areciprocal lattice vector. The treatment of small dislocationdensities37 requires a more general approach12,25,38 based onthe Poisson statistics for randomly distributed defects. How-ever, Eq. �5� is sufficient for the present paper.
The distortion field of a dislocation has a universalR-dependence, �uj /�Ri=b�ij /2�R, where b is the length ofthe Burgers vector and �ij is a dimensionless factor of theorder of unity which depends only on the azimuth �. Then,one obtains25
G�r� = exp�− C�r2 dR
R� , �6�
where
C = �Qb�2/4�, =1
2�
0
2�
�r̂i�ijQ̂j�2d� . �7�
C and are dimensionless factors of the order of unity. Here
r̂ and Q̂ are unit vectors in the directions of r and Q, respec-tively. The integral in Eq. �6� is taken from �r �where �1 isa dimensionless factor� to a limiting size L, which, for com-pletely uncorrelated dislocations, is equal to the crystal size.Then, the integral is equal to ln�L /�r�, and we arrive at Eq.�1�. When the dislocations are correlated, so that the totalBurgers vector averaged over a certain characteristic scale iszero, the functional form of the correlation function does notchange but L has the meaning of that scale.12,26–29
We restrict ourselves to parallel straight dislocations andtake the direction of the dislocation lines as z axis. Then, Eq.�3� can be written as
I�q� = ��qz� G�x,y�exp�iqxx + iqyy�dxdy , �8�
where the delta function ��qz� is due to the translational in-variance in the direction of the dislocation lines. The orien-tational dependence of the correlation function and hence ofthe intensity distribution in the x ,y plane is described by thefactor , Eq. �7�. Its angular dependence, after the averageover crystallographically equivalent orientations of the Bur-gers vectors, is very weak, see Eqs. �18� and �19� below.Then, the study of the correlation function in one selecteddirection is sufficient for investigation of the dislocation den-sity. That can be naturally done by performing measurementswith a wide open detector. The intensity �3� is then to beintegrated over all directions of the scattered wave Kout. Theresult of this integration is very similar to the powder aver-age. The actual part of the sphere Kout=k �where k is thewave vector� can be replaced by the plane perpendicular tothe direction of Kout. Integration of the intensity �8� over thisplane gives rise to a one-dimensional integral
I�q� = G�x�exp�iqx/cos ��dx , �9�
where � is the angle between the �x ,y� plane and Kout �seeFig. 1�. It is given by sin �=sin � sin �B, where � is theangle between the �x ,y� plane and the scattering vector Qand �B is the Bragg angle. The x axis is chosen along theprojection of Kout on the plane perpendicular to the disloca-tion lines. The corresponding expression for the case of pow-der diffraction differs only by the direction of x: it runs alongKout for oriented films and along Q for powder diffraction.The wave vector q in Eq. �9� is the projection of q on thedirection of Kout, so that q=Q� cos �B, where � is the angu-lar deviation from the peak center.
For the problem under consideration, the direction of r̂ inEq. �7� is that of the diffracted wave, so that the parameter involves a complicated combination of all components of thedislocation distortions. It contains both strain and rotationcomponents. In particular, the tilt and twist contributions dis-cussed in the diffraction studies of GaN films, are included.In contrast, the powder diffraction case requires calculationof the correlation function for r̂ in the direction of Q̂. Denot-ing by � the coordinate in that direction, one can say that theexponent of the correlation function �6� is obtained in thecase of powder diffraction by averaging of the squared straincomponent u��
2 around the dislocation.The integration range in Eq. �9� is limited by distances
smaller than L. A finite integration limit introduced in Eq. �9�leads, in a numerical evaluation of the integral, to unphysicaloscillations in I�q� commonly appearing in Fourier integralstaken over a rigidly limited interval. We found that an appro-priate smoothing is obtained by substituting ln�L /�x� in Eq.�1� with ln��L+�x� /�x� and extending the integration rangeto infinity. The expressions for �=��Q� are bulky and dependon the type of correlations in dislocation positions.12,27–29 Werestrict ourselves to the first approximation that does not de-pend on the type of correlations, �= Q ·b /2�.
KAGANER et al. PHYSICAL REVIEW B 72, 045423 �2005�
045423-4

Finally, combining the equations above, the diffracted in-tensity can be represented as
I��� =Ii
�
0
�
exp�− Ax2 lnB + x
x�cos��x�dx + Ibackgr,
�10�
where Ii is the integrated intensity of the peak. We proceedhere to the angular deviation from the peak maximum � andadd the background intensity Ibackgr to provide the exact for-mula that is used for the fits of the experimental peaks pre-sented below. Parameters A �describing the dislocation den-sity� and B �describing the dislocation correlation range� aregiven by
A = f�b2, B = gL/b . �11�
Here f and g are dimensionless quantities given by the dif-fraction geometry
f =
4�
cos2 �
cos2 �B, g =
2� cos �B
cos � cos �. �12�
In Eq. �12�, the expression for g is written for edge disloca-tions, taking into account the approximation �= Q ·b /2�.For screw dislocations, cos � in this expression should bereplaced by sin �. The length of the Burgers vector b in Eq.�11� is that of the relevant Burgers vector for either edge orscrew dislocations. The dimensionless product �b21 is themean number of dislocations crossing each b�b cell in theplane perpendicular to the dislocation lines. Equation �10�with four parameters A ,B ,Ii , Ibackgr is used in Sec. V blow tofit the peak profiles and obtain the dislocation density � andthe length L.
The behavior of the integral �10� is illustrated in Fig. 3where the function
I�q� = 0
�
exp�− x2 ln��R + x�/x��cos�qx�dx �13�
is numerically calculated for different values of the param-eter R. The curves merge at a common q−3 asymptote thatdoes not depend on R.12,28,33,35 Then, Eq. �10� has an asym-potic behavior �for � large in comparison with the peakwidth�
I��� = AIi
�3 + Ibackgr. �14�
Figure 3 also shows that the asymptote �14� is reachedquite close to the peak center for R1, while for R1 thecentral part of the peak is Gaussian and the angular rangewhere the Gaussian approximation is valid increases withincreasing R. The FWHM of the calculated peaks increaseswith increasing R and can be approximated by
�q � 2.4 + ln R . �15�
Groma33 suggested to use the second restricted moment ofthe intensity distribution
v2��� = −�
�
�2�I��� − Ibackgr�d� �16�
to obtain the dislocation density from the asymptotic behav-ior �14�. Note that the integral �16� diverges, when taken ininfinite limits. One finds, by substituting Eq. �14� into Eq.�16�, that
v2��� = 2IiA ln � + const. �17�
It remains to calculate the orientational factor C �Eq. �7��.In the case of powder diffraction,26–28 the vector r is directedalong the projection Q� of the scattering vector Q on the�x ,y� plane. In our case, the vector r is directed along theprojection of Kout on the �x ,y� plane and makes an angle �with the vector Q�, see Fig. 1. This angle is given bycos �=sin �B cos � / cos �. When evaluating the integral �7�for edge dislocations, we average over possible orienta-tions of the Burgers vector in a hexagonal lattice �the dislo-cation lines are taken along the sixfold axis� and obtain
e =9 − 8� + 8�2 − 2�3 − 4��cos2�
16�1 − ��2 cos2 � , �18�
where � is the Poisson ratio. e depends only weakly on �.Taking �=0.2 for hexagonal GaN, one can approximate e�0.7 cos2 � in the whole range of reasonable angles �. Thecalculation for screw dislocations gives
s =1
2sin2 � . �19�
Two limiting cases are of interest: a symmetric Braggreflection to study screw dislocations and a grazingincidence/grazing exit reflection as an extreme case of ahighly asymmetric skew geometry. For a symmetric Braggreflection, �=� /2 and �=�B. Then, we obtain f =1/8� and,for screw dislocations, g=2�. The grazing incidence/grazingexit geometry is the limit �=�=0, so that f= / �4� cos2 �B� and, for edge dislocations, g=2� cos �B.
The finite thickness T of the epitaxial layer �with thread-ing dislocations perpendicular to the layer plane� can betaken into account by making the Warren-Averbach ansatz19
G�x� = Gd�x�Gs�x� , �20�
where Gd�x� is the correlation function considered above.The correlation function describing finite size effects can be
FIG. 3. Behavior of the integral �13� for different values of theparameter R. All curves merge at a common q−3 asymptote. AGaussian peak profile is shown by the thin line for comparison.
X-RAY DIFFRACTION PEAK PROFILES FROM… PHYSICAL REVIEW B 72, 045423 �2005�
045423-5
written as Gs�x�=exp�−x /T�. Its Fourier transformation is aLorentzian that is expected from the finite slit function�sin�qT /2� / �qT /2��2 after averaging over thickness varia-tions. We note that, in asymmetric reflections, Eq. �9� givesrise to the effective thickness T / cos � along the direction ofthe diffracted wave. The finite size correction �20� does notcomplicate the calculation of the intensity by numerical in-tegration of Eq. �9�. If the resolution of the experiment can-not be neglected in comparison with the peak width, thecorrelation function �20� is to be multiplied with the real-space resolution function R�x�, which also does not lead toadditional complications of the numerical integration.
IV. EXPERIMENT
The GaN layers investigated here were grown on 6H-SiC�0001� by plasma-assisted molecular beam epitaxy�PAMBE�. The two PAMBE systems employed are equippedwith a solid-source effusion cell for Ga and a radio-frequency nitrogen plasma source for producing active N.Both systems have a base pressure of 5�10−11 Torr. We use6N N2 gas as a precursor which is further purified to 5 ppbby a getter filter. H2-etched 6HuSiC�0001� wafers pro-duced by Cree™ were used as substrates.39 An in situ Gaflash-off procedure was performed in order to remove re-sidual suboxides from the SiC substrate surface prior togrowth.39 The temperatures were calibrated by visual obser-vation of the melting point of Al �660 °C� attached to thesubstrate.
Sample 1 was grown under Ga-stable conditions with asubstrate temperature of 740 °C. The growth rate employedwas 140 nm/h, and the film was grown to a final thickness of340 nm. Under these growth conditions, we observed an en-tirely streaky, �1�1� RHEED pattern throughout growth ex-cept for the initial nucleation stage. The surface morphologyof the film as observed by atomic force microscopy �AFM�exhibits clearly resolved monatomic steps. The root-mean-square roughness amounts to 0.3 nm over an area of 1�1 �m. Samples grown under these conditions typically ex-hibit a narrow symmetric reflection, suggesting a low densityof screw dislocations. In contrast, sample 2 was grown undernear-stoichiometric conditions with a substrate temperatureof 780 °C. The growth rate employed was 445 nm/h and thetotal thickness of the film amounts to 1660 nm. After theinitial 100 nm of GaN growth, a 10-nm-thick AlN film wasdeposited prior to overgrowth by GaN. The RHEED patternexhibited a superposition of streaks and V-shaped chevronsindicative of facetting. Indeed, the AFM micrographs of thissample showed the characteristic plateau-valley morphologyof GaN films grown with insufficient Ga flux. Compared tofilms grown under the same conditions as sample 1, filmsgrown under these conditions exhibit narrower asymmetricreflections, indicating a reduction of the edge dislocationdensity.
X-ray measurements were performed with a PhilipsX’Pert PRO™ four-circle triple-axis diffractometer equippedwith a CuK�1 source in the focus of a multilayer x-ray mirrorand a Ge�022� hybrid monochromator. The detector was keptwide open and at fixed position 2�B, leading to an angular
acceptance of 1°. Additional measurements �� and �−2�scans� were performed with a three-bounce Ge�022� ana-lyzer. All asymmetric rocking curves were recorded in skewgeometry.4,6 Symmetric and asymmetric rocking curves ofsubstrate reflections were found to have a width close to theinstrumental resolution, which shows that substrate mosaic-ity as well as strain-induced bending �which is significant forvery thick films� can be neglected in the present work. Wedenote the GaN reflections in the form hk . l which is equiva-lent to the four-index notation hkil for hexagonal crystalswith h+k+ i=0.
V. RESULTS
A. X-ray diffraction
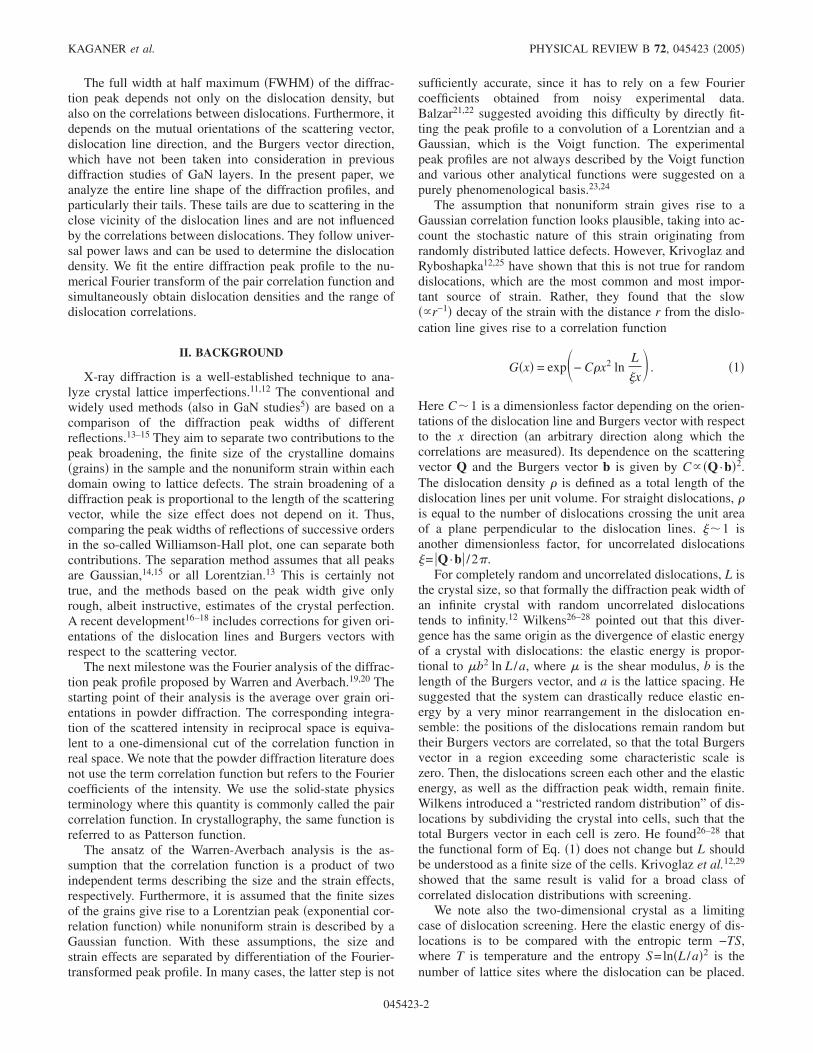
Figure 4 compares a rocking curve measured with opendetector �acceptance 1°� and a rocking curve �� scan� mea-sured with an analyzer across the 10.5 reflection for the sameGaN film �sample 1�. The comparison with the 044 rockingcurve from a perfect Si crystal shows that the GaN peakbroadening due to instrumental resolution can be neglected.The log-log plots �right column� show that the tails of theintensity distributions follow the asymptotic power laws ex-pected for scattering from dislocations. The I�q−3 law isobserved for measurements with the open detector. In thecase of a collimated diffracted beam, there is one integrationless in q space which gives rise to the I�q−4 law. The com-parison of the profiles obtained with an open detector andwith a collimator shows that they contain the same informa-tion about lattice distortions in the film. The rocking curvemeasurements with open detector have, however, both ex-perimental and theoretical advantages. The experimental ad-vantage is a two orders of magnitude higher intensity �theintensities are plotted in Fig. 4 in counts per second�. Theanalysis of the rocking curve is also more simple since the
FIG. 4. The rocking curve with open detector �black line� androcking curve with the analyzer crystal �gray line� recorded in skewgeometry across the 10.5 reflection of sample 1. An asymmetric 044reflection from a perfect Si crystal �broken line� is shown as ameasure of the resolution. The intensities from the GaN layer arepresented in counts per second, the Si�044� signal is scaled appro-priately. The right panel shows the same peaks in log-log scale.
KAGANER et al. PHYSICAL REVIEW B 72, 045423 �2005�
045423-6

intensity distribution is described by the one-dimensional in-tegral �9�, while the analysis of the scans with the analyzerrequires the two-dimensional integration �8� of the correla-tion function. Therefore, we restrict ourselves to the analysisof the rocking curves with open detector.
Figure 5 presents skew-geometry rocking curves for vari-ous reflections from sample 1. Several conclusions can bedrawn just from a direct inspection of the peak profiles. First,the line shapes are far from being Gaussian at the tails of theintensity distribution: see the comparison of the 10.1 profilewith a Gaussian fit �dotted lines in Figs. 5�a� and 5�b��.When the dynamic range is larger than two orders of magni-tude, it is evident that the tails of the asymmetric profilesrather follow the q−3 law. For relatively weak reflections�e.g., 10.4 or 20.4�, the −3 exponent is not reached. Thus, theprofiles obey the behavior typical for a random dislocationdistribution. In the following, we analyze them quantitativelyto obtain the characteristics of the dislocation ensemble.
The solid lines in Figs. 5�a� and 5�b� are the fits of themeasured profiles by Eq. �10�. One can see that the peakprofiles are adequately described. In Fig. 6, we plot the fitparameters A and B as functions of f and g, respectively,since according to Eq. �11� both dependencies are expected
to be linear. Figure 6�a� can be considered as a refined ver-sion of the Williamson-Hall plot. The linear fit of the data inFig. 6 crosses the axis of the ordinates at a small but nonzerovalue of A, which indicates that, in addition to threadingdislocations, there is an additional source of peak broaden-ing, namely, size broadening. This effect is smaller forsample 2. From the slopes of the straight lines in Fig. 6�a�,we obtain �ebe
2=A / f =6.3�10−5 and 4.5�10−5 for samples1 and 2, respectively, where be=0.32 nm is the length of theBurgers vector of edge dislocations. This result yields a den-sity of edge threading dislocations �e=6.1�1010 cm−2 forsample 1 and 4.4�1010 cm−2 for sample 2. The mean dis-tances between edge dislocations are rd=1/��e=40 nm�sample 1� and 47 nm �sample 2�. From the slopes of thelines in Fig. 6�b�, we obtain L /be=B /g=230 and 260, whichgive the characteristic lengths of the dislocation correlationsL=74 and 83 nm, respectively. The dimensionless parametercharacterizing the dislocation correlations28 possesses thevalues M =L /rd=1.85 for sample 1 and 1.75 for sample 2.
The fits presented in Figs. 5 and 6 are obtained by anonlinear least squares fit minimizing the difference Iobs− Icalc between measured and calculated intensities. We alsoperformed fits that minimize the difference log Iobs− log Icalc,thus providing more weight on the peak tails. These fits givea better agreement between measured and fitted curves in thelow-intensity part of the curve and a worse agreement nearthe peak maximum. They result in somewhat smaller valuesof A and larger values of B. We take the difference between
FIG. 5. Rocking curves with open detector from sample 1 ob-tained in skew geometry for different reflections as indicated in thefigure. The profiles are shown in logarithmic �a� and log-log �b�scales. The experimental data are shown by gray lines. The fullblack lines are fits of the intensity by Eq. �10�. The dotted lines forthe 10.1 profile show a Gaussian profile.
FIG. 6. Parameters A and B obtained from the fits of the experi-mental profiles by Eq. �10�. Samples 1 and 2 are denoted by full andopen symbols, respectively.
X-RAY DIFFRACTION PEAK PROFILES FROM… PHYSICAL REVIEW B 72, 045423 �2005�
045423-7

these two types of fits as a measure of an error in the dislo-cation density determination from the x-ray diffraction peakprofile. The mean values and estimated errors are presentedin Table I.
We also fitted the profiles with Eqs. �14� and �17�, whichrequire less computational efforts. These fits give slightlylarger values for parameter A �dislocation density� and arenot able to give parameter B for dislocation correlations.
The symmetric x-ray diffraction profiles shown in Fig. 7are narrow compared to the asymmetric reflections. Further-more, the profiles of samples 1 and 2 are qualitatively differ-ent. In sample 1, the intensity distributions obey a q−2 law inthe intermediate range of angular deviations �and intensities�that is followed by an even lower exponent for large devia-tions �and very low intensities�. In sample 2, the intensitydistributions are close to the q−3 law.
Edge threading dislocations with dislocation lines normalto the surface and Burgers vectors in the surface plane,which are the main source of the peak broadening in asym-metric reflections, do not distort the planes parallel to thesurface. They do thus not contribute to diffraction in the
symmetric reflections. The q−2 law for the 00.2 and 00.4peaks of sample 1 points to the finite thickness of the epitax-ial layer as the main source of the broadening. The slowintensity decay at the far tails of the peaks has another origin.A plausible source of this slow decay is thermal diffuse scat-tering. Albeit weak, it exhibits a slow decay and becomesvisible at large q, since scattering from defects decaysfaster.40,41 We did not investigate this part of the symmetricreflections further since we suppose that it is not related tothreading dislocations which are the topic of the presentstudy. The profiles of sample 2, which is three times thickerthan sample 1, obey the q−3 law indicating that the broaden-ing is primarily by dislocations.
The solid lines in Fig. 7 are the fits of the experimentalcurves to Eq. �20�, where the different thicknesses of thelayers are explicitly taken into account. We indeed obtain theq−2 intensity decay on the tails of the peak for sample 1 andthe q−3 decay for sample 2. From the fit parameters, weobtain �sbs
2=A / f =2.4�10−6 and 4.5�10−6 for samples 1and 2, respectively, where bs=0.52 nm is the length of theBurgers vector of screw dislocations. This result yields thescrew threading dislocations densities of �s=9�108 cm−2
for sample 1 and 1.7�109 cm−2 for sample 2. From the val-ues of the parameter B we obtain L /bs=B /g=650 and 440,which result in characteristic lengths of the dislocation cor-relations L=340 nm and 230 nm for sample 1 and 2, respec-tively. The parameter M is close to 1 for both samples. Note,however, that screw dislocations are not the only source ofthe peak broadening in symmetric reflections �see discussionbelow in Sec. VI�.
The samples under investigation certainly contain misfitdislocations at the film-substrate interface, that release themisfit of 3.4% between GaN and SiC. To estimate the effectof misfit dislocations on the diffraction peaks, we have per-formed �−2� scans across the symmetric reflection 00.2, seeFig. 8. Such a scan is along the direction of threading dislo-cation lines and hence is insensitive to threading dislocations�see Eq. �8��. The broadening of the �−2� diffraction curveover the ideal curve �given by the dynamical diffractionwidth and the film thickness� can be attributed to misfit dis-locations. Misfit dislocations give rise to comparable broad-enings in both �−2� and � scans.37 In particular, in the caseof pure edge misfit dislocations, as those found at theGaN/SiC interface, the ratio of the widths in these two scansis approximately 0.6:1. Hence, from the effect of misfit dis-locations on the �−2� curve we can estimate their effect toall other curves considered above.
Figure 8 shows that the �−2� curves are much more nar-row than the rocking curves obtained either with an opendetector or with an analyzer. Moreover, comparison with the
TABLE I. Edge and screw dislocation densities and correlation parameters determined by x-ray diffrac-tion and TEM.
Thickness�nm�
�e �1010 cm−2� �s �1010 cm−2� M =L��
X ray TEM X ray TEM Edge Screw
Sample 1 340 5.0±1.0 3.0±0.5 0.9±0.3 2.4±0.5 1.0±0.3
Sample 2 1660 3.7±0.5 2.0±0.5 1.7±0.2 1.2±0.2 2.7±1.0 1.0±0.3
FIG. 7. Symmetric 00.2 and 00.4 x-ray diffraction profiles fromsamples 1 and 2. The profiles are shown in logarithmic �a� andlog-log �b� scales.
KAGANER et al. PHYSICAL REVIEW B 72, 045423 �2005�
045423-8

curves simulated for ideal layers show that the widths of the�−2� curves in both samples are mainly due to the finitethickness of the layer. Sample 1 is thinner and gives rise to aFWHM of 54�, while the ideal width is 50�. The thicknessintensity oscillations are seen in both measured and simu-lated curves. The peak width for the thicker sample 2 is 40�,as compared with the ideal width of 31�. The oscillations onboth measured and simulated curves are due to the interme-diate 10 nm thick AlN layer. Such a small effect of misfitdislocations on peak widths is an indication of strong order-ing of the dislocations.37 We estimate the effect of misfitdislocations on the rocking curve widths as at most 30�, to becompared with their typical width of 0.2°. Therefore, theeffect of misfit dislocations on the peaks investigated abovecan be neglected.
B. TEM
TEM is the method of choice to directly determine thecharacter of dislocations and their distribution in thin films.The g ·b criterion in TEM is generally applied for the two-beam condition to evaluate the alignment of the strain fieldof the dislocation with Burgers vector b with respect to thediffraction vector g producing the image contrast. This crite-rion is strictly correct for screw dislocations and for edgedislocations only if their line direction l and Burgers vectorare in the imaging plane, i.e., if g · �b� l� is considered. In
the present case of GaN�0001� films it is well establishedthat three types of threading dislocations exist, having Bur-gers vectors 1
3 �112̄0�, �0001�, and 13 �112̄3� representing edge,
screw and mixed dislocations, respectively, under the as-sumption that the dislocations lines lie parallel to the c axis.Mixed dislocations are not observed in our samples.
In order to identify the Burgers vector, two images haveto be recorded with g parallel and perpendicular to the c axis.The screw dislocations are thus imaged if g= �0002�, an ex-ample of which is shown in Fig. 9�a� for sample 2. From thisimage, we can directly measure the dislocation density if weknow the TEM specimen thickness that is determined bytilting the interface from the end-on to a well-defined in-clined position. Edge dislocations appear in the cross-sectional images if g is perpendicular to the c axis, e.g., if
g= �112̄0�, and we are then able to measure their density inthe same way. Furthermore, plan-view TEM imaging is ap-plied to complement the measurement of the dislocation den-sity. Figure 9�b� shows a plan-view TEM image of sample 2,where the specimen is tilted a few degrees off the �0001�zone axis to obtain two-beam conditions with g= �112̄0� in
FIG. 8. Diffraction curves of samples 1 and 2 in the symmetricreflection 00.2. The rocking curves �obtained with open detectorand with analyzer� are compared with �−2� scans. The bottomcurves are simulations of the �−2� scans for ideal �dislocation free�films.
FIG. 9. Cross-sectional �a� and plan-view �b� TEM images ofsample 2. The outcrops of screw dislocations are marked in �b� byarrows.
X-RAY DIFFRACTION PEAK PROFILES FROM… PHYSICAL REVIEW B 72, 045423 �2005�
045423-9

order to bring the edge dislocations in contrast. The edgethreading dislocations are extended along the film normaland homogeneously distributed. It is remarkable that screwdislocations can be identified as well �marked by arrows�,although the contrast should vanish because of g ·b=0. How-ever, this specific contrast is produced due to strain relax-ation of the screw dislocation at the free surfaces varyinglocally the lattice plane distortions created by the strain field.Table I compares the densities of edge and screw disloca-tions obtained from the x-ray diffraction and TEM measure-ments, revealing that the density of edge dislocations is infact slightly higher in sample 1 compared to sample 2. Thescrew dislocation density in sample 1 is too low for reliableTEM determination. Some of the screw dislocations are seenas hexagonal pits in AFM micrographs. A lower limit of 5�107 cm−2 is thus obtained for the screw dislocation densityin sample 1.
VI. DISCUSSION
We have analyzed the profiles of x-ray diffraction peaksin the intensity range down to four orders of magnitude be-low the peak maximum. We have found that the correlationfunction �1� with only two fit parameters well describes thewhole peak profile. To our knowledge, our work is the firstattempt to describe the entire peak profile from randomlydistributed dislocations, although Eq. �1� was derived a longtime ago.12,25–28 Recent works on the peak profile analysis inpowder diffraction33,35,36 used the q−3 asymptote in an indi-rect way, by calculating the restricted moments of the inten-sity distribution. However, the screening range in a restrictedrandom dislocation distribution cannot be obtained from theasymptotic part of the peak. Our fit of the whole peak profileprovides both parameters of the dislocation distribution, thedislocation density and the screening range. The numericalcalculation of the peak profile involves just a one-dimensional Fourier integral �10� which can be computedquickly.
Use of the q−3 asymptote is a most reliable way for thedetermination of the dislocation density, since it is due toscattering from the regions close to each dislocation line andthus is not influenced by the correlations between disloca-tions. As alternatives to the use of the correlation function�1�, one can use the second-order restricted moment of theintensity distribution33,35,36 or the asymptotic law �14�. Wetried both and found dislocation densities in good agreementwith the values obtained by the peak profile fit.
We have shown that the measurements with open detectorand with an analyzer crystal provide essentially the sameinformation on the dislocation density and correlations. Theadvantage of the measurements with an open detector con-sists in the reduction of the calculations to a one-dimensionalintegral �10�. These measurements also provide higher inten-sities �albeit with the same dynamic range of intensities�. Inmore complicated situations, if the threading dislocations arejust one of several sources of the peak broadening, measure-ments with analyzer may be more useful.
The asymptotic part of the intensity distribution was notinvolved up to now in x-ray diffraction studies of GaN films.
The dislocation density determination was based on theFWHMs of the peaks. When both size and distortion effectswere involved, the peak was fitted to a sum of a Gaussianand a Lorentzian function �pseudo-Voigt function� and theFWHM of the Gaussian part was used for the dislocationdensity determination.2 It is instructive therefore to deriveexpressions for the peak widths from the present model andcompare them with the expressions used in the GaNstudies.2,5
Two quantities can be obtained from the FWHMs of aseries of the reflections.4 One is the FWHM of the symmetricreflection ��s which is influenced by screw dislocations butinsensitive to edge dislocations. The other quantity is ob-tained by extrapolation of the FWHM of skew reflections tothe limiting case of grazing incidence/grazing exit diffrac-tion, with both incident and diffracted beams lying in thesurface plane. This quantity ���e� is sensitive to edge butinsensitive to screw dislocations. The quantities ��s and��e are referred to as tilt and twist, respectively.
Figure 10 presents the widths of the diffraction profiles ofsamples 1 and 2 as a function of the inclination angle �. Thelines are fits by the model described in Ref. 4 to obtain ��sand ��e. While these quantities are determined reliably andaccurately, the question arises how they are related to theactual dislocation densities. The formulas most commonlyused to determine the dislocation density are2,5
�e =��e
2
4.35be2 , �s =
��s2
4.35bs2 , �21�
with the coefficient 2� ln 2�4.35. The only justification ofEqs. �21� was given by Dunn and Koch42 in one line: “If arandom distribution of dislocations represents the subgrainsreasonably well… .” In fact, this equation properly takes intoaccount the very general result, that the dislocation density isproportional to the square of the peak width and inverselyproportional to the square of the relevant Burgers vector, butthe coefficients were derived for a mosaic crystal with dislo-cations forming grain boundaries. These coefficients thusneed to be reconsidered.
The relation between the dislocation density and theFWHM �� of the intensity distribution �10� can be written,
FIG. 10. FWHM of the rocking curves as a function of inclina-tion angle � for the two GaN films. The symbols are experimentaldata and the lines are fits to them.
KAGANER et al. PHYSICAL REVIEW B 72, 045423 �2005�
045423-10

by making use of Eqs. �11� and �15�, in a form similar to Eq.�21�:
� ���2
�2.4 + ln�g�fM��2fb2. �22�
The dimensionless parameter M =L�� that characterizes dis-location correlations is slightly larger than 1 for the GaNfilms studied here, which is an indication of a strong screen-ing of the long-range distortion fields of dislocations by theneighboring dislocations. One has M 1 for uncorrelateddislocations. In this latter case, the logarithmic term in Eq.�22� is the one obtained by Krivoglaz.12,25
We can now simplify Eq. �22� for the limiting cases of thelarge-inclination skew diffraction and for symmetric Braggdiffraction by using the expressions for the parameters f andg obtained in Sec. III for these cases:
�e �18��e
2 cos2 �B
�2.8 + ln M�2be2 , �s �
36��s2
�2.4 + ln M�2bs2 . �23�
The term ln M describing the range of dislocation correla-tions cannot be neglected even when M varies between 1 and2, as it happens to be the case for the samples studied in thepresent work. Compared to Eqs. �21�, Eqs. �23� result in afour times higher edge dislocation density and an order ofmagnitude higher screw dislocation density.
The linear density of misfit dislocations at the interfacebetween the SiC substrate and a fully relaxed GaN layer canbe easily calculated from the misfit of 3.4% and amounts to�L=1.1�106 cm−1. If misfit dislocations are distributed atthe interface in a random and uncorrelated way, they causeroughly the same broadening of the x-ray diffraction peaksas an areal dislocation density �A=�L / t of the dislocationsdistributed in the film �here t is the film thickness�.37 For thesamples under consideration, we find that �A is of the orderof 1010 cm−2, i.e., is comparable with the density of edgethreading dislocations. We have investigated the effect ofmisfit dislocations by measuring the �−2� scans in the sym-metric Bragg reflection 00.2 �Fig. 8�. These scans are in thedirection along the lines of threading dislocations and henceare not influenced by them. We found that the peaks in thesescans are narrow compared to the rocking curves and eventhese small widths are mainly due to intrinsic width of thepeak and the finite thickness of the layer. This is an indica-tion of a high correlation in the distribution of misfit dislo-cations. Such correlations are commonly observed in differ-ent epitaxial systems37 and can be especially large in theGaN films, since the misfit dislocations are edge dislocationswith the glide plane coinciding with the interface. Then, themisfit dislocations can easily glide along the interface toform almost periodic arrays, thus minimizing the elastic en-ergy. A periodic array of misfit dislocations has been recentlyobserved in a related system, namely, AlN on Si�111�.43 Inthis latter case of periodic dislocations, the nonuniform strainis constrained to a layer with the thickness not exceeding thedistance between dislocations, and the broadening of the dif-fraction peaks is almost absent. Thus, we conclude that thebroadening of our rocking curves by misfit dislocations canbe neglected.
Screw dislocations are not the only possible source of thepeak broadening in symmetric reflections. Edge threadingdislocations can contribute to these reflections if the disloca-tion lines deviate from the layer normal. Even if such devia-tions are small, the effect cannot be neglected since the den-sity of edge threading dislocations is much larger than thedensity of screw threading dislocations. The stress relaxationat the free surface gives rise to additional distortions aroundthe outcrops of the edge threading dislocations, contributingto an additional broadening to the symmetric reflections.Thus, Eq. �10� and, particularly, Eqs. �23� provide an upperestimate of the screw threading dislocation density since theyare assumed to be the only source of broadening for symmet-ric reflections.
The films studied in the present work do not contain mis-oriented grains, which allowed us to analyze the pure case ofx-ray diffraction from randomly distributed dislocations. Thepresent work provides, however, also a background for theanalysis of films with misoriented grains. There are two ef-fects of the grains on the peak shape, caused by the size andthe misorientation of the grains, respectively. The size effectcan be included by using Eq. �20�. We found that this equa-tion adequately describes the effect of the finite thickness ofthe film and we expect that it can describe the in-plane grainsize effect as well. The inclusion of the size effect does notcomplicate the numerical calculations of the peak profiles.The finite size effects give rise to the q−2 asymptote and canbe found directly from the peak profile plotted in log-logscale. In the case of moderate mosaicity, the correlation func-tion �1� has to be written as a function of two in-plane coor-dinates and integrated with finite limits, given by the mosa-icity, to obtain the x-ray diffraction peak profile.
VII. CONCLUSIONS
The width of either symmetric or asymmetric reflectionscan be used as a figure-of-merit for the dislocation densityonly if the dislocation distribution is the same in all thesamples to be compared. Even for films having a spatiallyrandom distribution of dislocations, the width of a given re-flection depends not only on the dislocation density, but alsoon the range of correlations in the restricted random disloca-tion distribution. The line shape analysis of the diffractionprofile as presented in this work returns the width as well asthe correlation range, and is thus a far more reliable approachfor estimating the dislocation density than a simple consid-eration of the width alone.
The line shape analysis has shown that the x-ray diffrac-tion profiles of the GaN films under investigation are Gauss-ian only in the central part of the peak. The tails of the peakfollow the power laws characteristic to x-ray diffraction ofcrystals with randomly distributed dislocations. The rockingcurves measured with a wide open detector follow a q−3
behavior, while the rocking curves with an analyzer crystalobey a q−4 behavior. The study of the rocking curves withopen detector is more simple both experimentally and theo-retically, since the diffracted intensity is larger and the peakprofile is described by a one-dimensional Fourier transformof the pair correlation function �10�.
X-RAY DIFFRACTION PEAK PROFILES FROM… PHYSICAL REVIEW B 72, 045423 �2005�
045423-11

The q−3 tails of the diffraction profiles are insensitive tocorrelations between dislocations and allow a more reliabledetermination of the dislocation densities. The entire diffrac-tion profiles are adequately fitted by Eq. �10�. The fits pro-vide two parameters characterizing the dislocation ensemble,
the mean dislocation density � and the screening range L.The latter quantity corresponds to a mean size of the cellswith the total Burgers vector equal to zero. We find that, foredge threading dislocations in GaN layers, L is only slightlylarger than the mean distance between dislocations �−1/2.
1 Group III Nitride Semiconductor Compounds: Physics and Appli-cations, edited by B. Gil �Oxford University Press, New York,1998�.
2 T. Metzger, R. Höpler, E. Born, O. Ambacher, M. Stutzmann, R.Stömmer, M. Schuster, H. Göbel, S. Christiansen, M. Albrecht,and H. P. Strunk, Philos. Mag. A 77, 1013 �1998�.
3 H. Heinke, V. Kirchner, S. Einfeldt, and D. Hommel, Appl. Phys.Lett. 77, 2145 �2000�.
4 Y. J. Sun, O. Brandt, T. Y. Liu, A. Trampert, and K. H. Ploog,Appl. Phys. Lett. 81, 4928 �2002�.
5 R. Chierchia, T. Böttcher, H. Heinke, S. Einfeldt, S. Figge, and D.Hommel, J. Appl. Phys. 93, 8918 �2003�.
6 V. Srikant, J. S. Speck, and D. R. Clarke, J. Appl. Phys. 82, 4286�1997�.
7 V. Ratnikov, R. Kyutt, T. Shubina, T. Paskova, E. Valcheva, andB. Monemar, J. Appl. Phys. 88, 6252 �2000�.
8 A. Munkholm, C. Thompson, C. M. Foster, J. A. Eastman, O.Auciello, P. Fini, S. P. DenBaars, and J. S. Speck, Appl. Phys.Lett. 72, 2972 �1998�.
9 C. C. Yang, M. C. Wu, C. H. Lee, and G. C. Chi, J. Appl. Phys.87, 2000 �2000�.
10 W. R. Busing and H. A. Levy, Acta Crystallogr. 22, 457 �1967�.11 B. E. Warren, X-Ray Diffraction �Addison-Wesley, Reading, MA,
1969�.12 M. A. Krivoglaz, X-Ray and Neutron Diffraction in Nonideal
Crystals �Springer, Berlin, 1996�.13 G. K. Williamson and W. H. Hall, Acta Metall. 1, 22 �1953�.14 M. J. Hordon and B. L. Averbach, Acta Metall. 9, 237 �1961�.15 J. E. Ayers, J. Cryst. Growth 135, 71 �1994�.16 T. Ungár and A. Borbély, Appl. Phys. Lett. 69, 3173 �1996�.17 T. Ungár and G. Tichy, Phys. Status Solidi A 171, 425 �1999�.18 T. Ungár, J. Gubicza, G. Ribárik, and A. Borbély, J. Appl.
Crystallogr. 34, 298 �2001�.19 B. E. Warren and B. L. Averbach, J. Appl. Phys. 21, 595 �1950�.20 B. E. Warren and B. L. Averbach, J. Appl. Phys. 23, 497 �1952�.21 D. Balzar, J. Appl. Crystallogr. 25, 559 �1992�.
22 D. Balzar and H. Ledbetter, J. Appl. Crystallogr. 26, 97 �1993�.23 R. A. Young and D. B. Wiles, J. Appl. Crystallogr. 15, 430
�1982�.24 Th. H. de Keijser, E. J. Mittemeijer, and H. C. F. Rozendaal, J.
Appl. Crystallogr. 16, 309 �1983�.25 M. A. Krivoglaz and K. P. Ryboshapka, Fiz. Met. Metalloved. 15,
18 �1963� �Phys. Met. Metallogr. 15, 14 �1963��.26 M. Wilkens, Acta Metall. 17, 1155 �1969�.27 M. Wilkens, in Fundamental Aspects of Dislocation Theory, ed-
ited by J. A. Simmons, R. de Wit, and R. Bullough �NationalBureau of Standards �U.S.� Spec. Publ. 317, II, 1970�, p. 1195.
28 M. Wilkens, Phys. Status Solidi A 2, 359 �1970�.29 M. A. Krivoglaz, O. V. Martynenko, and K. P. Ryboshapka, Fiz.
Met. Metalloved. 55, 5 �1983�.30 J. M. Kosterlitz and D. J. Thouless, J. Phys. C 5, L124 �1972�.31 J. M. Kosterlitz and D. J. Thouless, J. Phys. C 6, 1181 �1973�.32 I. R. Peterson and V. M. Kaganer, Phys. Rev. Lett. 73, 102
�1994�.33 I. Groma, Phys. Rev. B 57, 7535 �1998�.34 M. Wilkens, Phys. Status Solidi 3, 1718 �1963�.35 I. Groma, J. Appl. Crystallogr. 33, 1329 �2000�.36 A. Borbély and I. Groma, Appl. Phys. Lett. 79, 1772 �2001�.37 V. M. Kaganer, R. Köhler, M. Schmidbauer, R. Opitz, and B.
Jenichen, Phys. Rev. B 55, 1793 �1997�.38 M. A. Krivoglaz, Fiz. Met. Metalloved. 12, 465 �1961�.39 O. Brandt, R. Muralidharan, P. Waltereit, A. Thamm, A. Tramp-
ert, H. von Kiedrowski, and K. H. Ploog, Appl. Phys. Lett. 75,4019 �1999�.
40 L. A. Charniy, K. D. Sherbachev, and V. T. Bublik, Phys. StatusSolidi A 128, 303 �1991�.
41 M. Moreno, B. Jenichen, V. Kaganer, W. Braun, A. Trampert, L.Däweritz, and K. H. Ploog, Phys. Rev. B 67, 235206 �2003�.
42 C. G. Dunn and E. F. Koch, Acta Metall. 5, 548 �1957�.43 R. Liu, F. A. Ponce, A. Dadgar, and A. Krost, Appl. Phys. Lett.
83, 860 �2003�.
KAGANER et al. PHYSICAL REVIEW B 72, 045423 �2005�
045423-12