Embed Size (px)
Citation preview

XenaManager-2G (r66)
Step by Step Guide

Add Chassis
Add/Configure Port/s
Configure Streams
Filters
Capture
Histograms
Global / Port Statistics
Statistics Charting
Event Log / Communication Trace
AGENDA

Click “Add Chassis” button.
ADD CHASSIS

Enter the IP of the Management port under “Chassis Address:”Use “xena” as default “Chassis Password”.
ADD CHASSIS

Use Options > Set Username to indicate who owns the port reservation:
ADD CHASSIS

Select the Port/s you want to use: - Click “Reserve Used Ports”- Check “Show Only Used Ports”
TIP: Right-clicking on ports, modules or chassis will provide additional options e.g.:
ADD PORT(S)
1 2

Select the port/s to configure and click “Resource Properties” tab:
CONFIGURE PORT(S)

Configure the following port parameters to accommodate your test.
CONFIGURE PORT(S)
1
2
3
4
5
6
7
8
9

Minimum IFG- Set to 20 -> 12B (Minimum allowed by Ethernet at 100% load) +8B Preamble- can be set to 16B to achieve >100% load for port pressure testing* Values range between 16B-20B
Mac Address- Used as default SRC.MAC for each stream- Used when sending Ping or replying to ARP
Mac training - Used to train Devices with Xena MAC so stream won`t be flooded
React to pause frames- This means enable Flow Control on this port
1
2
3
4
CONFIGURE PORT(S)

Max. stream header length- When user wants to set headers larger than 128- Number of streams will be downsized to 1/2
6
7
CONFIGURE PORT(S)
Gap Monitor- Used to monitor(time) the disruptions of service to traffic- Gap Monitor start - After how many uSec would the Stopper start- Gap Monitor stop – After how many packets would Stopper stop- Results can be seen in port statistics (type of GAP can only be set)
5
Payload checksum, start at:- Used to enter a Headers + Payload Data Integrity Checksum- Should start from offset 14 for pure L2 packets- Should start after IP offset for L3 and beyond packets (because of TTL)

Loopback mode- Off: Traffic flows naturally out of the port- L1 RX-to-TX: Any received packet is bounced back through TX- L2 RX-to-TX: Same as 8.2 yet it also swaps MAC SRC<>DST- L3 RX-to-TX: Same as 8.3 yet it also swaps IP SRC<>DST- TX(on)-to-RX: Packet goes out of TX but also internally direct to RX- TX(off)-to-TX: Packet goes directly to RX (No link sync needed)- Port-to-port: Any received packet goes out through the neighbor port
8
CONFIGURE PORT(S)

Latency offset- Used to automatically eliminate transceiver + cable latency - Set either manually or via Port Statistics “calibrate” button
9
CONFIGURE PORT(S)

Test port IPv4- Address/Subnet/Gateway used for PING and ARP functionality
Reply to incoming ARP/PING-request- Enable port`s ability to reply to incoming requests
ARP and PING address wildcard:- Used to enable multi unique ARP/PING requests
This means 1.1.1.x will be replied as long as it is part of 1.1.1.1/28 subnet.
1
2
3
CONFIGURE PORT(S)

To add stream click “Add Stream” under Edit Menu Or right-click port and choose “Add Stream”
CONFIGURE STREAM(S)

The grid layout allows scaling configuration.
Select either to view streams under:All Port(s)Selected Port(s)Selected Stream(s)
CONFIGURE STREAM(S)

CONFIGURE STREAM(S)
Insert test payload, TID: This is the stream ID used to identify Latency/Jitter/Packet Loss.
Description: Stream Description text (e.g. “Upstream connected to DUT Port 11”)
Stream StateDisabled: Stream is not started when traffic is ON nor is it included in port rate usage.Suppressed: Stream is not started when traffic is ON, but it is included in port rate usage. (“Paused State”) can be switched to enabled on the fly.Enabled: Stream is started when traffic is ON.
Stop After: Send specific amount of packets and stop traffic.Also used in sequential mode as stream packet quantity.
1
2
3
4
CONFIGURE STREAM(S)

Stream transmission profile:Percent is L1 rate including IFG + Preamble. Configuring on field actually changes all the others accordingly.Grayed text can be edited. To have it set you need one more click.
Error injection: Can send specific errors on the fly – but only when traffic is ON.
Insert frame checksum, FCS: Un-checking this checkbox will cause error frames.
5
6
7
Burst used to configure bursty traffic.Density sets the inner IFG inside the burst.There is a trade-off between the stream rate and the Burst rate.
8
CONFIGURE STREAM(S)

Packet length:
Fixed – for min value =x all packets will be x
Incrementing – for min value =100 and max value=200100,101,102,103,…,197,198,199,200,100,101,102
Butterfly – for min=100 max=200100,200,101,199,102,198,103,197,104,196,105,…
Random – random values between min. and max.
Mix sends internet mixture of :
9
CONFIGURE STREAM(S)
*MIX Weights sets can be loaded\saved via the port resource properties

Payload Type:
Incrementing means “000102030405…FF00010203…”provides built-in data integrity check for payload.
PRBS provides Pseudo Random Bit Sequence of 2^31-1 patternNo data integrity with adding Payload checksum in port properties.
Random provides Random bit Sequence patternNo data integrity with adding Payload checksum in port properties.
Pattern mean you can set your own custom pattern:
10
CONFIGURE STREAM(S)

Create Stream based on PCAP
Pcap Import:
CONFIGURE STREAM(S)

How To Create Flows
To create multiple flows per stream, place the modifier on important headers.e.g. to create 1 Stream with 1000 VLAN flows with values between 1000-2000
4) Right-click VLAN tag and “Add modifier”
5) Configure as follows:
CONFIGURE STREAM(S)
1
2
3
4
5
1) “Add Segment”
2) Choose VLAN
3) Click “OK”
1
2
3

Setup simple bidirectional traffic.1) Add 1 stream for each traffic port (right-click -> Add Stream)2) Select both streams using the Available Resources panel and CTRL+
3) Clicking “Pair Streams” results in …
CONFIGURE STREAM(S)
1
23
3

FILTERS
1
2 3 4
5
6
5
7 8

Add match term –click to add new match term(Added to provided Statistics for a matched packet (e.g. Packets of VLAN 100)
Click to access the field you want to match (headers must be added manually per match term).
Position is set to beginning of field e.g. if you want to match last octet of IP, the offset should be incremented manually
Mask – to focus on a specific Byte the other should be set to “00”
Value – The value you would like to match (the value is in Hex so 50Dec = 32Hex)
Length term –used to find specific packet sizes
1
2
3
4
Filters are used in order to get statistics on specific types of packets either specific content or specific packet size.
These filters can also trigger the Capture mechanism or focus Histogram results.
FILTERS
5
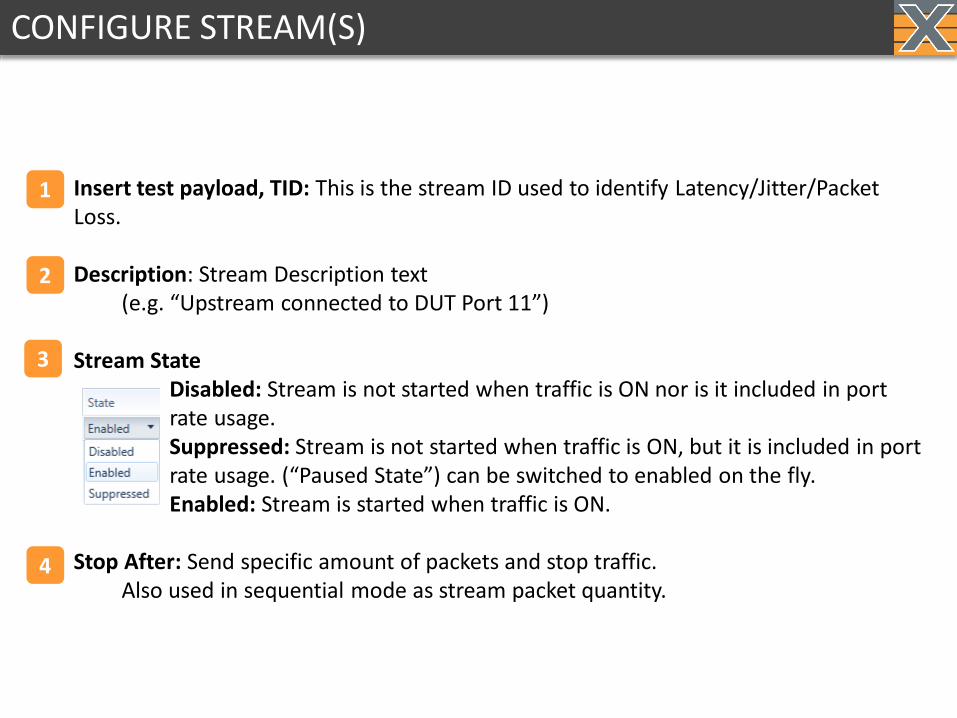
Add filter – click to add/build a new filter based on match terms
Enable checkbox to enable a filter to be present in the results and capture trigger
Describe –Name of the filter
Filter Condition – Build a filter based on pre-built termsusing the &, |, and ~ operators
6
7
8
FILTERS
* Load/Save Filters settings:

Configuration Examples
FILTERS

Results Examples
Filter Results Under Global Statistics > Port Statistics:
FILTERS

CAPTURE
1
2
3
4
5
6
7 8
1. Start Capture
2. Start Trigger
3. Stop Trigger
4. Packets to Keep
5. Test Payload ID
6. Byte to keep
7. Save Packets
8. Launch Wireshark
1
2
3
4
5
6
7
8

1
2
3
CAPTURE
Checkbox enabled means when click Start/Stop in global view, capture mechanism will Start/Stop on this port.
Start Triggers:
- From ON – Means Automatically Start- From FCS error – First FCS error seen triggers Capture Start- From payload error - First Payload error seen triggers Capture Start- Filter x – First packet answering Filter condition triggers Capture Start
Stop Triggers:
- Until full – Means Automatically stop when buffer full- Until FCS error – First(/2nd) FCS error seen triggers Stop- Until payload error - First(/2nd)Payload error seen triggers Stop- Filter x – First (/2nd) packet answering Filter condition triggers Stop-Until User Stop – Capture will keep capturing FILO till manually stopped.
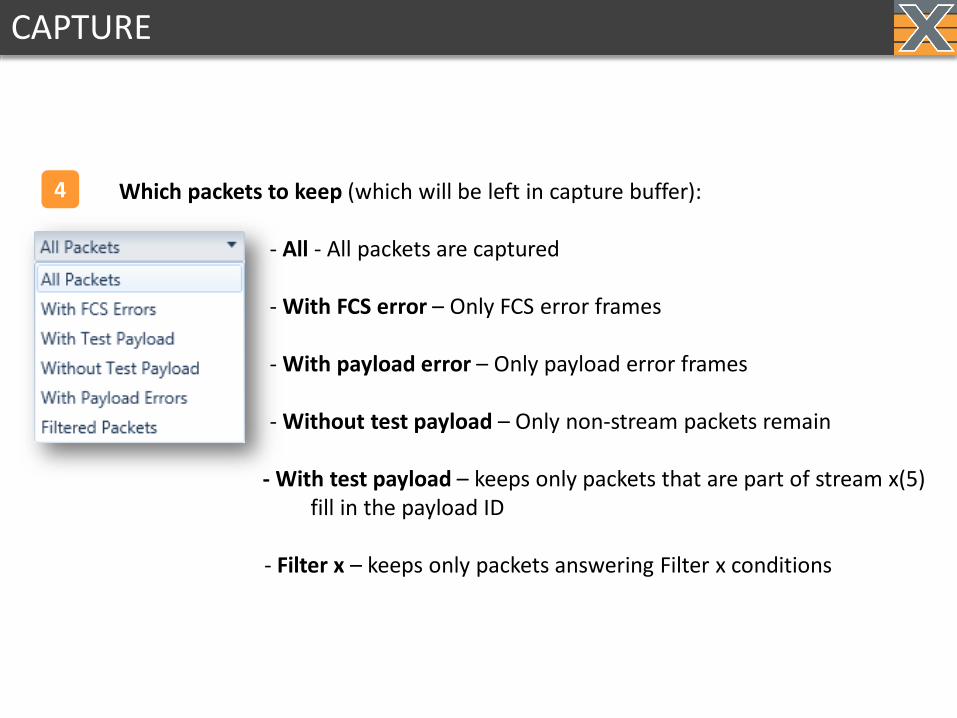
Which packets to keep (which will be left in capture buffer):
- All - All packets are captured
- With FCS error – Only FCS error frames
- With payload error – Only payload error frames
- Without test payload – Only non-stream packets remain
- With test payload – keeps only packets that are part of stream x(5) fill in the payload ID
- Filter x – keeps only packets answering Filter x conditions
4
CAPTURE

Save capture buffer as PCAP file (tcpdump, wireshark, ethereal…)
Open Capture buffer with Wireshark* (or any PCAP associated software)
7
8
CAPTURE
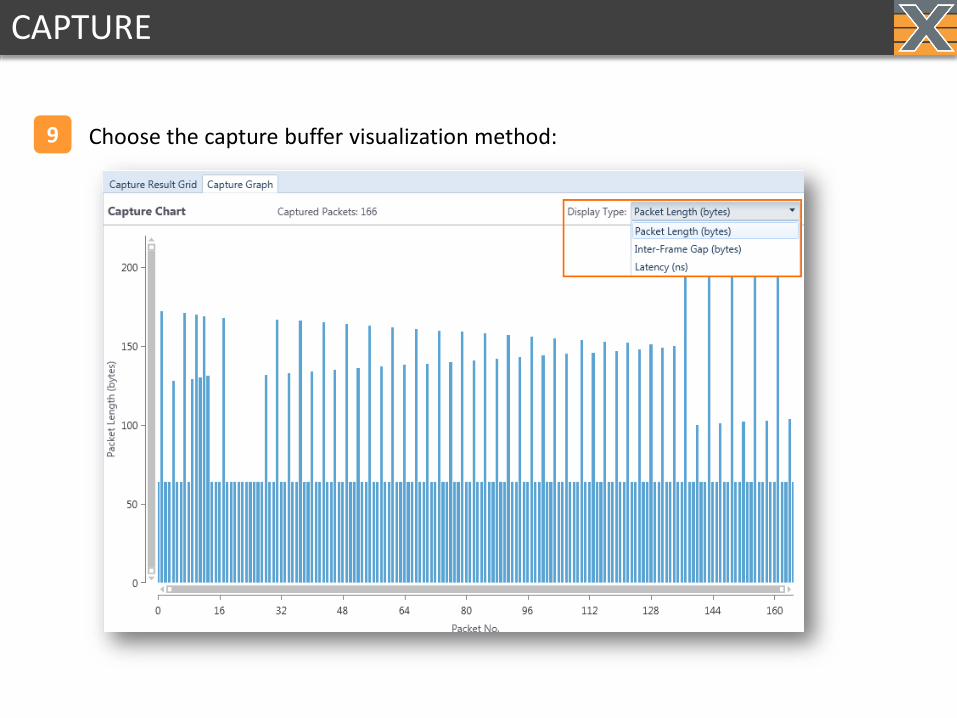
Choose the capture buffer visualization method:9
CAPTURE

Histograms are used to plot different distributions of values gathered over time e.g.• Tx/Rx Length (Packet size distribution)• Rx Latency (Latency and Jitter may drift over time)• Rx Jitter• Rx IFG (an additional way of observing Jitter behavior)
Each change of configuration will resets the results.
HISTOGRAMS

Add histogram – Multiple histograms can be ran simultaneously
Start Histogram – Start Manually or use checkbox to start from Global
Select the type of measurement you would like to track using the Histogram:
Select which packets will be monitored by this Histogram:
… either Specific TID or packets answering a specific filter
1
2
3
4
HISTOGRAMS
X-axis range – choose the minimum offset and the resolution (step)
Use the Freeze button to freeze the view, and enable the Save option.
5
6

GLOBAL STATISTICS

Ports
Mark – freeze constant results and show only changing results
Save – Save a CSV with all ports results
Total traffic - included results of TID traffic and non TID traffic:
1
2
3
GLOBAL STATISTICS

Ports
Without test payload – non TID traffic
Filters – Filter results but only 2 for port (the rest are under Statistics)
ARP/PING control plane results
Injected errors results (as shown in stream section)
Miscellaneous results:-# sent MAC training packets-# sent IGMP joins -# FCS errors caught-# RX Pause frames -Flow Control pause frames
4
5
6
7
8
GLOBAL STATISTICS

Streams
GLOBAL STATISTICS
Mark – freeze constant results and show only changing resultsSave – Save a CSV with all stream results
For each stream instance a separate set of results would be presented.
The traffic results (move the right bar to the left to see results that have +eXX)
9
10
11
* Right click on results counter to set counter visibility:
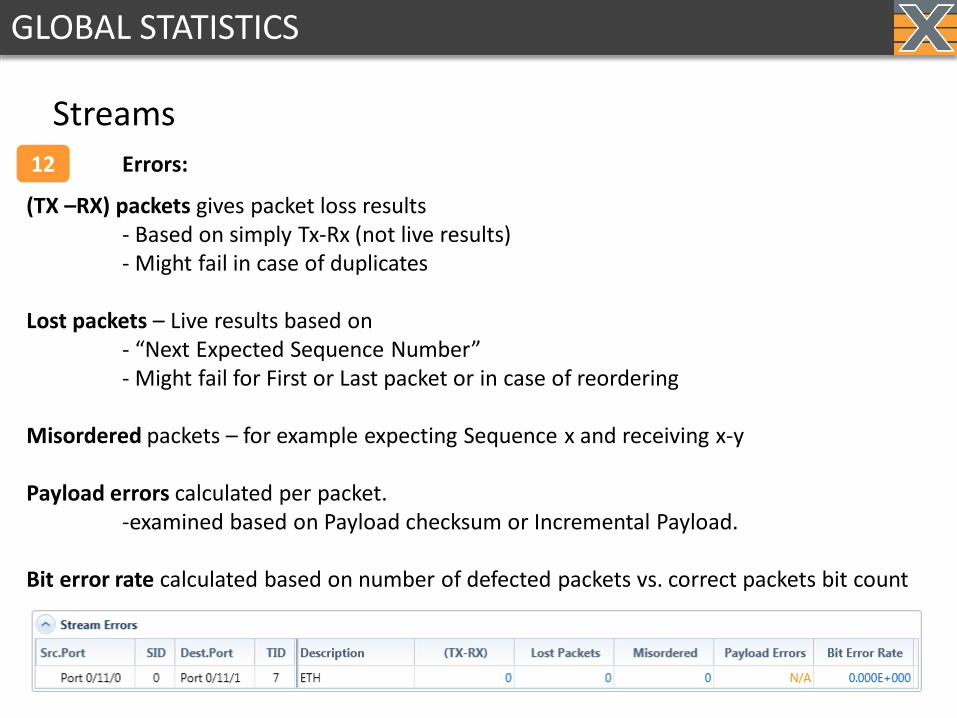
StreamsErrors:
(TX –RX) packets gives packet loss results- Based on simply Tx-Rx (not live results)- Might fail in case of duplicates
Lost packets – Live results based on - “Next Expected Sequence Number”- Might fail for First or Last packet or in case of reordering
Misordered packets – for example expecting Sequence x and receiving x-y
Payload errors calculated per packet. -examined based on Payload checksum or Incremental Payload.
Bit error rate calculated based on number of defected packets vs. correct packets bit count
12
GLOBAL STATISTICS
Streams
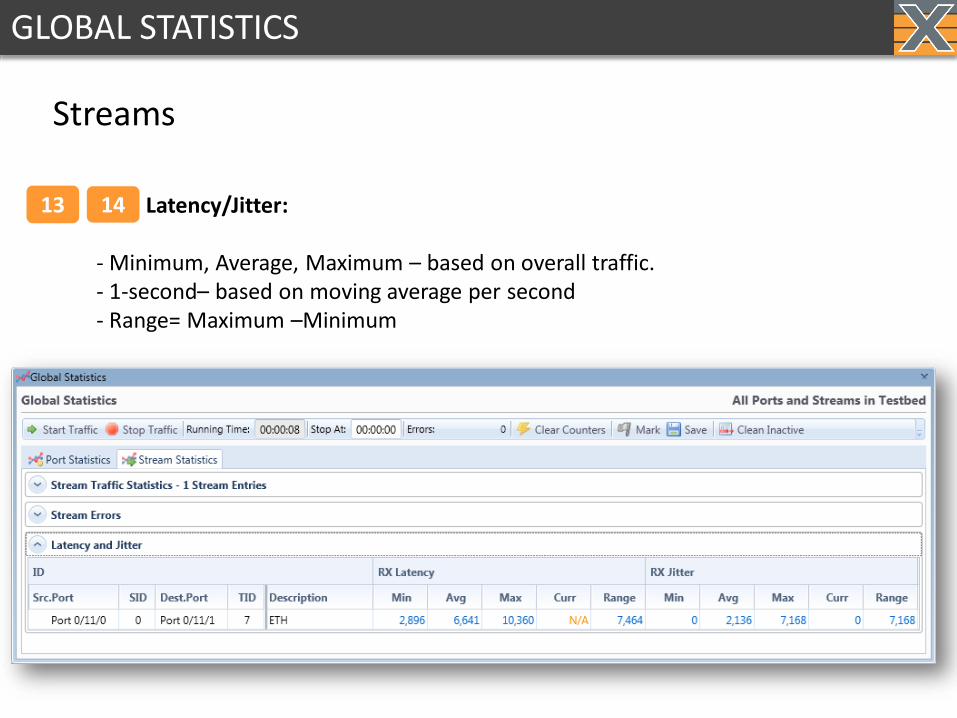
Latency/Jitter:
- Minimum, Average, Maximum – based on overall traffic. - 1-second– based on moving average per second- Range= Maximum –Minimum
13 14
GLOBAL STATISTICS

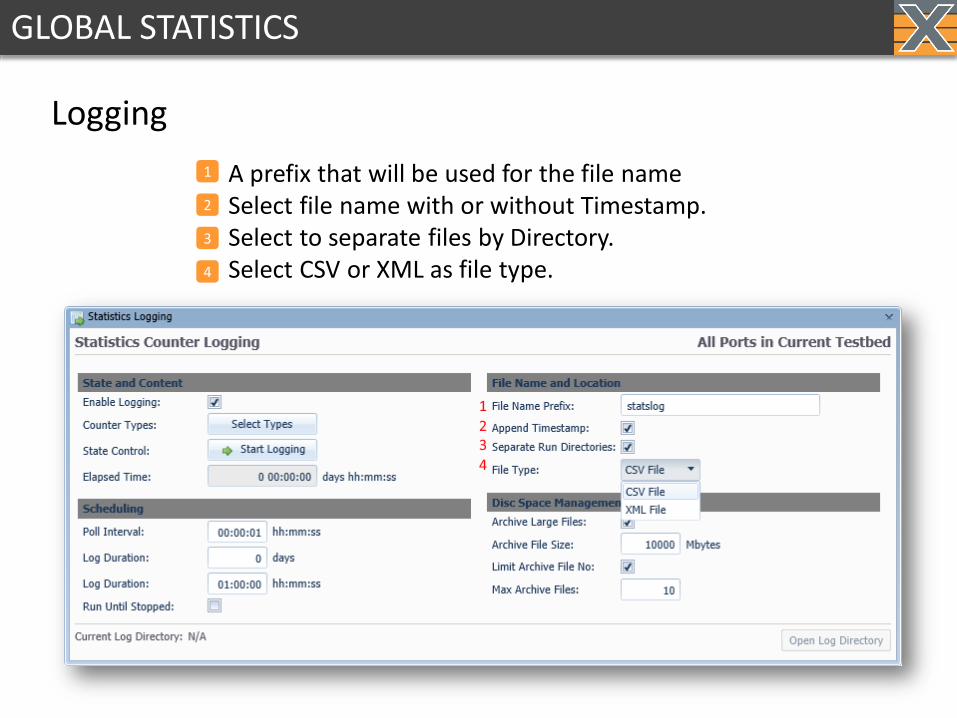
Logging
In order to save results over time and record all results for each second that passes- Enable Counter Logging.
GLOBAL STATISTICS

Logging
Select the counters you want to record:
GLOBAL STATISTICS
Logging
A prefix that will be used for the file nameSelect file name with or without Timestamp.Select to separate files by Directory.Select CSV or XML as file type.
GLOBAL STATISTICS
1
2
3
4

Statistics Charting
GLOBAL STATISTICS
1
2
3

Event LogThe event log may be used observe:
Port link issues (Log port Errors).Packet Loss (Log Packet Errors).Service disruptions (Log Disruptions).
EVENT LOG

You can use the Communication Trace to debug communication between the GUI and the Appliance.
Filters can be used to narrow the search for errors or loss of communication.
COMMUNICATION TRACE

wiki.xenanetworks.com
www.xenanetworks.com/resources/
RESOURCES
WANT MORE INFORMATION?
Wiki:
Website:
Email: