Embed Size (px)
Citation preview

Xenophobia and the Makwerekweres: Immigrant Entrepreneurs in Cape Town’s Informal Economy
Abel Chikanda*, Jonathan Crush** and Godfrey Tawodzera****Geography & Atmospheric Science and African & African-American Studies, University of Kansas
**Balsillie School of International Affairs, Waterloo, Ontario Canada***Geography and Environmental Sciences, University of Limpopo, Polokwane, South Africa
Center for Migration Research Symposium on Race & ImmigrationKansas Union, University of Kansas, 8 April 2016

Outline
South Africa’s Apartheid Past Xenophobia and Immigrants in the Informal
Economy Case Study
Are migrants bad for the economy? Conclusions
South Africa The apartheid past
Racial discrimination policies…. Limited African immigration
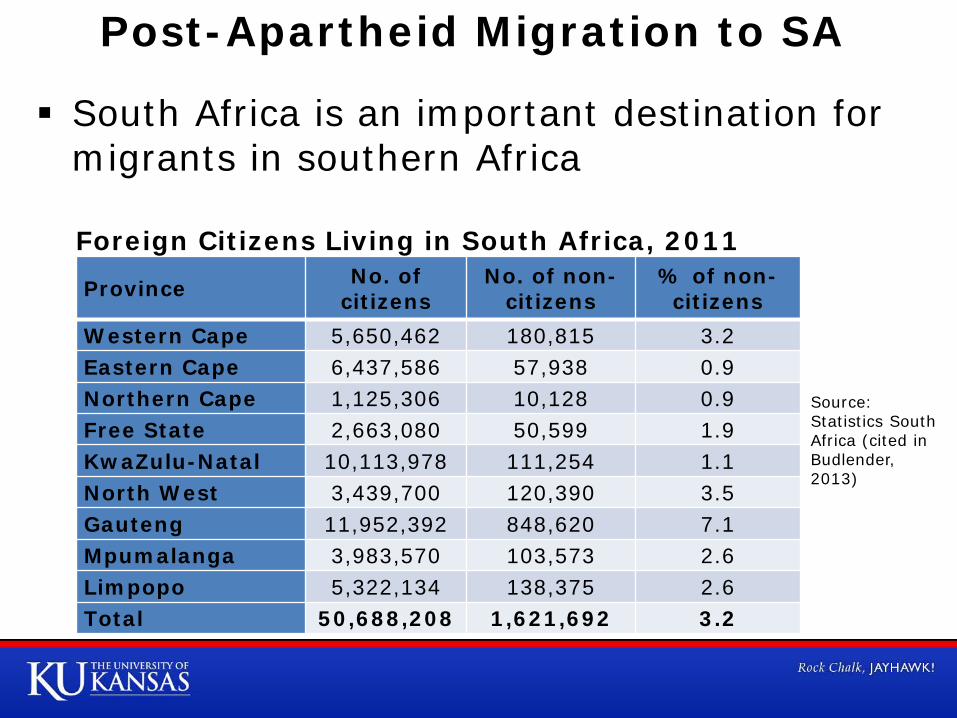
Post-Apartheid Migration to SA
South Africa is an important destination for migrants in southern Africa
Province No. of citizens
No. of non-citizens
% of non-citizens
Western Cape 5,650,462 180,815 3.2Eastern Cape 6,437,586 57,938 0.9Northern Cape 1,125,306 10,128 0.9Free State 2,663,080 50,599 1.9KwaZulu-Natal 10,113,978 111,254 1.1North West 3,439,700 120,390 3.5Gauteng 11,952,392 848,620 7.1Mpumalanga 3,983,570 103,573 2.6Limpopo 5,322,134 138,375 2.6Total 50,688,208 1,621,692 3.2
Foreign Citizens Living in South Africa, 2011
Source: Statistics South Africa (cited in Budlender, 2013)

Foreign Migrants Living in South Africa by Country of Birth and Employment Status (15 years+) vs
South Africans
Source: Budlender, 2013
TotalEmployment
rate (%)Unemployment
rate (%)
Labour force participation rate
(%)Zimbabwe 515,824 66 18 80Mozambique 262,556 58 24 76Lesotho 124,463 51 30 73Malawi 69,544 72 14 84Namibia 29,653 67 10 74Swaziland 27,471 52 22 67India 23,780 64 6 68Zambia 22,833 70 9 76Nigeria 20,983 69 13 79Congo 18,545 52 24 68South Africa 33,017,579 59 21 75
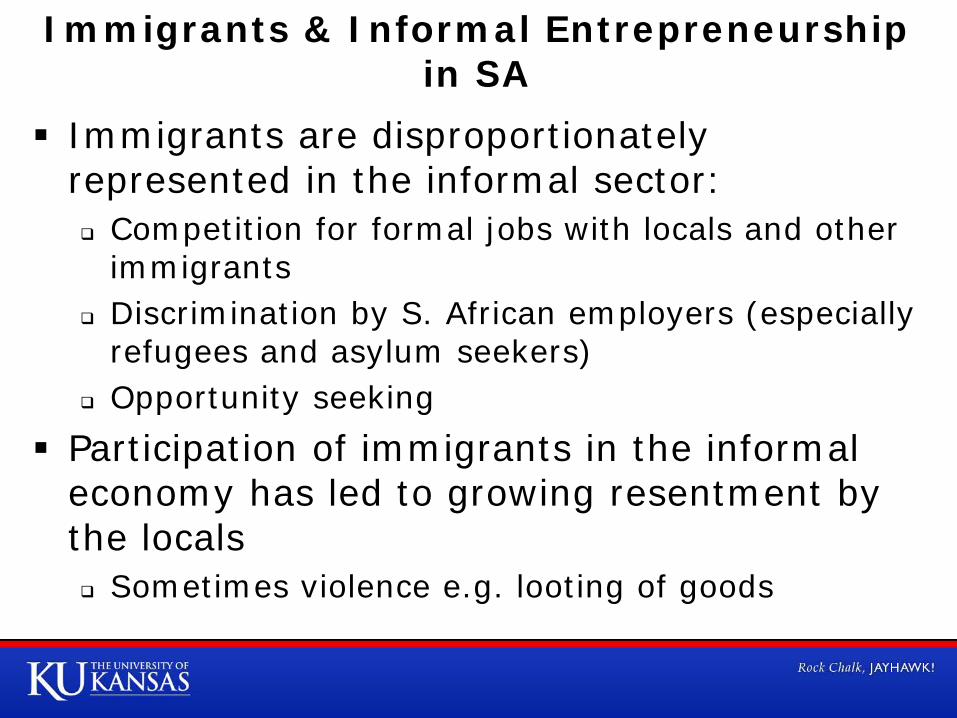
Immigrants are disproportionately represented in the informal sector: Competition for formal jobs with locals and other
immigrants Discrimination by S. African employers (especially
refugees and asylum seekers) Opportunity seeking
Participation of immigrants in the informal economy has led to growing resentment by the locals Sometimes violence e.g. looting of goods
Immigrants & Informal Entrepreneurship in SA

Immigrants & Informal Entrepreneurship in SA

Immigrants & Xenophobia in SA
Attacks on immigrants blamed on Xenophobia: Hatred or fear of foreigners or of what is strange or
foreign Merriam Webster Dictionary
Diverse theories e.g. The isolation hypothesis
Inability to tolerate and accommodate difference Scapegoating hypothesis
Blamed for ongoing deprivation and poverty The bio-cultural hypothesis
Locates xenophobia at the level of visible difference, or otherness, i.e. in terms of physical biological factors and cultural differences exhibited by African foreigners in the country. [language]
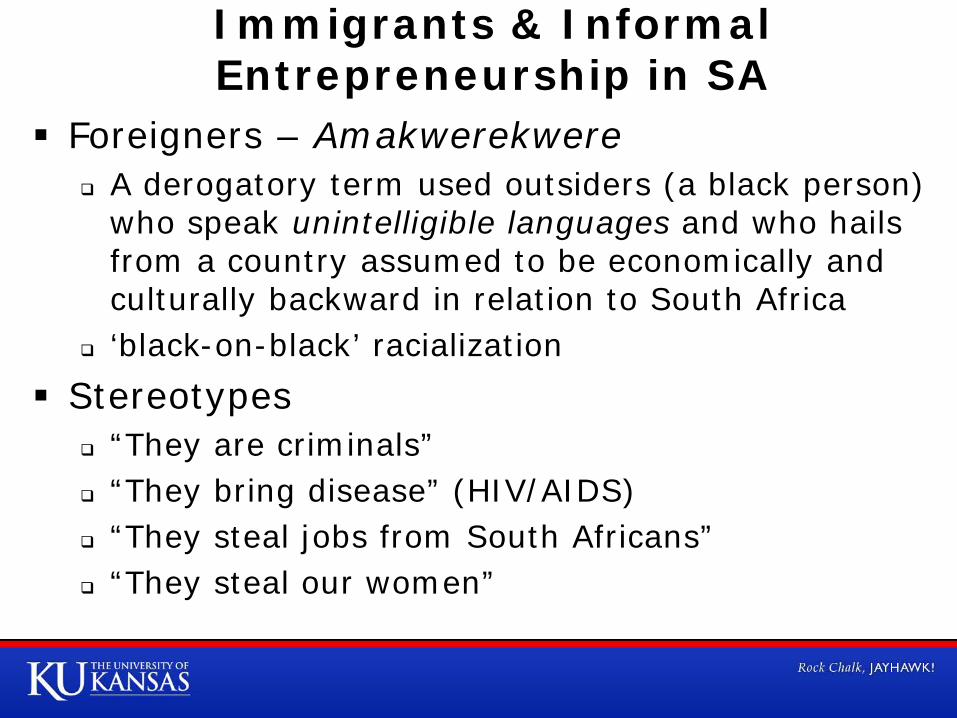
Foreigners – Amakwerekwere A derogatory term used outsiders (a black person)
who speak unintelligible languages and who hails from a country assumed to be economically and culturally backward in relation to South Africa
‘black-on-black’ racialization Stereotypes
“They are criminals” “They bring disease” (HIV/AIDS) “They steal jobs from South Africans” “They steal our women”
Immigrants & Informal Entrepreneurship in SA

From discourse to action: 2008: 62 people, mostly immigrant
entrepreneurs killed in xenophobic violence (necklacing)
Operation Hardstick (April 2012) – SA police in Limpopo Province close down Somali and Ethiopian run businesses regardless of whether they held valid licences
DTI Licensing of Businesses Bill (2013-shelved) –would have made it almost impossible for immigrants to own businesses in SA
Immigrants & Xenophobia in SA
Cape Town: A Case Study
Study was conducted in 2014 by SAMP in Cape Town, an important site of informal migrant enterprise
Study sought to better understand the importance of informal entrepreneurship in Cape Town’s local economy.
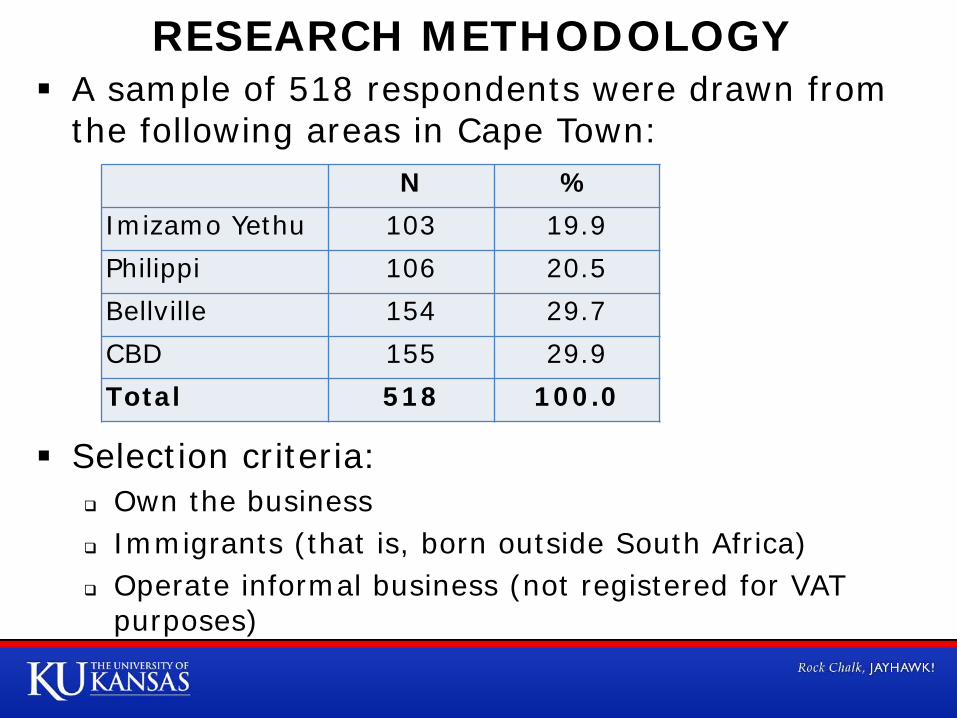
RESEARCH METHODOLOGY A sample of 518 respondents were drawn from
the following areas in Cape Town:
Selection criteria: Own the business Immigrants (that is, born outside South Africa) Operate informal business (not registered for VAT
purposes)
N %Imizamo Yethu 103 19.9Philippi 106 20.5Bellville 154 29.7CBD 155 29.9Total 518 100.0

RESULTS Gender: 72.5% Male, 27.5% Female Race: 97.1% Black, 2.5% Indian, 0.4% Other Age: Mean=34 years; Median=33 years Average age at arrival in South Africa: Mean=26
years; Median=25 yearsSector of employment:
0
10
20
30
40
50
60
70
Retail, Trade andWholesale
Manufacturing Services Other sector
Perc
enta
ge
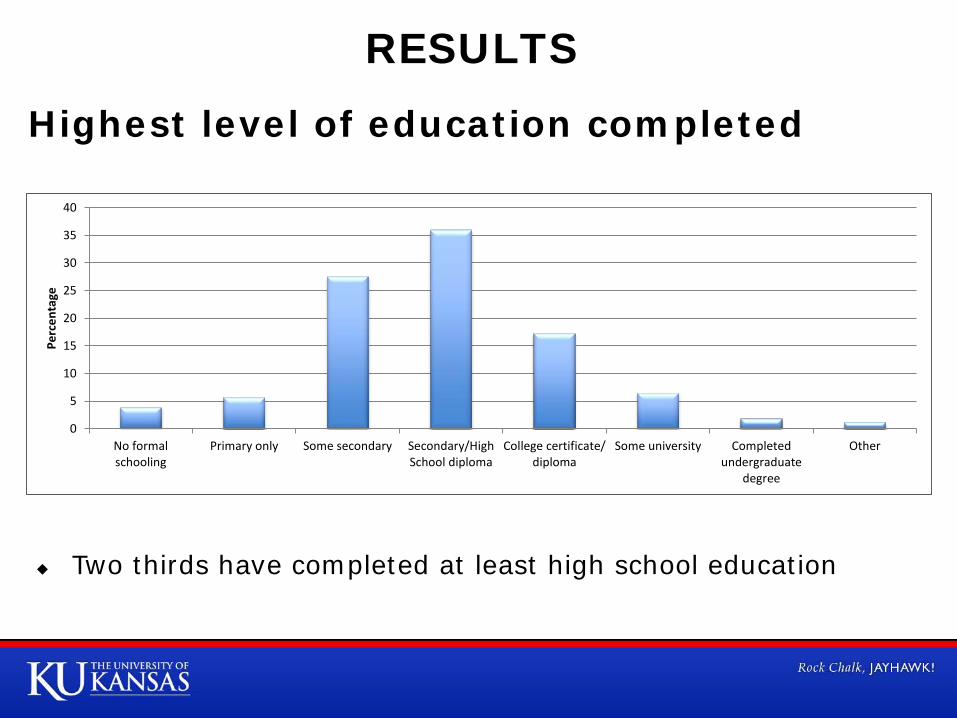
RESULTS
Highest level of education completed
0
5
10
15
20
25
30
35
40
No formalschooling
Primary only Some secondary Secondary/HighSchool diploma
College certificate/diploma
Some university Completedundergraduate
degree
Other
Perc
enta
ge
Two thirds have completed at least high school education
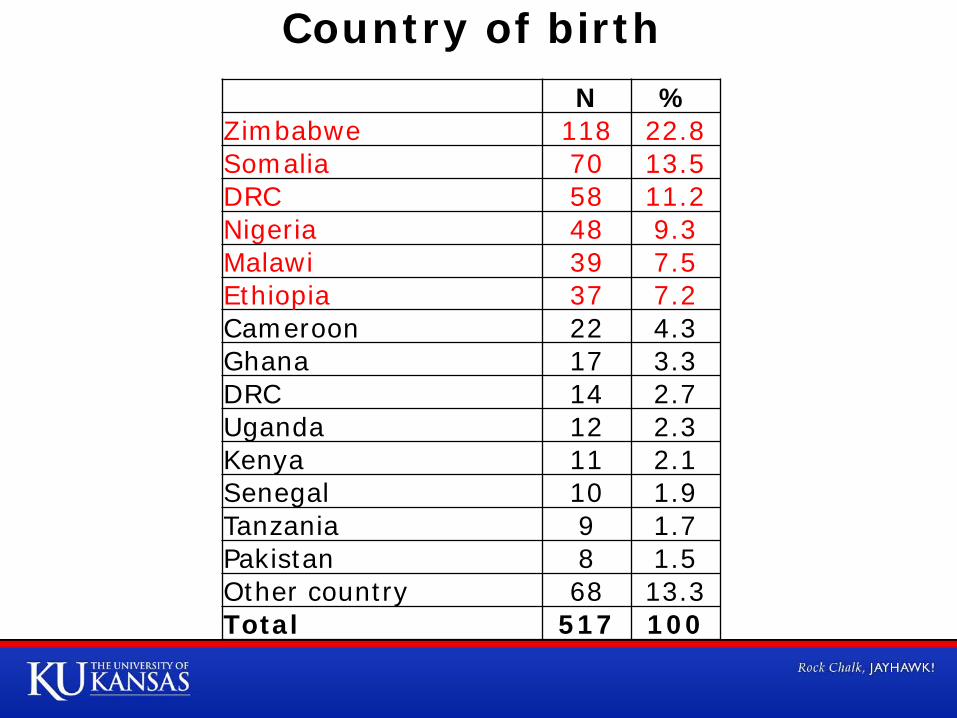
Country of birthN %
Zimbabwe 118 22.8Somalia 70 13.5DRC 58 11.2Nigeria 48 9.3Malawi 39 7.5Ethiopia 37 7.2Cameroon 22 4.3Ghana 17 3.3DRC 14 2.7Uganda 12 2.3Kenya 11 2.1Senegal 10 1.9Tanzania 9 1.7Pakistan 8 1.5Other country 68 13.3Total 517 100

Type of Permit %Refugee permit holder 31.5Asylum-seeker permit holder 30.7Permanent resident of South Africa 11.9
Work permit holder 7.8No official documentation 7.4Visitor's permit holder 5.8Other immigration status 2.3Citizen of South Africa 0.2Refused / No answer 2.4
N=514
Immigration Status in South Africa An overwhelming majority have valid residence
status in South Africa
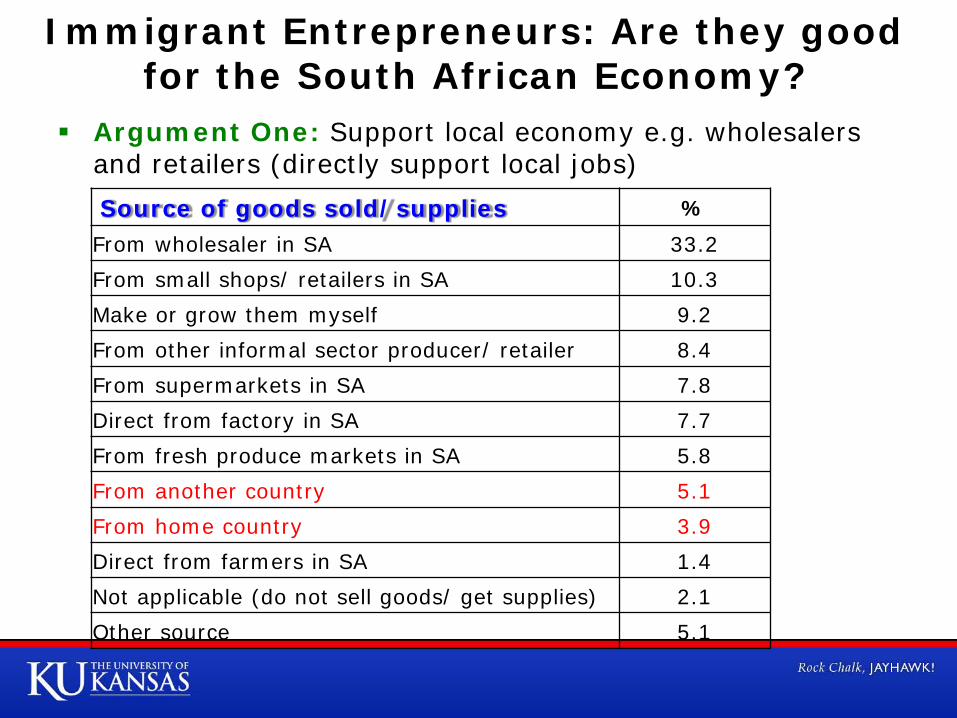
Immigrant Entrepreneurs: Are they good for the South African Economy?
Argument One: Support local economy e.g. wholesalers and retailers (directly support local jobs)Source of goods sold/supplies %
From wholesaler in SA 33.2From small shops/ retailers in SA 10.3Make or grow them myself 9.2From other informal sector producer/ retailer 8.4From supermarkets in SA 7.8Direct from factory in SA 7.7From fresh produce markets in SA 5.8From another country 5.1From home country 3.9Direct from farmers in SA 1.4Not applicable (do not sell goods/ get supplies) 2.1Other source 5.1
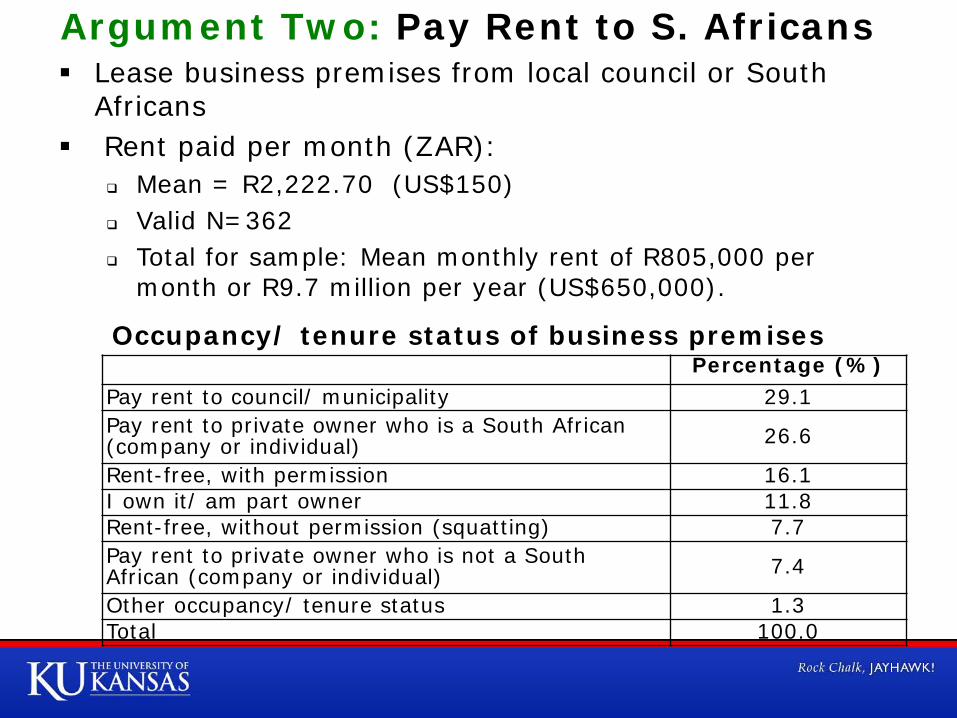
Argument Two: Pay Rent to S. Africans Lease business premises from local council or South
Africans Rent paid per month (ZAR):
Mean = R2,222.70 (US$150) Valid N=362 Total for sample: Mean monthly rent of R805,000 per
month or R9.7 million per year (US$650,000).
Percentage (%)Pay rent to council/ municipality 29.1Pay rent to private owner who is a South African (company or individual) 26.6
Rent-free, with permission 16.1I own it/ am part owner 11.8Rent-free, without permission (squatting) 7.7Pay rent to private owner who is not a South African (company or individual) 7.4
Other occupancy/ tenure status 1.3Total 100.0
Occupancy/ tenure status of business premises

Argument Three: Employment Creation
Employment creation 21.8 per cent employ their own family members in their
business 17.6 per cent employ their own fellow country men who
are not family members. 41.5 per cent of the migrant entrepreneurs employ
South African citizens. 12.5 per cent of the businesses employ migrants from
other countries Migrant entrepreneurs created 644 jobs including family
employment (1.2 jobs per employer) or 496 jobs for non-family.
282 (or 57 per cent) of non-family jobs went to South Africans

Extent to which business has been affected by xenophobia
45% indicated that xenophobia has affected their business ‘a great deal’ or ‘to some extent’
0
5
10
15
20
25
30
35
40
A greatdeal
To someextent
Not verymuch
Not at all Don'tknow
Per
cen
tag
e 45 percent –‘great deal’/ ‘to some extent’

Xenophobia Exposure to xenophobia varies by nationality;
worst among Cameroonians and Somalis and moderate for Zimbabweans
A great deal/ To some extent
Not very much/Not at All
Don't know N
Cameroon 68.2 31.8 0 22Somalia 64.3 34.3 1.4 70DRC 50.0 46.6 3.4 58Ethiopia 48.6 48.7 2.7 37Malawi 43.6 53.8 2.6 39Nigeria 41.7 58.3 0 48Ghana 41.2 58.8 0 17Zimbabwe 30.5 69.5 0 118
Extent to which xenophobia has affected business operations for selected nationalities

CONCLUSION Most of the migrant entrepreneurs have been
forced into informal employment after failing to secure formal jobs
Migrant entrepreneurs have demonstrable positive impacts on the South African economy Create jobs for both South Africans and non-South
Africans Pay rent to the city councils and South African
landlords Migrant entrepreneurs are showing ingenuity to
survive in a competitive and hostile environment Deserve more national and local government
support rather than being viewed as an undesirable feature on the South African landscape
CREDITS
NEW PUBLICATIONS FROM AUTHOR