Embed Size (px)
Citation preview

Xerox: A New Beginning

Introduction and Strategic Overview
Jeff Jacobson

3
The New Xerox – Well Positioned for the Future
Attractive
Business Model
Laser Focus on
Cost and
Productivity
Well Positioned to
Capitalize on
Areas of Growth
Balanced
Shareholder
Return
Significant market opportunity of ~$85B
Bundled contracts model creates “stickiness” with >75% annuity revenue and strong cash flow
Track record of strong cost / productivity discipline
Accelerating productivity through $1.5B+ transformation program
Clear plan to increasing participation in growing market segments
Building a leading Market Platform through our largest ever product launch and
enhancing and expanding our channel reach
Committed to investment grade rating profile
Strong free cash flow1 supports attractive dividend and shareholder returns
A
B
C
D
We are assembling a high performing team with a blend of our strongest current operators, coupled with highly skilled external hires, driven to exceeding expectations
1 Free Cash Flow: see Non-GAAP Financial Measures.

4
Xerox at a Glance
1 FY 2015 revenue on a post-separation basis. Other revenue is included in Document Technology.
Digital Production &
Workflow
Full range of Multi-
Function Printers
ConnectKey
Productivity Solutions
Broad Portfolio
Managed Print
Services
Workflow Automation
Centralized Print
Services
Customers
Large Enterprises
Small & Medium
Businesses
Public Sector
Graphic
Communications
Providers
Go-to-Market and Delivery
Full range of global
capabilities
2,700 direct salesforce
10,000 total
service technicians
600 professional
services staff
5,000 active partners
~160 countries
Document Technology
Document Outsourcing
Revenue1
$3.5B
30%
$8.0B
70%
Revenue Mix
Annuity
Revenue
Equipment
Sales
US
Canada
Europe
Developing
Markets
Shifting to
Services
Over Time
Attractive
Business ModelA
~25%
~75%
~25%
59%
6%
24%
11%

Leading Positions in Large Markets with Opportunities for Growth
$23B
$1B
$23B
$11B
$12B
$5B
$7B
$3B
5
1 Estimated 2016 total market size excluding Fuji Xerox territories. Source: IDC and Xerox internal analysis.2 A3 MFP and Production positioning based on equipment revenue market share.3 As recognized by Buyers Laboratory in 2014, 2015 and 2016.4 Digital packaging is a $0.6B market that is a subset of Production Color.
Note: CAGRs reflect 2016E – 2019E growth. SMB = Small & Medium Business; DO = Document Outsourcing; MFP = Multifunction Printer; MPS = Managed Print Services; LE = Large Enterprise; CPS = Centralized Print Services
~$85B Market1 Strategic Growth Areas
Large Enterprise
DO (MPS & CPS)
Workflow Auto.
SMB MPS
Production
Color
A4 MFPs
A3 MFPs
Single
Function
Printers
Document
Outsourcing$21B
Graphic
Communications
& High-End
Production
$6B
Strengths2
#1 in large enterprise
MPS and Centralized
Print Services
Connected
Office
Solutions
$35B A4 MFPs +3%
#1 in A3 MFPs
Broadest Industry Solutions
Portfolio3
#1 in production cut
sheet
(color & mono)
Production
Color+5%
Digital
Packaging4 +11%
Production
Mono
Ma
rket G
row
th
$3
8B
Gro
wth
Ma
rkets
$4
7B
Ma
ture
Ma
rkets
Managed Print
Services+2%
LE
Workflow
Automation+13%
+7%
SMB
Attractive
Business ModelA

6
Track Record of Strong Margins
$300 – $350MAnnual productivity savings
(last 3 years)
~230 bpsTotal margin expansion
(last 5 years)
Operational ExcellenceStrong, Consistent Margin Improvement1
(Document Technology + Document Outsourcing)
1 Reflects the combined historical segment margins for Document Technology and Document Outsourcing businesses. Including retirement-related
adjustments, margins in 2013, 2014 and 2015 would be 12.6%, 13.9% and 13.2%, respectively.
Laser Focus on
Cost and
Productivity
B
+230 bps
9.8%
10.6%
11.4%11.0%
13.2%
12.1%
2010 2011 2012 2013 2014 2015

2016 2017 Cumulative through2018
Clear Path to Achieving Transformation Program
Supply Chain &
Procurement
Delivery
Cost of
Production
Cumulative Gross Productivity & Cost Savings ($M)
Full transformation benefits recognized in 2018 and beyond, as productivity continues and flow through of new product introductions are realized
7
Sources of Productivity and Cost Savings
Sales & Contracting
G&A
• Integrated supply chain
• Procurement
• MPS delivery
• Technical service
• Remote connectivity
• Manufacturing
• RD&E and design efficiency
• Sales productivity
• Pricing tools
• Real estate
• IT
• Finance
• Management structure
• Facilities
$1,500+
~$200
~$250
~$450
~$300
~$300
~$400+
~$1,100
~$500
Delivery
Cost of
Production
Sales &
Contracting
G&A
Supply Chain &
Procurement
~35% ~75% 100%
% Cumulative Phasing
90%+ already
achieved
Enables margin
expansion and
mitigates
revenue/currency
headwinds
Note: There is approximately $300 to $350M in traditional ongoing productivity included in gross productivity. MPS = Managed Print Services
Laser Focus on
Cost and
Productivity
B

8
Strategy to Improve Revenue Trajectory
Document Outsourcing
Graphic Communications
& High-End Production
Connected Office Solutions
Increase share with strengthened product portfolio and expanded distribution capacity
Gain share in SMB through channel partner recruitment
Increase dedicated new logo sales coverage
Build upon leadership in color cut sheet while investing to capture growth in inkjet
A4 MFPs
Managed Print Services
Workflow Automation
Production Color
Digital Packaging
Invest in professional services offering and grow managed workflow solutions (i.e., industries and horizontals)
Bring extensive digital print & workflow expertise to the market
Well Positioned to Capitalize on Areas of Growth
C
Note: SMB = Small & Medium Business; MFP = Multifunction Printer

63%58% 52%
46%
37% 42% 48%54%
2015 2017 2019 2021
9
Shifting Revenue Mix Towards Growth
Note: CAGRs reflect 2016E – 2019E growth. DO = Document Outsourcing; MFP = Multifunction Printer; MPS = Managed Print Services; SMB = Small & Medium Business
A4 Share Gain with strengthened
portfolio and increased distribution
capacity
Expanding Leadership in DO
with Enterprise strength and
expanding SMB offerings
Increased SMB coverage with
Multi-Brand Dealers and continued
Global Imaging acquisitions
Strategic Growth Areas
Gain Share in Digital
Color Production through
continued innovation and
growth in new markets
Mature Markets• A3 MFPs (5%)
• Centralized Print Services (0%)
• Production Mono (11%)
• Single-Function Printers (8%)
CAGR
Growth Markets• A4 MFPs +3%
• Large Enterprise MPS +2%
• Production Color +5%
• SMB MPS +7%
• Workflow Automation +13%
CAGR
Improves revenue mix ~3 points each year
Revenue Mix Shift
Well Positioned to Capitalize on Areas of Growth
C

10
Proven Growth Model with Distribution Acquisitions
• In 2007, Xerox acquired Global Imaging Systems (GIS), a leading
U.S. distributor of business technology solutions
– GIS companies sell and service a full range of document
management solutions
– Founded in 1994, GIS has expanded by acquiring strong local
multi-brand distributors and now operates across 40 states
• GIS revenue has doubled since being acquired; ~2/3 through
additional acquisitions
• Strong acquisition integration model and business case realization
• Continuing to pursue high quality acquisitions
2006 2009 2012 2015
$1.0B1
$2.0B
Global Imaging Systems Revenue Summary
Well Positioned to Capitalize on Areas of Growth
C
1Revenue is pre-acquisition.
Note: MPS = Managed Print Services
Distribution acquisitions support growth strategies in MPS, A4 and A3

1 Operating Margin and Free Cash Flow: see Non-GAAP Financial Measures.
Balanced
Shareholder
Return
DTarget Financial Model
Revenue Outlook
Operating Margin1
Leverage Profile
Trajectory to outperform market trend
Expanding to 12.5% - 14.5% target
Maintain investment grade rating
Dividend Policy
Capital AllocationStrong return of capital through dividends, share repurchases, strategic
organic investments and targeted M&A
11
Attractive dividend; expected to grow with earnings and free cash flow1

Innovation and Portfolio Strength
Document Outsourcing Opportunity
12
Today’s Discussion
Mike Feldman
President, North America
Jeff Jacobson
Chief Executive OfficerIntroduction and Strategic Overview
Kevin Warren
Chief Commercial Officer
Leslie Varon
Chief Financial OfficerFinancial Overview

Innovation and Portfolio Strength
Kevin Warren

Growing in Graphic Communications
and High-End Production
Four Strategic
Growth Planks
Strengthening our Connected Office
Portfolio
Increasing Participation in SMB and
the Mid-Market
Expanding Market Leadership in
Document Outsourcing
1
4
2
3
14

Major Shifts
in the Office
Workplace
Work is moving from a physical
location to a virtual and multi-
dimensional workplace
Xerox VisionThe Connected and Intelligent Workplace
Mobile access and remote collaboration
Secure interaction to and from the cloud
User experience consistent with consumer devices
Customizable application interface and user profiles
Smart, automated workflow
15

16
Xerox Connected Office for The Intelligent WorkplaceOne family of products and solutions
29 new products
Xerox® ConnectKey® Technology
Aggressive focus on expanded
routes to market with robust portfolio
Unified platform
Mobility MPS ready
Tablet-like interface
Improved cost structure
Secure Workflow
Largest launch in Xerox history coming in 2017
Industry’s largest solutions enabled portfolio
with consistent user experience from the
simplest A4 device to the most robust A3 MFP
Differentiated Xerox Connected Office Portfolio
Note: MPS = Managed Print Services; MFP = Multifunction Printer

17
Strengthening Xerox’s Position in the Connected Office
$23Bmaturing market
-5%CAGR ‘16-19
22%rank # 1
Source: 2016 CSI market forecast, IDC and Internal Xerox estimates. 2015 market share is based on equipment revenue share.
Platform Driven
Portfolio & MPS
Ready Technology
Benchmark Cost
Competitiveness
Newly enabled
Vertical Solutions
and Applications
Channel-ready platform
and expanding SMB
reach
Competitive Differentiators
A3 Multifunction Printers
Market Opportunity Market Growth Xerox Share
$12Bgrowing market
+3%CAGR ‘16-19
6%rank # 9
A4 Multifunction Printers
Market Opportunity Market Growth Xerox Share
Note: MFP = Multifunction Printer; MPS = Managed Print Services; SMB = Small & Medium Business
Gain share in the areas of market growthDefend and expand our leadership

Independent Multi-brand Dealer Market Opportunity
Untapped
Dealer Pool
Total
Dealer PoolPlaybook
~300 dealers with
$5M-$10M rev.
~200 dealers with
>$10M rev.
• Rapid Recruitment
• Continue targeted
acquisitions
• Capture share of
wallet
~2,500 independent
office equipment
dealers across
the country
U.S. Example
Recruit & Activate75%+ of SMB market serviced by indirect channels +
2017 footprint growth engines:
• New and differentiated office portfolio
• Channel Managed Print Services
• Partner-centric infrastructure and
marketing support
• Building channel expertise including
top talent recruitment
Note: SMB = Small & Medium Business18

$34B
(9)%
$10B
7%
$7B
7%
SMB Office Market Size and Growth
Non-ServicesBasic Print
Services
Managed
Print Services
$12B
3%
A4*
Increasing Participation in SMB and the Mid-Market
SMB-focused portfolio and MPS support and
demand generation
Become preferred channel partner through investment
in talent, infrastructure and partner programs
Note: CAGRs reflect 2016E-2019E growth. SMB = Small & Medium Business; MPS = Managed Print Services
Recruit & activate to grow our footprint in multi-brand
dealer channel among the 750 large dealers WW
*A4 is total market including SMB and Large Enterprise
+
Acquire and integrate multi-brand channel via
Global Imaging Systems and European Channels
Source: 2016 CSI market forecast, IDC and Internal Xerox estimates19
Tremendous opportunity to more aggressively target the $20B worldwide multi-brand dealer market

“We chose to engage Xerox for three reasons: the power
of their brand, the breadth of their product line, and their
increasing commitment to the channel approach.”
Lou Usherwood
CEO, Usherwood Office Technology
“As a top tier dealership, we have access to any number of
manufacturers and we wanted to partner with the best, and
Xerox is one of them…We are excited about the product line
and about the potential in the areas where Xerox has done
very well.”
Jim Dotter
President, Virginia Business Systems
• Founded in 1976
• Leading regional provider
in the Northeast
• Services 7,000 clients
across five states
• Founded in 1954
• Leading dealership
• 11 locations in
Eastern Pennsylvania
and Central Virginia
20
Xerox Value
Proposition
Attracts Strong
and Established
Multi-Brand
Dealers

21
Growing in Graphic Communications
& High-End Production Color
Note: CF = Continuous Feed Source: Internal Xerox CSI estimates; Smithers-Pira 2016. 2015 market share is based on equipment revenue share.
Capture new markets
Rialto 900 Roll
to Cut Sheet
Trivor 2400 SED
Continuous Feed
• CF inkjet: capture higher value page migration
• Expanded capabilities: through extensions to Rialto
and Trivor in 2017
• Digital packaging: bring our digital know-how
to the market growing at +11% CAGR
Target Areas for Growth
Leading in color cut sheet
• Continuous innovation: xerographic
and inkjet technologies
• Award-winning color cut sheet: expanded portfolio
with 5 new products in 2017
Brenva™ HD
Inkjet Press
Conversion to digital: only 3% of 50 trillion
pages are digital; conversion and inkjet
technology drive color digital market growth
Color CF Inkjet: attractive with a
$1.7B market and 10% CAGR
$5B +5%CAGR ‘16-19
29%rank # 1 in color documents
Well Positioned for Leadership and Growth
Color Market Opportunity Color Market Growth Xerox Color Share
Capitalize on the Color Digital market growth opportunity
Xerox® iGen®

~$1Bacross Xerox and Fuji Xerox
22
RD&E Spending
>1,500 U.S.Xerox and Fuji Xerox
2015 Patent Awards
World-Classincluding Palo Alto Research Centre
Research Talent
>40%were software, solutions and analytics
2015 Patent Filings
Improving the
productivity of work
High-end digital printing
for documents and beyond
• iGen folding carton
• Inkjet CF
• Cross-media marketing
• Inkjet for packaging
• Direct to object printing
• Managed print services
• Workflow automation
Breakthroughs in digital printing and the intelligent office to drive growth
• Automated workflow discovery
• Predictive analytics
Creating new markets with digital technologies
Printed electronics
Printed smart tags with analytics & real time multimedia
Intelligent assistants Digital workplace Augmented reality
Innovation at Xerox
enables our #1
market share
position for
27 consecutive
quarters
Market Share Source: Xerox Analysis of IDC Data; reflects equipment revenue share.
Note: CF = Continuous Feed

An Example of
Xerox Innovation
More can be viewed during the
Innovation Solutions Exhibit
23

Growing in Graphic Communications
and High-End Production
Four Strategic
Growth Planks
Strengthening our Connected Office
Portfolio
Increasing Participation in SMB and
the Mid-Market
Expanding Market Leadership in
Document Outsourcing
1
4
2
3
24

Document Outsourcing Opportunity
Mike Feldman

Introduction to Document Outsourcing
26
Industry Leader with Unparalleled
Capabilities
#1 Player
in a $21B Market
• Next-generation Managed Print
Services strategy:
• Continuous improvement
Innovative Next
Generation Strategy
Broadest Range of
Solutions
• Workplace Solutions
• Business Process Solutions
• Communications &
Marketing Solutions
• Market share leader
• Considered the industry leader
across major analyst firms
Assess &
Optimize
Secure &
Integrate
Automate
& Simplify

The Most Comprehensive Portfolio for Digital TransformationA
ss
es
sm
en
ts a
nd
Co
ns
ultin
g
Technology
Xerox ConnectKey
Devices
Xerox Production
Devices
Non-Xerox
Devices
Capture and
ECM Software
Production
Workflow Software
Digital Alternatives
Software
Cross-Media
Publishing Software
FreeFlow®
Capabilities
Security | Mobility | Sustainability | Imaging | Creative | Translation | ePublishing
• Document Publishing
• Collateral Management
• Demand Generation
• Product Information Management
• Multichannel Communications
• Business Process & Workflow
Automation
• Document & Data Transaction
Processing
• Transactional Print & Mail
• Digital Mailroom
• Managed Print
• Personal & Office
Productivity
• Content Management
• Records Management
Business Process SolutionsWorkplace Solutions Communications & Marketing Solutions
Healthcare | Education | Government | Banking | Insurance | Manufacturing | Retail | Legal
Xerox Document Outsourcing Solutions
Report
ing
and A
naly
tics
Assessm
ents
and C
onsultin
g
Global Service Delivery
27 Note: ECM = Enterprise Content Management

Expanding Market Leadership in Document Outsourcing
Market Opportunity
Document Outsourcing
24%Next closest competitor at 14%Rated by IDC, Gartner,
Quocirca & Infotrends
#1
Market Size Industry Recognition MPS Market Share Leader
$21B
SMBs
Market Size Growth
MPS $7B +7%
Large Enterprises
Market Size
MPS $6B
CPS $5B
Growth
+2%
flat
$3B
Workflow Automation
Market Size Growth
+13%
28 Source: IDC and Internal Xerox estimates for 2016
Note: CAGRs reflect 2016E – 2019E growth. MPS = Managed Print Services; CPS = Centralized Print Services; SMB = Small & Medium Business

96B+Pages managed annually
~1,800Direct Sales Reps
MPS $6B
CPS $5BLarge Enterprise Market
Customer Base
Strengthening Leadership in Large Enterprise MPS and CPS
• Clear leader in large enterprise with differentiated
solutions and unmatched global delivery capabilities
• Best-in-class sales management process and tools
with sales coverage aligned by industry
• Building our professional services capabilities, with
over 100 dedicated consultants
• Investing in dedicated new business sales coverage
Capturing Large Enterprise GrowthOpportunity
Market Size
Digital
Transformation
Sales Force
8Industries served through
our workflow solutions
29Note: MPS = Managed Print Services; CPS = Centralized Print Services
Source: IDC and Internal Xerox estimates for 2016

Client Security is at the Core of Our Strategy
30
Comprehensive suite of security solutions which
we integrate into our client’s security infrastructure
Info
rmatio
n
Content
Application
Infra
stru
ctu
re
End Point
Network
Secure Device
Access(Xerox Secure Print
Manager Suite
Systems)
Secure Document
Collaboration1
MFP Content
Security1
Xerox Devices(ConnectKey)
Device Settings
Compliance(Print Security Audit
Service)
Digital Repository Security(Content Management Services)
Secure Hosting
Broad Range of CapabilitiesSecurity Approach
1 Currently in pilot phase.
Integration
ServicesTools and
Technology
IT
Policy
Note: MFP = Multifunction Printer

Xerox Wins USDA Contract for Estimated $110M over 10 Years
• Managed Print Services deployment across 3,000+ USDA
sites globally
• Installation of up to 16,000 ConnectKey-enabled secure
printers and multifunction devices
• Ongoing service and support including help desks,
maintenance, analytics and reporting services
Implications for XeroxXerox Solution
31
• All new business to Xerox; competitive A4 product
knock-out
- Leveraged new A4 products, demonstrating new product
competitiveness and innovation
• Clear competitive advantage from Xerox’s unique
portfolio strength and breadth
- Best-in-class security capability
- Customer-specific solutions enabled through
ConnectKey software platform
• Xerox uniquely positioned to support large scope
and scale required by the USDA
Modernized operations
Reduced spending
Simplified infrastructureFreed-up vital IT
resources
Access to detailed
analytics
Improved security
Benefits for the USDA

~1MSMB companies in our
target markets
$7BSMB Market
Growth Enablers
Channel Partners will Drive Xerox Growth in SMB MPS Market
Differentiated Service OfferingsDelivering Growth, Creating Value
Market Size
Served by Partners
Potential Customers
75%of SMB market is
served by indirect
channels
Unparalleled support for partners
Only OEM with vertically integrated tools,
technology, delivery and support
Expanding channel programs
MPS programs to include Office
Equipment Dealer and IT / VAR channels
Broad portfolio
Addresses full spectrum of SMB needs
32 Note: CAGRs reflect 2016E – 2019E growth. MPS = Managed Print Services; BPS = Basic Print Services; SMB = Small & Medium Business;
OEM = Original Equipment Manufacturers; VAR = Value Added Reseller
• New A4 products
• BPS to MPS
conversions
• Security features
Source: IDC and Internal Xerox estimates for 2016

Xerox Equips Partners to Offer a Complete Service to SMB Customers
33

Help knowledge workers
automate and simplify their
personal and office work
experience
Help organizations automate
and simplify key industry
specialized business
processes
Help enterprises automate and
simplify the flow of information
into high volume business
processes
Personal & Office
Productivity
Solutions
Broad Range of Workflow Solutions
34
Workflow Automation is a $3B market expected to grow at 13% annually
Note: CAGR reflects 2016E – 2019E growth.
Assess
and
Optimize
Secure
and
Integrate
• Online and offline content
access across all devices
• Team collaboration tools
(file sharing, edit tracking,
real time work)
• Enabling ad-hoc
workflows
Automate
and
Simplify
Managed Workflow
Services
• Hardcopy and electronic
capture
• Intelligent indexing, data
extraction and processing
• Offsite large volume
scanning
Industry Workflow
Solutions
• Vertical and horizontal
process automation
solutions
• Digitally transforming
business processes
• Mobile and cloud enabled
with process analytics
Customer-Managed Xerox-Managed

Xerox is Well-Positioned to Grow in Document Outsourcing
Attractive market with material
growth opportunities
Leading position in the
market by a substantial margin
Broadest portfolio of solutions,
addressing the full set of
customer and partner needs
Next generation strategy
to capitalize on digital
transformation of businesses
35
Large Enterprises1
• Further enhance go-to-market
• Leverage global delivery capability
• Continue innovating best-in-class
security and workflow solutions
SMBs
• Recruit channel partners
• Broadest portfolio and MPS tool set
• Deploy business development
programs
Workflow Automation
• Develop market leading solutions to
boost efficiency and reduce costs
• Expand professional services offering
• Grow Managed Workflow Solutions,
including personal productivity,
industry and horizontal solutions
Key Focus Areas
Segment
Opportunity
Strategy
$11B / +1% $7B / +7% $3B / +13%
1 Includes $6B MPS market growing at 2% and $5B CPS market that is flat.
Note: CAGR reflects 2016E – 2019E growth. MPS = Managed Print Services; SMB = Small & Medium Business

Financial Overview
Leslie Varon

Strong global brand
#1 share in key segments
Global Market
Leader
Positioned for growth in DO, SMB, A4 and High-End color
Largest ever product launch starting in 2017, supporting channel expansion
Attractive Market
Opportunities
37
Xerox Investment Proposition
Strong free cash flow1
Attractive return to shareholders
Sustainable
Shareholder
Returns
Annuity >75% of revenue
Capital-light business model
Strong Annuity-
Driven Cash Flow
Value creation driven by strong underlying cash flow generation, margin expansion
and improving longer-term revenue trajectory
Consistent, double digit operating margins1
$1.5B+ strategic transformation underway
Disciplined
Operator
Note: DO = Document Outsourcing; SMB = Small & Medium Business
1 Operating Margin and Free Cash Flow: see Non-GAAP Financial Measures.

38
31%
13%40%
16%
59%
6%
24%
11%
Global Leader with a Strong, Diverse Business Profile
$11.5BRevenue
12.7%Operating Margin1
Financial Profile
(FY’15)
Annuity-Based Model
>75% of revenue annuity-based
Strategic Growth Mix
37%Strategic Growth Areas
Offering Mix2
Document
Outsourcing
Entry (A4)Mid-Range (A3)
High-End
Production
Geographic Mix
Canada
Europe
US$1,055M
Operating Cash Flow
Developing
Markets
2015 Fuji Xerox3 revenue $9.9B
1 Operating Margin: see Non-GAAP Financial Measures.2 Excludes Other revenue.3 Fuji Xerox operates in Japan, China, Australia, New Zealand, Vietnam and other areas of the Pacific Rim.

Strong Annuity Driven Business Model
• Signings and install growth drive MIF
and market share
• Historic 5% equipment price declines
comprehended/offset by productivity
• Page volumes – stable decline
• Increasing portion of revenues in
Strategic Growth Areas will improve
revenue trajectory
• Majority of supplies revenue in
bundled contracts
Revenue
>75% annuity;
predictable, recurring revenue
• 3-year Strategic Transformation
program to deliver $1.5B+ in gross
productivity savings, supports:
- Margin expansion
- Modest growth investments
• Annuity streams drive margin;
equipment margin positive (outside
Entry products)
• Transaction currency driven primarily
by Yen/Euro/USD
Profitability
Operating Margin1 12%+
for past 3 years
• Strong, stable annuity revenue drives
cash flow
• Strategic Transformation and modest
growth investments drive improved
profitability and cash flow
• Capital-light business model –
CAPEX less than 2% revenue
• Restructuring and pension impacts
moderate over time
Cash Flow
High visibility to
Free Cash Flow1
39Note: MIF = Machines in Field; CAPEX = Capital Expenditures (including Internal Use Software)
1 Operating Margin and Free Cash Flow: see Non-GAAP Financial Measures.

$1,686
$1,457
2014 2015
$958
2016 Sep YTD
$8,037
2016 Sep YTD
13.3% 12.7% 11.9%
Transaction Currency
1.1 pts (0.1) pts (0.5) pts
$12,679 $11,465
2014 2015
$1,115
$907
2014 2015
Historical Performance
Revenue Operating Profit1 Free Cash Flow1
% Y-o-Y Decline at CC1
(3.7%)(4.6%)(3.9%)
% Operating Margin1 Free Cash Flow1 % Net Income
113% 110% 116%
• Moderating revenue declines
• Strong dollar has pressured revenue
• Q4 cash flow seasonally stronger
• 2016 impacted by higher restructuring
and separation payments
• Q4 operating margin1 seasonally
stronger
• Expect 2016 operating margin1 to be
12% - 12.5%
$446
2016 Sep YTD
40
TranslationCurrency
- pts (5) pts (2) pts
1 Operating Profit and Margin, Constant Currency (CC) and Free Cash Flow: see Non-GAAP Financial Measures.
$M $M $M
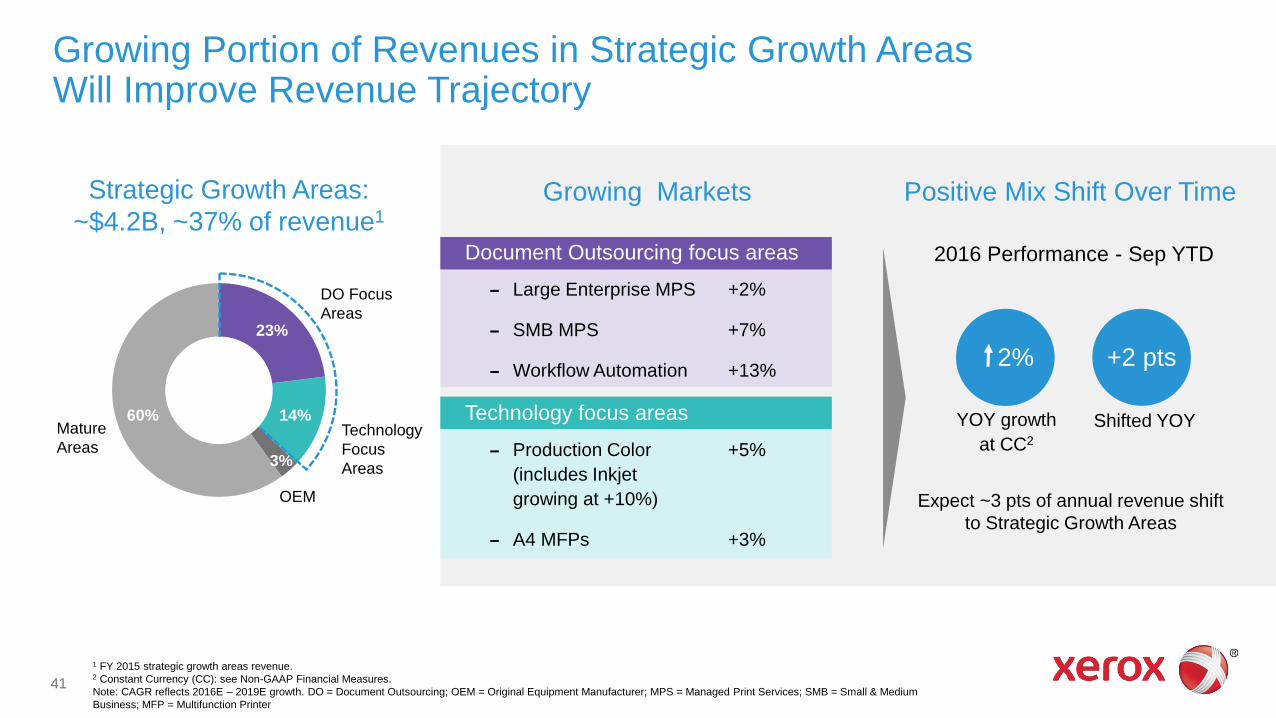
23%
14%
3%
60%
2%
Growing Portion of Revenues in Strategic Growth Areas Will Improve Revenue Trajectory
Document Outsourcing focus areas
Large Enterprise MPS +2%
SMB MPS +7%
Workflow Automation +13%
Technology focus areas
Production Color +5%
(includes Inkjet
growing at +10%)
A4 MFPs +3%
Shifted YOY
+2 pts
2016 Performance - Sep YTD
Growing Markets Positive Mix Shift Over Time
DO Focus
Areas
Mature
AreasTechnology
Focus
Areas
OEM
Strategic Growth Areas:
~$4.2B, ~37% of revenue1
YOY growth
at CC2
Expect ~3 pts of annual revenue shift
to Strategic Growth Areas
41
1 FY 2015 strategic growth areas revenue.2 Constant Currency (CC): see Non-GAAP Financial Measures.
Note: CAGR reflects 2016E – 2019E growth. DO = Document Outsourcing; OEM = Original Equipment Manufacturer; MPS = Managed Print Services; SMB = Small & Medium
Business; MFP = Multifunction Printer

Strategic Transformation Will Drive Profit Growth
Post Sale &
Managed Services
SAG
Equipment
RD&E
4.9
2.9
0.5
2.0
$1.5B+ cumulative gross productivity by 2018
Delivery (~$450M)
Cost of Production (~$250M)
Sales & Contracting (~$300M)
G&A (~$300M)
Supply Chain & Procurement
(~$200M)
Contracting
Discipline
Consolidating MPS delivery and Technical
Service under one organizational structure
Capturing supplier productivity and reducing
manufacturing footprint
Introducing new pricing optimization tools
Reducing complexity / 30% reduction in
management layers
Integrating supply chain under one global
function
Key Productivity Levers~$10B Addressable Cost Base Examples of Initiatives
42 Note: There is approximately $300 to $350M in traditional ongoing productivity included in gross productivity. MPS = Managed Print Services

We Are Off To a Fast Start
Actions to Transform Our Business
• Shifting primary organizational axis to geography (North America, International)
– Maintaining local customer focus while reducing matrix management
• Optimizing sales incentives and performance management
• Consolidating back-office support functions
• Rationalizing real estate portfolio
• Outsourcing consumables distribution to third party
• Combining equipment and parts warehouses
• Benchmarking supplier capabilities, competitiveness and re-bidding/re-contracting
major spend categories
De-layer organization
and streamline back-
office support
Improve supply chain
efficiency and reduce
procurement spend
Objective
Supply
Chain &
Procurement
Delivery
Sales &
Back Office
Improve Field Service and
Managed Print Services
delivery and productivity
• Workflow automation to increase remote solve rates
• Optimizing field resource footprint and tools to ensure more productive on-site
dispatches
• Leveraging existing near/right-shoring initiatives
43

Strategic Transformation Enables Operating Margin1 Expansion
44
12.0%to
12.5%
Transaction currency impact on costs a
variable factor
Measured re-investment of aportion of incremental savings
12.5% to
14.5%
2016 Range Revenue/Pricedeclines
Business as usualproductivity
TransactionCurrency
Incremental CostTransformation
Investments Near Term Target
1 Operating Margin: see Non-GAAP Financial Measures.
Business as Usual
Productivity
Revenue/Price
Declines

$3.9 $3.8
$3.5
$1.5
FY 2015A FY 2016PF
Finance Debt
Core Debt
$1.0
$1.2 $1.2
$1.0
$0.3 $0.3 $0.4
2017 2018 2019 2020 2021 2024 2035 2039
Debt Maturity Ladder
Investment Grade Capital Structure
Illustrative Debt2 ($B)
452 Reflects use of proceeds from Conduent distribution and some cash on hand to repay $2B of debt ($1B term loan and $1B public bonds due Q1 2017).
2015 Actual 2016 Pro Forma
• Manage balance sheet to maintain an investment grade
profile; optimal for business model which includes
customer financing
Majority of pro forma debt supports customer
finance assets (at 7:1 leverage)
Manageable schedule of debt maturities well
matched to financing contract lengths
Core leverage managed to maintain investment
grade rating; incremental debt repayment planned
• Maintain a substantial liquidity position
• Generate significant free cash flow1 in support of capital
deployment objectives
Investment Grade Profile
1 Free Cash Flow: see Non-GAAP Financial Measures.

Attractive Captive Financing Business
Customer Financing is a Business Strength
2016 Pro forma
(in billions)Finance
AssetsDebt
Financing $ 4.3 $ 3.8
Core - 1.5
Total Xerox $ 4.3 ~$ 5.3
Maintain 7:1 debt to equity leverage ratio on our
finance assets
Finance Assets and Debt
• Differentiates and enhances Xerox’s value proposition
• Facilitates customer acquisition of Xerox technology
• Generates profitable revenue
• Enables control of assets
• Focuses on disciplined credit processes to ensure low
bad debt (<2% of finance receivables)
• Creates diverse customer, industry and geographic mix
through global reach and broad product portfolio Pro forma assumes:
• Finance assets/debt as of Q3 2016 with financing
debt calculated as 7/8ths of finance assets
• $2.0B core debt reduction coming from ~$1.8B
Conduent distribution and $0.2B cash on hand
46 Note: Pro forma debt reflects the transfer of Conduent capital lease obligations of $50M.
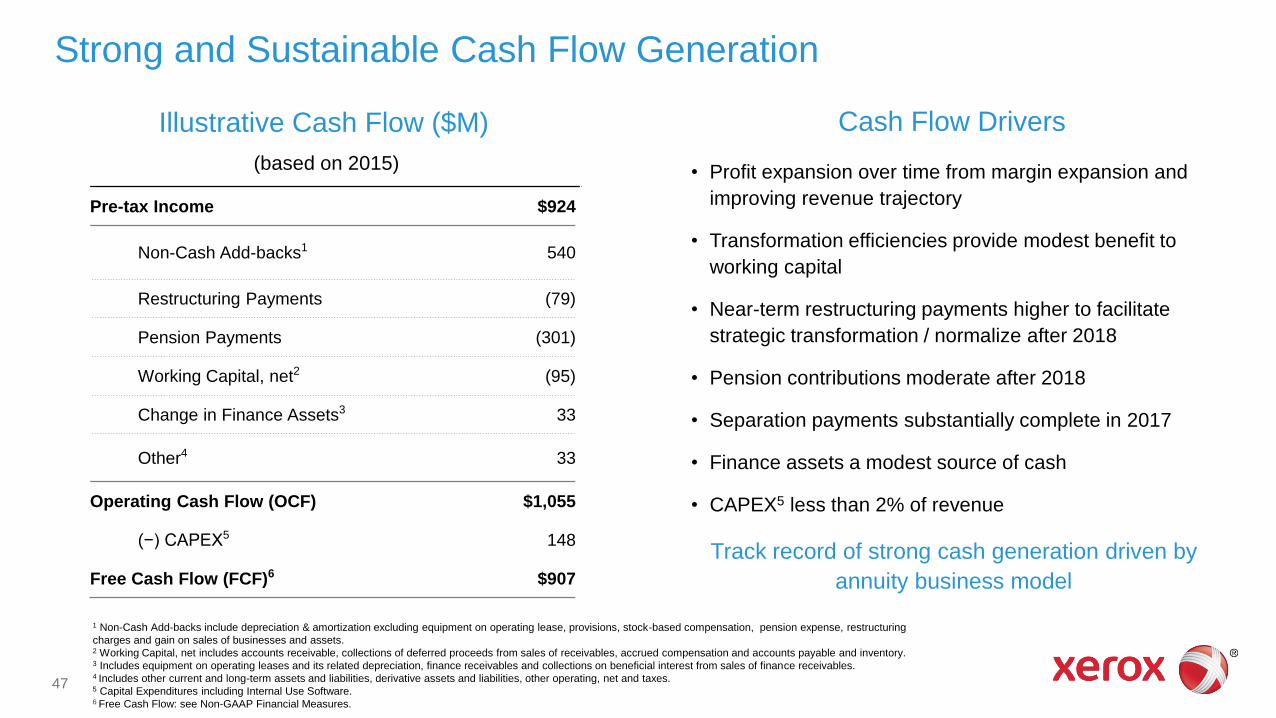
Strong and Sustainable Cash Flow Generation
• Profit expansion over time from margin expansion and
improving revenue trajectory
• Transformation efficiencies provide modest benefit to
working capital
• Near-term restructuring payments higher to facilitate
strategic transformation / normalize after 2018
• Pension contributions moderate after 2018
• Separation payments substantially complete in 2017
• Finance assets a modest source of cash
• CAPEX5 less than 2% of revenue
Illustrative Cash Flow ($M) Cash Flow Drivers
Pre-tax Income $924
Non-Cash Add-backs1 540
Restructuring Payments (79)
Pension Payments (301)
Working Capital, net2 (95)
Change in Finance Assets3 33
Other4 33
Operating Cash Flow (OCF) $1,055
(−) CAPEX5 148
Free Cash Flow (FCF)6 $907
(based on 2015)
Track record of strong cash generation driven by
annuity business model
47
1 Non-Cash Add-backs include depreciation & amortization excluding equipment on operating lease, provisions, stock-based compensation, pension expense, restructuring
charges and gain on sales of businesses and assets.2 Working Capital, net includes accounts receivable, collections of deferred proceeds from sales of receivables, accrued compensation and accounts payable and inventory.3 Includes equipment on operating leases and its related depreciation, finance receivables and collections on beneficial interest from sales of finance receivables.4 Includes other current and long-term assets and liabilities, derivative assets and liabilities, other operating, net and taxes.5 Capital Expenditures including Internal Use Software.6 Free Cash Flow: see Non-GAAP Financial Measures.

Capital Allocation Priorities
Leverage Committed to maintaining investment grade credit rating
Return of
Capital
Initial dividend of $0.25 per share on an annualized basis
Modest share repurchase (after 2017) based on relative returns evaluation
Targeted
Investments
Continue capital-light business model with targeted CAPEX1 (less than 2% of revenue)
Selectively pursue M&A in targeted growth areas to improve portfolio mix and drive profit expansion
Target >50% of Free Cash Flow2 returned through dividends and share repurchases over time
48
We will apply a disciplined return on investment approach when deploying our cash flow
1 Capital Expenditures including Internal Use Software.2 Free Cash Flow: see Non-GAAP Financial Measures.

Xerox has a track record of attractive and increasing dividends
– 16% CAGR over last 4 years
Xerox Dividend Policy
49
Post-split dividend of 6.25 cents per share ($0.25 annualized) is anticipated beginning with the
dividend payable April 2017
Expect future dividend increases driven by EPS and free cash flow1 growth
Committed to a strong dividend policy supported by our annuity driven cash flow
1 Free Cash Flow: see Non-GAAP Financial Measures
.

Note: Operating margin assumes neutral transaction currency in 2018 and 2019. Normalized operating cash flow assumes ~$100M restructuring payments and ~$250M pension contributions.
2018 2019+2017
Revenue
Trajectory
(at CC1)
Improves driven by new
products & Strategic
Growth Areas
acceleration
In-line with 2016,
equipment revenue
begins to improve in 2H
from product launches
Future Performance Expectations
Continued strong and expandingModest expansion
from 2016
Operating
Margin1
Sustained improvement
driven by new products
and Strategic Growth
Areas
50 1 Constant Currency (CC) and Operating Margin: see Non-GAAP Financial Measures.
Operating
Cash FlowReturn to normalized operating cash flow of $900M+ by 2019

Strong global brand
#1 share in key segments
Global Market
Leader
Positioned for growth in DO, SMB, A4 and High-End color
Largest ever product launch starting in 2017, supporting channel expansion
Attractive Market
Opportunities
51
Xerox Investment Proposition
Strong free cash flow1
Attractive return to shareholders
Sustainable
Shareholder
Returns
Annuity >75% of revenue
Capital-light business model
Strong Annuity-
Driven Cash Flow
Value creation driven by strong underlying cash flow generation, margin expansion
and improving longer-term revenue trajectory
Consistent, double digit operating margins1
$1.5B+ strategic transformation underway
Disciplined
Operator
Note: DO = Document Outsourcing; SMB = Small & Medium Business
1 Operating Margin and Free Cash Flow: see Non-GAAP Financial Measures.

Q&A Session
Jeff JacobsonKevin WarrenMike FeldmanLeslie Varon

53
The New Xerox – Well Positioned for the Future
Attractive
Business Model
Laser Focus on
Cost and
Productivity
Well Positioned to
Capitalize on
Areas of Growth
Balanced
Shareholder
Return
Significant market opportunity of ~$85B
Bundled contracts model creates “stickiness” with >75% annuity revenue and strong cash flow
Track record of strong cost / productivity discipline
Accelerating productivity through $1.5B+ transformation program
Clear plan to increasing participation in growing market segments
Building a leading Market Platform through our largest ever product launch and
enhancing and expanding our channel reach
Committed to investment grade rating profile
Strong free cash flow1 supports attractive dividend and shareholder returns
We are assembling a high performing team with a blend of our strongest current operators, coupled with highly skilled external hires, driven to exceeding expectations
1 Free Cash Flow: see Non-GAAP Financial Measures.

Xerox: A New Beginning

Non-GAAP Financial Measures

“Operating Income/Margin”: We calculate and utilize operating income and margin earnings measures by adjusting our pre-tax income and margin amounts to include equity in net income of unconsolidated affiliates and exclude the items noted below:
Non-service retirement related costs: Our defined benefit pension and retiree health costs include several elements impacted by changes in plan assets and obligations that are primarily driven by changes in the debt and equity markets as well as those that are predominantly legacy in nature and related to employees who are no longer providing service to the Company (e.g. retirees and ex-employees). These elements include (i) interest cost, (ii) expected return on plan assets, (iii) amortized actuarial gains/losses and (iv) the impacts of any plan settlements/curtailments. Accordingly, we consider these elements of our periodic retirement plan costs to be outside the operational performance of the business or legacy costs and not necessarily indicative of current or future cash flow requirements. Adjusted operating income/margin will continue to include the elements of our retirement costs related to current employee service (service cost and amortization of prior service cost) as well as the cost of our defined contribution plans.
Restructuring and related costs: Restructuring and related costs include restructuring and asset impairment charges as well as costs associated with our Strategic Transformation program beyond those normally included in restructuring and asset impairment charges. Restructuring consists of costs primarily related to severance and benefits paid to employees pursuant to formal restructuring and workforce reduction plans. Asset impairment includes costs incurred for those assets sold, abandoned or made obsolete as a result of our restructuring actions, exiting from a business or other strategic business changes. Additional costs for our Strategic Transformation program are primarily related to the implementation of strategic actions and initiatives and include third-party professional service costs as well as one-time incremental costs. All of these costs can vary significantly in terms of amount and frequency based on the nature of the actions as well as the changing needs of the business. Accordingly, due to that significant variability, we will exclude these charges since we do not believe they provide meaningful insight into our current or past operating performance nor do we believe they are reflective of our expected future operating expenses as such charges are expected to yield future benefits and savings with respect to our operational performance.
Amortization of intangible assets: The amortization of intangible assets is driven by our acquisition activity which can vary in size, nature and timing as compared to other companies within our industry and from period to period. The use of intangible assets contributed to our revenues earned during the periods presented and will contribute to our future period revenues as well. Amortization of intangible assets will recur in future periods.
Separation costs: Separation costs are expenses incurred in connection with Xerox's expected separation into two independent, publicly traded companies. Separation costs are primarily for third-party investment banking, accounting, legal, consulting and other similar types of services related to the separation transaction as well as costs associated with the operational separation of the two companies, such as those related to human resources, brand management, real estate and information management to the extent not capitalized. Separation costs also include the costs associated with bonuses and restricted stock grants awarded to employees for retention through the separation as well as incremental income tax expense related to the reorganization of legal entities and operations in order to effect the legal separation of the Company. These costs are incremental to normal operating charges and are being incurred solely as a result of the separation transaction. Accordingly, we are excluding these expenses from our adjusted earnings measures in order to evaluate our performance on a comparable basis.
Other expense, net: Other expenses, net is primarily comprised of non-financing interest expense and also includes certain other non-operating costs and expenses. We exclude these amounts in order to evaluate our current and past operating performance and to better understand the expected future trends in our business.
As noted, Operating Income/Margin also includes equity in net income of unconsolidated affiliates. Equity in net income of affiliates primarily reflects our 25% share of Fuji Xerox net income. We include this amount in our measure of operating income and margin as Fuji Xerox is our primary intermediary to the Asia/Pacific market for the distribution of Xerox products and services.
Non-GAAP Financial Measures
56

“Constant Currency”: To better understand trends in our business, we believe that it is helpful to adjust revenue to exclude the impact of changes in the translation of foreign currencies into U.S. dollars. We refer to this adjusted revenue as “constant currency.” In 2016 we revised our calculation of the currency impact on revenue growth, or constant currency revenue growth, to include the currency impacts from the developing market countries (Latin America, Brazil, Middle East, India, Eurasia and Central-Eastern Europe), which had been previously excluded from the calculation. As a result of economic changes in these markets over the past few years, we currently manage our exchange risk in our developing market countries in a similar manner to the exchange risk in our developed market countries, and therefore, the exclusion of the developing market countries from the calculation of the currency effect is no longer warranted. Management believes the constant currency measure provides investors an additional perspective on revenue trends. Currency impact can be determined as the difference between actual growth rates and constant currency growth rates.
“Free Cash Flow”: To better understand trends in our business, we believe that it is helpful to adjust cash flows from continuing operations to exclude amounts for capital expenditures including internal use software. Management believes this measure gives investors an additional perspective on cash flow from operating activities in excess of amounts required for reinvestment. It provides a measure of our ability to fund acquisitions, dividends and share repurchase. It is also used to measure our yield on market capitalization.
Management believes that all of these non-GAAP financial measures provide an additional means of analyzing the current period’s results against the corresponding prior period’s results. However, these non-GAAP financial measures should be viewed in addition to, and not as a substitute for, the Company’s reported results prepared in accordance with GAAP. Our non-GAAP financial measures are not meant to be considered in isolation or as a substitute for comparable GAAP measures and should be read only in conjunction with our consolidated financial statements prepared in accordance with GAAP. Our management regularly uses our supplemental non-GAAP financial measures internally to understand, manage and evaluate our business and make operating decisions. These non-GAAP measures are among the primary factors management uses in planning for and forecasting future periods. Compensation of our executives is based in part on the performance of our business based on these non-GAAP measures.
A reconciliation of these non-GAAP financial measures and the most directly comparable measures calculated and presented in accordance with GAAP are set forth on the following slides.
Non-GAAP Financial Measures
57

Non-GAAP Financial Measures
58
Segment / Margin Pro Forma Reconciliation:
Year Ended Year Ended Year Ended Nine Months Ended
December 31, 2013 December 31, 2014 December 31, 2015 September 30, 2016
(in millions) Revenue Profit Margin Revenue Profit Margin Revenue Profit Margin Revenue Profit Margin
Document Technology Reported $ 8,908 $ 964 10.8% $ 8,358 $ 1,149 13.7% $ 7,365 $ 879 11.9% $ 5,017 $ 601 12.0%
Adjustments:
Document Outsourcing 3,318 377 3,366 396 3,265 411 2,423 300
Document Technology and Document Outsourcing $ 12,226 $ 1,341 11.0% $ 11,724 $ 1,545 13.2% $ 10,630 $ 1,290 12.1% $ 7,440 $ 901 12.1%
Non-service retirement-related costs - 203 - 79 - 116 - 112
Adjusted Pro Forma Basis $ 12,226 $ 1,544 12.6% $ 11,724 $ 1,624 13.9% $ 10,630 $ 1,406 13.2% $ 7,440 $ 1,013 13.6%
Year Ended Year Ended Year Ended
December 31, 2010 December 31, 2011 December 31, 2012
(in millions) Revenue Profit Margin Revenue Profit Margin Revenue Profit Margin
Document Technology Reported $ 10,349 $ 1,085 10.5% $ 10,259 $ 1,140 11.1% $ 9,462 $ 1,065 11.3%
Adjustment:
Document Outsourcing 3,297 256 3,584 331 3,210 375
Document Technology and Document Outsourcing $ 13,646 $ 1,341 9.8% $ 13,843 $ 1,471 10.6% $ 12,672 $ 1,440 11.4%

Non-GAAP Financial Measures
59
Operating Income / Margin Reconciliation:
Year Ended Year Ended Nine Months Ended
December 31, 2014 December 31, 2015 September 30, 2016
(in millions)
Pre-tax
Income Revenue Margin
Pre-tax
Income Revenue Margin
Pre-tax
Income Revenue Margin
Reported(1) $ 1,090 $ 12,679 8.6% $ 924 $ 11,465 8.1% $ 348 $ 8,037 4.3%
Adjustments:
Non-service retirement-related costs 79 116 112
Restructuring and related costs - Xerox 106 27 172
Amortization of intangible assets 65 60 44
Separation costs - - 41
Equity in net income of unconsolidated affiliates 160 135 98
Other expenses, net 186 195 143
Adjusted Operating Income / Margin $ 1,686 $ 12,679 13.3% $ 1,457 $ 11,465 12.7% $ 958 $ 8,037 11.9%
_______________
(1) Xerox post separation pre-tax income and revenue from continuing operations.

Non-GAAP Financial Measures
60
Free Cash Flow
Year Ended Year Ended Nine Months Ended
(in millions) December 31, 2014 December 31, 2015 September 30, 2016
Cash Flow from Operations(1) $ 1,291 $ 1,055 $ 545
Less: CAPEX (includes internal use software) (176) (148) (99)
Free Cash Flow $ 1,115 $ 907 $ 446
_______________
(1) Xerox post separation cash flow from continuing operations.
Forward Looking Statement
61
This presentation contains “forward-looking statements” as defined in the Private Securities Litigation Reform Act of 1995. The words “anticipate,” “believe,” “estimate,” “expect,” “intend,” “will,” “should” and similar expressions, as they relate to us, are intended to identify forward-looking statements. These statements reflect management’s current beliefs, assumptions and expectations, including with respect to the proposed separation of the Business Process Outsourcing ("BPO") business from the Document Technology and Document Outsourcing business, the expected timetable for completing the separation, the future financial and operating performance of each business, the strategic and competitive advantages of each business, future opportunities for each business and the expected amount of cost reductions that may be realized in the cost transformation program, and are subject to a number of factors that may cause actual results to differ materially. Such factors include but are not limited to: changes in economic conditions, political conditions, trade protection measures, licensing requirements and tax matters in the United States and in the foreign countries in which we do business; changes in foreign currency exchange rates; our ability to successfully develop new products, technologies and service offerings and to protect our intellectual property rights; the risk that multi-year contracts with governmental entities could be terminated prior to the end of the contract term and that civil or criminal penalties and administrative sanctions could be imposed on us if we fail to comply with the terms of such contracts and applicable law; the risk that our bids do not accurately estimate the resources and costs required to implement and service very complex, multi-year governmental and commercial contracts, often in advance of the final determination of the full scope and design of such contracts or as a result of the scope of such contracts being changed during the life of such contracts; the risk that subcontractors, software vendors and utility and network providers will not perform in a timely, quality manner; service interruptions; actions of competitors and our ability to promptly and effectively react to changing technologies and customer expectations; our ability to obtain adequate pricing for our products and services and to maintain and improve cost efficiency of operations, including savings from restructuring actions and the relocation of our service delivery centers; the risk that individually identifiable information of customers, clients and employees could be inadvertently disclosed or disclosed as a result of a breach of our security systems; the risk in the hiring and retention of qualified personnel; the risk that unexpected costs will be incurred; our ability to recover capital investments; the risk that our Services business could be adversely affected if we are unsuccessful in managing the start-up of new contracts; the collectability of our receivables for unbilled services associated with very large, multi-year contracts; reliance on third parties, including subcontractors, for manufacturing of products and provision of services; our ability to expand equipment placements; interest rates, cost of borrowing and access to credit markets; the risk that our products may not comply with applicable worldwide regulatory requirements, particularly environmental regulations and directives; the outcome of litigation and regulatory proceedings to which we may be a party; the possibility that the proposed separation of the BPO business from the Document Technology and Document Outsourcing business will not be consummated within the anticipated time period or at all, including as the result of regulatory, market or other factors; the potential for disruption to our business in connection with the proposed separation; the potential that BPO and Document Technology and Document Outsourcing do not realize all of the expected benefits of the separation; and other factors that are set forth in the “Risk Factors” section, the “Legal Proceedings” section, the “Management’s Discussion and Analysis of Financial Condition and Results of Operations” section and other sections of our Quarterly Reports on Form 10-Q for the quarters ended March 31, 2016, June 30, 2016 and September 30, 2016 and our 2015 Annual Report on Form 10-K filed with the Securities and Exchange Commission (“SEC”). Such factors also include, but are not limited to, the factors that are set forth in the “Risk Factors” section, the “Legal Proceedings” section and other sections of the Conduent Incorporated Form 10 Registration Statement, as amended, filed with the SEC. Xerox assumes no obligation to update any forward-looking statements as a result of new information or future events or developments, except as required by law.
The Xerox financial information provided in these slides are preliminary estimates of Xerox’s continuing operations financial results post the classification of Conduent Incorporated as a discontinued operation upon its separation as of December 31, 2016. See Appendix XX for a reconciliation of these amounts to Xerox reported results.

© 2016 Xerox Corporation. All rights reserved. XEROX® and XEROX and Design® are trademarks of Xerox Corporation in the U.S. and/or other countries.