Embed Size (px)
Citation preview

Yan, Khambhati, Liu and Lee 1
Neural dynamics of image representation in the primary visual cortex
Xiaogang Yan†, Ankit Khambhati†, Lei Liu† and Tai Sing Lee†,∗
Center for the Neural Basis of Cognition †
and Computer Science Department∗Carnegie Mellon University, Pittsburgh, PA 15213, U.S.A.
Address for correspondence:
Tai Sing LeeRm 115, Mellon InstituteCarnegie Mellon University4400 Fifth Avenue, Pittsburgh, PA 15238.(412) 268 1060.(412) 268 [email protected]
Running head:Image Representation in V1
Key words:Color tuning, multiplicative gain, feedback, boundary, surface, figure-ground, con-textual modulation, response latency, color filling-in.
Acknowledgement:This research is supported by NSF and NIH. We thank Ryan Kelly, Jason Samonds,Matt Smith for helpful comments and technical assistance. A protocol coveringthese studies was approved by the Institutional Animal Care and Use Committeeof Carnegie Mellon University, in accord with Public Health Service guidelines forthe care and use of laboratory animals.

Yan, Khambhati, Liu and Lee 2
Abstract
Horizontal connections in the primary visual cortex have been hypoth-esized to play a number of computational roles: association field forcontour completion, surface interpolation, surround suppression, andsaliency computation. Here, we argue that horizontal connections mightalso serve a critical role of computing the appropriate codes for imagerepresentation. That the early visual cortex or V1 explicitly representsthe image we perceive is a common assumption on computational theo-ries of efficient coding (Olshausen and Field 1996). However, a number ofrecent fMRI and neurophysiological studies cast doubt on the neural va-lidity of such an isomorphic representation (Cornelissen et al. 2006, vonder Heydt et al. 2003). In this study, we investigated, neurophysiologi-cally, how V1 neurons respond to uniform color surfaces and show thatspiking activities of neurons can be decomposed into three components:a bottom-up input, an articulation of color tuning and a contextual mod-ulation signal that is inversely proportional to the distance away from thebounding contrast border. We demonstrate through computational sim-ulations that the behaviors of a model for image representation are notinconsistent with our neural observations. We conclude that the hypoth-esis of isomorphic representation of images in V1 remains viable and thishypothesis suggests an additional new interpretation of the functionalroles of horizontal connections in the primary visual cortex.
Introduction
When viewing a figure of solid color or brightness as Figure 1A, we perceive a coloror luminance surface. Yet, neurons in the retina and the LGN are mostly excitedby chromatic and luminance contrast borders. The earliest theoretical explanationof this perception is advanced by the Retinex Theory (Land 1971), which argues thatthere is a process for recovering reflectance or perceived lightness within a regionbased on contrast signals provided by the retinal neurons. This model was imple-mented in 2D by Horn (1974) using an iterative algorithm with neighboring unitspropagating brightness measure from contrast borders. Subsequently, Grossbergand Mingolla (1985) proposed the so-called feature contour system/boundary con-tour system model for V1 in which they described propagating brightness and colorsignals from the luminance and chromatic contrast borders to the interior of the sur-face with a diffusion-like process via a synctium in the brightness and color channelsrespectively.
Neurophysiological evidence for isomorphic representation, particularly in the con-text of color and brightness representations have become controversial recently. While
Yan, Khambhati, Liu and Lee 3
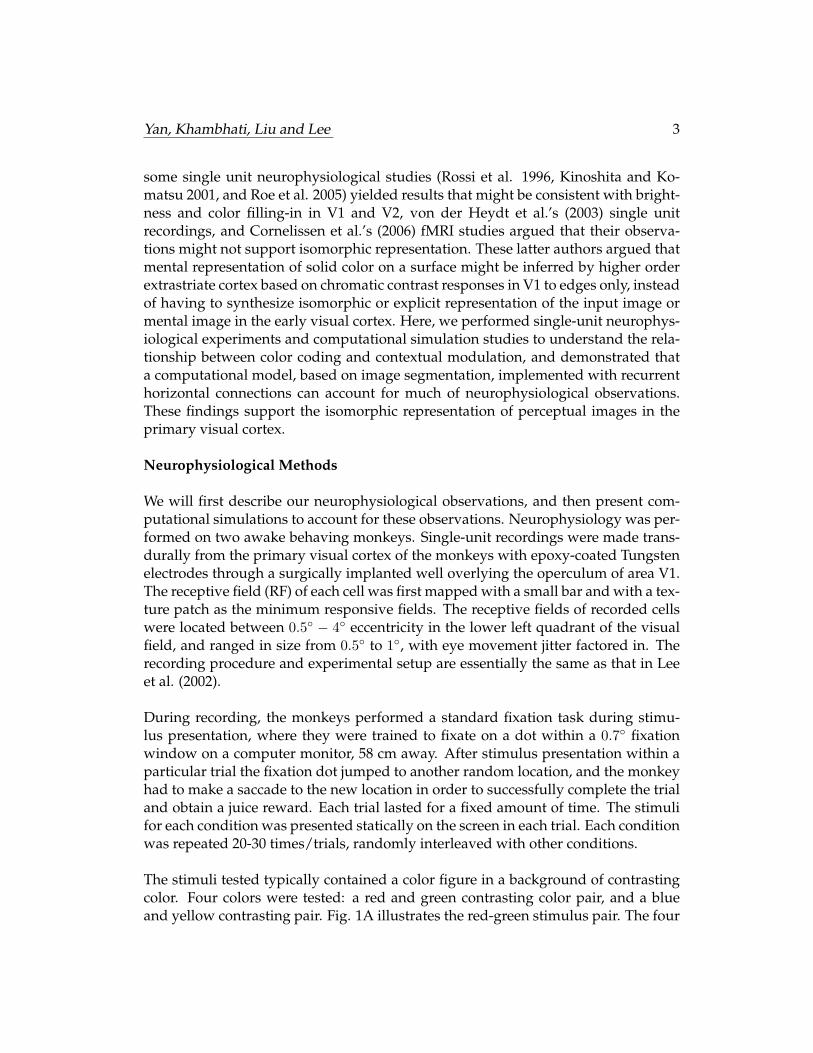
some single unit neurophysiological studies (Rossi et al. 1996, Kinoshita and Ko-matsu 2001, and Roe et al. 2005) yielded results that might be consistent with bright-ness and color filling-in in V1 and V2, von der Heydt et al.’s (2003) single unitrecordings, and Cornelissen et al.’s (2006) fMRI studies argued that their observa-tions might not support isomorphic representation. These latter authors argued thatmental representation of solid color on a surface might be inferred by higher orderextrastriate cortex based on chromatic contrast responses in V1 to edges only, insteadof having to synthesize isomorphic or explicit representation of the input image ormental image in the early visual cortex. Here, we performed single-unit neurophys-iological experiments and computational simulation studies to understand the rela-tionship between color coding and contextual modulation, and demonstrated thata computational model, based on image segmentation, implemented with recurrenthorizontal connections can account for much of neurophysiological observations.These findings support the isomorphic representation of perceptual images in theprimary visual cortex.
Neurophysiological Methods
We will first describe our neurophysiological observations, and then present com-putational simulations to account for these observations. Neurophysiology was per-formed on two awake behaving monkeys. Single-unit recordings were made trans-durally from the primary visual cortex of the monkeys with epoxy-coated Tungstenelectrodes through a surgically implanted well overlying the operculum of area V1.The receptive field (RF) of each cell was first mapped with a small bar and with a tex-ture patch as the minimum responsive fields. The receptive fields of recorded cellswere located between 0.5◦ − 4◦ eccentricity in the lower left quadrant of the visualfield, and ranged in size from 0.5◦ to 1◦, with eye movement jitter factored in. Therecording procedure and experimental setup are essentially the same as that in Leeet al. (2002).
During recording, the monkeys performed a standard fixation task during stimu-lus presentation, where they were trained to fixate on a dot within a 0.7◦ fixationwindow on a computer monitor, 58 cm away. After stimulus presentation within aparticular trial the fixation dot jumped to another random location, and the monkeyhad to make a saccade to the new location in order to successfully complete the trialand obtain a juice reward. Each trial lasted for a fixed amount of time. The stimulifor each condition was presented statically on the screen in each trial. Each conditionwas repeated 20-30 times/trials, randomly interleaved with other conditions.
The stimuli tested typically contained a color figure in a background of contrastingcolor. Four colors were tested: a red and green contrasting color pair, and a blueand yellow contrasting pair. Fig. 1A illustrates the red-green stimulus pair. The four

Yan, Khambhati, Liu and Lee 4
colors, plus the intertrial gray, were equiluminant at 7.4 cd/m2, as measured usingTektronix J17 Lumacolor Photometer/Colorimeter. Their values in CIE coordinates(x,y) are (0.603, 0.364) for red, (0.286, 0.617) for green, (0.454, 0.481) for yellow and(0.149, 0.066) for blue. In the LMS coordinate system, the cone contrast of our red orblue relative to the gray is about the same, and is more than twice that of our greenor yellow. The colors were chosen to be as saturated as possible subject only to theequiluminant constraint.
Note that colors used in other color tuning or color coding experiments (Conway2001, Wachtler et al. 2003, Friedman et al. 2003) are chosen to have equal conecontrasts relative to the adapting gray. This constraint is important for assessingthe contributions from the L,M,S cone inputs to the neuron in question. However,these ‘balanced’ colors tend to be unsaturated, pastel-looking in appearance and notvery salient. The equiluminant colors we used were not equalized in cone contrast.Thus, the color tuning curves we obtained are not based purely on color, but subjectto influence of cone-contrast as well. Our color tuning curve should be interpretedwith caution in that regard.
We consider our choice acceptable for the purpose of our questions for the followingreasons. First, it is well known that V1 neurons’ color preferences are fairly diverseand dispersed, covering a variety of color, and are no longer limited to the canonicalLMS cone axis (Lennie and Movshon 2005). Hanazawa et al. (2000) demonstratedthat V1 cells’ color tunings exhibit preference to a variety of cues and saturation,suggesting an elaboration of color tuning to support color perception. Second, em-pirically, we have observed neurons we studied here exhibited exhibited a diversityof tuning preferences for the different colors, indicating that V1 neurons are not sim-ply slave of the cone-contrast sensitivity but are articulating their own preferencesfor the different colors. The main focus of our study is the relationship between colorcoding signals and contextual modulation signals. For this particular focus, any setof colors that span the color space and are preferred differently by different neuronswould serve our purpose.
In these experiments, we studied only those neurons with localized receptive fieldsthat exhibited some sustained responses inside a uniform (solid) color region muchlarger than the receptive field. The waveform of the spikes had a SNR of at least1.5 in peak-to-peak amplitude relative to the background noise. The analysis here isbased on single-unit activities and multi-unit activities. Single units and multi-unitsare analyzed separately, reported separately in some cases (Figure 5). But since thereare no qualitative distinction between single units and multi-units in the effect weobserved, we tend to lump them together in population analysis. Many cells thatresponded well to oriented bars but not to uniform color surfaces. These neuronswere also omitted from this study. The color-sensitive cells studied here were about

Yan, Khambhati, Liu and Lee 5
15 percent of the cells encountered. We found there is a tendency for cells preferringto the same color tend to cluster together in a particular penetration.
Stimuli were presented on a Sony Multisync color video display monitor driven by aTIGAR graphics board via the Cortex data acquisition program developed by NIH.The resolution of the display was 640 x 480 pixels, and the frame rate was 60 Hz. Thescreen size was 32 x 24 cm. When viewed from a distance of 58 cm, the full screensubtended a visual field 32◦ x 24◦ of visual angle. One pixel corresponded to a visualangle of 0.05◦.
Spatiotemporal Dynamics of Neural Responses to Color Stimuli
We first studied the spatiotemporal dynamics of neural responses to stimulus im-ages that contain a 4◦ × 4◦ solid color figure in a contrasting equiluminant colorbackground (Fig. 1A). One stimulus image contains a red figure in a green back-ground while the other contains a green figure in a red background. Each image waspresented statically on the screen for 350 msec in each trial. The image was shiftedspatially over successive trials, placing the figure at one of the 12 locations relative tothe receptive field at 0.66◦ or 1◦ intervals, spanning a range of over 10◦ (as shown inFig. 1A). This allows monitoring of the temporal evolution of the neuron’s responseto each particular spatial location of the image, analogous to Lamme (1995) and Leeet al. (1998)’s spatial sampling experiments on texture stimuli.
Fig. 1B and 1C present the temporal responses of two representative V1 neurons to12 different spatial locations of each of the image pairs shown in Fig. 1A. Neuronstended to exhibit strong and sustained responses at the boundary, but many cellsalso exhibited weak sustained responses to the solid color surface where there wereno contrast features within the receptive fields. At 2− 4◦ eccentricity, the sizes of thereceptive fields were typically less than 1◦ in spatial extent.
A number of effects can be observed in the neurons’ responses to such stimuli. First,the transition from gray screen to color figure produced a temporal chromatic con-trast signal that elicited a fast initial response in the neurons. Even though the stimuliwere of equal luminance, the cones have different sensitivities to these colors, andthus provide a differential bottom-up response to the V1 neurons. Secondly, in thelater part of the responses, 100 msec after stimulus onset at the latest, the neuronsexhibited preferences to the different colors, independent of the initial bottom-up re-sponse. Some neurons prefer red, while other neurons prefer green in the later partof their responses. Thirdly, we found many neurons’ responses were stronger whentheir receptive fields were inside the figure than when their receptive fields were in-side the background. This is evident in the two neurons shown in Figure 1B and 1C.Figure 2 shows the spatial response profile of these neurons in different time win-

Yan, Khambhati, Liu and Lee 6
Figure 1: (A). A pair of complementary stimuli tested: a red figure in a green back-ground, and a green figure in a red background. The other pair is blue/yellow figurein yellow/blue background. Crosses indicate the 12 RF locations of the neuron foreach image to be sampled. (B) The spatiotemporal response profiles of a neuron inresponse to the pair of stimuli above. Each depicts the temporal evolution of neu-ral responses at the different spatial locations indicated. The response is normalizedagainst the maximum response of each cell to the pair of the complementary stim-uli for easy visualization. The center of the figure in the stimulus was located at 0◦
along the x location axis, with the borders of the figure located at−2◦ and 2◦. (C) Thespatiotemporal response profiles of another neuron to the same stimuli, showing afigure enhancement effect regardless of the color of the surface.

Yan, Khambhati, Liu and Lee 7
0
100
200
300
400
500
6000−30 ms 20−50 ms 30−60 ms 60−90 ms
−2 0 2 40
100
200
300
400
500
600
Firi
ng r
ate
(Spi
kes
per
seco
nd)
90−120 ms
−2 0 2 4
120−150 ms
Spatial location in visual angle−2 0 2 4
150−180 ms
Spatiotemporal profile of neuronal responses to figure−ground stimuli (di071304.7, cell1)
−2 0 2 4
180−210 ms
0
50
100
150
2000−30 ms 30−60 ms 70−90 ms 90−120 ms
−2 0 2 40
50
100
150
200
Firi
ng r
ate
(Spi
kes
per
seco
nd)
120−150 ms
−2 0 2 4
150−180 ms
Spatial location in visual angle−2 0 2 4
220−250 ms
Spatiotemporal profile of neuronal responses to figure−ground stimuli (di071404.4, cell1)
−2 0 2 4
340−370 ms
Figure 2: Two neurons’s spatial response profile to the two stimuli in Figure 1 indifferent time windows.
dows post-stimulus onset to illustrate more precisely the strong initial responses atthe boundary, and the subsequent differential response between the 4-degree figure(between -2 and 2 along the x-axis in the graph) and the background.
Figure Enhancement Contextual Modulation
The differential response of the neurons to figure and background in these colorstimuli is analogous to the figure enhancement observed by Lamme (1995) on tex-ture figures. Fig. 3 shows the population averaged responses of 82 V1 single-unitsand multi-units in responses to three distinct parts (the figure center, the figure bor-der, and 2◦ outside the figure border) of the two test stimuli as shown in Fig. 1. Eachcell’s peri-stimulus histogram (PSTH) was smoothed with a 10 msec window beforepopulation averaging. The population responses were stronger initially for the redfigure than for the green background (Fig. 3A), and were stronger initially for thered background than the green figure (Fig. 3B), clearly indicating that the red stim-ulus might be a more potent bottom-up stimulus. However, as time evolved, thelater part of the population PSTH was stronger in the green figure than in the redbackground (Fig. 3B). The sustained neural activity in the later part of the responsethus is stronger inside the figure than in the background, regardless of the color ofthe receptive field stimulus. This is a rather dramatic effect, not observed in neuralresponses to texture stimuli (Lamme 1995, Lee et al. 1998).
Figs. 3C and 3D compare the average temporal response of this population to thesame receptive field stimulus (red or green respectively) in the figure (center) condi-tion and in the background condition (2 degrees outside). It can be observed that the

Yan, Khambhati, Liu and Lee 8
responses to the figure and the background conditions start to diverge significantlyat 70 msec for red and 66 msec for green. We assessed the figure enhancement onsettime for each neuron by performing a running T-test with a window of 20 msec, start-ing with stimulus onset, to determine when the responses (across different trials) atthe figure center became greater than the responses in the surround with statisticalsignificance (with a p ≤ 0.05). To make the estimation robust against noise, we ad-ditionally required the enhancement be statistically significant for at least 70 percentof the subsequent 20 windows, shifted in 1-msec step.
This enhancement of response to identical receptive field stimulus when it is placedinside the figure relative to when it is placed outside the background is called the‘figural enhancement’ responses, as originally observed by Lamme for texture stim-uli. However, the figural enhancement effect for these color figure stimuli is muchgreater than that for texture stimuli (Lamme 1995, Zipser et al. 1996, Lee et al. 1998,Rossi et al. 2001). The onset time of the figure enhancement effect for color stimulicould be as early as 50-60 msec, but on average the enhancement effect tended toemerge in the later part ( about 100 ms post-stimulus onset) of the responses (seeFigure 3E and 3F).
Figure Enhancement and Color Selectivity
To evaluate the figural enhancement effect as a function of color, we measured 81 (54from monkey D, and 27 from monkey B) V1 single and multi-units ’s responses tothe four colors (red and green stimuli as shown in Figure 1, as well as yellow andblue stimuli of equal luminance) both when the receptive field of the unit was atthe center of the figure and in the background condition (5o away from the figure’sborder). Responses to equiluminant gray screen was also tested as baseline. Figure4 shows a typical neuron’s response to the four colors in the figure condition (firstrow) and the ground condition (second row). It can be observed that the neuron’sresponses when its receptive field was inside the figure was significantly strongerthan its responses when its receptive field was in the background, for all four colors.
To compare the figure enhancement effect observed in color figures with data fromearlier texture studies (Lamme 1995, Zipser et al. 1996, Lee et al. 1998, Rossi et a.2001), we computed the figure enhancement index for each color as (F-G)/(F+G),where F is the response of the cell inside the figure of a particular color, and G is theresponse inside the background of the same color. Figure 5 shows the scatter plots ofthe figure enhancement indices for the four colors, with single units labeled in soliddots and multi-unit labeled in empty circles. The results from single units and multi-units are basically the same for this measure, so we lumped them together. The meanfigure enhancement indices in this population of V1 neurons are 0.26, 0.36, 0.24, 0.38for red, green, yellow and blue figures respectively, which are much stronger than

Yan, Khambhati, Liu and Lee 9
A B
C D
! "! #!! #"! $!! $"! %!! %"!!
"
#!
#"
$!
$"
%!
%"&'()*+,-./0+/1.2./3-4/5.3-67*../-8&-53'2),)59
:/5.3-3'2.-625.19
;)2<.*-4=-1.,,5
;>[email protected]'+/>#BB@.+/>#B!C?DE!FC%
! "! #!! #"! $!! $"! %!! %"!!
"
#!
#"
$!
$"
%!
%"&'()*+,-./0+/1.2./3-4/5.3-67.8-7&-53'2),)59
:/5.3-3'2.-625.19
;)2<.*-4=-1.,,5
;>"[email protected]'+/>?A@.+/>#!%BCDE!FBF
E F
Figure 3: (A,B) Population responses of V1 neurons to three specific locations of eachone of the complementary stimulus pair. (C,D) Population responses of V1 neuronsto same RF color stimulus in the figure or the ground context. Border response isalso shown for reference. (E,F) Distribution of the figure enhancement onset time forred surface and green surface.

Yan, Khambhati, Liu and Lee 10
0 500 10000
50
100
150
200
250Red Figure
Firin
g ra
te (s
pike
s/se
cond
)
Time post!stimulus onset (msec)0 500 1000
0
50
100
150
200
250Green Figure
0 500 10000
50
100
150
200
250Blue Figure
0 500 10000
50
100
150
200
250Yellow Figure
0 500 10000
50
100
150
200
250Red Ground
0 500 10000
50
100
150
200
250Green Ground
0 500 10000
50
100
150
200
250Blue Ground
0 500 10000
50
100
150
200
250Yellow Ground
Figure 4: A V1 neuron’s response to the four colors in the figure condition (first row)and the ground condition (second row). This neuron cell prefers yellow the most,but also responds considerably to blue. Enhancement of response is observed whenthe cell (receptive field diameter 1 degree) is inside the 4-degree figure than when itis in the background.

Yan, Khambhati, Liu and Lee 11
−1 −0.5 0 0.5 1−1
−0.8
−0.6
−0.4
−0.2
0
0.2
0.4
0.6
0.8
1(F−G)/(F+G)
Red
Green
sumu
−1 −0.5 0 0.5 1−1
−0.8
−0.6
−0.4
−0.2
0
0.2
0.4
0.6
0.8
1(F−G)/(F+G)
Yellow
Blue
sumu
Figure 5: Scatter plots of figure-enhancement for the four colors. Red and Green (leftgraph). Yellow and Blue (right graph). Substantial and significant figure enhance-ment effect is observed for all colors.
the mean figure enhancement index (about 0.1) observed in V1 for texture stimuli(Lee et al. 1998). We found 51% of the cells showed significant enhancement forall four colors, 27% for three, 16% for two, 6% for one color only. Thus, the figure-enhancement effect observed in solid color figure is significantly stronger than theeffect observed for texture stimuli.
While many of our recorded cells tend to respond more strongly to red or blue thanto green and yellow, they tend exhibit preference for different colors in the laterpart of their response. Fig. 1 and Fig. 2 show examples of single-cells and Fig 3Bshows population averages that initially responded predominantly to red groundand later to green figure. This later dominance of response to the green figure overred background in Figure 3B can arise from a stronger response inside the figure dueto figure enhancement and/or a development of a preference for green color in thesame neurons.
To separate the effects of figure enhancement and color preference, we analyzed theneuronal responses to red and green in either the figure context or the backgroundcontext separately. We separate the cells into groups depending on their color pref-erence based on the later part of their responses to the different colors in the figurecondition. The responses of of the neurons that ultimately prefer green over redare the most revealing, as shown in Figure 6. Among these 81 neurons, 25 exhib-ited preference for green over other colors in the later part of their responses. Fromtheir population PSTHs in response to red and green figures (Fig. 6A), and red andgreen backgrounds (Fig. 6B), in both cases we observed that the response to thegreen surface became greater than the response to the red surface at about 90 msec.

Yan, Khambhati, Liu and Lee 12
We estimated the contextual color preference onset for each of the green-preferringcells, based on the time its response to green overtook its response to red, usingthe same running T-test used for estimating figure enhancement onset. Fig. 6C and6D show the distribution of the contextual color tuning onset (based on green-redcrossing), yielding a mean of 103 msec for the figure condition, and 117 msec for thebackground condition.
We take this later onset of preference for green, or other colors, over red, as evidencefor the articulation of color preference in V1 neurons happening in the later part oftheir responses. We computed likewise the figure enhancement modulation onsetfor this population of neurons. The distribution of figure enhancement effect (Figure6E) shows a mean of 113 msec (median = 101 msec), comparable to the distributionof color tuning onset time observed above. Fig. 6F compares the color tuning onsetand the figure enhancement onset estimated for each neuron. Except for three orfour neurons, whose figure enhancement onset was significantly delayed relative tocolor tuning onset, the figure enhancement and the color tuning appeared to emergealmost simultaneously for most neurons inside the 4◦ × 4◦ figure, lagging behind theborder response by 70 msec.
We found the neurons’ preferences for color in the later part of their responses werediverse, preferring different colors. Figure 7 shows example tuning curves of fourneurons preferring the four distinct color in both the figure and the background con-ditions. Among the 81 selected color sensitive cells studied, 17 of them preferringred, 36 cells preferring green, 28 cells preferring yellow, and 18 cells preferring blue.However, the 17 ‘red’ cells and the 36 ‘yellow’ cells have 6 cells in common, i.e. thesecells prefer red and yellow almost equally (‘orange’ cells). Similarly, there were 13cells (’yellowish green’ cells) shared by the yellow cells and the green cells, 8 cells(’cyan’ cells) shared by the green cells and the blue cells, and 6 cells (’magenta’ cells)shared by the blue cells and red cells. The remaining 15 were prefer antagonisticcolors – (red and green) or (blue and yellow). The remaining prefer one or two(non-opponent color) of the four colors strongly over the rest, For neurons that weresharply tuned to one of the four tested colors, most exhibit simialr color tunings infigure and ground conditions. For neurons that were more broadly tuned in eithercondition, over half exhibited some changes in the color preference between the fig-ure and ground conditions.
Basically, the neurons we studied appeared to be tuned to a spectrum of color, asdescribed in Hanazawa et al. (2000).
Timing and Contribution of Contextual Modulation
The articulation of color tuning and the figure enhancement effect appeared to emerge

Yan, Khambhati, Liu and Lee 13
0 50 100 150 200 250 300 3500
50
100
150
200
250
300
350Onset time: Color vs Figure
Figural enhancement Onset (msec)
Col
or tu
ning
Ons
et (m
sec)
−100 0 100 200 3000
10
20
30
40
50
60
70
80Response to R/G Background (green cells)
Time post stimulus onset (msec)Fi
ring
rate
(sps
)
N(red)=28N(green)=28
Red GroundGreen Ground
−100 0 100 200 3000
10
20
30
40
50
60
70
80Response to R/G Figure (green cells)
Time post stimulus onset (msec)
Firin
g ra
te (s
ps)
N(red)=28N(green)=28
Red FigureGreen Figure
0 50 100 150 200 250 300 3500
2
4
6
8
10
N=25Median=101Mean=113.7+/−8.8
Green figure−ground Onset time
Onset time (msec)
Num
ber o
f cel
ls
0 50 100 150 200 250 300 3500
2
4
6
8
10
N=19Median=91Mean=117.4+/−13
Green Onset time (ground)
Onset time (msec)
Num
ber o
f cel
ls
0 50 100 150 200 250 300 3500
2
4
6
8
10
N=25Median=104Mean=103+/−4.7
Green Onset time (figure)
Onset time (msec)
Num
ber o
f cel
ls
A
C
E
B
D
F
Figure 6: (A,B) Population average PSTHs of 25 green cells in response to the greenfigure versus the red figure (A), and to the green ground versus the red ground (B).(C,D) Distribution of onset of contextual color tuning in these green neurons in thefigure condition (C) and the ground condition (D). (E) Distribution of onset timingof the figure enhancement effect for these green neurons. (D) Comparison betweenthe figure enhancement onset and the contextual color tuning onset.

Yan, Khambhati, Liu and Lee 14
10
20
30
40
YELLOW
BLUE
GREEN RED
be323LW4d2
10
20
30
40
YELLOW
BLUE
GREEN RED
be3314BWd2
20
40
60
80
YELLOW
BLUE
GREEN RED
be3354BYd2
10
20
30
40
YELLOW
BLUE
GREEN RED
di0528041BWa2
Figure 7: Examples of color tuning in four individual neurons, prefering one of thefour colors. The thick line is the color tuning in the figure condition while the thinline is the color tuning in the ground condition.
at the same time, with an average latency around 80-100 msec significantly later thanthe responses to the boundary (30-50 msec), and therefore might involve contextualmodulation. To what extent the neural responses to color surfaces are due to recep-tive field stimulation or contextual modulation? To separate receptive field effectand contextual effect, and to measure the time course of the contextual modulationmore precisely, we designed the paradigm as shown in Fig. 8A to decompose the re-ceptive field stimulation and the contextual modulation. An additional 55 neuronswere tested, drawn evenly from the two monkeys.
In each trial, while the monkey fixated, the color of the full screen was first changedfrom gray (which was presented between trials) to one of the four colors; 350 mseclater, the region outside and surrounding the receptive field of the neuron was abruptlychanged to a contrasting color, making visible a disk figure over the receptive fieldwithout changing the receptive field stimulus. Figures of four sizes (1, 3, 6, 9 degrees indiameter ) were presented across trials. Each remained on the screen for 400 msec.
When the entire screen changed color in the first update, V1 neurons typically gave atransient weak response followed by a weak sustained response. When the surroundchanged to another color in the second (surround) update, the neurons gave a strongand sustained response, even though nothing was changed within the receptive fieldor in its proximal surround. This response to the contextual stimulation is in factmuch stronger than the direct receptive field stimulation in the first update, as shownthe PSTHs in Fig. 8B.
The responses to the second (surround) update (at 0 msec) were sustained. and werestatistically significant (relative to the baseline) for 27 cells for the 3-degree figure, 20cells for the 6-degree figure, and 17 cells for the 9-degree figure. The strength andsustained nature of this signal suggests that much of the sustained neural responsesto color surfaces in our first experiment in fact came from contextual modulation.
For the 1 degree figure, its chromatic contrast border appeared in the second update

Yan, Khambhati, Liu and Lee 15
Monkey fixates Target color
appears Background changes
color
Target disappears,monkey makes asaccade to a dot
−600 −400 −200 0 200 4000
20
40
60
80
100
120
140
160
Time relative to surround update (msec)
Firin
g ra
te (s
ps)
Temporal evolution of responses (Green RF stimulus)
1º disk3º disk6º disk9º diskuniform
1 3 6 90
20
40
60
80
100
120Figural enhancement onset (Green)
Diameter of the disk (degrees visual angle)
Aver
age
onse
t tim
e (m
sec)
−600 −400 −200 0 200 4000
20
40
60
80
100
Time relative to surround update (msec)
Firin
g ra
te (s
ps)
Temporal evolution of responses (Red RF stimulus)
1º disk3º disk6º disk9º diskuniform
1 3 6 90
20
40
60
80
100
120
140Figural enhancement onset (Red)
Diameter of the disk (degrees visual angle)
Aver
age
onse
t tim
e (m
sec)
A
B
C
Figure 8: (A) Asynchronous update paradigm. The entire screen was turned red at-350 msec, followed by the appearance of a green background surrounding the RFat 0 msec, making visible a circular red disk over the RF. (B) Population PSTH ofcells responding to red figure (left panel) and green figure (right panel) of differentdiameters (1, 3, 5, 9) as well as full color screen. Surround update occurred at 0msec. Only 12 cells were recorded for the 1 degree figure later on in this experimentto provide a reference for the onset of boundary response. All other sizes were testedwith 55 neurons. Note that the graph of the average response to the 1 degree figureappeared to be different from those for the other sizes after the first update eventhough the stimulus is identical. This is because the average is based on 12 neurons,while the others are based on 55 neurons. (C) Mean response onset to ‘red figure’subsequent to surround update as a function of the figure’s diameter (left panel).Mean response onset to the ‘green figure’ (right panel).

Yan, Khambhati, Liu and Lee 16
likely impringed on the receptive fields of the cells leading to rather rapid responses(53 msec response onset for red figure, and 36 msec for green figure estimated popu-lation PSTH). For the larger disks, the chromatic borders were outside and relativelyfar away from the receptive fields of the cells (typically less than 1 degree in diame-ter). We found the onset of this contextual response was increasingly delayed withan increase in the size of the disk, or the distance of the chromatic border. The meanonset time of the contextual responses, estimated based on the cells that showedmeasurable and significant responses, were 86, 112, 116 msec for red figure of 3,6,9-degree in diameter, 62, 76, 101 msec for green figure, 81, 100, 107 msec for yellowfigure, and 67, 93, 115 for blue figure respectively. Such progressive delay with anincrease of figure diameter suggests that the contextual modulation likely comesfrom signals propagating from the chromatic contrast border.
Figure Enhancement and Image Representation
What is the nature of this contextual modulation signal propagating from the chro-matic contrast border? One can argue that in this second experiment (Figure 8), theneural code for color should have been established after the first update, since screenwas readily perceived as red before the second update took place. Thus, the wave ofstrong contextual modulation should not be signaling color, but representing some-thing different such as figure-ground segregation or perceptual saliency that servesto modulate the color codes. This reasoning rests on the implicit assumption thatuniform brightness or color are represented by spatially uniform neural activities inneurons of a particular chromatic or brightness channel. Such an assumption is notnecessary correct.
We will now discuss a model that suggests that activities of the neurons for repre-senting an image could change as a function of the global image as a whole, eventhough the receptive field stimulus of the neurons remains constant. We call thisthe image representation model (Daugman 1988, Lee 1996), which assumes faithfulimage representation is an objective of the primary visual cortex. Such a model isalso the assumption of the popular efficient sparse coding account of the emergentproperties of simple cell receptive fields (Olshausen and Field 1996). This model pre-scribed that V1 simple cells, modeled as a set of overcomplete set Gabor wavelets,can be used to synthesize or represent any arbitrary image (Daugman 1988, Lee1996):
I(x, y) =∑
i
aiφi + n (1)
where n is noise or factors unaccounted for. The represented (input or perceived)image I attempts to explain the input image I(x, y) as a linear weighted sums of

Yan, Khambhati, Liu and Lee 17
wavelets. The weight ai of each wavelet φi (presumably the firing rates of sim-ple cells) are obtained by minimizing the following objective function, which is thesquare error of how well these weight sum can explain the image (Eq. 2),
E =∑
x,y(I(x, y)− I(x, y))2
=∑
x,y(I(x, y)−∑
i aiφi)2(2)
The φ is related to the synthesis basis of a simple cell, which is complementary to theconventional filter notion of receptive field, and ai the cell’s firing rate. It has beenshown that the filters and the basis derived from independent analysis resembledthe receptive fields of V1 neurons.
The highly redundant nature of the wavelet representational elements (i.e. simplecells) implies ai, the wavelet coefficients or firing rates of neuron i, cannot simplytake the form of the filter response, but need to be adjusted over time to removethe redundancy between neurons’ repesentations. The final values of the set of ai
can be obtained by minimizing the convex objective function by iterative gradientdescent, which can be realized by horizontal network connections. The horizontalconnectivity of the network is evident in the following descent equation, obtainedby taking the partial derivative of the error function (Eq. 2) with respect to ai, 3).
daidt = − dE
dai
= 2∑
x,y I(x, y)φi(x, y)− 2∑n
k
∑x,y ak(x, y)φk(x, y)φi(x, y) (3)
The first term of the descent equation (Eq. 3) is the feedforward input to the neu-ron based on its receptive field. The second term represents the lateral interactionsbetween neuron i and any other Gabor wavelet neuron with redundancy in theirrepresentation. That is, two neurons inhibit each other when the dot products oftheir ‘receptive fields’ are positive, and facilitate each other when the dot products oftheir ‘receptive fields’ are negative. When their receptive fields are orthogonal, therewill be no interaction between them for the purpose here. Note that the interactionsare local, and concern neurons with overlapping receptive fields, other long-rangeinteraction between neurons such as association fields for contour completion andsurface interpolation are not captured here. In our simulation, the initial input toeach neuron are set to be the dot product of the receptive field and the receptivefield stimulus, the first term in Equation 3. Subsequently, the network will iterateby following the gradient descent equation to arrive at the final set of ai so that theinput image is faithfully represented. Here, we assumed the number of iterations isproportional to the amount of time elapsed post-stimulus onset.
The implemented model consists of a retinotopic map of cortical hypercolumns cov-ering an input image of 192x192 pixels. We do not model the change in retinal or

Yan, Khambhati, Liu and Lee 18
cortical receptive field size as a function of eccentricity, i.e. the spatial resolution isassumed to be uniform across the retinotopic map. The pixel intensities of the inputimage were rescaled to max (white) of 127.5, min (black) of −127.5 and mean (gray)of 0. The image was represented by a set of Gabor wavelets specified by (Eq. 4), asin Lee (1996). The Gabor wavelets were constrained to a single scale with 8 orienta-tions, at 22.5◦ intervals. In each orientation, the Gabor filters exist in both even andodd-symmetric forms, with zero d.c. response (Lee 1996).
φ(x, y, ωo, θ) = ωo√2πκ
e−ω2
o8κ2 (4(x cos θ+y sin θ)2+(−x sin θ+y cos θ)2)
·(
eiωo(x cos θ+y sin θ) − e−κ2
2
) (4)
Here, for simplicity, we only used the model with the single (finest) scale, with aspatial sampling of 2 pixels, spatial frequency of 0.314 pixels, spatial frequency band-width of 3.5 octaves, and two spatial phases, i.e. even and odd symmetric Gaborwavelets, which is sufficient to represent uniform luminance images.
These zero-dc wavelets, in both sine and cosine varieties, will have zero feedfor-ward responses to uniform luminance or color stimulus. But this set of overcom-plete wavelets are known to be able to represent arbitrary images, we want to knowhow this could be done and what the activity ai should be in order to represent theuniform luminance or color surface.
Without loss of generality, we considered the Gabor wavelets coding luminance, andtested the responses of the neurons to a disk of uniform luminance. We examinedthe spatial and temporal evolution of the synthesized image I , as well as the waveletcoefficients (firing rates of the simple cells), as well as the sum of the absolute valuesof wavelets of both sine and cosine varieties ( approximating the energy model of thecomplex cells). The represented image were rescaled to 8-bit, grayscale, pixel inten-sities. Individual hypercolumn responses represent the average magnitude responseof all the wavelets φi at each scale populating that corresponding spatial location.
Our conjecture is that the spatiotemporal profile of neural responses observed inexperiments can be understood in terms of the spatiotemporal profile of the waveletcoefficients (or its absolute value) for representing the luminance disk.
Fig. 9 shows that a white disk and a black disk can be represented by these zero-dcwavelets, and the ‘neural activities’ required to accomplish the representation. Thetemporal evolution of the synthesized image I(x, y) shows first a representation ofthe contrast border of the white disk, followed by a filling-in of brightness in thesurface of the disk. To examine the evolution of total neural responses within eachhypercolumn at different spatial locations across a cross-section of the disk along

Yan, Khambhati, Liu and Lee 19
Figure 9: Sum of responses of neurons at all orientations at each position along thehorizontal midline to show the temporal evolution of the population responses. Thewhite and the black disks excited complementary sets of neurons (see Figure 9), butthe total population responses to the two stimuli were equal. There is a gradualdecrease in response away from the border toward the center in most neurons.
Yan, Khambhati, Liu and Lee 20
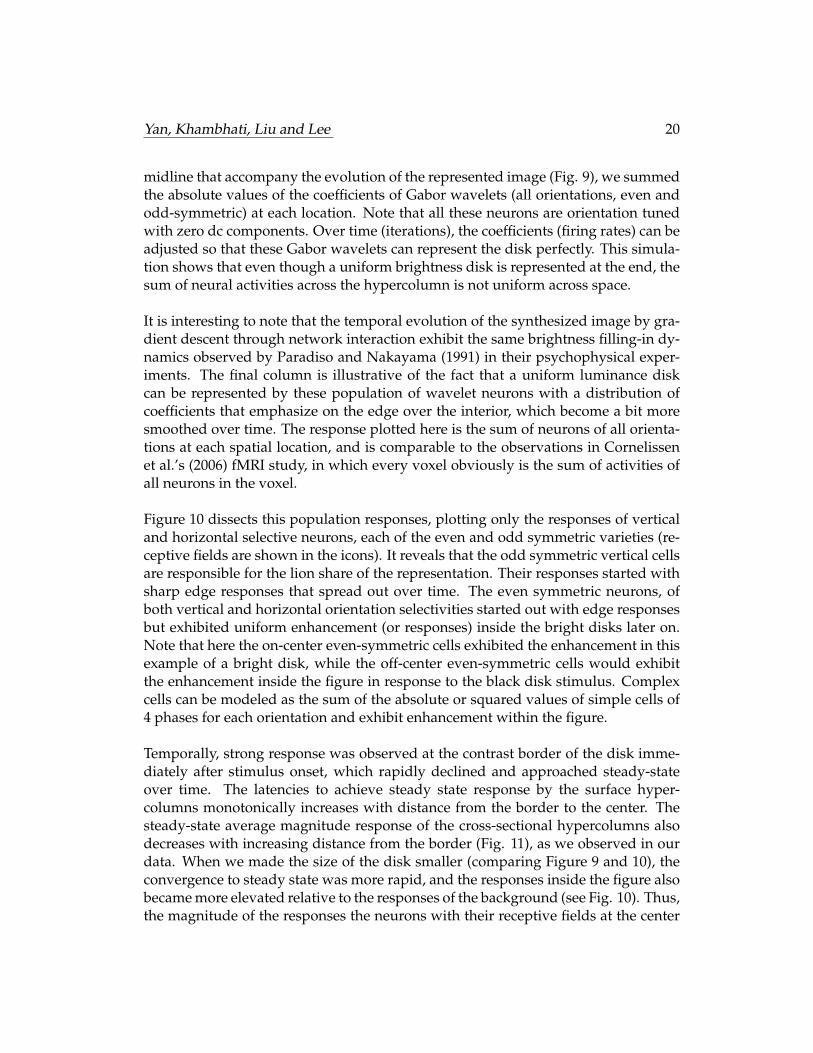
midline that accompany the evolution of the represented image (Fig. 9), we summedthe absolute values of the coefficients of Gabor wavelets (all orientations, even andodd-symmetric) at each location. Note that all these neurons are orientation tunedwith zero dc components. Over time (iterations), the coefficients (firing rates) can beadjusted so that these Gabor wavelets can represent the disk perfectly. This simula-tion shows that even though a uniform brightness disk is represented at the end, thesum of neural activities across the hypercolumn is not uniform across space.
It is interesting to note that the temporal evolution of the synthesized image by gra-dient descent through network interaction exhibit the same brightness filling-in dy-namics observed by Paradiso and Nakayama (1991) in their psychophysical exper-iments. The final column is illustrative of the fact that a uniform luminance diskcan be represented by these population of wavelet neurons with a distribution ofcoefficients that emphasize on the edge over the interior, which become a bit moresmoothed over time. The response plotted here is the sum of neurons of all orienta-tions at each spatial location, and is comparable to the observations in Cornelissenet al.’s (2006) fMRI study, in which every voxel obviously is the sum of activities ofall neurons in the voxel.
Figure 10 dissects this population responses, plotting only the responses of verticaland horizontal selective neurons, each of the even and odd symmetric varieties (re-ceptive fields are shown in the icons). It reveals that the odd symmetric vertical cellsare responsible for the lion share of the representation. Their responses started withsharp edge responses that spread out over time. The even symmetric neurons, ofboth vertical and horizontal orientation selectivities started out with edge responsesbut exhibited uniform enhancement (or responses) inside the bright disks later on.Note that here the on-center even-symmetric cells exhibited the enhancement in thisexample of a bright disk, while the off-center even-symmetric cells would exhibitthe enhancement inside the figure in response to the black disk stimulus. Complexcells can be modeled as the sum of the absolute or squared values of simple cells of4 phases for each orientation and exhibit enhancement within the figure.
Temporally, strong response was observed at the contrast border of the disk imme-diately after stimulus onset, which rapidly declined and approached steady-stateover time. The latencies to achieve steady state response by the surface hyper-columns monotonically increases with distance from the border to the center. Thesteady-state average magnitude response of the cross-sectional hypercolumns alsodecreases with increasing distance from the border (Fig. 11), as we observed in ourdata. When we made the size of the disk smaller (comparing Figure 9 and 10), theconvergence to steady state was more rapid, and the responses inside the figure alsobecame more elevated relative to the responses of the background (see Fig. 10). Thus,the magnitude of the responses the neurons with their receptive fields at the center

Yan, Khambhati, Liu and Lee 21
!"#$%"&'
()*
!"#$%"&'
()+,
!"#$%"&'
()-,
.#/'(0"$1/"&'(23&"#)4(&5'$6)7&08
,9:
;,9:,9:
;,9:
,9:
;,9:,9:
;,9:
,9+
;,9+,9+
;,9+
,9+
;,9+
,9+
;,9+
*
;*
,9<
;,9<
.#0='(0#,9+
;,9+
,9:
;,9:
.#0='(0# .#0='(0# .#0='(0#
Figure 10: Neuronal responses to the white disk at 1st, 20th and 50th iterationsare separated into the vertical oriented odd-phase (second column) and even-phase(third column) neurons’ responses and the horizontal odd-phase (fourth column)and even-phase (fifth column) neurons’ responses. The response has both positiveand negative components. It is understood that the positive components are carriedby the neurons with the receptive field shown, while the negative components arecarried by the neurons with complementary receptive fields, i.e. with 180 phase shift,comparable to on and off-center cells in the retina. It shows that the odd symmetricfilters carry the lion share of response and strong edge responses spread over timeaway from the initial border responses, while the responses of the even symmetricfilters exhibit stronger responses inside the figure in the later part of the responses.This positive even symmetric neurons exhibit an increase in response inside thisbright disk figure, and the negative even symmetric neurons will exhibit an inceasein response inside the black figure. Thus, figure enhancement response can be ob-served in the even symmetric neurons, while the odd symmetric neurons exhibitedge response spreading that is slightly stronger inside the figure as well.
Yan, Khambhati, Liu and Lee 22
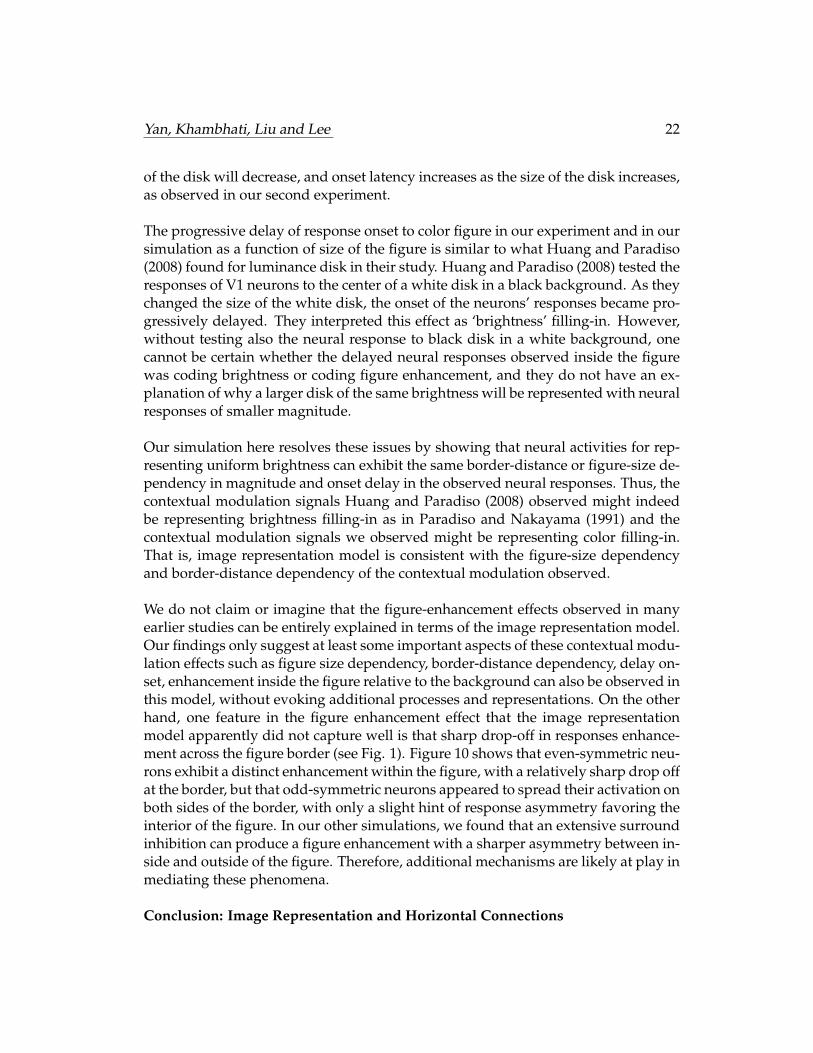
of the disk will decrease, and onset latency increases as the size of the disk increases,as observed in our second experiment.
The progressive delay of response onset to color figure in our experiment and in oursimulation as a function of size of the figure is similar to what Huang and Paradiso(2008) found for luminance disk in their study. Huang and Paradiso (2008) tested theresponses of V1 neurons to the center of a white disk in a black background. As theychanged the size of the white disk, the onset of the neurons’ responses became pro-gressively delayed. They interpreted this effect as ‘brightness’ filling-in. However,without testing also the neural response to black disk in a white background, onecannot be certain whether the delayed neural responses observed inside the figurewas coding brightness or coding figure enhancement, and they do not have an ex-planation of why a larger disk of the same brightness will be represented with neuralresponses of smaller magnitude.
Our simulation here resolves these issues by showing that neural activities for rep-resenting uniform brightness can exhibit the same border-distance or figure-size de-pendency in magnitude and onset delay in the observed neural responses. Thus, thecontextual modulation signals Huang and Paradiso (2008) observed might indeedbe representing brightness filling-in as in Paradiso and Nakayama (1991) and thecontextual modulation signals we observed might be representing color filling-in.That is, image representation model is consistent with the figure-size dependencyand border-distance dependency of the contextual modulation observed.
We do not claim or imagine that the figure-enhancement effects observed in manyearlier studies can be entirely explained in terms of the image representation model.Our findings only suggest at least some important aspects of these contextual modu-lation effects such as figure size dependency, border-distance dependency, delay on-set, enhancement inside the figure relative to the background can also be observed inthis model, without evoking additional processes and representations. On the otherhand, one feature in the figure enhancement effect that the image representationmodel apparently did not capture well is that sharp drop-off in responses enhance-ment across the figure border (see Fig. 1). Figure 10 shows that even-symmetric neu-rons exhibit a distinct enhancement within the figure, with a relatively sharp drop offat the border, but that odd-symmetric neurons appeared to spread their activation onboth sides of the border, with only a slight hint of response asymmetry favoring theinterior of the figure. In our other simulations, we found that an extensive surroundinhibition can produce a figure enhancement with a sharper asymmetry between in-side and outside of the figure. Therefore, additional mechanisms are likely at play inmediating these phenomena.
Conclusion: Image Representation and Horizontal Connections

Yan, Khambhati, Liu and Lee 23
0 10 20 30 40 50 60 70 80 90 1000
10
20
30
40
50
60
Iterations
Ave
rage
d M
agni
tude
Res
pons
e
Temporal Dynamics of Gabor Wavelet Response to White Disk
Figure 11: The responses of the simulated neuronal population at each spatial lo-cation relative to the contrast border, sum of absolute values of wavelet coefficientsof wavelets of different orientations and phases at each location, show that as thedistance away from the border increases, the response onset increases, and the mag-nitude of the responses decreases, as also observed in our single and multi-unit data.

Yan, Khambhati, Liu and Lee 24
This work began over 10 years ago by investigating Lamme’s figural enhancementeffect in chromatic figures. We indeed found the figure enhancement effect to bemuch stronger for uniformly colored figure than for texture figures. Surprisingly,we found that much of the responses of the neurons to uniform color surface arisefrom contextual modulation rather than direct receptive field stimulation. These con-textual modulation are likely mediated by horizontal recurrent networks given theprogressive delay and magnitude dropoff as a function of figure size or distance tothe chromatic contrast border. Interestingly, we found the articulation of color pref-erence and the figure enhancement contextual modulation have roughly the sametemporal onset. This leads us to wonder whether the two might actually be relatedand be understood simply in terms of image representation.
We simulated the image representation model to show that the wavelet activitiesthat are required to represent a uniformly colored disk (with white or black as spe-cial cases) can actually account qualitatively many characteristics of the neural re-sponses to a uniformly colored figures, i.e. a decrease in response magnitude, andan increase in response onset latency with an increase in disk size or receptive fielddistance away from the contrast border. The model produces an overall responsethat emphasizes strongly at the boundary, with a larger spatial spread from the bor-der not predicted by simple filter responses (see Fig. 10). This suggests that verysimilar observations in Cornelissen et al.’s (2006) fMRI study cannot be used to re-fute isomorphic representation of the images in V1.
There has been some uncertainty as to whether Huang and Paradiso’s (2008) obser-vations are in fact related to brightness filling-in, as the signal could be potentially beconstrued as a figure-ground saliency signal. Our simulation supports their claim,and suggests that certain figure-ground enhancmeent effect be construed simply asneural activities for image representation. More interestingly, the temporal evolu-tion of synthesized images in Figure 9 exhibits the same perceptual phenomenonobserved in Paradiso and Nakayama’s (1991) brightness filling-in study. All othermodels for explaining this filling-in phenomenon assumes there is a brightness chan-nel in V1 in which the signals propagate by a diffusion mechanism (Grossberg andMingolla 1985, Arrington 1994). Our simulation shows the ‘diffusion effect’ does nothave to be mediated by a diffusion mechanism, but could simply be the consequenceof the unfolding gradient descent computation to remove redundancy for image syn-thesis that requires only competitive and cooperative interactions between neurons.From the perspective of this model, Paradiso and Nakayama’s (1991) result can beinterpreted as an indirect evidence for an isomorphic representation of images in thevisual cortex.
A more serious challenge to the isomorphic representation theory has been cast byVon der Heydt et al.’s (2005) study on color filling-in in the Troxler illulsion. They

Yan, Khambhati, Liu and Lee 25
did not find corresponding change in neural activities of ‘surface’ neurons when themonkeys reported seeing the filling-in. But they did see a decrease in responses ofthe border neurons looking at the chromatic borders that were disappearing whenfilling-in perception was reported. Could it be that the neurons we studied in ourexperiments were more similar to their ‘border’ neurons than to their ‘surface’ neu-rons, as our neurons responded very strongly to the chromatic border and only mod-estly to the background color surface (Fig 8). Here, we showed both physiologicallyand computationally that surface and boundary need not be represented by two dis-tinct sets of neurons, and that uniform surface color can be represented by bordersensitive neurons. However, further experiments and analysis are required to testwhether these border cells looking at the color surface would exhibit filling-in be-haviors in Troxler illusion.
In earlier studies, we have found that the enhanced responses inside the figure reflectperceptual saliency (Lee et al. 2002), as the figure enhancement signal is proportionalto the monkeys’ reaction speed and accuracy in target detection. Here, the simula-tion seems to suggest that enhancement inside the figure could emerge directly fromimage representation computation without the need of an explicit saliency compu-tation. How can these two views be reconciled? One can argue that the figure en-hancement effect can be produced simply as a by-product of the computation forrepresenting images, but this enhancement in neural response can be treated by thelater system as a saliency signal. It is also possible surround suppression and othermechanisms can compute saliency as well. Even though the connectivity requiredin the image network is very local and limited, the signals can still propagate farfrom the source over time, as shown in Fig. 9. It would be interesting to investigatewhat aspects of the classical surround suppression, and other contextual modulationeffects can be account for in terms of image representation model.
In this paper, we have advanced the ‘radical idea’ that image representation fur-nishes a model for explaining and reconciling a number of neurophysiological obser-vations on contextual modulation. The image representation assumption has beencentral to the efficient sparse coding account of the emergent properties of simplecell receptive fields (Olshausen and Field 1996, Lewicki and Olshausen 1999). Thepredictive coding schemes in hierarchical visual cortex (Rao and Ballard 1999) alsoimplicitly assume V1 can represent and is used to represent images. We (Lee andMumford 2003) further conjecture that V1 can act as a high-resolution buffer for vi-sual reasoning. We have argued that V1 neurons are not simply filters or waveletsfor representing or detecting edges and features in images, but in fact can support anisomorphic representation of images for high resolution visual reasoning. Neverthe-less, it has not really be seriously entertained as a model for horizontal connectivityfor the cortex except Rozell et al. (2008). This circuit of redundancy removal for im-age representation is likely embedded inside a rich set of horizontal circuits for other

Yan, Khambhati, Liu and Lee 26
well known phenomena observed in V1 (Angelucci and Bressloff 2006, Bringuier etal. 1999, Fregnac 2003): contour linking (Li et al. 2008, Gilbert and Sigman 2007), sur-face interpolation (Samonds et al. 2009), surround suppression, pop-out and saliencycomputation (e.g. Knierim and Van Essen 1991, Lee et al. 2002). Understanding howmultiple functional horizontal and recurrent feedback circuits can coexist and worktogether with the circuit of image representation is a major challenge for future the-oretical and experimental research.
References
Albrechet DG, Geisler WS, Frazor RA, Crane AM (2002) Visual cortical neurons of monkeysand cats: temporal dynamics of the contrast response function. J. Neurophysiology 88: 888-913.
Angelucci, A. Bressloff, P (2006) Contribution of feedforward, lateral and feedback cnnec-tions to the classical receptive field center and extra-classical receptive field surround of pri-mate V1 neurons. Progress in Brain Research, Vol 154, Martinez-Conde, Macknik, Martinez,Alonso and Tse (Ed). 93-120.
Arrington KF (1994) The temporal dynamics of brightness filling-in. Vision Res. 34(24):3371-87.
Bringuier V, Chavane F, Glaeser L, Frgnac Y. (1999). Horizontal propagation of visual activityin the synaptic integration field of area 17 neurons. Science. 283 : 695-699.
Connor CE, Egeth HE, Yantis S (2004). Visual attention: Bottom-up vs. top-down. CurrentBiology, 14, 850-852.
Conway BR (2001). Spatial structure of cone inputs to color cells in alert macaque primaryvisual cortex (V1). J Neuroscience 21, 2768-2783.
Conway BR, Hubel DH, Livingstone MS 2002. (2002) Color contrast in macaque V1. CerebCortex 12(9):915-25.
Cornelissen FW, Wade, AR, Vladusich T, Dougherty RF, Wandell BA (2006) No functionalmagnetic resonance imaging evidence for brightness and color filling-in in early human vi-sual cortex. J. Neurosci 26: 3634-3641.
De Weerd P, Gattass R, Desimone R, Ungerleider LG (1995) Responses of cells in monkeyvisual cortex during perceptual filling-in of an artificial scotoma. Nature 377: 731-734.
Friedman HS, Zhou H, von der Heydt R (2003) The coding of uniform color figures in mon-key visual cortex. J Physiol (Lond) 548: 593-613.
Gerrits HJM, Vendrik AJH (1970) Simultaneous contrast, filling-in process and information

Yan, Khambhati, Liu and Lee 27
processing in man’s visual system. Exp Brain Res 11: 411-430.
Gilbert CD, Sigman M (2007) Brain states: Top-down influences in sensory processing. Neu-ron. 54(5):677-696
Grossberg S, Mingolla E. (1985) Neural dynamics of form perception: boundary completion,illusory figures, and neon color spreading. Psychol Rev. 92(2):173-211.
Hanazawa A, Komatsu H, Murakami I. (2000). Neural selectivity for hue and saturation ofcolour in the primary visual cortex of the monkey. European Journal of Neuroscience, 12:1753-1763.
Huang X, Paradiso MA (2008) V1 response timing and surface filling-in. Journal of Neuro-physiology 100: 539-547.
Kinoshita M. Komatsu H. (2001) Neural representation of the luminance and brightness of auniform surface in the macaque visual cortex. J. Neurophysiology 86. 2559-2570.
Lamme VA. (1995) The neurophysiology of figure-ground segregation in primary visual cor-tex. J Neurosci. 15(2):1605-15.
Land E (1977) The retinex theory of color vision. Sci. Am. 237:108-28.
Lee TS, Mumford D, Romero R, Lamme VA. (1998) The role of the primary visual cortex inhigher level vision. Vision Res. 38(15-16):2429-54.
Lee TS, Yang CF, Romero RD, Mumford D. (2002) Neural activity in early visual cortex re-flects behavioral experience and higher-order perceptual saliency. Nat Neurosci. 5(6):589-97.
Lee TS, Mumford D (2003) Hierarchical Bayesian inference in the visual cortex. Journal ofOptical Society of America, A. . 20(7): 1434-1448.
Lennie P., Movshon J.A. (2005) Coding of color and form in the geniculostriate visual path-way. JOSA 22: 10, 2013-2033.
Li W, Piech V, Gilbert CD (2008) Learning to link visual contours. Neuron 57(3):442-451.
Livingstone MS, Hubel DH (1984). Anatomy and physiology of a color system in the primatevisual cortex. J Neurosci 4, 309-356.
Luck SJ, Chelazzi L, Hillyard SA, Desimone R. (1997) Neural mechanisms of spatial selectiveattention in areas V1, V2, and V4 of macaque visual cortex. J Neurophysiol. 77(1):24-42.
McAdams CJ, Maunsell JH. (2000) Attention to both space and feature modulates neuronalresponses in macaque area V4. J Neurophysiol. 83(3):1751-5.

Yan, Khambhati, Liu and Lee 28
Marcus, DS, Van Essen DC (2002) Scene segmentation and attention in primate cortical areasV1 and V2. J. Neurophysiology, 88: 2648-2658.
Maunsell JH, Gibson JR. (1992) Visual response latencies in striate cortex of the macaquemonkey. J Neurophysiol. 68(4):1332-44.
Palmer SE (1999) Vision Science : Photons to Phenomenology, MIT press.
Paradiso MA, Nakayama K (1991) Brightness perception and filling-in. Vision Research 31:1221-1236. tion and Performance, 9, 183-193.
Roe AW, Lu H, Hung CP (2005) Cortical processing of a brightness illusion. Proc Natl AcadSci USA 102:3869-3874.
Rossi AF, Desimone R, Ungerleider LG. (2001) Contextual modulation in primary visualcortex of macaques. J Neurosci. 21(5):1698-709.
Rossi AF, Rittenhouse CD, Paradiso, MA. (1996) The representation of brightness in primaryvisual cortex. Science 273, 1104-1107.
Samonds JM, Potetz B, Lee TS, (2009) Cooperative and competitive interactions facilitatestereo computations in macaque primary visual cortex J. Neuroscience 29(50):15780-15795.
Sasaki Y, Watanabe T. (2004) The primary visual cortex fills in color. PNAS, 101 (52): 18251-18256.
von der Heydt, Friedman HS, Zhou H (2003) Searching for the neural mechanism of colorfilling-in. In “Filling-in”: from perceptual completion to cortical reorganization (Pessoa L.and de Weerd P. ed.) 106-127, New York, Oxford University Press.
Wachtler T, Sejnowski TJ and Albright TD (2003) Representation of color stimuli in awakemacaque primary visual cortex. Neuron, 37, 681-691.
Fregnac Y. (2003) Neurogeometry and entoptic visions of the functional architecture of thebrain, J Physiol Paris 97: 87-92, (2003)
Zipser K, Lamme VAF, and Schiller P (1996) Contextual Modulation in Primary Visual Cor-tex. Journal of Neuroscience, 16(22): 7376-7389;