1
CaAtlas: an immunopeptidome atlas of human cancer Xinpei Yi, Yuxing Liao, Kai Li, Bo Wen, Bing Zhang Department of Molecular and Human Genetics, Lester and Sue Smith Breast Center, Baylor College of Medicine, Houston, TX, USA Abstract Human cancer antigen atlas (caAtlas) is a comprehensive resource developed through extensive collection and analysis of publicly available immunopeptidome datasets from human cancer cell lines and tumor tissues from 9 different cancer types. To allow identification of putative tumor antigens inlcuding antigens with modifica- tions, we used an open search tool. In total, we identified almost 370,000 antigens, which is 60% more of HLA class I peptides than those in SysteMHC Atlas and tripled the number of HLA class II peptides. To identify neoantigens from the cancer immunopeptidomes, we developed Neo- Query on the basis of PepQuery. The antigens we identified included a substantial number of neoantigens C/T antigens cancer-associated antigens. Peptides from these verified antigen genes by caAtlas are potential therapeutic targets for cancer immunotherapy. We created a web resource named caAtlas (http://www.zhang-lab.org/ caatlas/) to make all these data easily available and accessible to the broad cancer research community. Construction of a comprehensive immunopeptidome atlas of human cancer 10 4 10 5 10 6 PXD008984 PXD003790 PXD008127 PXD008937 PXD011766 PXD004894 PXD009925 PXD006939 PXD009751 PXD009749 PXD009750 PXD009753 PXD010808 PXD000394 PXD012083 PXD007935 PXD005704 PXD010808 PXD004746 PXD007635 PXD000394 PXD009738 PXD009752 PXD009754 PXD009755 PXD009935 PXD000394 PXD008570 PXD006534 PXD007203 PXD008572 PXD008571 PXD001898 PXD006215 PXD000394 PXD009738 PXD004233 PXD002439 PXD001205 PXD011723 PXD008500 PXD012348 PXD007679 PXD005231 PXD009531 PXD008127 PXD004023 MSV000080527 Breast Cancer Colon Carcinoma Glioblastoma Leukemia Lung Cancer Lymphoma Melanoma Meningioma nonCancer Ovarian Cancer 0 50000 100000 150000 nonCancer Colon Carcinoma Breast Cancer Lung Cancer Ovarian Cancer Leukemia Glioblastoma Lymphoma Melanoma Meningioma 2000000 1500000 1000000 500000 0 #PSM #Peptide 1,052,731 1,026,991 672,414 295,497 287,743 109,585 75,811 71,188 14,409 2,152,328 164,717 111,118 69,900 43,509 40,720 8,368 17,154 17,128 4,392 158,658 8,189,718 5,099,093 4,001,889 2,800,393 2,799,266 2,381,468 706,337 589,883 152,872 18,991,018 45,711,937 MS/MS 42 datasets 32 Class I, 3 Class II, 7 both 45.7M MS/MS Open Search 5.8M PSMs (FDR<1%) 364,283 peptides (FDR<1%) on 14,858 proteins to 16,059 proteins #Pept i de Length (a.a) Dataset publication time Cumulative #peptides A B C F G 102,516 26,488 13,554 caAtlas SysteMHC Atlas SysteMHC Atlas caAtlas E D 143,986 112,587 46,478 Class I Class II Figure 1:(A). MS/MS spectra numbers of the immunopeptidomics datasets included in this study and summary peptide identification results.(B). The distributions of PSM and peptide corresponding to 9 different cancer types and non-cancerous samples, respectively. (C). Typical length distribution of HLA class I and HLA class II peptides. (D) Comparison of the HLA class I peptide numbers between this study and SysteMHC Atlas. (E) Comparison of the HLA class II unique peptide numbers between this study and SysteMHC Atlas. (F) Cumulative number of all distinct HLA class I peptides as a function of dataset publication time. Each dataset is denoted as dataset ID: dataset public time (#peptides).(G) Cumulative number of distinct peptides for each of the top nine HLA class I alleles as a function of dataset publication time. Neoantigens & C/T antigens & Cancer-associated antigens verified by caAtlas Neoantigens AADAC_S285F (HLA-C*07:02, 0.01%) AQP7_A8T (HLA-A*03:01,HLA-A*68:01, 0.04%) ATAD3B_F86L (HLA-B*15:17,HLA-C*15:05, 0.03%) ATP2B2_R592C (HLA-A*03:01, 0.03%) C11orf68_Q154R (HLA-A*11:01, 0.03%) CASC5_R43T (HLA-A*11:01,HLA-A*68:01, 0.02%) CD86_A97T (HLA-A*03:01, 0.02%) CMYA5_A3318V (HLA-B*08:01, 0.02%) COG4_T85I (HLA-B*44:02, 0.03%) COL14A1_R226Q (HLA-A*02:05,HLA-C*12:03, 0.02) CRB1_L670F (HLA-A*68:01, 0.01%) DCAF4L1_R125Q (HLA-B*07:02, 0.02%) DGKI_R723C (HLA-B*08:01, 0.04%) F7_T350M (HLA-A*02:01,HLA-A*02:05,HLA-A*02:06, 0.02%) FANK1_A147T (HLA-B*07:02, 0.02%) FCGBP_D4906H (HLA-A*02:01, 0.04%) GADL1_G206V (HLA-B*08:01, 0.02%) GALP_V6I (HLA-B*07:02, 0.02%) GFPT2_T15M (HLA-B*07:02,HLA-B*08:01, 0.03%) GRM5_S71Y (HLA-A*24:02, 0.01%) HADH_L145P (HLA-A*11:01,HLA-B*44:02, 0.03%) HCRTR2_K370I (HLA-A*24:02, 0.01%) HGFAC_D595N (HLA-A*03:01, 0.01%) IGHV1OR21−1_T110K (HLA-A*01:01, 0.02%) KCNJ3_R439Q (HLA-B*51:01, 0.02%) LCP1_K102E (HLA-B*49:01, 0.05%) MOBP_E20K (HLA-A*03:01,HLA-A*11:01, 0.01%) NAGA_R287L (HLA-A*02:01, 0.01%) PCDHA3_E253K (HLA-A*03:01, 0.03%) PCDHGB7_A509V (HLA-A*31:01,HLA-A*68:01, 0.01%) PLAG1_S197L (HLA-A*03:01, 0.01%) POM121L12_A270V (HLA-A*02:01,HLA-A*68:01, 0.04%) PPFIBP2_R500G (HLA-A*03:01, 0.03%) PXDNL_G382E (HLA-B*15:01,HLA-C*12:03, 0.01%) RIMS1_S582L (HLA-B*07:02, 0.01%) SACS_L328F (HLA-A*24:02,HLA-A*68:01, 0.01%) SELP_R56C (HLA-A*01:01, 0.01%) SORCS3_S95L (HLA-A*02:01,HLA-A*02:06,HLA-B*07:02, 0.03%) SPCS1_P41A (HLA-A*68:01, 0.05%) STOM_D17N (HLA-A*68:01, 0.01%) SYNE2_D3286H (HLA-B*35:01, 0.04%) SZT2_P1826L (HLA-A*02:01,HLA-A*68:01, 0.01%) TCEB1_T41M (HLA-A*02:01,HLA-C*12:03, 0.02%) TNNC1_D44N (HLA-A*03:01, 0.02%) TPTE_P448S (HLA-A*01:01, 0.02%) TPTE_T273N (HLA-B*07:02, 0.01%) TROAP_G280D (HLA-A*68:01, 0.01%) UBR4_R849C (HLA-A*02:01,HLA-A*02:20, 0.01%) USE1_L113S (HLA-A*68:01, 0.03%) ZNF600_S161F (HLA-A*23:01,HLA-A*24:02, 0.02%) C5AR2_V122I (HLA-A*02:01,HLA-A*02:20, 0.01%) CHRD_T339M (HLA-A*03:01, 0.01%) COL6A3_T2868I (HLA-A*03:01, 0.06%) ECEL1_R296Q (HLA-C*07:02,HLA-C*12:03, 0.02%) ELP2_Q153H (HLA-A*24:02,HLA-A*32:01, 0.01%) GPR112_D217Y (HLA-B*15:01,HLA-B*58:01, 0.01%) GRIN2D_S644L (HLA-A*68:01, 0.01%) GRM8_D145N (HLA-B*07:02, 0.02%) IL37_E122K (HLA-A*03:01, 0.02%) LILRB4_Q414R (HLA-A*03:01,HLA-A*68:01, 0.02%) MYH3_D718N (HLA-A*03:01, 0.01%) PLEC_S2677P (HLA-B*07:02, 0.03%) RRBP1_R665L (HLA-A*02:01, 0.04%) SLC35A2_A81V (HLA-A*02:01, HLA-C*03:04, 0.01%) TREX2_V56I (HLA-A*02:01, 0.01%) ZFP42_T270M (HLA-A*03:01,HLA-A*68:01, 0.02%) CDKN2A_Q50R (HLA-A*31:01,HLA-B*07:02,HLA-C*07:02, 0.01%) CUEDC1_E321K (HLA-A*03:01, 0.01%) DSCAML1_V1182I (HLA-A*03:01, 0.02%) ENTPD6_K94E (HLA-A*02:01,HLA-A*03:01,HLA-B*40:01, 0.03%) ITGB2_Q354H (HLA-A*68:01,HLA-B*15:01,HLA-B*40:01, 0.03%) NAALADL2_S393L (HLA-B*07:02, 0.01%) PRDM9_D871N (HLA-A*68:01, 0.02%) PVR_E6K (HLA-A*03:01, 0.02%) HMGXB3_A456V (HLA-B*07:02; 0.02%) 0 2 4 6 8 #Sample CancerType BreastCancer ColonCarcinoma Glioblastoma Leukemia LungCancer Lymphoma Melanoma Meningioma OvarianCancer HMGXB3_A456V (HLA-B*07:02,9.68nM) ITGB2_Q354H (HLA-A*68:01,24.65nM) ANKLE2_G246A (HLA-B*35:08,36.68nM) A B Figure 2:Neoantigens verified by HLA class I immunopep- tidome of cancer samples.(A) Somatic mutations supported by immunopeptidomics data from three or more tumor samples. The identified HLA Alleles and the frequencies of these mutations in ICGC are list on the left. (B) Anno- tated spectra of the three neoantigen peptides in (A). C/T antigens DAZL DDX53 FATE1 HORMAD1 MAEL MAGEB1 PAGE1 PASD1 PIWIL2 SPAG6 SPANXB1 SPANXN2 SPERT SSX1 SSX4 SYCP1 CCDC62 CSAG1 CT47A1 CTAG1A IGSF11 LY6K MAGEA10 PAGE2 PAGE5 SSX2 SSX3 SYCE1 TDRD1 ACRBP IL13RA2 RGS22 GAGE5 SPEF2 MAGEC1 MROH2B SPAG4 MAGEA11 MAGEC2 SPAG17 ANKRD45 ROPN1 0 5 10 #Sample CancerType BreastCancer Glioblastoma Leukemia LungCancer Lymphoma Melanoma Meningioma OvarianCancer CT antigens database Testis specific proteins Adipose - Subcutaneous Adipose - Visceral (Omentum) Adrenal Gland Artery - Aorta Artery - Coronary Artery - Tibial Bladder Brain - Amygdala Brain - Anterior cingulate cortex (BA24) Brain - Caudate (basal ganglia) Brain - Cerebellar Hemisphere Brain - Cerebellum Brain - Cortex Brain - Frontal Cortex (BA9) Brain - Hippocampus Brain - Hypothalamus Brain - Nucleus accumbens (basal ganglia) Brain - Putamen (basal ganglia) Brain - Spinal cord (cervical c-1) Brain - Substantia nigra Breast - Mammary Tissue Cells - Cultured fibroblasts Cells - EBV-transformed lymphocytes Cervix - Ectocervix Cervix - Endocervix Colon - Sigmoid Colon - Transverse Esophagus - Gastroesophageal Junction Esophagus - Mucosa Esophagus - Muscularis Fallopian Tube Heart - Atrial Appendage Heart - Left Ventricle Kidney - Cortex Kidney - Medulla Liver Lung Minor Salivary Gland Muscle - Skeletal Nerve - Tibial Ovary Pancreas Pituitary Prostate Skin - Not Sun Exposed (Suprapubic) Skin - Sun Exposed (Lower leg) Small Intestine - Terminal Ileum Spleen Stomach Testis Thyroid Uterus Vagina Whole Blood 0 20 40 60 80 100 120 TPM Gene expression for MROH2B (ENSG00000171495.16) Adipose - Subcutaneous Adipose - Visceral (Omentum) Adrenal Gland Artery - Aorta Artery - Coronary Artery - Tibial Bladder Brain - Amygdala Brain - Anterior cingulate cortex (BA24) Brain - Caudate (basal ganglia) Brain - Cerebellar Hemisphere Brain - Cerebellum Brain - Cortex Brain - Frontal Cortex (BA9) Brain - Hippocampus Brain - Hypothalamus Brain - Nucleus accumbens (basal ganglia) Brain - Putamen (basal ganglia) Brain - Spinal cord (cervical c-1) Brain - Substantia nigra Breast - Mammary Tissue Cells - Cultured fibroblasts Cells - EBV-transformed lymphocytes Cervix - Ectocervix Cervix - Endocervix Colon - Sigmoid Colon - Transverse Esophagus - Gastroesophageal Junction Esophagus - Mucosa Esophagus - Muscularis Fallopian Tube Heart - Atrial Appendage Heart - Left Ventricle Kidney - Cortex Kidney - Medulla Liver Lung Minor Salivary Gland Muscle - Skeletal Nerve - Tibial Ovary Pancreas Pituitary Prostate Skin - Not Sun Exposed (Suprapubic) Skin - Sun Exposed (Lower leg) Small Intestine - Terminal Ileum Spleen Stomach Testis Thyroid Uterus Vagina Whole Blood 0 100 200 300 400 TPM Gene expression for SPERT (ENSG00000174015.9) Adipose - Subcutaneous Adipose - Visceral (Omentum) Adrenal Gland Artery - Aorta Artery - Coronary Artery - Tibial Bladder Brain - Amygdala Brain - Anterior cingulate cortex (BA24) Brain - Caudate (basal ganglia) Brain - Cerebellar Hemisphere Brain - Cerebellum Brain - Cortex Brain - Frontal Cortex (BA9) Brain - Hippocampus Brain - Hypothalamus Brain - Nucleus accumbens (basal ganglia) Brain - Putamen (basal ganglia) Brain - Spinal cord (cervical c-1) Brain - Substantia nigra Breast - Mammary Tissue Cells - Cultured fibroblasts Cells - EBV-transformed lymphocytes Cervix - Ectocervix Cervix - Endocervix Colon - Sigmoid Colon - Transverse Esophagus - Gastroesophageal Junction Esophagus - Mucosa Esophagus - Muscularis Fallopian Tube Heart - Atrial Appendage Heart - Left Ventricle Kidney - Cortex Kidney - Medulla Liver Lung Minor Salivary Gland Muscle - Skeletal Nerve - Tibial Ovary Pancreas Pituitary Prostate Skin - Not Sun Exposed (Suprapubic) Skin - Sun Exposed (Lower leg) Small Intestine - Terminal Ileum Spleen Stomach Testis Thyroid Uterus Vagina Whole Blood 0 50 100 150 TPM Gene expression for DAZL (ENSG00000092345.13) A B C D Figure 3:42 CT antigens from the CT antigens database and the GTEx-supported testis-specific proteins with the antigen source genes in caAtlas identified in tumor samples but not normal samples. The gene expression distribution among all the 54 normal tissues from GTEx for the 3 pre- viously unrecognized CT antigens. Cancer-associated antigens Area (%) Gene count ANO4 ART3 BAALC CCL19 CD300LD CHRNA1 CSAG1 CTAG1A FAM178B FBLN7 FGF13 IGSF11 IL12RB2 KCNK3 LRFN4 MAGEA10 MDGA2 NANOS1 NANP NBL1 NR0B1 NTM PAGE5 PDXP PI15 PTCHD4 RAMP1 RNF128 SCUBE2 SHISA2 SLC7A10 SORCS1 SOSTDC1 SULT1C2 THEM4 TRIM48 TRIQK XAGE1A CCL18 DNASE2B FAM210B GPR158 IGLV3−12 NOL4L NUDT17 RBP5 SDSL SLC24A4 BFSP1 GORAB KLHL38 MMP15 SLITRK2 CYP11B1 MAGEC1 RLBP1 SOX6 STK32A TRIM51 TRIM63 UCN2 TMEM144 TSPAN10 TYRP1 MAGEC2 MLANA ST3GAL6 KCNJ5 SLC45A2 DCT ROPN1 ROPN1B TYR 0 5 10 15 #Sample 0 10000 20000 30000 40000 50000 Sign(Log2FC) x log10(p value) 200 -200 0 100 Frequency of samples (%) 50 0 50 100 Melanoma nonMelanoma CT antigens database Testis specific proteins A B C Figure 4:Differential analysis of antigens between melanoma samples and non-melanoma samples. Gene names for the 73 melanoma-associated genes which are significantly higher expression in the TCGA melanoma samples compared to GTEx normal skin tissues and sorted by sample numbers. Open-pFind showed relatively higher sensitivity and specificity 4719 2355 2235 1755 1596 1347 1201 966 851 827 633 628 613 610 562 561 556 473 414 400 335 300 286 236215194187186173160155153 117103 95 93 78 77 65 64 0 1000 2000 3000 4000 5000 Results of six different search engines open-pFind SysteMHC Atlas MS-GF+ Comet MaxQuant X!Tandem 0 5000 10000 15000 20000 #Peptides 80% 76% 85% 90% 93% 2125 1091 873 867 866 811 750 625 578 573 563 539 520 490 478 350 317 256 248 195 195 194 186 181 159 148138135132127124121 69 56 51 45 41 37 32 31 0 500 1000 1500 2000 Results of six different search engines open-pFind SysteMHC Atlas Comet MaxQuant MS-GF+ X!Tandem 0 3000 6000 9000 #Peptides 70% 76% 80% 70% 91% A B 20205 18897 16856 15420 12510 7777 10645 8162 7964 6058 5464 1965 Overlap Open−pFind SysteMHC Atlas MS−GF+ Comet MaxQuant X!Tandem 100 75 50 25 0 0 25 50 75 100 82 (3857/4719) 79 (15914/20205) 78 (14806/18897) 81 (13684/16856) 79 (12215/15420) 80 (9953/12510) 80 (6218/7777) 31 (29/93) 58 (272/473) 54 (161/300) 78 (1373/1755) 57 (772/1347) 71 (1661/2355) 82 (3857/4719) HLA-binder percentage (%) Total identifications Unique identifications Overlap Open−pFind SysteMHC Atlas MS−GF+ Comet MaxQuant X!Tandem 100 75 50 25 0 0 25 50 75 100 HLA-binder percentage (%) Total identifications Unique identifications 84 (1641/1965) 82 (4983/6058) 83 (6587/7964) 81 (4449/5464) 84 (6852/8162) 83 (8845/10645) 84 (735/873) 35 (13/37) 68 (391/573) 71 (412/578) 76 (655/867) 77 (837/1091) 80 (1693/2125) 84 (735/873) Mel 15 Mel 16 C D Figure 5:Open-pFind produces relatively higher sensitivity and specificity compared to four other search engines and SysteMHC Atlas in peptide identification from HLA class I data, and thus was selected for further analyses in this study. Data dissemination through caAtlas Figure 6:CaAtlas web resource: http://www.zhang-lab.org/caatlas/. All antigens are searchable by gene symbol, protein name, or protein ID. Moreover, neoantigens, CT antigens, and cancer-associated antigens, are browsable in three separate lists, in which the antigen source genes can be sorted by sample number or associated cancer type Conclusion CaAtlas expanded immunopeptidomics validated neoantigens from a few dozens in the existing literature to more than 3,000. CaAtlas provided direct evidence to support tumor specific-presentation of some known and putative novel CT antigens and also revealed non- tumor-specific presentation of some previously annotated CT antigens. CaAtlas provided direct mass spectrum evidence to support known and putative novel tumor-associated differentiation or overexpressed antigen genes. CaAtlas website allows users to manually check and download the mass spectrum matching results for all antigens identified in this study. Acknowledgements: This study was supported by the Cancer Prevention and Research Institute of Texas (CPRIT) award RR160027, and funding from the McNair Medical Institute at The Robert and Janice McNair Foundation.

Xinpei Yi, Yuxing Liao, Kai Li, Bo Wen, Bing Zhang

  • Upload
    others

  • View
    6

  • Download
    0

Embed Size (px)

Citation preview

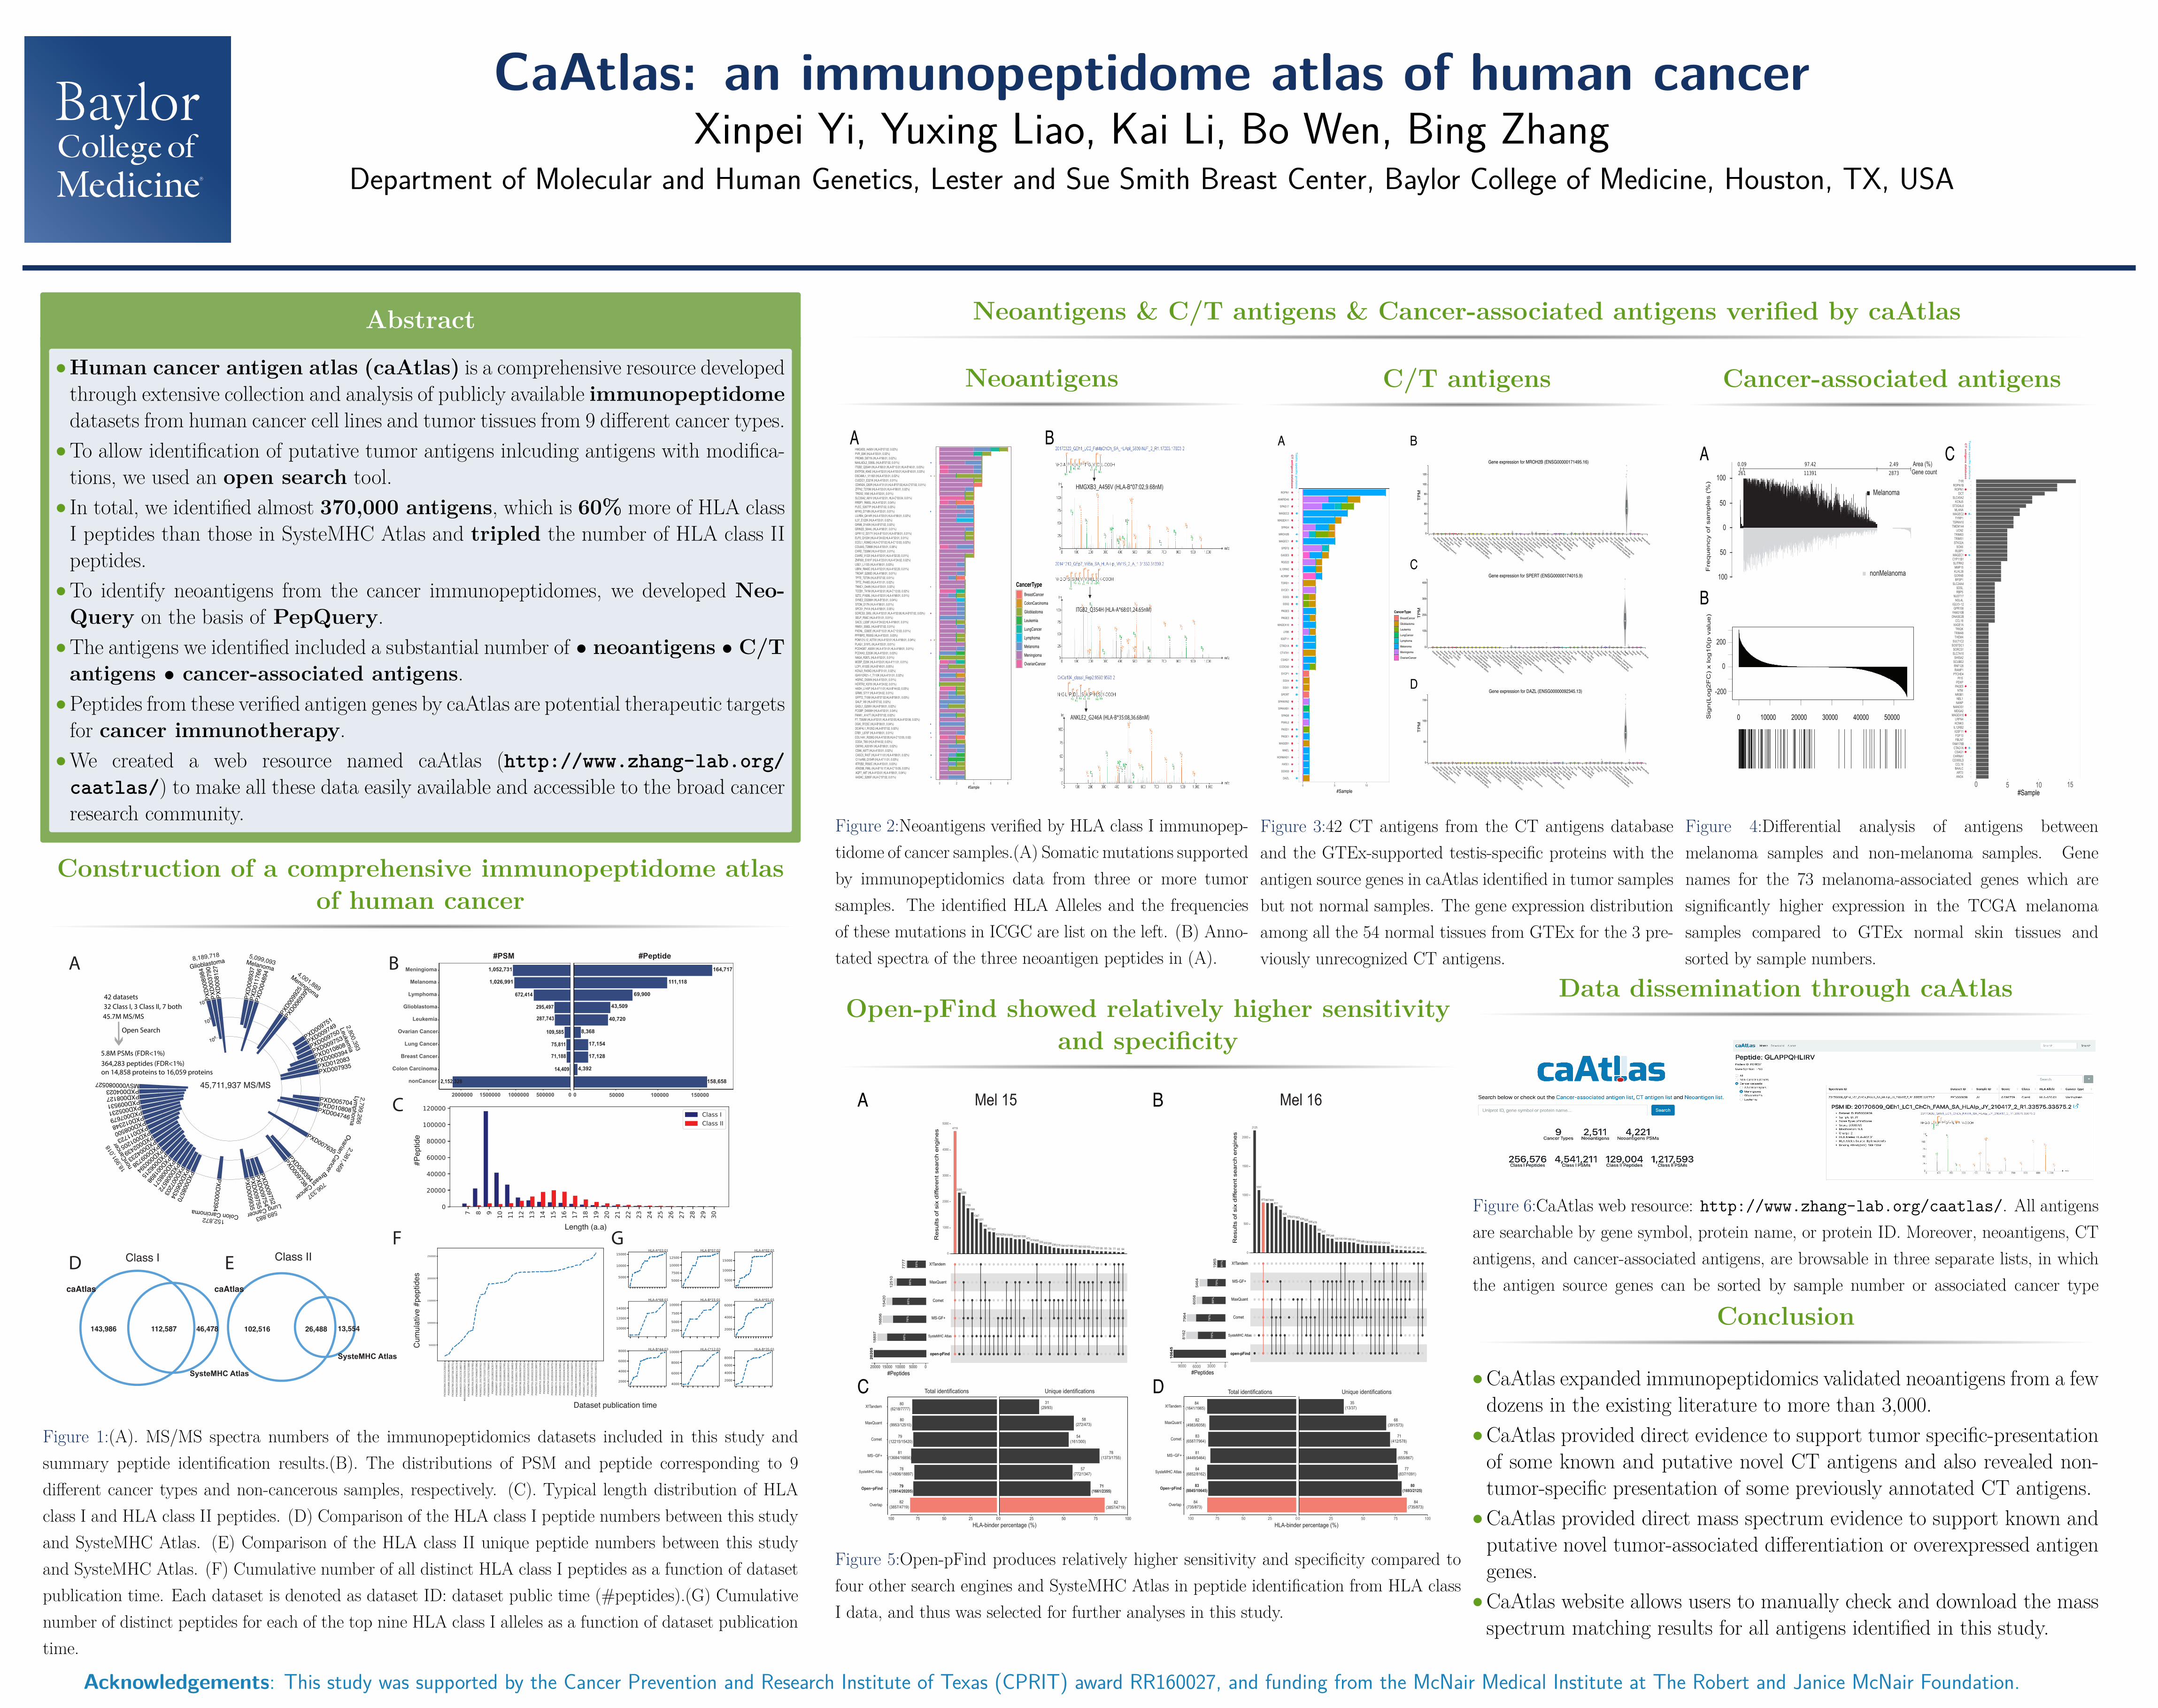
CaAtlas: an immunopeptidome atlas of human cancerXinpei Yi, Yuxing Liao, Kai Li, Bo Wen, Bing Zhang

Department of Molecular and Human Genetics, Lester and Sue Smith Breast Center, Baylor College of Medicine, Houston, TX, USA

Abstract

• Human cancer antigen atlas (caAtlas) is a comprehensive resource developedthrough extensive collection and analysis of publicly available immunopeptidomedatasets from human cancer cell lines and tumor tissues from 9 different cancer types.

• To allow identification of putative tumor antigens inlcuding antigens with modifica-tions, we used an open search tool.

• In total, we identified almost 370,000 antigens, which is 60% more of HLA classI peptides than those in SysteMHC Atlas and tripled the number of HLA class IIpeptides.

• To identify neoantigens from the cancer immunopeptidomes, we developed Neo-Query on the basis of PepQuery.

• The antigens we identified included a substantial number of • neoantigens • C/Tantigens • cancer-associated antigens.

• Peptides from these verified antigen genes by caAtlas are potential therapeutic targetsfor cancer immunotherapy.

• We created a web resource named caAtlas (http://www.zhang-lab.org/caatlas/) to make all these data easily available and accessible to the broad cancerresearch community.

Construction of a comprehensive immunopeptidome atlasof human cancer

104

105

106

PX

D008984

PX

D003790

PX

D008127

PX

D008937

PX

D011766

PX

D004894

PXD

0099

25

PXD

0069

39

PXD009751

PXD009749

PXD009750

PXD009753

PXD010808

PXD000394

PXD012083

PXD007935

PXD005704PXD010808PXD004746

PXD007635

PXD000394

PXD

009738

PX

D009752

PX

D009754

PX

D009755

PX

D009935

PX

D000394

PX

D008570

PX

D006534

PX

D007203

PXD

008572

PXD

008571

PXD001898

PXD006215

PXD000394

PXD009738

PXD004233

PXD002439

PXD001205

PXD011723

PXD008500

PXD012348

PXD007679

PXD005231

PXD009531

PXD008127

PXD004023MSV000080527

Breast Cancer

Colon Carcinoma

Glioblastoma

Leuke

mia

Lung Cancer

Lym

phom

a

Melanoma

Meningiom

a

nonC

ance

r

Ovarian C

ancer

0 50000 100000 150000

nonCancer

Colon Carcinoma

Breast Cancer

Lung Cancer

Ovarian Cancer

Leukemia

Glioblastoma

Lymphoma

Melanoma

Meningioma

2000000 1500000 1000000 500000 0

#PSM #Peptide

1,052,731

1,026,991

672,414

295,497

287,743

109,585

75,811

71,188

14,409

2,152,328

164,717

111,118

69,900

43,509

40,720

8,368

17,154

17,128

4,392

158,658

8,189,718 5,099,093

4,001,889

2,8

00,3

93

2,7

99,2

66

2,381,468

706,337

589,883152,872

18,9

91,0

18

45,711,937 MS/MS

42 datasets

32 Class I, 3 Class II, 7 both

45.7M MS/MS

Open Search

5.8M PSMs (FDR<1%)

364,283 peptides (FDR<1%)

on 14,858 proteins to 16,059 proteins

#P

ep

tid

e

Length (a.a)

Dataset publication time

Cu

mu

lative

#p

ep

tid

es

A B

C

F G

102,516 26,488 13,554

caAtlas

SysteMHC Atlas

SysteMHC Atlas

caAtlas

ED

143,986 112,587 46,478

Class I Class II

Figure 1:(A). MS/MS spectra numbers of the immunopeptidomics datasets included in this study andsummary peptide identification results.(B). The distributions of PSM and peptide corresponding to 9different cancer types and non-cancerous samples, respectively. (C). Typical length distribution of HLAclass I and HLA class II peptides. (D) Comparison of the HLA class I peptide numbers between this studyand SysteMHC Atlas. (E) Comparison of the HLA class II unique peptide numbers between this studyand SysteMHC Atlas. (F) Cumulative number of all distinct HLA class I peptides as a function of datasetpublication time. Each dataset is denoted as dataset ID: dataset public time (#peptides).(G) Cumulativenumber of distinct peptides for each of the top nine HLA class I alleles as a function of dataset publicationtime.

Neoantigens & C/T antigens & Cancer-associated antigens verified by caAtlas

Neoantigens

AADAC_S285F (HLA-C*07:02, 0.01%) • AQP7_A8T (HLA-A*03:01,HLA-A*68:01, 0.04%)ATAD3B_F86L (HLA-B*15:17,HLA-C*15:05, 0.03%)ATP2B2_R592C (HLA-A*03:01, 0.03%)C11orf68_Q154R (HLA-A*11:01, 0.03%)CASC5_R43T (HLA-A*11:01,HLA-A*68:01, 0.02%) • CD86_A97T (HLA-A*03:01, 0.02%)CMYA5_A3318V (HLA-B*08:01, 0.02%)COG4_T85I (HLA-B*44:02, 0.03%)COL14A1_R226Q (HLA-A*02:05,HLA-C*12:03, 0.02) • CRB1_L670F (HLA-A*68:01, 0.01%) • DCAF4L1_R125Q (HLA-B*07:02, 0.02%)DGKI_R723C (HLA-B*08:01, 0.04%) • F7_T350M (HLA-A*02:01,HLA-A*02:05,HLA-A*02:06, 0.02%)FANK1_A147T (HLA-B*07:02, 0.02%)FCGBP_D4906H (HLA-A*02:01, 0.04%)GADL1_G206V (HLA-B*08:01, 0.02%)GALP_V6I (HLA-B*07:02, 0.02%)GFPT2_T15M (HLA-B*07:02,HLA-B*08:01, 0.03%)GRM5_S71Y (HLA-A*24:02, 0.01%)HADH_L145P (HLA-A*11:01,HLA-B*44:02, 0.03%)HCRTR2_K370I (HLA-A*24:02, 0.01%)HGFAC_D595N (HLA-A*03:01, 0.01%)IGHV1OR21−1_T110K (HLA-A*01:01, 0.02%)KCNJ3_R439Q (HLA-B*51:01, 0.02%)LCP1_K102E (HLA-B*49:01, 0.05%)MOBP_E20K (HLA-A*03:01,HLA-A*11:01, 0.01%)NAGA_R287L (HLA-A*02:01, 0.01%)PCDHA3_E253K (HLA-A*03:01, 0.03%) • PCDHGB7_A509V (HLA-A*31:01,HLA-A*68:01, 0.01%)PLAG1_S197L (HLA-A*03:01, 0.01%)POM121L12_A270V (HLA-A*02:01,HLA-A*68:01, 0.04%) • • PPFIBP2_R500G (HLA-A*03:01, 0.03%)PXDNL_G382E (HLA-B*15:01,HLA-C*12:03, 0.01%)RIMS1_S582L (HLA-B*07:02, 0.01%)SACS_L328F (HLA-A*24:02,HLA-A*68:01, 0.01%)SELP_R56C (HLA-A*01:01, 0.01%)SORCS3_S95L (HLA-A*02:01,HLA-A*02:06,HLA-B*07:02, 0.03%) • SPCS1_P41A (HLA-A*68:01, 0.05%)STOM_D17N (HLA-A*68:01, 0.01%)SYNE2_D3286H (HLA-B*35:01, 0.04%) • SZT2_P1826L (HLA-A*02:01,HLA-A*68:01, 0.01%)TCEB1_T41M (HLA-A*02:01,HLA-C*12:03, 0.02%)TNNC1_D44N (HLA-A*03:01, 0.02%) • TPTE_P448S (HLA-A*01:01, 0.02%)TPTE_T273N (HLA-B*07:02, 0.01%)TROAP_G280D (HLA-A*68:01, 0.01%)UBR4_R849C (HLA-A*02:01,HLA-A*02:20, 0.01%)USE1_L113S (HLA-A*68:01, 0.03%)ZNF600_S161F (HLA-A*23:01,HLA-A*24:02, 0.02%)C5AR2_V122I (HLA-A*02:01,HLA-A*02:20, 0.01%)CHRD_T339M (HLA-A*03:01, 0.01%)COL6A3_T2868I (HLA-A*03:01, 0.06%)ECEL1_R296Q (HLA-C*07:02,HLA-C*12:03, 0.02%)ELP2_Q153H (HLA-A*24:02,HLA-A*32:01, 0.01%)GPR112_D217Y (HLA-B*15:01,HLA-B*58:01, 0.01%)GRIN2D_S644L (HLA-A*68:01, 0.01%)GRM8_D145N (HLA-B*07:02, 0.02%)IL37_E122K (HLA-A*03:01, 0.02%)LILRB4_Q414R (HLA-A*03:01,HLA-A*68:01, 0.02%)MYH3_D718N (HLA-A*03:01, 0.01%) • PLEC_S2677P (HLA-B*07:02, 0.03%)RRBP1_R665L (HLA-A*02:01, 0.04%)SLC35A2_A81V (HLA-A*02:01, HLA-C*03:04, 0.01%)TREX2_V56I (HLA-A*02:01, 0.01%)ZFP42_T270M (HLA-A*03:01,HLA-A*68:01, 0.02%)CDKN2A_Q50R (HLA-A*31:01,HLA-B*07:02,HLA-C*07:02, 0.01%)CUEDC1_E321K (HLA-A*03:01, 0.01%)DSCAML1_V1182I (HLA-A*03:01, 0.02%) • • ENTPD6_K94E (HLA-A*02:01,HLA-A*03:01,HLA-B*40:01, 0.03%)ITGB2_Q354H (HLA-A*68:01,HLA-B*15:01,HLA-B*40:01, 0.03%)NAALADL2_S393L (HLA-B*07:02, 0.01%) • PRDM9_D871N (HLA-A*68:01, 0.02%)PVR_E6K (HLA-A*03:01, 0.02%)HMGXB3_A456V (HLA-B*07:02; 0.02%)

0 2 4 6 8#Sample

CancerTypeBreastCancer

ColonCarcinoma

Glioblastoma

Leukemia

LungCancer

Lymphoma

Melanoma

Meningioma

OvarianCancer

HMGXB3_A456V (HLA-B*07:02,9.68nM)

ITGB2_Q354H (HLA-A*68:01,24.65nM)

ANKLE2_G246A (HLA-B*35:08,36.68nM)

A B

Figure 2:Neoantigens verified by HLA class I immunopep-tidome of cancer samples.(A) Somatic mutations supportedby immunopeptidomics data from three or more tumorsamples. The identified HLA Alleles and the frequenciesof these mutations in ICGC are list on the left. (B) Anno-tated spectra of the three neoantigen peptides in (A).

C/T antigens

DAZL • •

DDX53 •

FATE1 •

HORMAD1 •

MAEL •

MAGEB1 •

PAGE1 • •

PASD1 • •

PIWIL2 •

SPAG6 •

SPANXB1 •

SPANXN2 •

SPERT • •

SSX1 • •

SSX4 • •

SYCP1 • •

CCDC62 •

CSAG1 •

CT47A1 •

CTAG1A • •

IGSF11 •

LY6K •

MAGEA10 •

PAGE2 •

PAGE5 •

SSX2 • •

SSX3 • •

SYCE1 •

TDRD1 •

ACRBP •

IL13RA2 •

RGS22 •

GAGE5 •

SPEF2 •

MAGEC1 • •

MROH2B • •

SPAG4 •

MAGEA11 •

MAGEC2 • •

SPAG17 •

ANKRD45 •

ROPN1 •

0 5 10

#Sample

CancerTypeBreastCancer

Glioblastoma

Leukemia

LungCancer

Lymphoma

Melanoma

Meningioma

OvarianCancer

CT

antig

ens d

atabase

Testis sp

ecific pro

teins

Adipose - Subcutaneous

Adipose - Visceral (Omentum)

Adrenal Gland

Artery - Aorta

Artery - Coronary

Artery - Tibial

Bladder

Brain - Amygdala

Brain - Anterior cingulate cortex (BA24)

Brain - Caudate (basal ganglia)

Brain - Cerebellar Hemisphere

Brain - Cerebellum

Brain - Cortex

Brain - Frontal Cortex (BA9)

Brain - Hippocampus

Brain - Hypothalamus

Brain - Nucleus accumbens (basal ganglia)

Brain - Putamen (basal ganglia)

Brain - Spinal cord (cervical c-1)

Brain - Substantia nigra

Breast - Mammary Tissue

Cells - Cultured fibroblasts

Cells - EBV-transformed lymphocytes

Cervix - Ectocervix

Cervix - Endocervix

Colon - Sigmoid

Colon - Transverse

Esophagus - Gastroesophageal Junction

Esophagus - Mucosa

Esophagus - Muscularis

Fallopian Tube

Heart - Atrial Appendage

Heart - Left Ventricle

Kidney - Cortex

Kidney - Medulla

LiverLung

Minor Salivary Gland

Muscle - Skeletal

Nerve - Tibial

OvaryPancreas

Pituitary

Prostate

Skin - Not Sun Exposed (Suprapubic)

Skin - Sun Exposed (Lower leg)

Small Intestine - Terminal Ileum

SpleenStomach

TestisThyroid

UterusVagina

Whole Blood

0

20

40

60

80

100

120

TP

M

Gene expression for MROH2B (ENSG00000171495.16)

Adipose - Subcutaneous

Adipose - Visceral (Omentum)

Adrenal Gland

Artery - Aorta

Artery - Coronary

Artery - Tibial

Bladder

Brain - Amygdala

Brain - Anterior cingulate cortex (BA24)

Brain - Caudate (basal ganglia)

Brain - Cerebellar Hemisphere

Brain - Cerebellum

Brain - Cortex

Brain - Frontal Cortex (BA9)

Brain - Hippocampus

Brain - Hypothalamus

Brain - Nucleus accumbens (basal ganglia)

Brain - Putamen (basal ganglia)

Brain - Spinal cord (cervical c-1)

Brain - Substantia nigra

Breast - Mammary Tissue

Cells - Cultured fibroblasts

Cells - EBV-transformed lymphocytes

Cervix - Ectocervix

Cervix - Endocervix

Colon - Sigmoid

Colon - Transverse

Esophagus - Gastroesophageal Junction

Esophagus - Mucosa

Esophagus - Muscularis

Fallopian Tube

Heart - Atrial Appendage

Heart - Left Ventricle

Kidney - Cortex

Kidney - Medulla

LiverLung

Minor Salivary Gland

Muscle - Skeletal

Nerve - Tibial

OvaryPancreas

Pituitary

Prostate

Skin - Not Sun Exposed (Suprapubic)

Skin - Sun Exposed (Lower leg)

Small Intestine - Terminal Ileum

SpleenStomach

TestisThyroid

UterusVagina

Whole Blood

0

100

200

300

400

TP

M

Gene expression for SPERT (ENSG00000174015.9)

Adipose - Subcutaneous

Adipose - Visceral (Omentum)

Adrenal Gland

Artery - Aorta

Artery - Coronary

Artery - Tibial

Bladder

Brain - Amygdala

Brain - Anterior cingulate cortex (BA24)

Brain - Caudate (basal ganglia)

Brain - Cerebellar Hemisphere

Brain - Cerebellum

Brain - Cortex

Brain - Frontal Cortex (BA9)

Brain - Hippocampus

Brain - Hypothalamus

Brain - Nucleus accumbens (basal ganglia)

Brain - Putamen (basal ganglia)

Brain - Spinal cord (cervical c-1)

Brain - Substantia nigra

Breast - Mammary Tissue

Cells - Cultured fibroblasts

Cells - EBV-transformed lymphocytes

Cervix - Ectocervix

Cervix - Endocervix

Colon - Sigmoid

Colon - Transverse

Esophagus - Gastroesophageal Junction

Esophagus - Mucosa

Esophagus - Muscularis

Fallopian Tube

Heart - Atrial Appendage

Heart - Left Ventricle

Kidney - Cortex

Kidney - Medulla

LiverLung

Minor Salivary Gland

Muscle - Skeletal

Nerve - Tibial

OvaryPancreas

Pituitary

Prostate

Skin - Not Sun Exposed (Suprapubic)

Skin - Sun Exposed (Lower leg)

Small Intestine - Terminal Ileum

SpleenStomach

TestisThyroid

UterusVagina

Whole Blood

0

50

100

150

TP

M

Gene expression for DAZL (ENSG00000092345.13)

A B

C

D

Figure 3:42 CT antigens from the CT antigens databaseand the GTEx-supported testis-specific proteins with theantigen source genes in caAtlas identified in tumor samplesbut not normal samples. The gene expression distributionamong all the 54 normal tissues from GTEx for the 3 pre-viously unrecognized CT antigens.

Cancer-associated antigens

Area (%)Gene count

ANO4ART3

BAALCCCL19

CD300LDCHRNA1

CSAG1 CTAG1A

FAM178BFBLN7FGF13

IGSF11 IL12RB2KCNK3LRFN4

MAGEA10 MDGA2

NANOS1NANPNBL1

NR0B1NTM

PAGE5 PDXP

PI15PTCHD4RAMP1RNF128SCUBE2SHISA2

SLC7A10SORCS1

SOSTDC1SULT1C2

THEM4TRIM48TRIQK

XAGE1ACCL18

DNASE2BFAM210BGPR158

IGLV3−12NOL4L

NUDT17RBP5SDSL

SLC24A4BFSP1

GORABKLHL38MMP15

SLITRK2CYP11B1MAGEC1

RLBP1SOX6

STK32ATRIM51TRIM63

UCN2TMEM144TSPAN10

TYRP1MAGEC2

MLANAST3GAL6

KCNJ5SLC45A2

DCTROPN1

ROPN1B TYR

0 5 10 15#Sample

0 10000 20000 30000 40000 50000Sig

n(L

og2F

C)

x log10(p

valu

e)

200

-200

0

100

Fre

quency o

f sam

ple

s (

%)

50

0

50

100

Melanoma

nonMelanoma

• •

• •

• • •

• •

• •

CT

an

tigen

s d

ata

base

Testis

sp

ecific

pro

tein

s

A

B

C

Figure 4:Differential analysis of antigens betweenmelanoma samples and non-melanoma samples. Genenames for the 73 melanoma-associated genes which aresignificantly higher expression in the TCGA melanomasamples compared to GTEx normal skin tissues andsorted by sample numbers.

Open-pFind showed relatively higher sensitivityand specificity

4719

23552235

17551596

13471201

966851827

633628613610562561556473414400335300286236215194187186173160155153117103 95 93 78 77 65 64

0

1000

2000

3000

4000

5000

Res

ults

of s

ix d

iffer

ent s

earc

h en

gine

s

open-pFind

SysteMHC Atlas

MS-GF+

Comet

MaxQuant

X!Tandem

05000100001500020000#Peptides

80%

76%

85%

90%

93%

2125

1091

873867866811

750

625578573563539520490478

350317

256248195195194186181159148138135132127124121

69 56 51 45 41 37 32 310

500

1000

1500

2000

Res

ults

of s

ix d

iffer

ent s

earc

h en

gine

s

open-pFind

SysteMHC Atlas

Comet

MaxQuant

MS-GF+

X!Tandem

0300060009000#Peptides

70%

76%

80%

70%

91%

A B

2020

518

897

1685

615

420

1251

0

7777

1064

5

8162

7964

6058

5464

1965

Overlap

Open−pFind

SysteMHC Atlas

MS−GF+

Comet

MaxQuant

X!Tandem

100 75 50 25 00 25 50 75 100

82(3857/4719)

79(15914/20205)

78(14806/18897)

81(13684/16856)

79(12215/15420)

80(9953/12510)

80(6218/7777)

31(29/93)

58(272/473)

54(161/300)

78(1373/1755)

57(772/1347)

71(1661/2355)

82(3857/4719)

HLA-binder percentage (%)

Total identifications Unique identifications

Overlap

Open−pFind

SysteMHC Atlas

MS−GF+

Comet

MaxQuant

X!Tandem

100 75 50 25 00 25 50 75 100

HLA-binder percentage (%)

Total identifications Unique identifications

84(1641/1965)

82(4983/6058)

83(6587/7964)

81(4449/5464)

84(6852/8162)

83(8845/10645)

84(735/873)

35(13/37)

68(391/573)

71(412/578)

76(655/867)

77(837/1091)

80(1693/2125)

84(735/873)

Mel 15 Mel 16

C D

Figure 5:Open-pFind produces relatively higher sensitivity and specificity compared tofour other search engines and SysteMHC Atlas in peptide identification from HLA classI data, and thus was selected for further analyses in this study.

Data dissemination through caAtlas

Figure 6:CaAtlas web resource: http://www.zhang-lab.org/caatlas/. All antigensare searchable by gene symbol, protein name, or protein ID. Moreover, neoantigens, CTantigens, and cancer-associated antigens, are browsable in three separate lists, in whichthe antigen source genes can be sorted by sample number or associated cancer typeinformation. Conclusion

• CaAtlas expanded immunopeptidomics validated neoantigens from a fewdozens in the existing literature to more than 3,000.

• CaAtlas provided direct evidence to support tumor specific-presentationof some known and putative novel CT antigens and also revealed non-tumor-specific presentation of some previously annotated CT antigens.

• CaAtlas provided direct mass spectrum evidence to support known andputative novel tumor-associated differentiation or overexpressed antigengenes.

• CaAtlas website allows users to manually check and download the massspectrum matching results for all antigens identified in this study.

Acknowledgements: This study was supported by the Cancer Prevention and Research Institute of Texas (CPRIT) award RR160027, and funding from the McNair Medical Institute at The Robert and Janice McNair Foundation.