Embed Size (px)
Citation preview
DATA REPORTQuarterly
F I R S T Q U A R T E R 2 0 1 7W W W . C P W R . C O M
Fall Injuries and Prevention in the Construction Industry
Xiuwen Sue Dong, DrPH*, Xuanwen Wang, PhD, Rebecca Katz, MPH, Gavin West, MPH, Jessica Bunting, MPH
KEY FINDINGS
• Between 2011 and 2015, the annual number of fall fatalities in construction increased by 36%, exceeding the growth in employment and total fatalities in this industry.
Falls are a common cause of fatal and nonfatal injuries in the construction industry. In response to the staggering number of fall-related injuries and fatalities, the National Occupational Research Agenda (NORA) Construction Sector Council, CPWR – The Center for Construction Research and Training, the National Institute for Occupational Safety and Health (NIOSH), and the Occupational Safety and Health Administration (OSHA), launched the National Fall Prevention Campaign on Workers’ Memorial Day in April of 2012. The campaign is now entering its sixth year. To support the national campaign and increase public awareness of the risk of falls in construction, this Quarterly Data Report provides updated data on fatal and nonfatal fall injuries among construction workers, focusing on the recent economic recovery and high-risk worker groups. In addition to data obtained from the U.S. Bureau of Labor Statistics (BLS), this report contains data illustrated in the Construction Fatality Map (CFM) maintained by CPWR — an accompanying product from the national campaign. While the BLS data show the overall trends of fall injuries at the national level, the numbers from the CFM present geographic variations. New findings from the National Safety Stand-Down, the major annual event associated with the fall prevention campaign, are also included, which confirm that the campaign is reaching all construction subsectors, including small residential construction companies nationwide.
• More than half (55%) of fall fatalities in construction occurred at a height of 20 feet or less.
• From 2014 to 2016, the National Safety Stand-Down events reached more than 5 million workers across the nation.
• Roofers had the highest rate of fall fatalities in construction; however, the number and rate of fatal falls in this occupation decreased in 2015.
• Falls from roofs comprised one-third of fall deaths, followed by falls from ladders (24%).
• Fall fatalities in residential construction increased from 26 deaths in 2011 to 61 deaths in 2015, more than double.
* Correspondence to: Xiuwen Sue Dong, [email protected].
• Hispanic workers, foreign-born workers, and workers aged 55 or older had an elevated risk of fatal falls.
2
www.cpwr.com
DATA REPORT 2
SECTION 1: TRENDS OF FATAL FALLS IN CONSTRUCTION
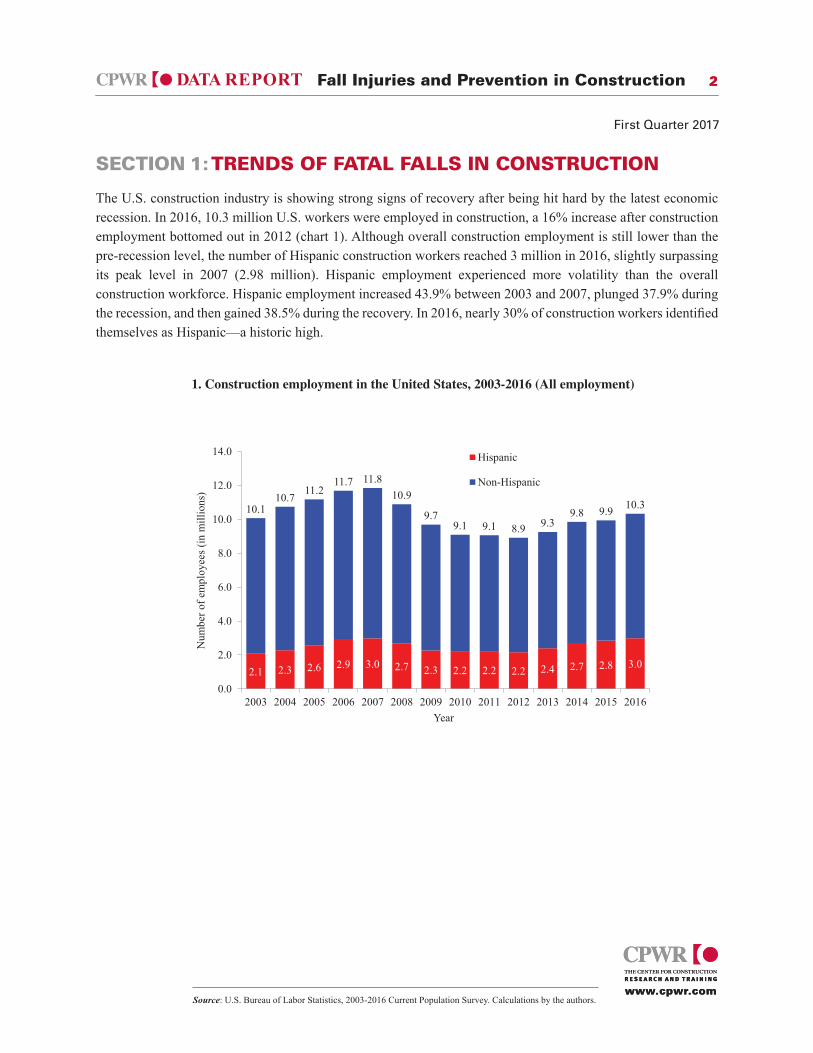
The U.S. construction industry is showing strong signs of recovery after being hit hard by the latest economic recession. In 2016, 10.3 million U.S. workers were employed in construction, a 16% increase after construction employment bottomed out in 2012 (chart 1). Although overall construction employment is still lower than the pre-recession level, the number of Hispanic construction workers reached 3 million in 2016, slightly surpassing its peak level in 2007 (2.98 million). Hispanic employment experienced more volatility than the overall construction workforce. Hispanic employment increased 43.9% between 2003 and 2007, plunged 37.9% during the recession, and then gained 38.5% during the recovery. In 2016, nearly 30% of construction workers identified themselves as Hispanic—a historic high.
Source: U.S. Bureau of Labor Statistics, 2003-2016 Current Population Survey. Calculations by the authors.
1. Construction employment in the United States, 2003-2016 (All employment)
www.cpwr.com
First Quarter 2017
Fall Injuries and Prevention in Construction
2.1 2.3 2.6 2.9 3.0 2.7 2.3 2.2 2.2 2.2 2.4 2.7 2.8 3.0
10.110.7
11.211.7 11.8
10.9
9.79.1 9.1 8.9 9.3
9.8 9.9 10.3
0.0
2.0
4.0
6.0
8.0
10.0
12.0
14.0
2003 2004 2005 2006 2007 2008 2009 2010 2011 2012 2013 2014 2015 2016
Num
ber o
f em
ploy
ees (
in m
illio
ns)
Year
Hispanic
Non-Hispanic
DATA REPORT 3
Section 1: Trends of Fatal Falls in Construction First Quarter 2017
www.cpwr.com
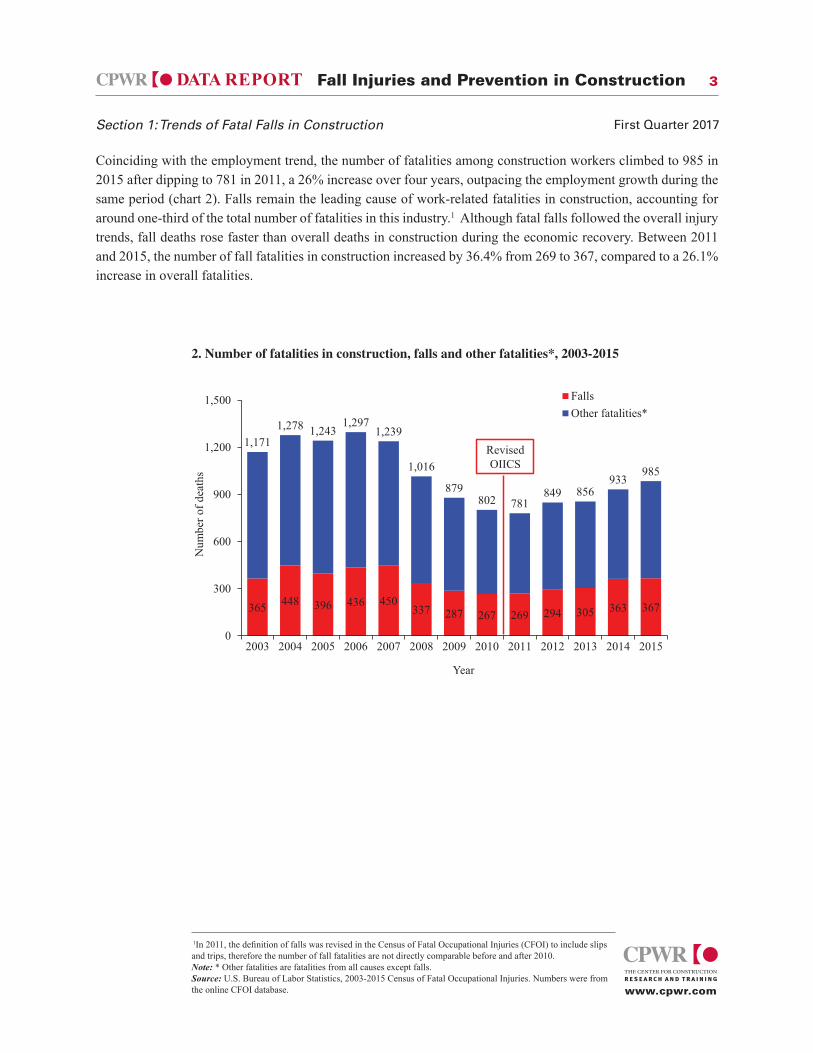
Coinciding with the employment trend, the number of fatalities among construction workers climbed to 985 in 2015 after dipping to 781 in 2011, a 26% increase over four years, outpacing the employment growth during the same period (chart 2). Falls remain the leading cause of work-related fatalities in construction, accounting for around one-third of the total number of fatalities in this industry.1 Although fatal falls followed the overall injury trends, fall deaths rose faster than overall deaths in construction during the economic recovery. Between 2011 and 2015, the number of fall fatalities in construction increased by 36.4% from 269 to 367, compared to a 26.1% increase in overall fatalities.
2. Number of fatalities in construction, falls and other fatalities*, 2003-2015
365 448 396 436 450337 287 267 269 294 305 363 367
1,1711,278 1,243
1,2971,239
1,016
879802 781
849 856933
985
0
300
600
900
1,200
1,500
2003 2004 2005 2006 2007 2008 2009 2010 2011 2012 2013 2014 2015
Num
ber o
f dea
ths
Year
FallsOther fatalities*
Revised OIICS
.
1In 2011, the definition of falls was revised in the Census of Fatal Occupational Injuries (CFOI) to include slips and trips, therefore the number of fall fatalities are not directly comparable before and after 2010. Note: * Other fatalities are fatalities from all causes except falls. Source: U.S. Bureau of Labor Statistics, 2003-2015 Census of Fatal Occupational Injuries. Numbers were from the online CFOI database.
Fall Injuries and Prevention in Construction
DATA REPORT 4
Section 1: Trends of Fatal Falls in Construction First Quarter 2017
www.cpwr.com
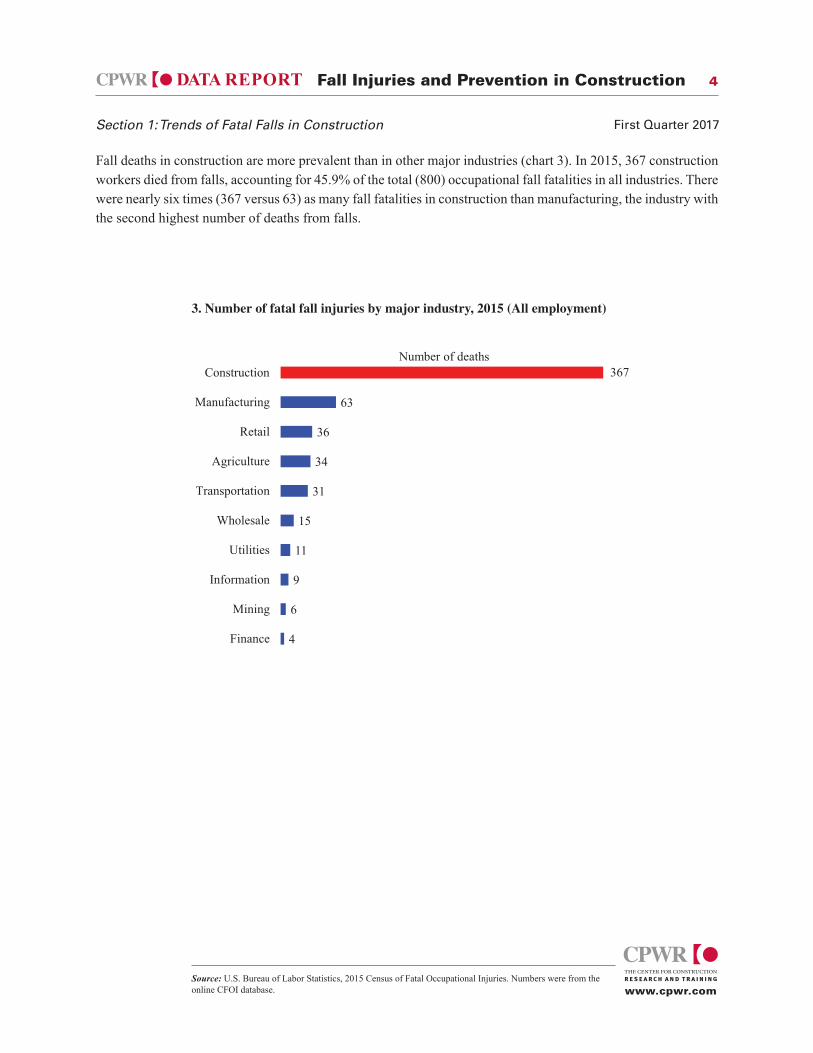
Fall deaths in construction are more prevalent than in other major industries (chart 3). In 2015, 367 construction workers died from falls, accounting for 45.9% of the total (800) occupational fall fatalities in all industries. There were nearly six times (367 versus 63) as many fall fatalities in construction than manufacturing, the industry with the second highest number of deaths from falls.
3. Number of fatal fall injuries by major industry, 2015 (All employment)
4
6
9
11
15
31
34
36
63
367
Finance
Mining
Information
Utilities
Wholesale
Transportation
Agriculture
Retail
Manufacturing
ConstructionNumber of deaths
Source: U.S. Bureau of Labor Statistics, 2015 Census of Fatal Occupational Injuries. Numbers were from the online CFOI database.
Fall Injuries and Prevention in Construction
DATA REPORT 5
Section 1: Trends of Fatal Falls in Construction First Quarter 2017
www.cpwr.com
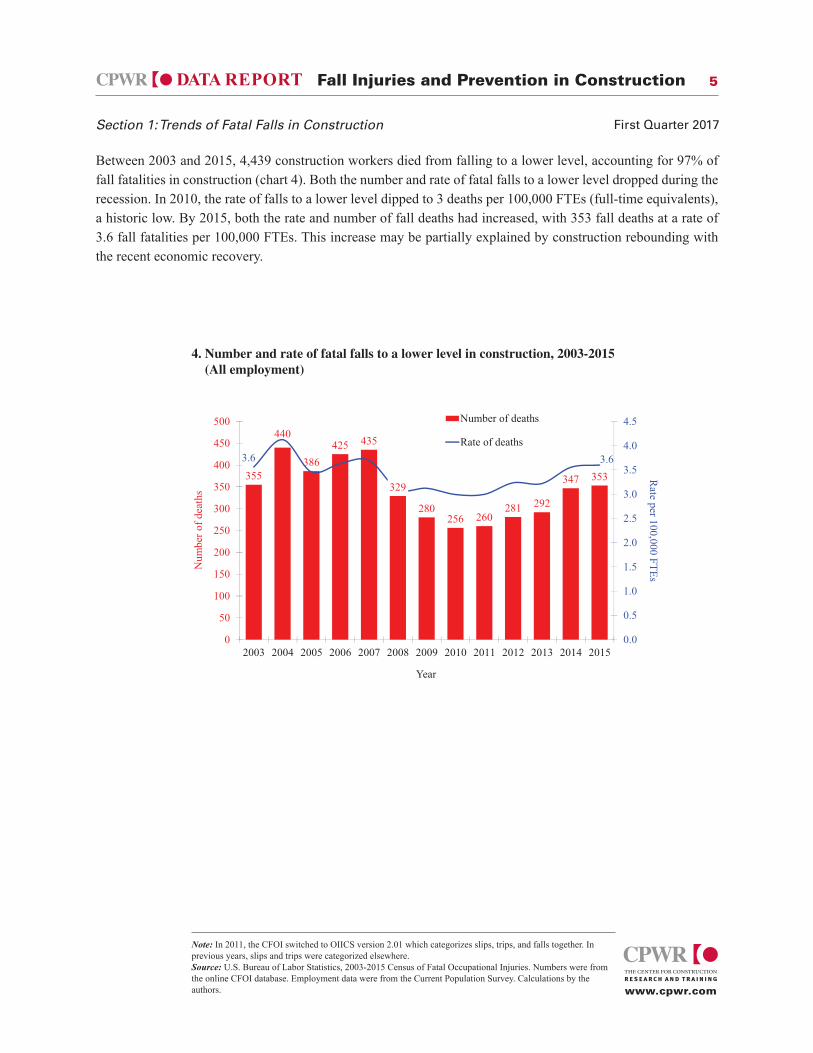
Between 2003 and 2015, 4,439 construction workers died from falling to a lower level, accounting for 97% of fall fatalities in construction (chart 4). Both the number and rate of fatal falls to a lower level dropped during the recession. In 2010, the rate of falls to a lower level dipped to 3 deaths per 100,000 FTEs (full-time equivalents), a historic low. By 2015, both the rate and number of fall deaths had increased, with 353 fall deaths at a rate of 3.6 fall fatalities per 100,000 FTEs. This increase may be partially explained by construction rebounding with the recent economic recovery.
4. Number and rate of fatal falls to a lower level in construction, 2003-2015 (All employment)
355
440
386425 435
329
280256 260
281 292
347 353
3.6 3.6
0.0
0.5
1.0
1.5
2.0
2.5
3.0
3.5
4.0
4.5
0
50
100
150
200
250
300
350
400
450
500
2003 2004 2005 2006 2007 2008 2009 2010 2011 2012 2013 2014 2015
Rate per 100,000 FTEs
Num
ber o
f dea
ths
Year
Number of deaths
Rate of deaths
Note: In 2011, the CFOI switched to OIICS version 2.01 which categorizes slips, trips, and falls together. In previous years, slips and trips were categorized elsewhere. Source: U.S. Bureau of Labor Statistics, 2003-2015 Census of Fatal Occupational Injuries. Numbers were from the online CFOI database. Employment data were from the Current Population Survey. Calculations by the authors.
Fall Injuries and Prevention in Construction
DATA REPORT 6
Section 1: Trends of Fatal Falls in Construction First Quarter 2017
www.cpwr.com
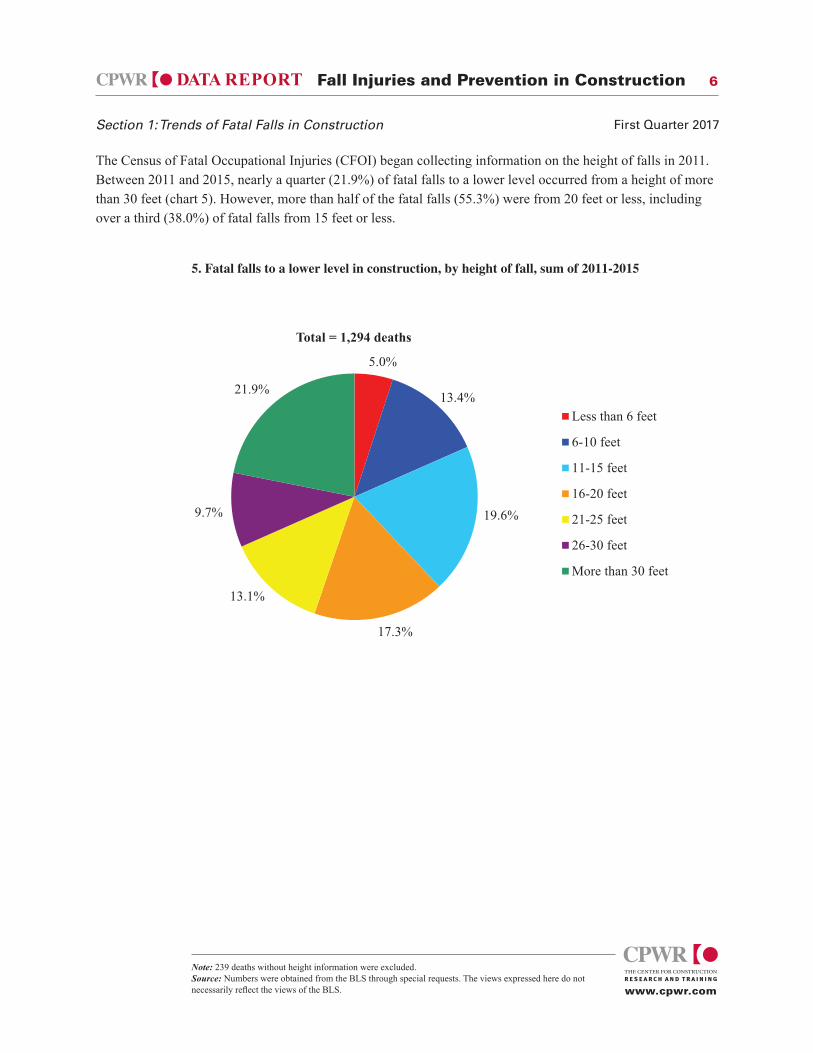
The Census of Fatal Occupational Injuries (CFOI) began collecting information on the height of falls in 2011. Between 2011 and 2015, nearly a quarter (21.9%) of fatal falls to a lower level occurred from a height of more than 30 feet (chart 5). However, more than half of the fatal falls (55.3%) were from 20 feet or less, including over a third (38.0%) of fatal falls from 15 feet or less.
5. Fatal falls to a lower level in construction, by height of fall, sum of 2011-2015 -
5.0%
13.4%
19.6%
17.3%
13.1%
9.7%
21.9%
Total = 1,294 deaths
Less than 6 feet
6-10 feet
11-15 feet
16-20 feet
21-25 feet
26-30 feet
More than 30 feet
Note: 239 deaths without height information were excluded. Source: Numbers were obtained from the BLS through special requests. The views expressed here do not necessarily reflect the views of the BLS.
Fall Injuries and Prevention in Construction
DATA REPORT 7
Section 1: Trends of Fatal Falls in Construction First Quarter 2017
www.cpwr.com
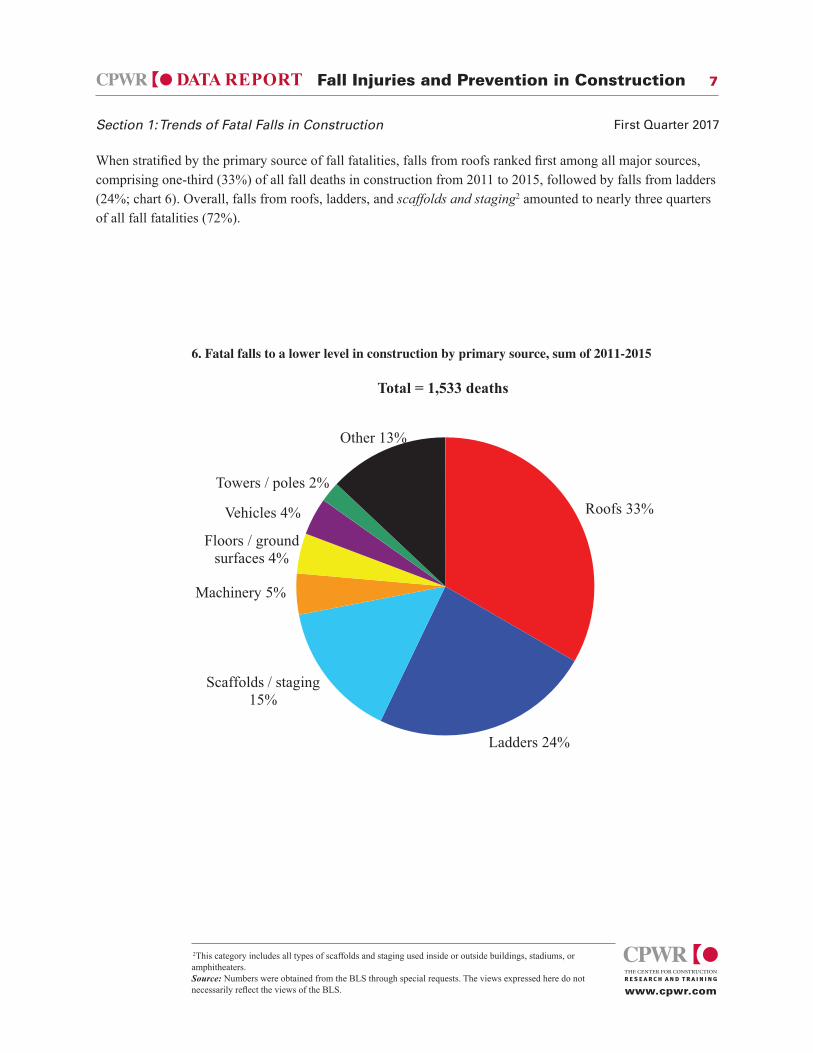
When stratified by the primary source of fall fatalities, falls from roofs ranked first among all major sources, comprising one-third (33%) of all fall deaths in construction from 2011 to 2015, followed by falls from ladders (24%; chart 6). Overall, falls from roofs, ladders, and scaffolds and staging2 amounted to nearly three quarters of all fall fatalities (72%).
6. Fatal falls to a lower level in construction by primary source, sum of 2011-2015
Roofs 33%
Ladders 24%
Scaffolds / staging 15%
Machinery 5%
Floors / ground surfaces 4%
Vehicles 4%
Towers / poles 2%
Other 13%
Total = 1,533 deaths
2This category includes all types of scaffolds and staging used inside or outside buildings, stadiums, or amphitheaters. Source: Numbers were obtained from the BLS through special requests. The views expressed here do not necessarily reflect the views of the BLS.
Fall Injuries and Prevention in Construction
8
www.cpwr.com
DATA REPORT 8
SECTION 2: FATAL FALLS AMONG CONSTRUCTION SUBGROUPS
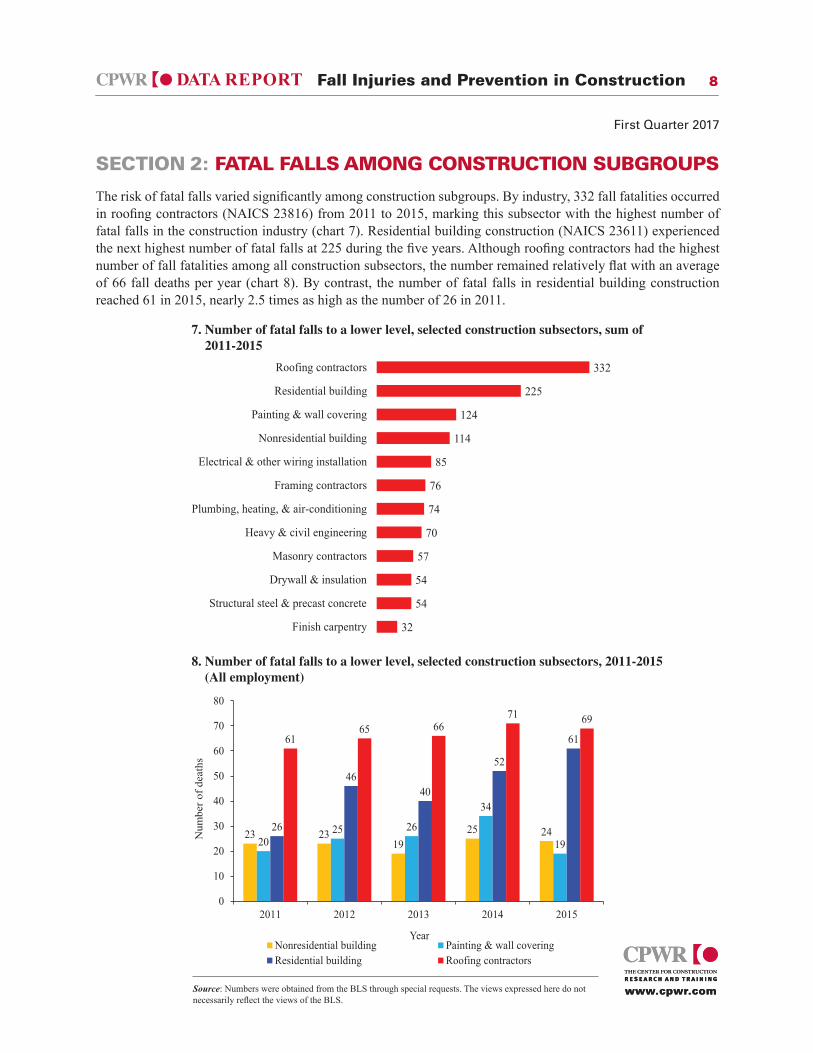
The risk of fatal falls varied significantly among construction subgroups. By industry, 332 fall fatalities occurred in roofing contractors (NAICS 23816) from 2011 to 2015, marking this subsector with the highest number of fatal falls in the construction industry (chart 7). Residential building construction (NAICS 23611) experienced the next highest number of fatal falls at 225 during the five years. Although roofing contractors had the highest number of fall fatalities among all construction subsectors, the number remained relatively flat with an average of 66 fall deaths per year (chart 8). By contrast, the number of fatal falls in residential building construction reached 61 in 2015, nearly 2.5 times as high as the number of 26 in 2011.
Source: Numbers were obtained from the BLS through special requests. The views expressed here do not necessarily reflect the views of the BLS.
7. Number of fatal falls to a lower level, selected construction subsectors, sum of 2011-2015
www.cpwr.com
First Quarter 2017
32
54
54
57
70
74
76
85
114
124
225
332
Finish carpentry
Structural steel & precast concrete
Drywall & insulation
Masonry contractors
Heavy & civil engineering
Plumbing, heating, & air-conditioning
Framing contractors
Electrical & other wiring installation
Nonresidential building
Painting & wall covering
Residential building
Roofing contractorsNumber of fatal falls to a lower level
8. Number of fatal falls to a lower level, selected construction subsectors, 2011-2015 (All employment)
23 2319
25 2420
25 26
34
1926
4640
52
616165 66
71 69
0
10
20
30
40
50
60
70
80
2011 2012 2013 2014 2015
Num
ber o
f dea
ths
YearNonresidential building Painting & wall coveringResidential building Roofing contractors
Fall Injuries and Prevention in Construction
9
www.cpwr.com
DATA REPORT 9
Section 2: Fatal Falls Among Construction Subgroup First Quarter 2017
www.cpwr.com
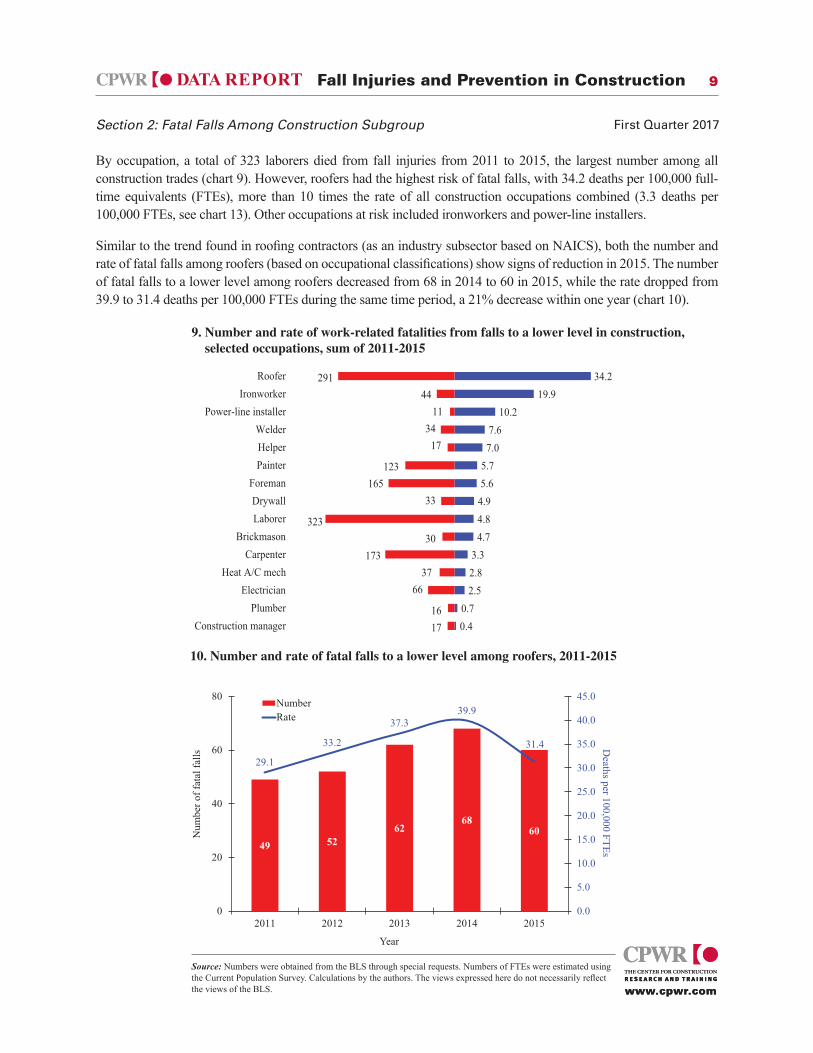
By occupation, a total of 323 laborers died from fall injuries from 2011 to 2015, the largest number among all construction trades (chart 9). However, roofers had the highest risk of fatal falls, with 34.2 deaths per 100,000 full-time equivalents (FTEs), more than 10 times the rate of all construction occupations combined (3.3 deaths per 100,000 FTEs, see chart 13). Other occupations at risk included ironworkers and power-line installers.
Similar to the trend found in roofing contractors (as an industry subsector based on NAICS), both the number and rate of fatal falls among roofers (based on occupational classifications) show signs of reduction in 2015. The number of fatal falls to a lower level among roofers decreased from 68 in 2014 to 60 in 2015, while the rate dropped from 39.9 to 31.4 deaths per 100,000 FTEs during the same time period, a 21% decrease within one year (chart 10).
Source: Numbers were obtained from the BLS through special requests. Numbers of FTEs were estimated using the Current Population Survey. Calculations by the authors. The views expressed here do not necessarily reflect the views of the BLS.
9. Number and rate of work-related fatalities from falls to a lower level in construction, selected occupations, sum of 2011-2015
0.40.7
2.52.83.3
4.74.84.95.65.7
7.07.6
10.219.9
34.2
Construction managerPlumber
ElectricianHeat A/C mech
CarpenterBrickmason
LaborerDrywall
ForemanPainterHelperWelder
Power-line installerIronworker
RooferRate per 100,000 FTEs
1144
291
323
34
33165
123
17
6637
17330
1716
Number of fatalities
10. Number and rate of fatal falls to a lower level among roofers, 2011-2015
49 5262
6860
29.1
33.2
37.339.9
31.4
0.0
5.0
10.0
15.0
20.0
25.0
30.0
35.0
40.0
45.0
0
20
40
60
80
2011 2012 2013 2014 2015
Deaths per 100,000 FTEs
Num
ber o
f fat
al fa
lls
Year
NumberRate
Fall Injuries and Prevention in Construction
10
www.cpwr.com
DATA REPORT 10
Section 2: Fatal Falls Among Construction Subgroup First Quarter 2017
www.cpwr.com
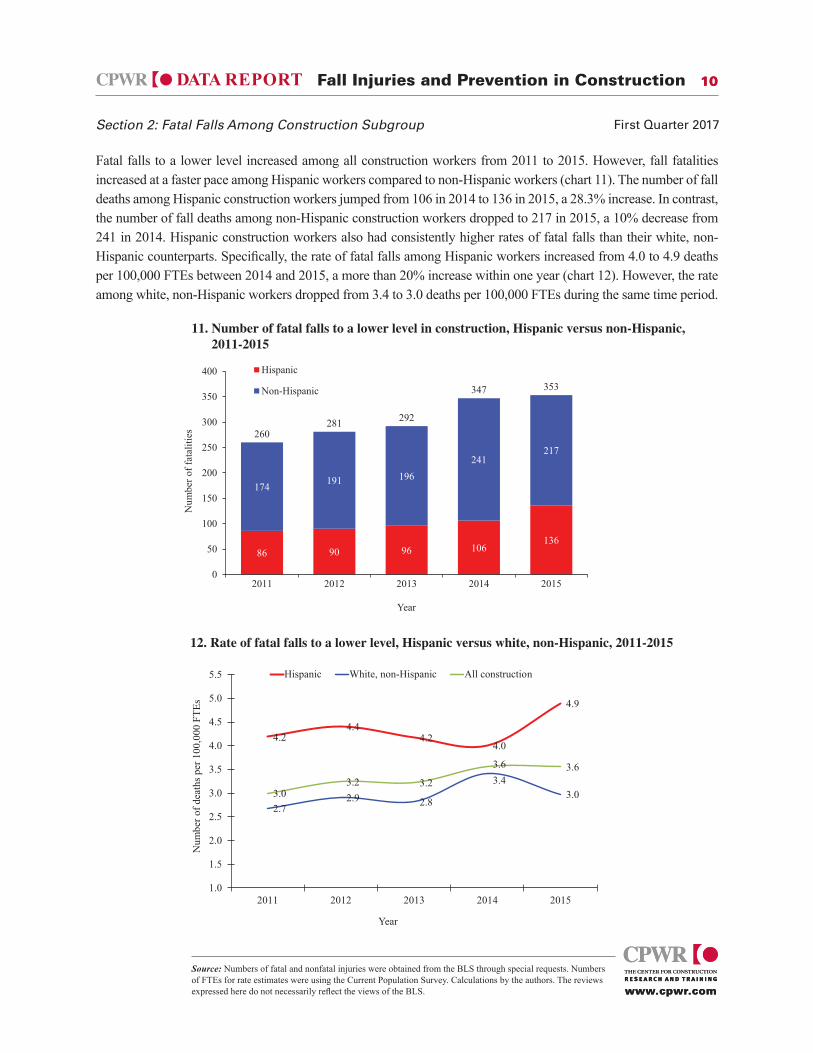
Fatal falls to a lower level increased among all construction workers from 2011 to 2015. However, fall fatalities increased at a faster pace among Hispanic workers compared to non-Hispanic workers (chart 11). The number of fall deaths among Hispanic construction workers jumped from 106 in 2014 to 136 in 2015, a 28.3% increase. In contrast, the number of fall deaths among non-Hispanic construction workers dropped to 217 in 2015, a 10% decrease from 241 in 2014. Hispanic construction workers also had consistently higher rates of fatal falls than their white, non-Hispanic counterparts. Specifically, the rate of fatal falls among Hispanic workers increased from 4.0 to 4.9 deaths per 100,000 FTEs between 2014 and 2015, a more than 20% increase within one year (chart 12). However, the rate among white, non-Hispanic workers dropped from 3.4 to 3.0 deaths per 100,000 FTEs during the same time period.
Source: Numbers of fatal and nonfatal injuries were obtained from the BLS through special requests. Numbers of FTEs for rate estimates were using the Current Population Survey. Calculations by the authors. The reviews expressed here do not necessarily reflect the views of the BLS.
11. Number of fatal falls to a lower level in construction, Hispanic versus non-Hispanic, 2011-2015
86 90 96 106136
174 191 196241
217260
281 292
347 353
0
50
100
150
200
250
300
350
400
2011 2012 2013 2014 2015
Num
ber o
f fat
aliti
es
Year
Hispanic
Non-Hispanic
12. Rate of fatal falls to a lower level, Hispanic versus white, non-Hispanic, 2011-2015
4.24.4
4.24.0
4.9
2.72.9 2.8
3.43.03.0
3.2 3.2
3.6 3.6
1.0
1.5
2.0
2.5
3.0
3.5
4.0
4.5
5.0
5.5
2011 2012 2013 2014 2015
Num
ber o
f dea
ths p
er 1
00,0
00 F
TEs
Year
Hispanic White, non-Hispanic All construction
Fall Injuries and Prevention in Construction
11
www.cpwr.com
DATA REPORT 11
Section 2: Fatal Falls Among Construction Subgroup First Quarter 2017
www.cpwr.com
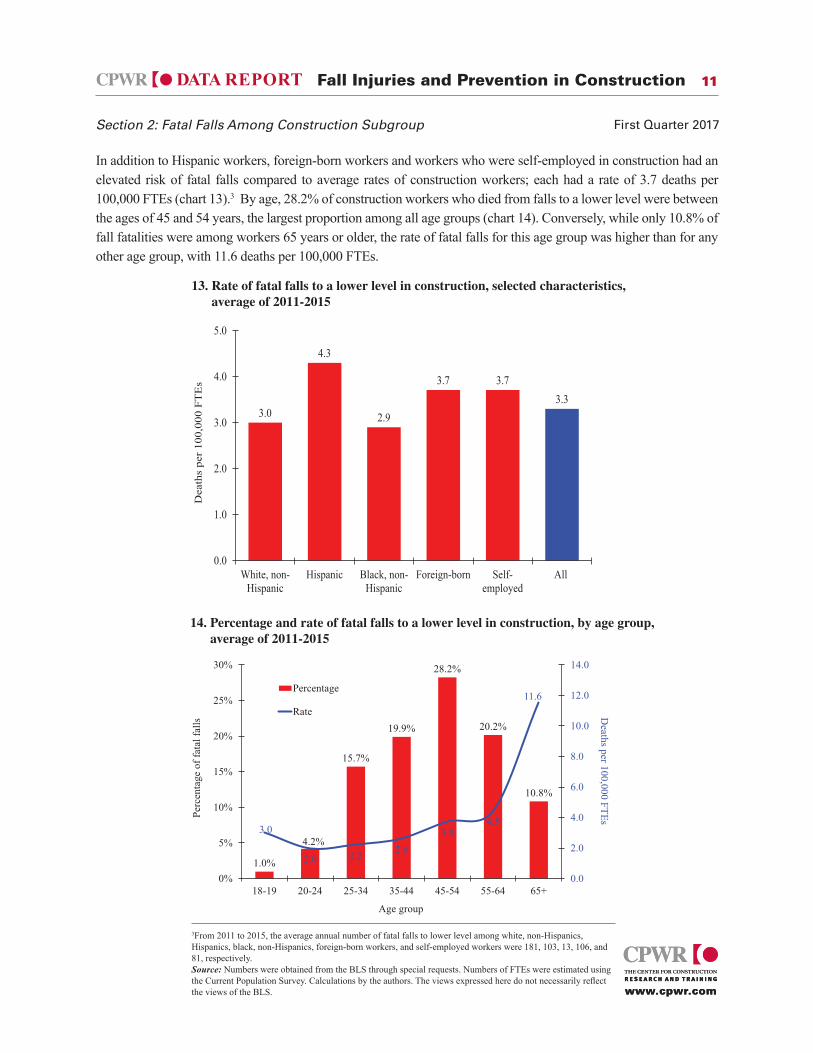
In addition to Hispanic workers, foreign-born workers and workers who were self-employed in construction had an elevated risk of fatal falls compared to average rates of construction workers; each had a rate of 3.7 deaths per 100,000 FTEs (chart 13).3 By age, 28.2% of construction workers who died from falls to a lower level were between the ages of 45 and 54 years, the largest proportion among all age groups (chart 14). Conversely, while only 10.8% of fall fatalities were among workers 65 years or older, the rate of fatal falls for this age group was higher than for any other age group, with 11.6 deaths per 100,000 FTEs.
3From 2011 to 2015, the average annual number of fatal falls to lower level among white, non-Hispanics, Hispanics, black, non-Hispanics, foreign-born workers, and self-employed workers were 181, 103, 13, 106, and 81, respectively. Source: Numbers were obtained from the BLS through special requests. Numbers of FTEs were estimated using the Current Population Survey. Calculations by the authors. The views expressed here do not necessarily reflect the views of the BLS.
13. Rate of fatal falls to a lower level in construction, selected characteristics, average of 2011-2015
3.0
4.3
2.9
3.7 3.73.3
0.0
1.0
2.0
3.0
4.0
5.0
White, non-Hispanic
Hispanic Black, non-Hispanic
Foreign-born Self-employed
All
Dea
ths
per
100,
000
FTE
s
14. Percentage and rate of fatal falls to a lower level in construction, by age group, average of 2011-2015
1.0%
4.2%
15.7%
19.9%
28.2%
20.2%
10.8%
3.0
2.0 2.2 2.63.8
4.5
11.6
0.0
2.0
4.0
6.0
8.0
10.0
12.0
14.0
0%
5%
10%
15%
20%
25%
30%
18-19 20-24 25-34 35-44 45-54 55-64 65+
Deaths per 100,000 FTEsPe
rcen
tage
of f
atal
falls
Age group
Percentage
Rate
Fall Injuries and Prevention in Construction
DATA REPORT 12
SECTION 3: FATAL FALLS ILLUSTRATED IN CPWR CONSTRUC TION
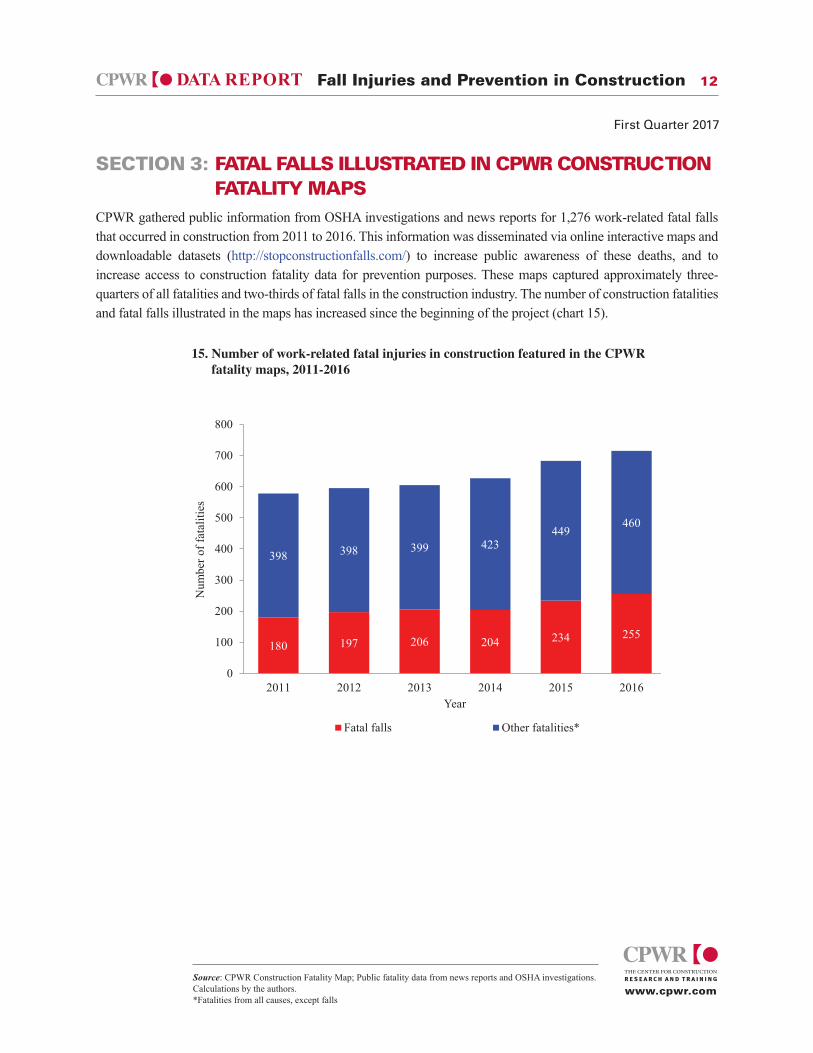
CPWR gathered public information from OSHA investigations and news reports for 1,276 work-related fatal falls that occurred in construction from 2011 to 2016. This information was disseminated via online interactive maps and downloadable datasets (http://stopconstructionfalls.com/) to increase public awareness of these deaths, and to increase access to construction fatality data for prevention purposes. These maps captured approximately three-quarters of all fatalities and two-thirds of fatal falls in the construction industry. The number of construction fatalities and fatal falls illustrated in the maps has increased since the beginning of the project (chart 15).
Source: CPWR Construction Fatality Map; Public fatality data from news reports and OSHA investigations. Calculations by the authors. *Fatalities from all causes, except falls
15. Number of work-related fatal injuries in construction featured in the CPWR fatality maps, 2011-2016
www.cpwr.com
First Quarter 2017
180 197 206 204 234 255
398 398 399 423449
460
0
100
200
300
400
500
600
700
800
2011 2012 2013 2014 2015 2016
Num
ber o
f fat
aliti
es
Year
Fatal falls Other fatalities*
FATALITY MAPS
Fall Injuries and Prevention in Construction
13DATA REPORT 13
www.cpwr.com
Section 3: Fatal Falls Illustrated in CPWR Construction Fatality Maps First Quarter 2017
www.cpwr.com
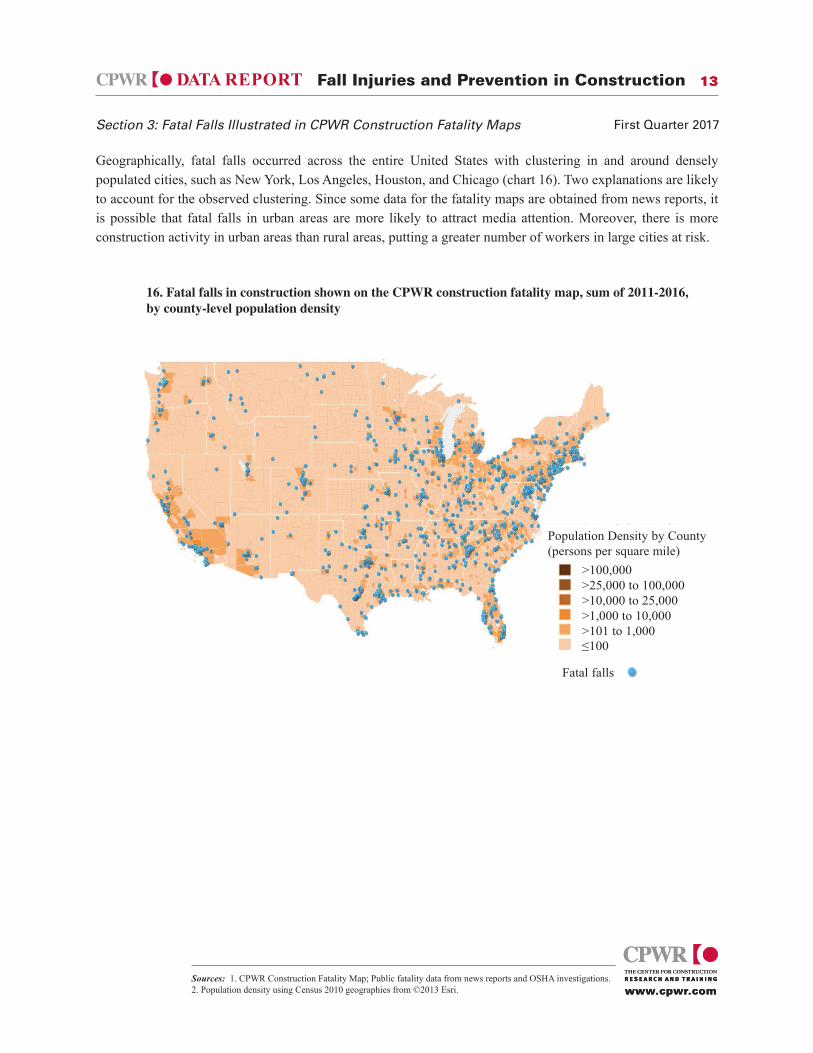
Geographically, fatal falls occurred across the entire United States with clustering in and around densely populated cities, such as New York, Los Angeles, Houston, and Chicago (chart 16). Two explanations are likely to account for the observed clustering. Since some data for the fatality maps are obtained from news reports, it is possible that fatal falls in urban areas are more likely to attract media attention. Moreover, there is more construction activity in urban areas than rural areas, putting a greater number of workers in large cities at risk.
16. Fatal falls in construction shown on the CPWR construction fatality map, sum of 2011-2016, by county-level population density
Population Density by County (persons per square mile)
Fatal falls
>100,000>25,000 to 100,000>10,000 to 25,000>1,000 to 10,000>101 to 1,000≤100
Sources: 1. CPWR Construction Fatality Map; Public fatality data from news reports and OSHA investigations. 2. Population density using Census 2010 geographies from ©2013 Esri.
Fall Injuries and Prevention in Construction
14DATA REPORT 14
First Quarter 2017
www.cpwr.comwww.cpwr.com
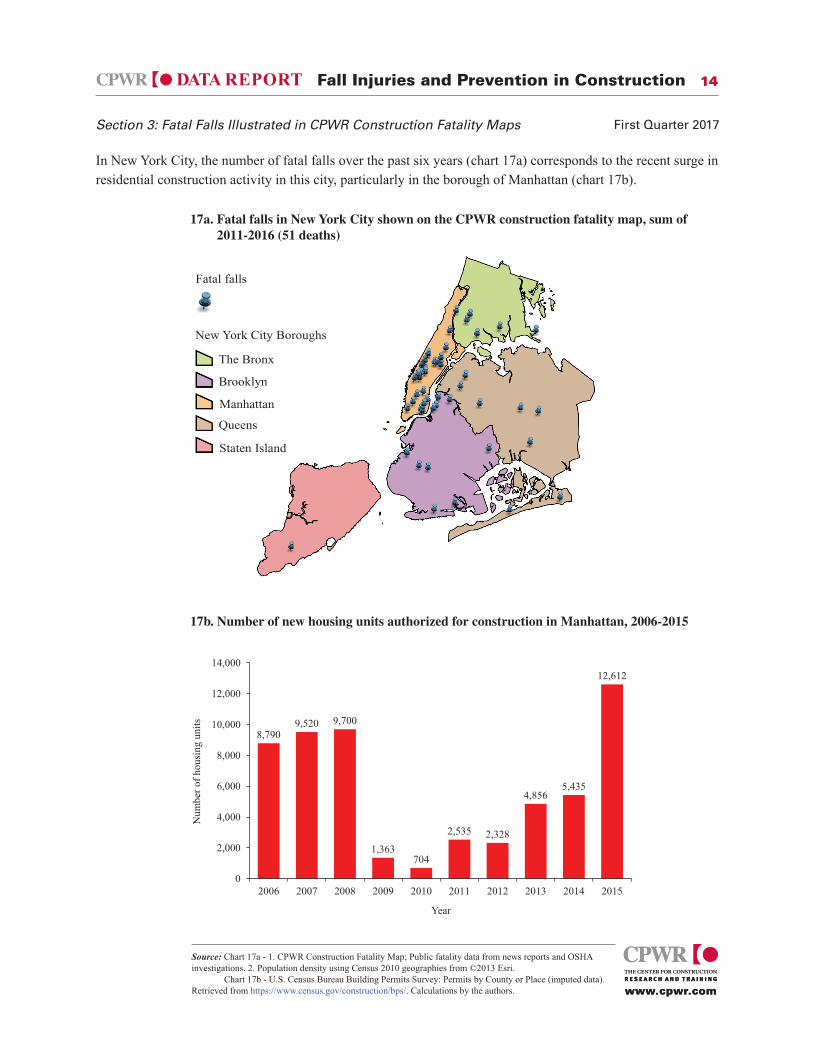
In New York City, the number of fatal falls over the past six years (chart 17a) corresponds to the recent surge in residential construction activity in this city, particularly in the borough of Manhattan (chart 17b).
Source: Chart 17a - 1. CPWR Construction Fatality Map; Public fatality data from news reports and OSHA investigations. 2. Population density using Census 2010 geographies from ©2013 Esri. Chart 17b - U.S. Census Bureau Building Permits Survey: Permits by County or Place (imputed data). Retrieved from https://www.census.gov/construction/bps/. Calculations by the authors.
Section 3: Fatal Falls Illustrated in CPWR Construction Fatality Maps
17a. Fatal falls in New York City shown on the CPWR construction fatality map, sum of 2011-2016 (51 deaths)
New York City Boroughs
The Bronx
Brooklyn
Manhattan
Queens
Staten Island
Fatal falls
17b. Number of new housing units authorized for construction in Manhattan, 2006-2015
.
8,7909,520 9,700
1,363704
2,535 2,328
4,8565,435
12,612
0
2,000
4,000
6,000
8,000
10,000
12,000
14,000
2006 2007 2008 2009 2010 2011 2012 2013 2014 2015
Num
ber o
f hou
sing
uni
ts
Year
Fall Injuries and Prevention in Construction
15DATA REPORT 15
SECTION 4: NONFATAL FALL INJURIES IN CONSTRUCTION
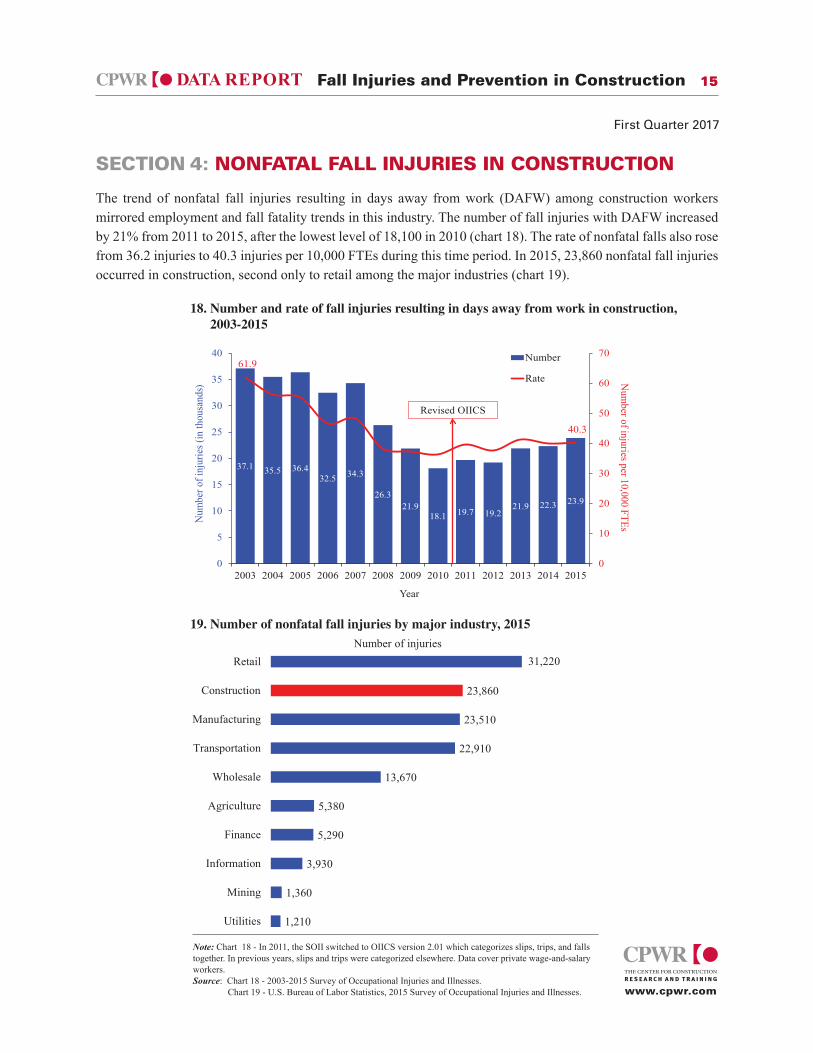
The trend of nonfatal fall injuries resulting in days away from work (DAFW) among construction workers mirrored employment and fall fatality trends in this industry. The number of fall injuries with DAFW increased by 21% from 2011 to 2015, after the lowest level of 18,100 in 2010 (chart 18). The rate of nonfatal falls also rose from 36.2 injuries to 40.3 injuries per 10,000 FTEs during this time period. In 2015, 23,860 nonfatal fall injuries occurred in construction, second only to retail among the major industries (chart 19).
Note: Chart 18 - In 2011, the SOII switched to OIICS version 2.01 which categorizes slips, trips, and falls together. In previous years, slips and trips were categorized elsewhere. Data cover private wage-and-salary workers. Source: Chart 18 - 2003-2015 Survey of Occupational Injuries and Illnesses. Chart 19 - U.S. Bureau of Labor Statistics, 2015 Survey of Occupational Injuries and Illnesses. www.cpwr.com
First Quarter 2017
18. Number and rate of fall injuries resulting in days away from work in construction, 2003-2015
37.1 35.5 36.432.5 34.3
26.321.9
18.1 19.7 19.221.9 22.3 23.9
61.9
40.3
0
10
20
30
40
50
60
70
0
5
10
15
20
25
30
35
40
2003 2004 2005 2006 2007 2008 2009 2010 2011 2012 2013 2014 2015
Num
ber of injuries per 10,000 FTEsNum
ber o
f inj
urie
s (in
thou
sand
s)
Year
Number
Rate
Revised OIICS
19. Number of nonfatal fall injuries by major industry, 2015
1,210
1,360
3,930
5,290
5,380
13,670
22,910
23,510
23,860
31,220
Utilities
Mining
Information
Finance
Agriculture
Wholesale
Transportation
Manufacturing
Construction
RetailNumber of injuries
Fall Injuries and Prevention in Construction
16DATA REPORT 16
www.cpwr.com
Section 4: Nonfatal Fall Injuries in Construction First Quarter 2017
www.cpwr.com
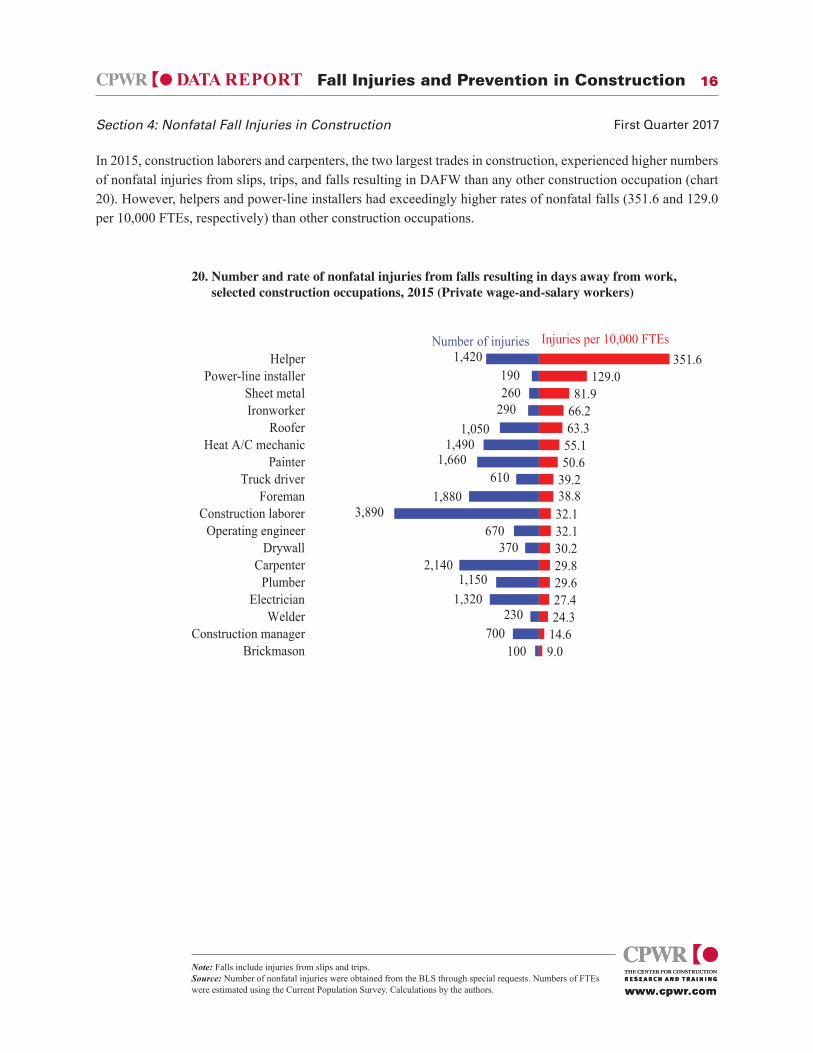
In 2015, construction laborers and carpenters, the two largest trades in construction, experienced higher numbers of nonfatal injuries from slips, trips, and falls resulting in DAFW than any other construction occupation (chart 20). However, helpers and power-line installers had exceedingly higher rates of nonfatal falls (351.6 and 129.0 per 10,000 FTEs, respectively) than other construction occupations.
20. Number and rate of nonfatal injuries from falls resulting in days away from work, selected construction occupations, 2015 (Private wage-and-salary workers)
9.014.624.327.429.629.830.232.132.138.839.250.655.163.366.281.9
129.0351.6
BrickmasonConstruction manager
WelderElectrician
PlumberCarpenter
DrywallOperating engineer
Construction laborerForeman
Truck driverPainter
Heat A/C mechanicRoofer
IronworkerSheet metal
Power-line installerHelper
Injuries per 10,000 FTEsNumber of injuries
1,880610
1,4901,050
290260
1,660
1,420
1,150
370670
3,890
100700
2301,320
190
2,140
Note: Falls include injuries from slips and trips. Source: Number of nonfatal injuries were obtained from the BLS through special requests. Numbers of FTEs were estimated using the Current Population Survey. Calculations by the authors.
Fall Injuries and Prevention in Construction
DATA REPORT 17
SECTION 5: FALL PREVENTION IN CONSTRUCTION
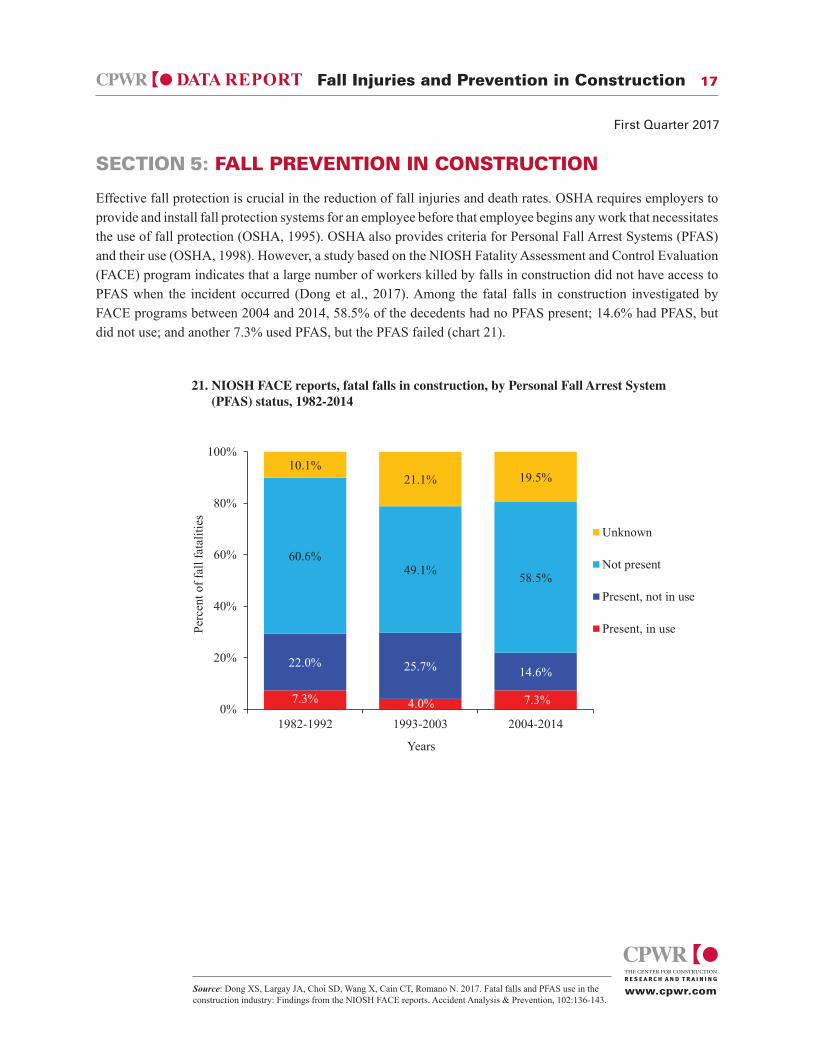
Effective fall protection is crucial in the reduction of fall injuries and death rates. OSHA requires employers to provide and install fall protection systems for an employee before that employee begins any work that necessitates the use of fall protection (OSHA, 1995). OSHA also provides criteria for Personal Fall Arrest Systems (PFAS) and their use (OSHA, 1998). However, a study based on the NIOSH Fatality Assessment and Control Evaluation (FACE) program indicates that a large number of workers killed by falls in construction did not have access to PFAS when the incident occurred (Dong et al., 2017). Among the fatal falls in construction investigated by FACE programs between 2004 and 2014, 58.5% of the decedents had no PFAS present; 14.6% had PFAS, but did not use; and another 7.3% used PFAS, but the PFAS failed (chart 21).
Source: Dong XS, Largay JA, Choi SD, Wang X, Cain CT, Romano N. 2017. Fatal falls and PFAS use in the construction industry: Findings from the NIOSH FACE reports. Accident Analysis & Prevention, 102:136-143.
21. NIOSH FACE reports, fatal falls in construction, by Personal Fall Arrest System (PFAS) status, 1982-2014
www.cpwr.com
First Quarter 2017
7.3% 4.0% 7.3%
22.0% 25.7% 14.6%
60.6%49.1% 58.5%
10.1%21.1% 19.5%
0%
20%
40%
60%
80%
100%
1982-1992 1993-2003 2004-2014
Perc
ent o
f fal
l fat
aliti
es
Years
Unknown
Not present
Present, not in use
Present, in use
Fall Injuries and Prevention in Construction
18DATA REPORT 18
www.cpwr.com
Section 5: Fall Prevention in Construction First Quarter 2017
www.cpwr.com
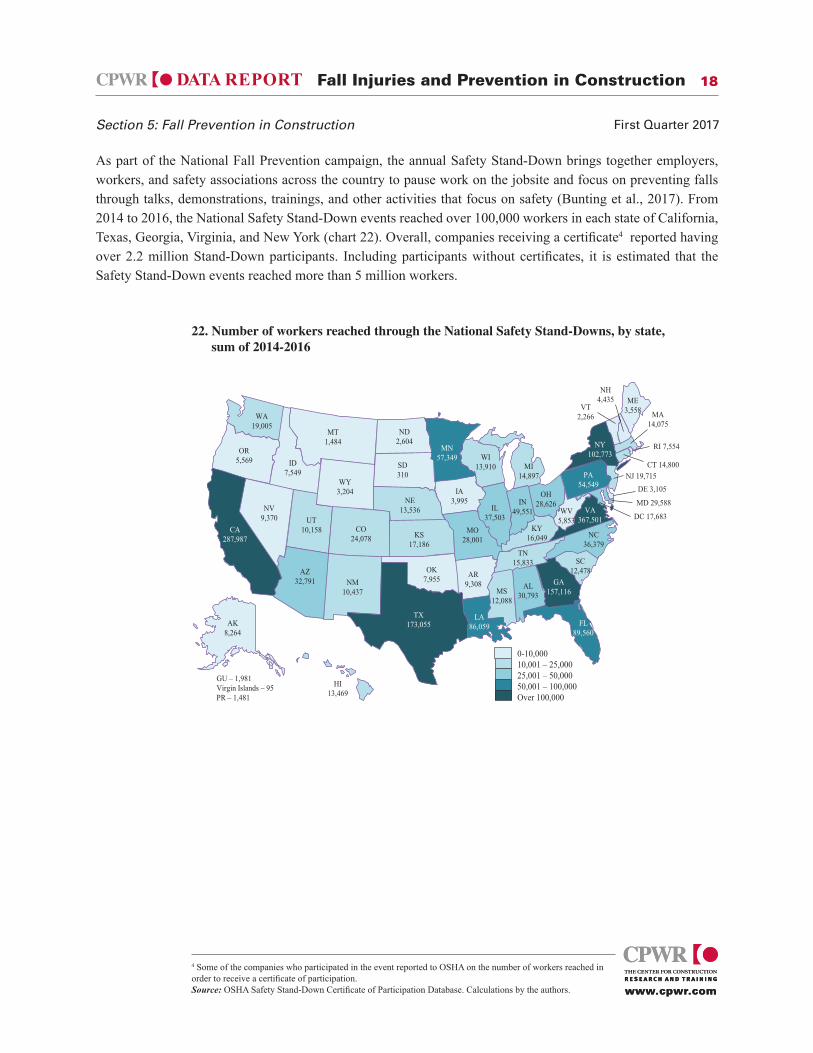
As part of the National Fall Prevention campaign, the annual Safety Stand-Down brings together employers, workers, and safety associations across the country to pause work on the jobsite and focus on preventing falls through talks, demonstrations, trainings, and other activities that focus on safety (Bunting et al., 2017). From 2014 to 2016, the National Safety Stand-Down events reached over 100,000 workers in each state of California, Texas, Georgia, Virginia, and New York (chart 22). Overall, companies receiving a certificate4 reported having over 2.2 million Stand-Down participants. Including participants without certificates, it is estimated that the Safety Stand-Down events reached more than 5 million workers.
22. Number of workers reached through the National Safety Stand-Downs, by state, sum of 2014-2016
WA19,005
ID7,549
OR5,569
ND2,604
AZ32,791
CO24,078
SD310
UT10,158
WY3,204
MT1,484
NV9,370
CA287,987
ME3,558
NY102,773
AK8,264
NM10,437
HI13,469
KS17,186
NE13,536
MN57,349
OK7,955
WI13,910
TX173,055
IA3,995
MO28,001
AR9,308
IL37,503
LA86,059
MS12,088
KY16,049
AL30,793
GA157,116
SC12,478
FL89,560
NC36,379
VA367,501
WV5,853
IN49,551
OH28,626
PA54,549
MI14,897
TN15,833
NH4,435
VT2,266 MA
14,075
RI 7,554
NJ 19,715CT 14,800
DC 17,683
MD 29,588
DE 3,105
0-10,00010,001 – 25,00025,001 – 50,00050,001 – 100,000Over 100,000
GU – 1,981Virgin Islands – 95PR – 1,481
4 Some of the companies who participated in the event reported to OSHA on the number of workers reached in order to receive a certificate of participation. Source: OSHA Safety Stand-Down Certificate of Participation Database. Calculations by the authors.
Fall Injuries and Prevention in Construction
19DATA REPORT 19
www.cpwr.com
Section 5: Fall Prevention in Construction First Quarter 2017
www.cpwr.com
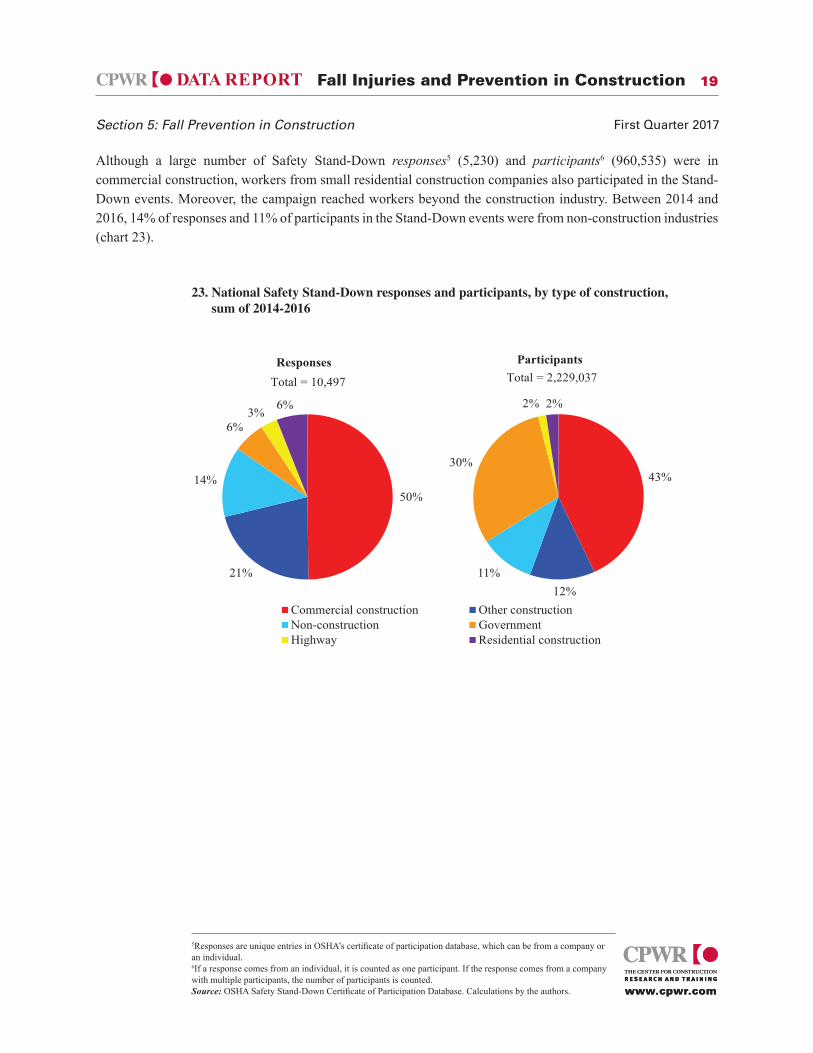
Although a large number of Safety Stand-Down responses5 (5,230) and participants6 (960,535) were in commercial construction, workers from small residential construction companies also participated in the Stand-Down events. Moreover, the campaign reached workers beyond the construction industry. Between 2014 and 2016, 14% of responses and 11% of participants in the Stand-Down events were from non-construction industries (chart 23).
23. National Safety Stand-Down responses and participants, by type of construction, sum of 2014-2016
50%
21%
14%
6%3% 6%
Responses
Commercial construction Other constructionNon-construction GovernmentHighway Residential construction
Total = 10,497
43%
12%11%
30%
2% 2%
ParticipantsTotal = 2,229,037
5Responses are unique entries in OSHA’s certificate of participation database, which can be from a company or an individual. 6If a response comes from an individual, it is counted as one participant. If the response comes from a company with multiple participants, the number of participants is counted. Source: OSHA Safety Stand-Down Certificate of Participation Database. Calculations by the authors.
Fall Injuries and Prevention in Construction
DATA REPORT 20
Conclusion
Fall injuries and fatalities increased as construction rebounded with the economic recovery. In 2015, 367 con-struction workers died from falls, a 36% increase from 2011, surpassing the growth in employment and overall fatalities in this industry. The clusters of fall fatalities shown on the CPWR Fatality Maps were consistent with the BLS data, illustrating the positive correlation of fall injuries with population density and construction activ-ity.
The increase in fall fatalities was more pronounced in residential building construction and among Hispanic workers than for the overall construction industry. This report also confirmed that fall risk exists at low heights, demonstrated by the fact that more than half of all fall fatalities (55%) between 2011 and 2015 occurred from a height of 20 feet or less. Moreover, roofers, older workers, Hispanic workers, foreign-born workers, and self-employed workers had a higher risk of fatal falls than the average among all construction workers. Nev-ertheless, fatal falls among roofers showed signs of decrease in recent years. Fall protection efforts may have contributed to this reduction.
The findings in this report emphasize the need to reduce falls and the importance of the ongoing National Fall Prevention campaign. It is estimated that the Safety Stand-Down events have reached more than 5 million workers (including those without certificates) across the nation in a three-year period, vitally raising public awareness of the risk of falls and importance of fall prevention in the construction industry. The campaign encourages construction contractors to PLAN ahead to get the job done safely, PROVIDE the right equipment to workers, and TRAIN workers to use the equipment safely.
References• Bunting, J., (2017) The National Campaign to Prevent Falls in Construction Final Report on the 2016
Safety Stand-Down: A follow-up report to the Final Report on the 2014 & 2015 Safety Stand-Down: A quantitative and qualitative analysis on data collected from OSHA’s Stand-Down Certificate of Participation database.
• Bunting J 2015. The National Campaign to Prevent Falls in Construction Final Report on the 2014 & 2015 Safety Stand-Downs: A quantitative and qualitative analysis on data collected from OSHA’s Stand-Down Certificate of Participation database.
• Dong XS, Largay JA, Choi SD, Wang X, Cain CT, Romano N. 2017. Fatal falls and PFAS use in the construction industry: Findings from the NIOSH FACE reports. Accident Analysis & Prevention, 102:136- 143.
• OSHA. 1995. Subpart M - Fall Protection: Duty to have fall protection. https://www.osha.gov/pls/oshaweb/owadisp.show_document?p_id=10757&p_table=STANDARDS (Accessed March 2017).
• OSHA. 1998. Subpart I - Personal Protective Equipment: Personal fall arrest systems (PFAS). https://www.osha.gov/pls/oshaweb/owadisp.show_document?p_table=STANDARDS&p_id=10275 (Accessed March 2017).
www.cpwr.com
First Quarter 2017
DATA REPORT 21
Data Sources:
Health insurance coverage
• Bureau of Labor Statistics, 2003-2015 Census of Fatal Occupational Injuries.• Bureau of Labor Statistics, 2003-2015 Survey of Occupational Injuries and Illnesses. • Bureau of Labor Statistics, 2003-2016 Current Population Survey. • CPWR Construction Fatality Map, 2011-2016. • OSHA Safety Stand-Down Certificate of Participation Database, 2014-2016.
First Quarter 2017
© 2017, CPWR – The Center for Construction Research and Training. All rights reserved.
CPWR is the research and training arm of North America’s Building Trades Unions. Production of this document was supported by cooperative agreement OH 009762 from the National Institute for Occupational Safety and Health (NIOSH). The contents are solely the responsibility of the authors and do not necessarily represent the official views of NIOSH.
8484 Georgia AvenueSuite 1000Silver Spring, MD 20910www.cpwr.com
Please visit CPWR’s other resources to help reduce construction safety and health hazards:
Construction Solutions http://www.cpwrconstructionsolutions.org/ Construction Solutions ROI Calculator http://www.safecalc.org/ The Electronic Library of Construction OSH http://www.elcosh.org/index.php Falls Campaign http://stopconstructionfalls.com/ Hand Safety http://choosehandsafety.org/ Work Safely with Silica http://www.silica-safe.org/
About the CPWR Data Center
The CPWR Data Center is part of CPWR – The Center for Construction Research and Training. CPWR is a 501(c)(3) nonprofit research and training institution created by North America’s Building Trades Unions, and serves as its research arm. CPWR has focused on construction safety and health research since 1990. The Quarterly Data Reports – a series of publications analyzing construction-related data, is part of our ongoing surveillance project funded by the National Institute for Occupational Safety and Health (NIOSH).