Embed Size (px)
Citation preview

New Perspectives on Microsoft Access 2002 Tutorial 6 1
XP
Microsoft Access 2002
Tutorial 6 – Creating Custom Reports
New Perspectives on Microsoft Access 2002 Tutorial 6 2
XPDesign and create a custom report
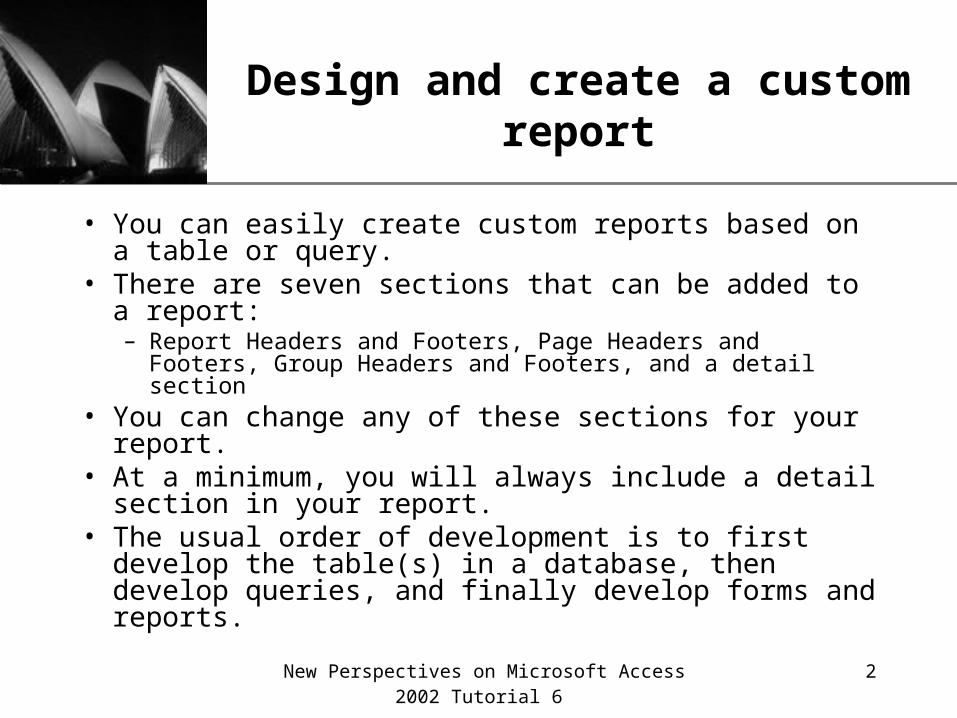
• You can easily create custom reports based on a table or query.
• There are seven sections that can be added to a report:– Report Headers and Footers, Page Headers and Footers, Group
Headers and Footers, and a detail section • You can change any of these sections for your report. • At a minimum, you will always include a detail section in
your report.• The usual order of development is to first develop the
table(s) in a database, then develop queries, and finally develop forms and reports.
New Perspectives on Microsoft Access 2002 Tutorial 6 3
XPReport sections and their contents
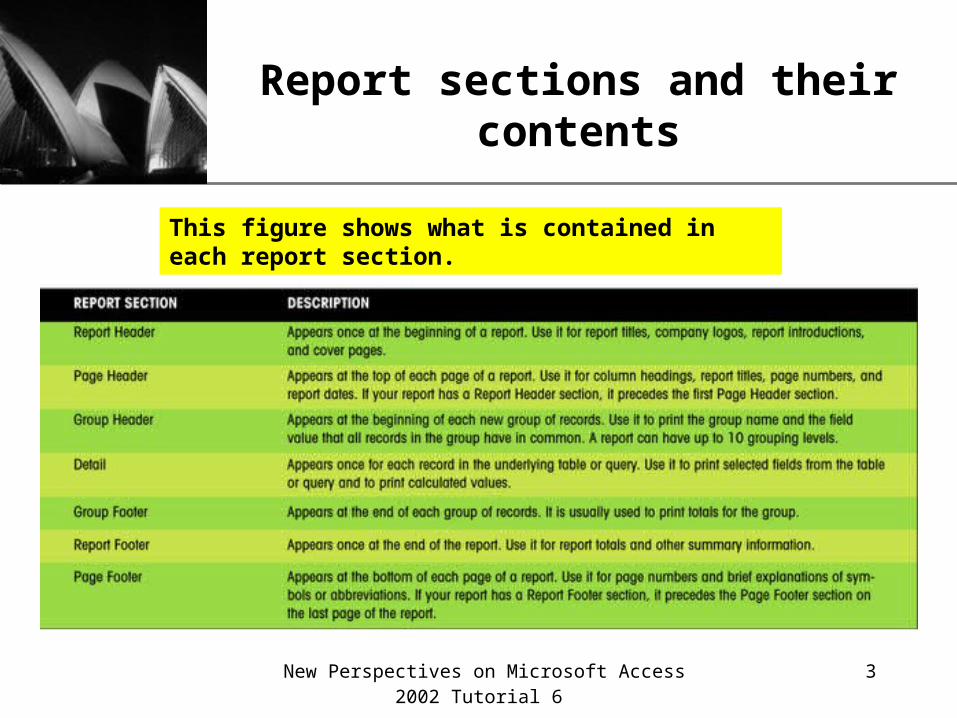
This figure shows what is contained in each report section.
New Perspectives on Microsoft Access 2002 Tutorial 6 4
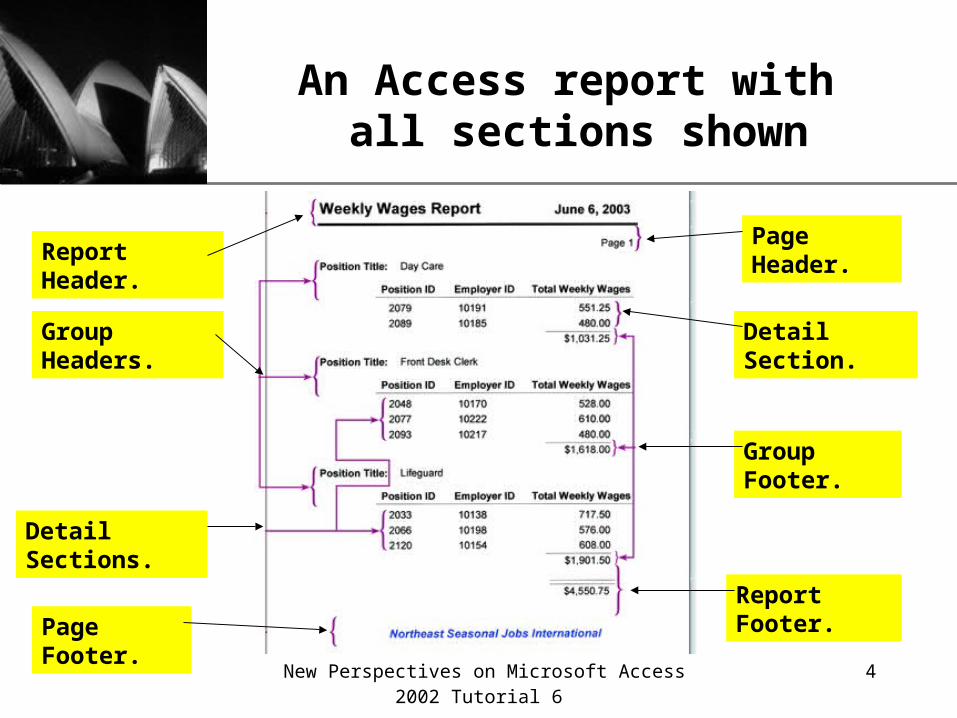
XPAn Access report with all sections shown
Report Header.
Group Headers.
Detail Sections.
Page Footer.
Page Header.
Detail Section.
Group Footer.
Report Footer.
New Perspectives on Microsoft Access 2002 Tutorial 6 5
XPDesign a report before creating it
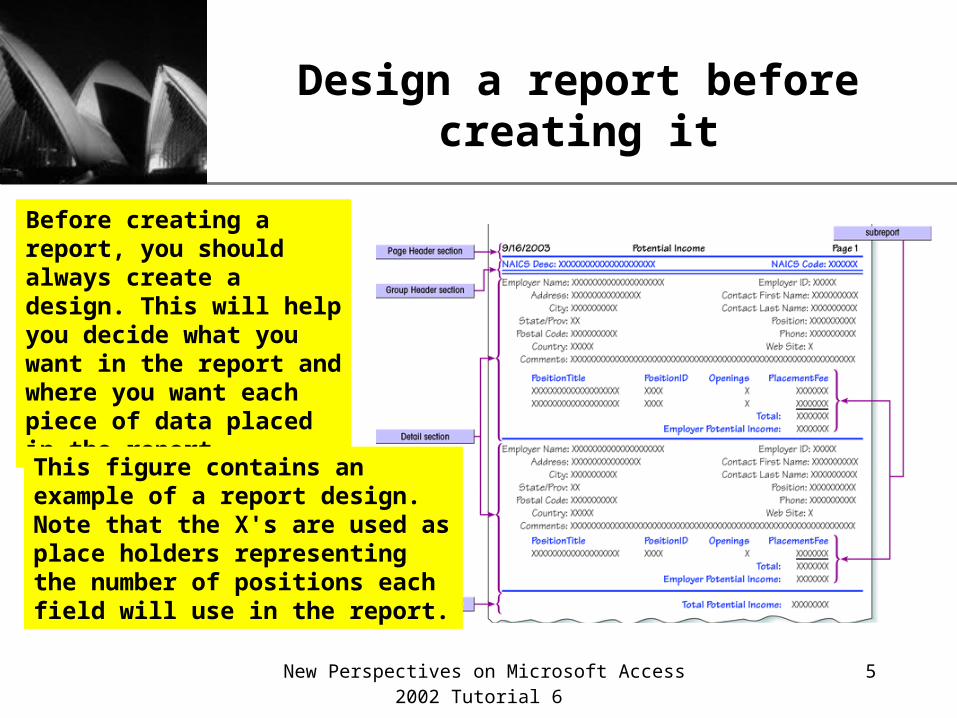
Before creating a report, you should always create a design. This will help you decide what you want in the report and where you want each piece of data placed in the report.
This figure contains an example of a report design. Note that the X's are used as place holders representing the number of positions each field will use in the report.

New Perspectives on Microsoft Access 2002 Tutorial 6 6
XPAssign a conditional value to a calculated field
• There will be times when you will want to perform one operation under a certain condition and perform a different operation under another condition.
• In Access you can do this using the IIf function. • The IIf function specifies a condition:
– If the condition is true, the operation is performed
– If the condition is false, a different operation is performed

New Perspectives on Microsoft Access 2002 Tutorial 6 7
XPAn IIf statement example
The figure below contains an expression using the IIf statement. The expression will add 200 to the PlacementFee field if the TotalOpenings field is greater than or equal to 3. Otherwise it will add 500 to the PlacementFee.
New Perspectives on Microsoft Access 2002 Tutorial 6 8
XPSort and group data in a report
• Access makes it easy for you to sort your data in the order you want it.
• You can also group data, which will result in data being sorted within the groups.
• If you specify that you want a group, you have the opportunity to provide a Group Header and/or Group Footer.
• The Group Header will usually indicate the name of the group and the footer typically contains a subtotal for the group.
New Perspectives on Microsoft Access 2002 Tutorial 6 9
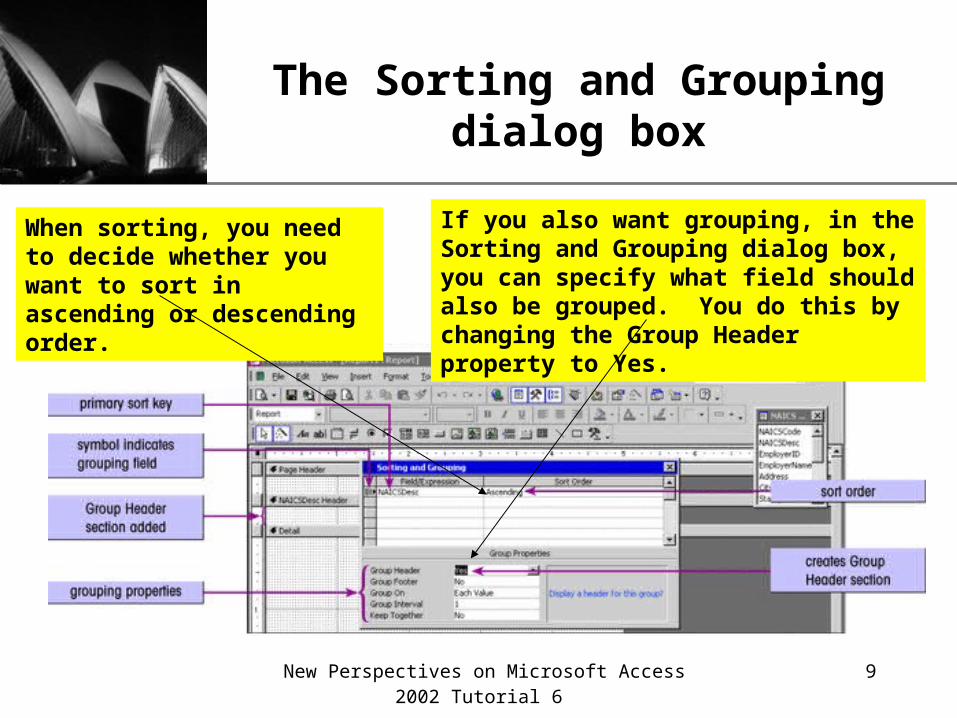
XPThe Sorting and Grouping dialog box
When sorting, you need to decide whether you want to sort in ascending or descending order.
If you also want grouping, in the Sorting and Grouping dialog box, you can specify what field should also be grouped. You do this by changing the Group Header property to Yes.

New Perspectives on Microsoft Access 2002 Tutorial 6 10
XPAdd, move, resize, and align controls in a report
• You can add controls to a report in the same manner as you add controls to a form.
• Bound controls get their data from a field in a table or query.
• To add a bound control to a report, click the desired field in the field list and drag it to the report design window.
• You can then move these controls around according to your design. – Move controls by selecting them and then dragging them to the desired
position
– Resize a control by dragging one of its selection handles to the desired position
– Align several controls by selecting the controls and then right-clicking on one of the controls and selecting the align command

New Perspectives on Microsoft Access 2002 Tutorial 6 11
XPBound controls on a report
Bound controls normally consist of a label and a text box for entering and viewing data.
The small black rectangles around the controls indicate that they are selected, and are also used to move and resize the controls.
New Perspectives on Microsoft Access 2002 Tutorial 6 12
XPModify control properties
• Each control has a set of properties associated with it.
• In the case of the label control, the Caption property contains the text that will be displayed in the label.
• To change any of the properties for a control you must first display the property sheet.
• You can display the property sheet for a control by right-clicking on the control.
New Perspectives on Microsoft Access 2002 Tutorial 6 13
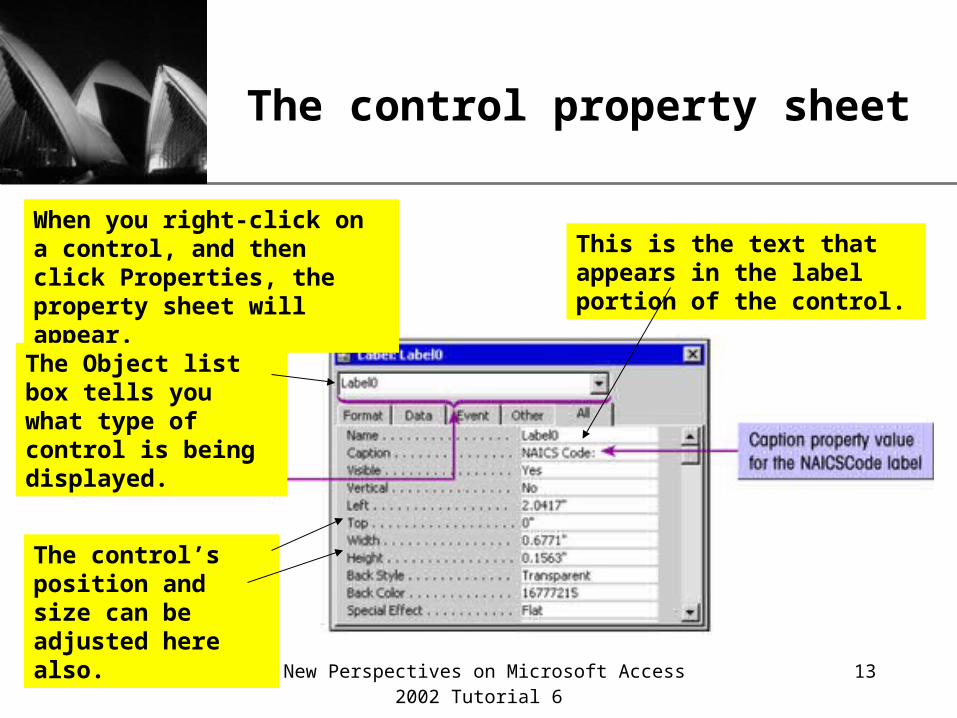
XPThe control property sheet
When you right-click on a control, and then click Properties, the property sheet will appear.
This is the text that appears in the label portion of the control.
The Object list box tells you what type of control is being displayed.
The control’s position and size can be adjusted here also.

New Perspectives on Microsoft Access 2002 Tutorial 6 14
XPAdd a subreport to a main report
• To add a subreport to a report, you use the Subform/Subreport wizard to create the subreport.
• In order to launch the wizard, you must be sure that the Controls Wizards tool is selected in the toolbox.
• The subreport will usually consist of data from a related table. If the report is based on a query that uses both tables, you can pull the data from the related table into the subreport.

New Perspectives on Microsoft Access 2002 Tutorial 6 15
XPA subreport in Design view
When you add a subreport to a report, this is how it will appear in Report Design view.
These fields are on the main report.
The subreport label will appear when the report is viewed in datasheet view.

New Perspectives on Microsoft Access 2002 Tutorial 6 16
XPA subreport in Print Preview
This is how the report will look when it is previewed and printed.
Main report area.
Subreport area.
New Perspectives on Microsoft Access 2002 Tutorial 6 17
XPAdd lines to a report
• To provide a visual separation in the report, you may want to add a line to the report.
• To do this:– Select the drawing tool from the toolbox and position
the pointer where you want the line to begin
– Hold down the mouse button and drag the pointer to where the line should end, and release the mouse button
– To ensure a straight vertical or horizontal line, hold down the Shift key while you drag
New Perspectives on Microsoft Access 2002 Tutorial 6 18
XPAdd a line to a report in Design view
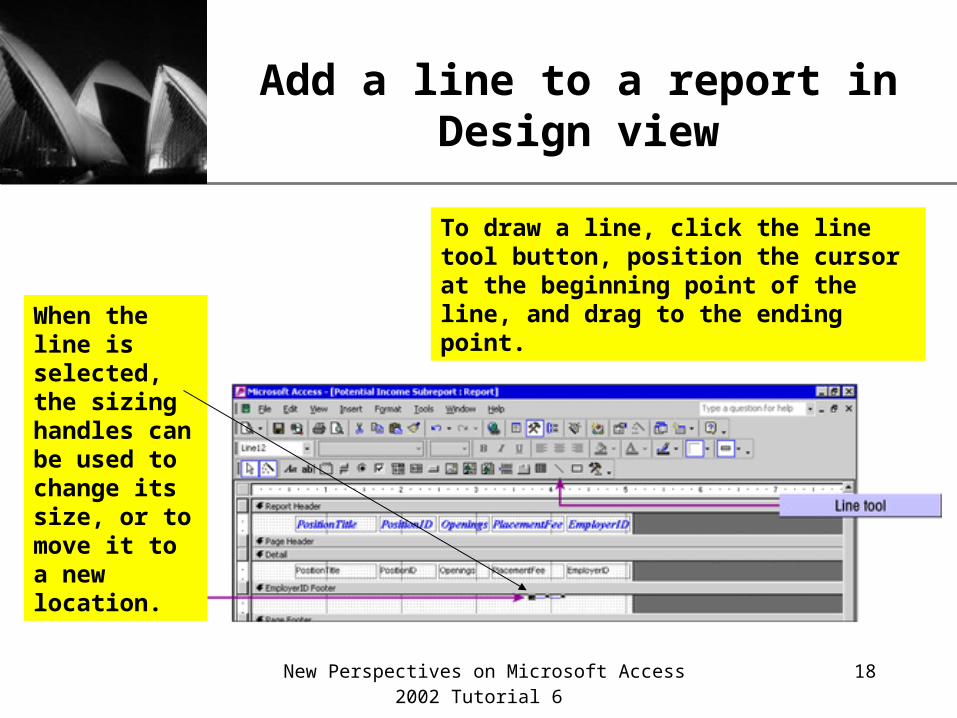
To draw a line, click the line tool button, position the cursor at the beginning point of the line, and drag to the ending point.
When the line is selected, the sizing handles can be used to change its size, or to move it to a new location.

New Perspectives on Microsoft Access 2002 Tutorial 6 19
XPHide duplicate values in a report
• When you group items in a report, you may not want to repeat the duplicate values within the group. – For example, if the report is grouped by department,
you don’t need to have Accounting printed on each record in that department
• You can hide these duplicate value by setting the Hide Duplicates property to Yes.
New Perspectives on Microsoft Access 2002 Tutorial 6 20
XPSet the Hide Duplicates property
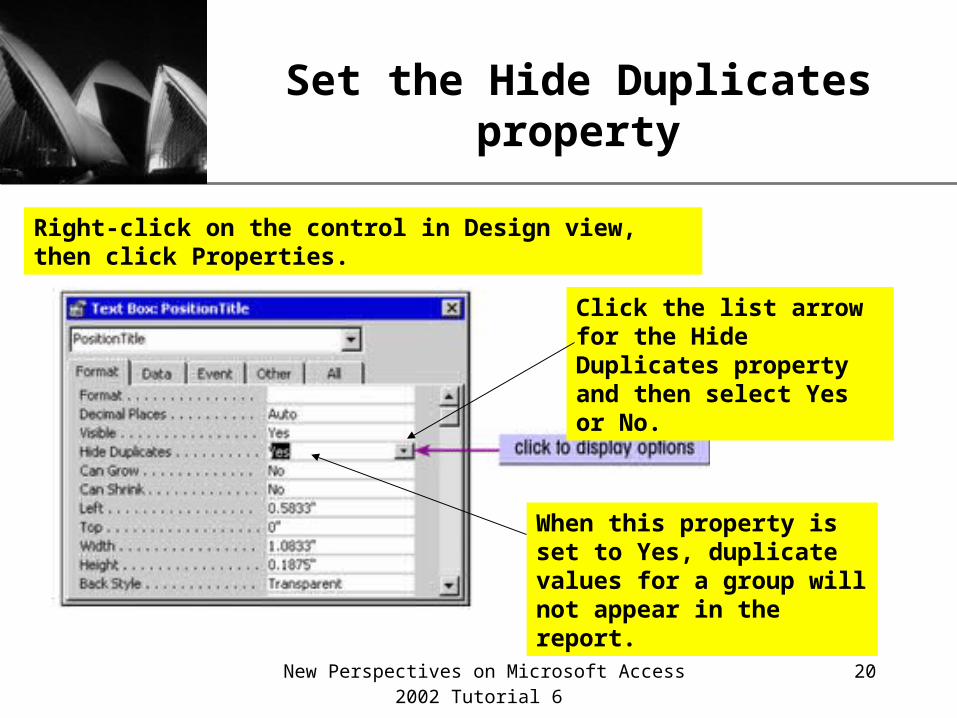
Right-click on the control in Design view, then click Properties.
Click the list arrow for the Hide Duplicates property and then select Yes or No.
When this property is set to Yes, duplicate values for a group will not appear in the report.

New Perspectives on Microsoft Access 2002 Tutorial 6 21
XPAdd calculated controls to a report
• If you want to have a subtotal for the groups in a report, you should add the Sum function to the Group Footer section.
• If you also want an overall total, you should place the Sum function in the Report Footer section.
• The Sum function will be placed inside a text box control that you have added to your report in the appropriate position.

New Perspectives on Microsoft Access 2002 Tutorial 6 22
XPAdd a calculated field to a footer section
Click the Text Box tool, then click and drag where you want the calculated field to go.
Add a label to identify the field.
Enter the calculation expression in the property sheet for the control.
New Perspectives on Microsoft Access 2002 Tutorial 6 23
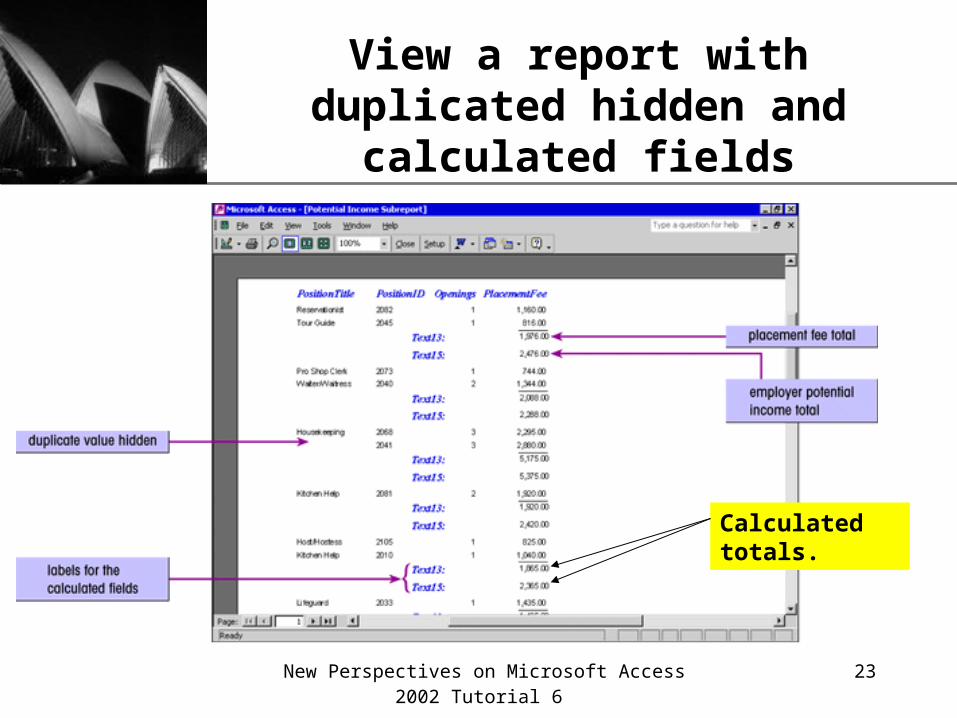
XPView a report with duplicated hidden and calculated fields
Calculated totals.
New Perspectives on Microsoft Access 2002 Tutorial 6 24
XPDefine conditional formatting rules
• Sometimes you will want to call attention to a value under certain conditions.
• You can specify under what conditions formatting would be applied to a control.
• You can define up to three formats for a control. • Any value other than those specified in the
conditions will be formatted in the default format.
New Perspectives on Microsoft Access 2002 Tutorial 6 25
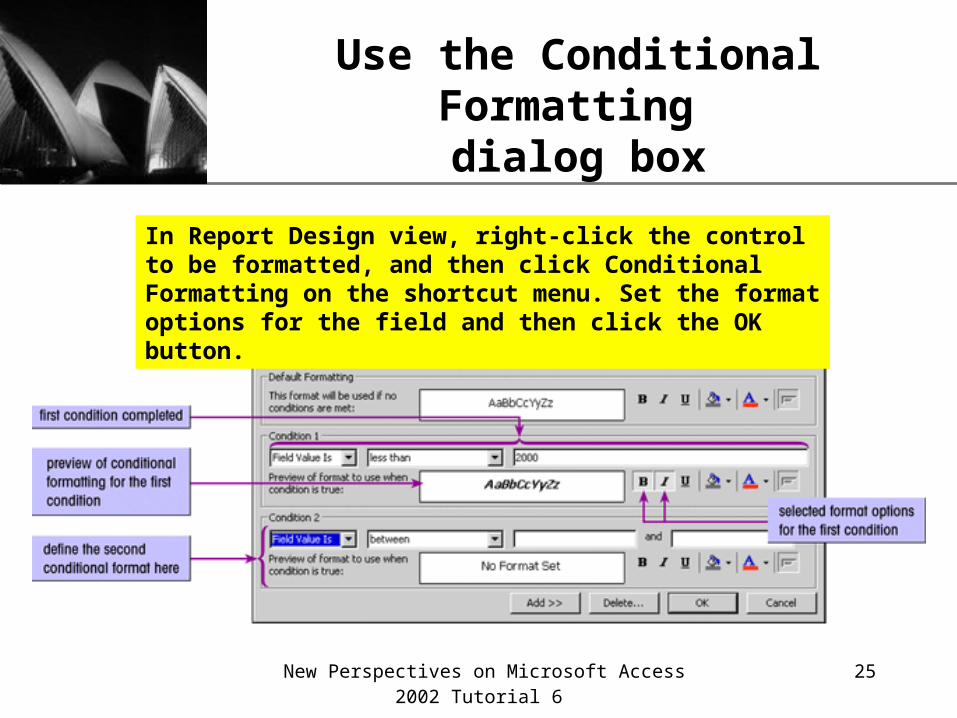
XPUse the Conditional Formatting dialog box
In Report Design view, right-click the control to be formatted, and then click Conditional Formatting on the shortcut menu. Set the format options for the field and then click the OK button.
New Perspectives on Microsoft Access 2002 Tutorial 6 26
XPUse domain aggregate functions
• Domain aggregate functions are used to provide statistical information about a set of records, or recordset.
• An example of an aggregate function is the Sum function: – The Sum function adds the values in a set of records and places the
Sum in a bound control • To apply an aggregate function to a table or query, you
must use domain aggregate functions. • In this case you would use the DSum function:
– You need to specify the name of the set of records (the query or table) and which values are to be summed
• This is only one example of a domain aggregate function. There are several others.

New Perspectives on Microsoft Access 2002 Tutorial 6 27
XPAdd a domain aggregate function
1. Add an unbound control to the report using the text box tool.
2. Right-click the control, click Properties, and then click the All tab if necessary.
3. Right-click the Control Source text box in the property sheet, then click Zoom on the shortcut menu. Enter the domain aggregate function, then click OK.

New Perspectives on Microsoft Access 2002 Tutorial 6 28
XPAdditional Domain Aggregate Functions
New Perspectives on Microsoft Access 2002 Tutorial 6 29
XPAdd the date, page numbers, and title to a report
• Placing the Date function into a text box to have the current date printed on a report: – The current date will appear in the report wherever you place the
control containing the Date function
• You may also want to add page numbers to the report: – Insert page numbers into your report and specify several options as
to how the page numbers should appear
• You can add a report title by adding a label control to the Report Header section: – Whatever text you place in the label control will be printed on the
report

New Perspectives on Microsoft Access 2002 Tutorial 6 30
XPAdd a date and page number to a report in Design view
In this figure, the date function has been added on the left side of the Page Header section.
The page number expression has been added on the right side of the Page Header section.
New Perspectives on Microsoft Access 2002 Tutorial 6 31
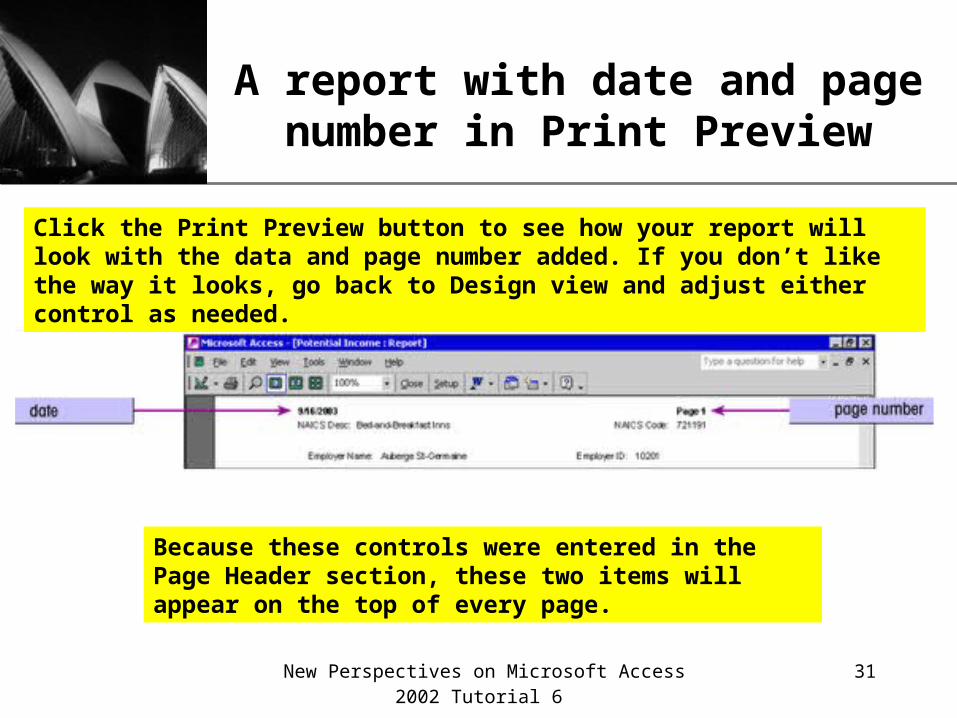
XPA report with date and page number in Print Preview
Click the Print Preview button to see how your report will look with the data and page number added. If you don’t like the way it looks, go back to Design view and adjust either control as needed.
Because these controls were entered in the Page Header section, these two items will appear on the top of every page.
New Perspectives on Microsoft Access 2002 Tutorial 6 32
XPCreate and modify mailing labels
• If you want to create mailing labels (or labels of any kind), you can use the Label Wizard.
• The Label Wizard will walk you through the selection of the type of label you want and label layout.
• You can use a table or a query as the basis for the labels.

New Perspectives on Microsoft Access 2002 Tutorial 6 33
XPOpen the Label Wizard
• Click Reports in the Access Object bar.• Click the New button in the Database window.• Click Label Wizard, then click the list arrow to
display a list of tables and queries. Select one, and click the OK button to open the Label Wizard dialog box.
• You can select the label type that you want to print in the first Label Wizard dialog box.

New Perspectives on Microsoft Access 2002 Tutorial 6 34
XPChoosing a label type
You can choose the type of label you want to print in this dialog box.
New Perspectives on Microsoft Access 2002 Tutorial 6 35
XPFormat your labels
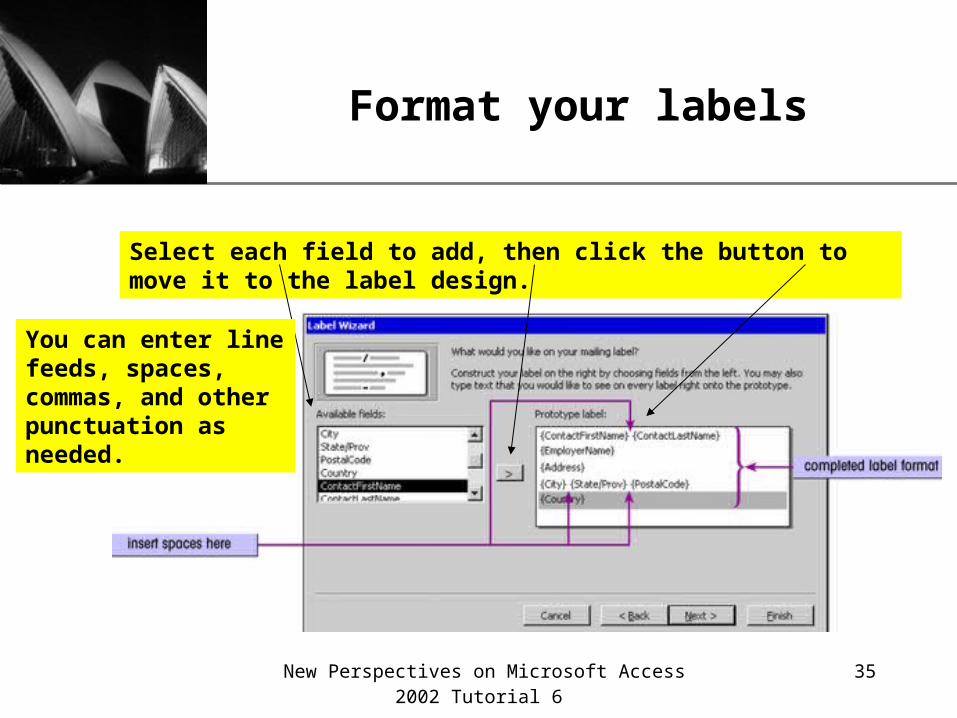
Select each field to add, then click the button to move it to the label design.
You can enter line feeds, spaces, commas, and other punctuation as needed.