1
This is the same event data as box 2 but sampled at high spa5al resolu5on. The cross‐shaped Chandra PSF is elongated and bluer (harder) in the NW, unlike any other source in the COUP data. The posi5ons of θ 2 Ori A1+A2 and θ 2 Ori A3 are superposed. Image reconstruc5on confirms this result: the hard x‐rays are produced by the ~5 M A3 companion, not the high‐mass SB A1+A2. During the flare, A3 accounts for ⅔ of the total x‐ray luminosity. Though high L X is not typically seen in intermediate‐mass stars, we note that the second brightest x‐ray source in Orion, θ 1 Ori E, is a late‐B + early G SB. -0.2 0.0 0.2 0.4 0.6 0.8 1.0 1.2 Phase -400 -200 0 200 400 600 800 <B z > [G] Chandra Orion Ultra‐deep Project (COUP) image of the central 2’ of the 3×10 5 year‐old Orion Nebula cluster. North is up, east is to the le^. θ 1 Ori C (O5.5 V) is the bright saturated source at center. θ 2 Ori A (O9.5 V) is the bright orange source near the southeast corner. In this false‐color image, red represents so^ 0.3‐1.5 keV counts, green 1.5‐2.5 keV counts, and blue hard 2.5‐8 keV counts. The data, obtained over the course of 10 days in January, 2003, show strong x‐ray flares from the blue low‐mass T Tauri stars and lower‐amplitude, periodic varia5ons from the so^er O stars. X‐rays and Magne-c Fields on Young OB Stars Marc Gagné 1 , David Cohen 2 , Stan Owocki 3 , Leisa Townsley 4 and Pat Broos 4 1 West Chester University, 2 Swarthmore College, 3 Bartol Ins5tute, 4 Penn State University Isothermal 3D MHD simula5on of magne5cally confined wind shocks on the central star of the Orion Nebula, θ 1 Ori C (O5.5 V). This snapshot of wind speed (in cm s ‐1 ) shows that shocks near the magne5c equatorial plane are fast enough to produce hard x‐rays. The 3D simula5ons provide the azimuthal extent of the shocks, needed to es5mate the total x‐ray emission measure. In the simula5ons the field is Ini5ally dipolar with B p = 1100 G. Mass loss distorts the field lines (in black), channeling plasma from high magne5c la5tudes to the equatorial plane. Courtesy Asif ud‐Doula. Peter Con5 (1972) noted the variable spectral type of θ 1 Orionis C (O5.5 V), the central star of the Orion Nebula. Nolan Walborn (1972 , 1973) defined the Of?p stars and suggested in 1981 that θ 1 Ori C’s spectral varia5ons were magne5c in nature, like those of the magne5c star σ Ori E (B2 Vp). In addi5on to the He‐strong Bp stars, a dozen or so O and very early B stars now have measured magne5c fields: τ Sco (B0.2 V), ζ Ori (O9.7 I), HD 191612 (O8 f?p), HD 36879 (O7 V), HD 148937 (O6.5 f?p), HD 152408 (O8 Iafpe), HD 155806 (O7.5 V[n]e) and the young O4 V ((f)) star 9 Sgr, though no fields are as strong as θ 1 Ori C’s. Le0 panel1 Ori C’s longitudinal field strength versus phase from Hubrig et al. (2008). Right panel: Chandra 0.3‐8 keV count rate versus phase (data points with error bars). Also shown is its Hα equivalent width versus phase (solid line). Maximum field strength, Hα and x‐ray emission are seen at phase 0.0 when the oblique magne5c rotator is seen pole‐on. At phase 0.5, the magne5c equator is seen edge‐on. Chandra HETG spectrum of the magne5c B0.2 dwarf τ Scorpii, a member of the 5 Myr old Sco OB2 associa5on. B p ≈ 500 G, its magne5c topology is complex and it’s an ultra‐slow rotator with P rot = 41 days (Dona5 et al. 2006). τ Sco’s x‐ray lines (black line in lower le^ panel) are narrower than θ 1 Ori C‘s, but broader than coronal lines (gray line). τ Sco’s rich X‐ray spectrum arises from harder shocks than those in older B0 stars like β Crucis. theta 2 Ori A3 (0.383") theta 2 Ori A1+A2 29.4 29.6 29.8 18:20:30.0 30.2 30.4 -16:10:50.0 48.0 46.0 44.0 42.0 40.0 NE component CEN 1B (O4 V) SW component CEN 1A (O4 V) Top panel: Raw (red) and pileup corrected (black) count rates of CEN 1A in 2002 and 2006. CEN 1B shows a similar range of count rates, but not the ramp seen on CEN 1A in 2006 August. Lower panels: the pileup corrected CCD spectra of CEN 1B (le^) and CEN 1A (right) show very high temperatures of 100 MK and 35 MK. CEN 1A shows a 6.5 keV Fe Kα line as well. This type of hard variable emission is reminiscent of η Car and HR 5980. In LBV and WR binaries, the x‐rays arise in the wind interac5on zone between two very massive stars. Thus CEN 1 may be a hierarchical quadruple system. 10 4 10 3 0.01 0.1 Counts/s/keV 1 5 2 5 . 0 0.01 0 0.01 residuals Energy (keV) 0.8 keV 9.9 keV N H =1.9 10 22 Z=0.5 Z sol L x =2 10 33 ergs/s 3.2 keV 0.9 keV N H =2.2 10 22 Z = 0.5 Z sol L x =3 10 33 ergs/s 10 4 10 3 0.01 0.1 Counts/s/keV 1 5 2 5 . 0 0.01 0 0.01 residuals Energy (keV) 0 200 400 600 800 time (ks) 0.2 0.3 0.4 0.5 0.6 0.7 photons/ks/cm^2 CEN 1A pileup corrected count rate CEN 1A piled up raw count rate 2002 Mar 2 2006 Aug 1 2006 Aug 7 2006 Nov 6 2006 Nov 8 2006 Nov 11 This Chandra 0.3‐8 keV high‐resolu5on image of the core of M17, reveals a pair of hard, variable x‐ray sources separated by 1.8” (> 3000 AU at the distance of M17). The O4 pair CEN 1A and 1B (a^er Chini, Elsaesser & Neckel 1980) is the ionizing source of the Omega Nebula. So^er, diffuse x‐rays pervade the cavity to the east. The cluster contains at least 2000 x‐ray point sources (blue circles). All 14 O stars in M17 are detected with Chandra. Most like CEN 1A and 1B show anomalously hard x‐rays. Chandra HETG spectra to be obtained in 2009 on CEN 1A+1B will measure f/i ra5os and line widths. The Mg XI resonance, intercombina5on and forbidden of θ 1 Ori C (solid histogram and error bars). The three panels show the expected line strengths at three radii (red doed lines). Note the forbidden line strength at 4 R . Lower le0: 2D non‐isothermal MHD simula5on of MCWS on θ 1 Ori C. These simula5ons include a detailed treatment of the wind energy balance, accoun5ng for both shock hea5ng and radia5ve cooling. The black contour contains 1‐40 MK plasma. The MCWS model predicts the right amount, temperature and loca5on of the x‐ray eming plasma. Chandra high‐energy transmission gra5ng spectra of the magne5c O dwarf θ 1 Ori C and the non‐magne5c O supergiant ζ Puppis. The x‐ray lines of ζ Pup are broad, asymmetric, and formed throughout the wind star5ng at a radius of just 1.5 R * . ζ Pup’s 4 MK shocks produce a rela5vely weak bremsstrahlung con5nuum. The forbidden lines of He‐like Si, Mg and Ne are weak because electrons in the upper level of the forbidden line are photo‐excited to the upper level of the intercombina5on line. θ 1 Ori C‘s lines are resolved but narrower and symmetric. The strong con5nuum emission, and strong lines of Fe XXV, S XVI and Si XIV indicate very high shock temperatures. ζ Pup O4 If θ 1 Ori C O5.5 V Si XIII Si XIV Mg XI Mg XII Ne IX Ne X θ 1 Ori C: T ≈ 33 MK, R shock ≈2R , v turb ≈ 350 km s ‐1 ζ Pup: T ≈ 4 MK, R 0 ≈ 1.5R , v HWHM ≈ 1000 km s ‐1 The third brightest x‐ray source in Orion and the only other O star, θ 2 Ori A, is a hierarchical triple: a spectroscopic binary A1 (O9.5 V, 25 M ) + A2 (8 M ) in an ellip5cal orbit with a = 0.47 AU and A3 (5 M ) at 0.4” (160 AU at a distance of 400 pc). Long‐ and short‐term variability, including a strong, hard flare, were seen in the COUP light curve. Schulz et al. (2006) proposed that both A1 and A2 are magne5c stars (lower‐mass analogs of θ 1 Ori C) and further suggested that the flares reported by Stelzer et al. (2005) and Feigelson et al. (2002) were manifesta5ons of binary‐induced reconnec5on wherein the magnetospheres of A1 and A2 interact at periastron. Stelzer et al. (2005) MCWS: θ 2 Ori A1 primary (O9.5, so^) COUP flare: θ 2 Ori A3 (hard) X‐ray Proper+es of Magne+c O4‐B0 Dwarfs 1. Polar field strengths of 50‐1100 G, fossil fields 2. Young (less than 5 Myr) 3. Strong fields slow rotators 4. X‐rays from magne5cally confined wind shocks 5. Moderate‐amplitude, periodic x‐ray emission 6. Symmetric lines, small redshi^s 7. Variability caused by rota5on and occulta5on 8. 200‐1000 km s ‐1 x‐ray line widths, depending on confinement 9. 8‐40 MK shocks, depending on confinement 10. 1.5‐3.0 R x‐ray forma5on radius 11. No x‐ray flares observed on magne5c OB stars, though flares seen on σ Ori E (B2 Vp) 12. Long‐term, large‐amplitude variability and very hard x‐rays may indicate colliding wind shocks, not magne5c confinement Strategies for Finding Magne+c OB Stars Though magne5c fields have been detected on OB dwarfs, He‐strong Bp stars, He‐weak Bp stars, slowly pulsa5ng B stars, β Cephei stars, δ Scu5 stars, and Herbig Be stars (e.g., Hubrig et al. 2006, Briquet et al. 2007, Bouret et al. 2007 and 2008, Alecian et al. 2008a and 2008b, Wade et al. 2006, Dona5 et al. 2006, Dona5 et al. 2002), fields on most OB stars are weak or absent. Though hard and variable x‐rays from θ 1 Ori C, θ 2 Ori A and τ Sco strongly suggest magne5c wind shocks, in broad‐band surveys most other OB stars (magne5c and non‐magne5c) have rela5vely so^, constant x‐rays. High‐resolu5on x‐ray spectroscopy is needed. R fir = 1.2 R R fir = 2.1 R R fir =4 R

X‐rays and Magnec Fields on Young OB Stars · CEN 1B (O4 V) SW component CEN 1A (O4 V) Top panel: Raw (red) and pileup corrected (black) count rates of CEN 1A in 2002 and 2006

Embed Size (px)

Citation preview

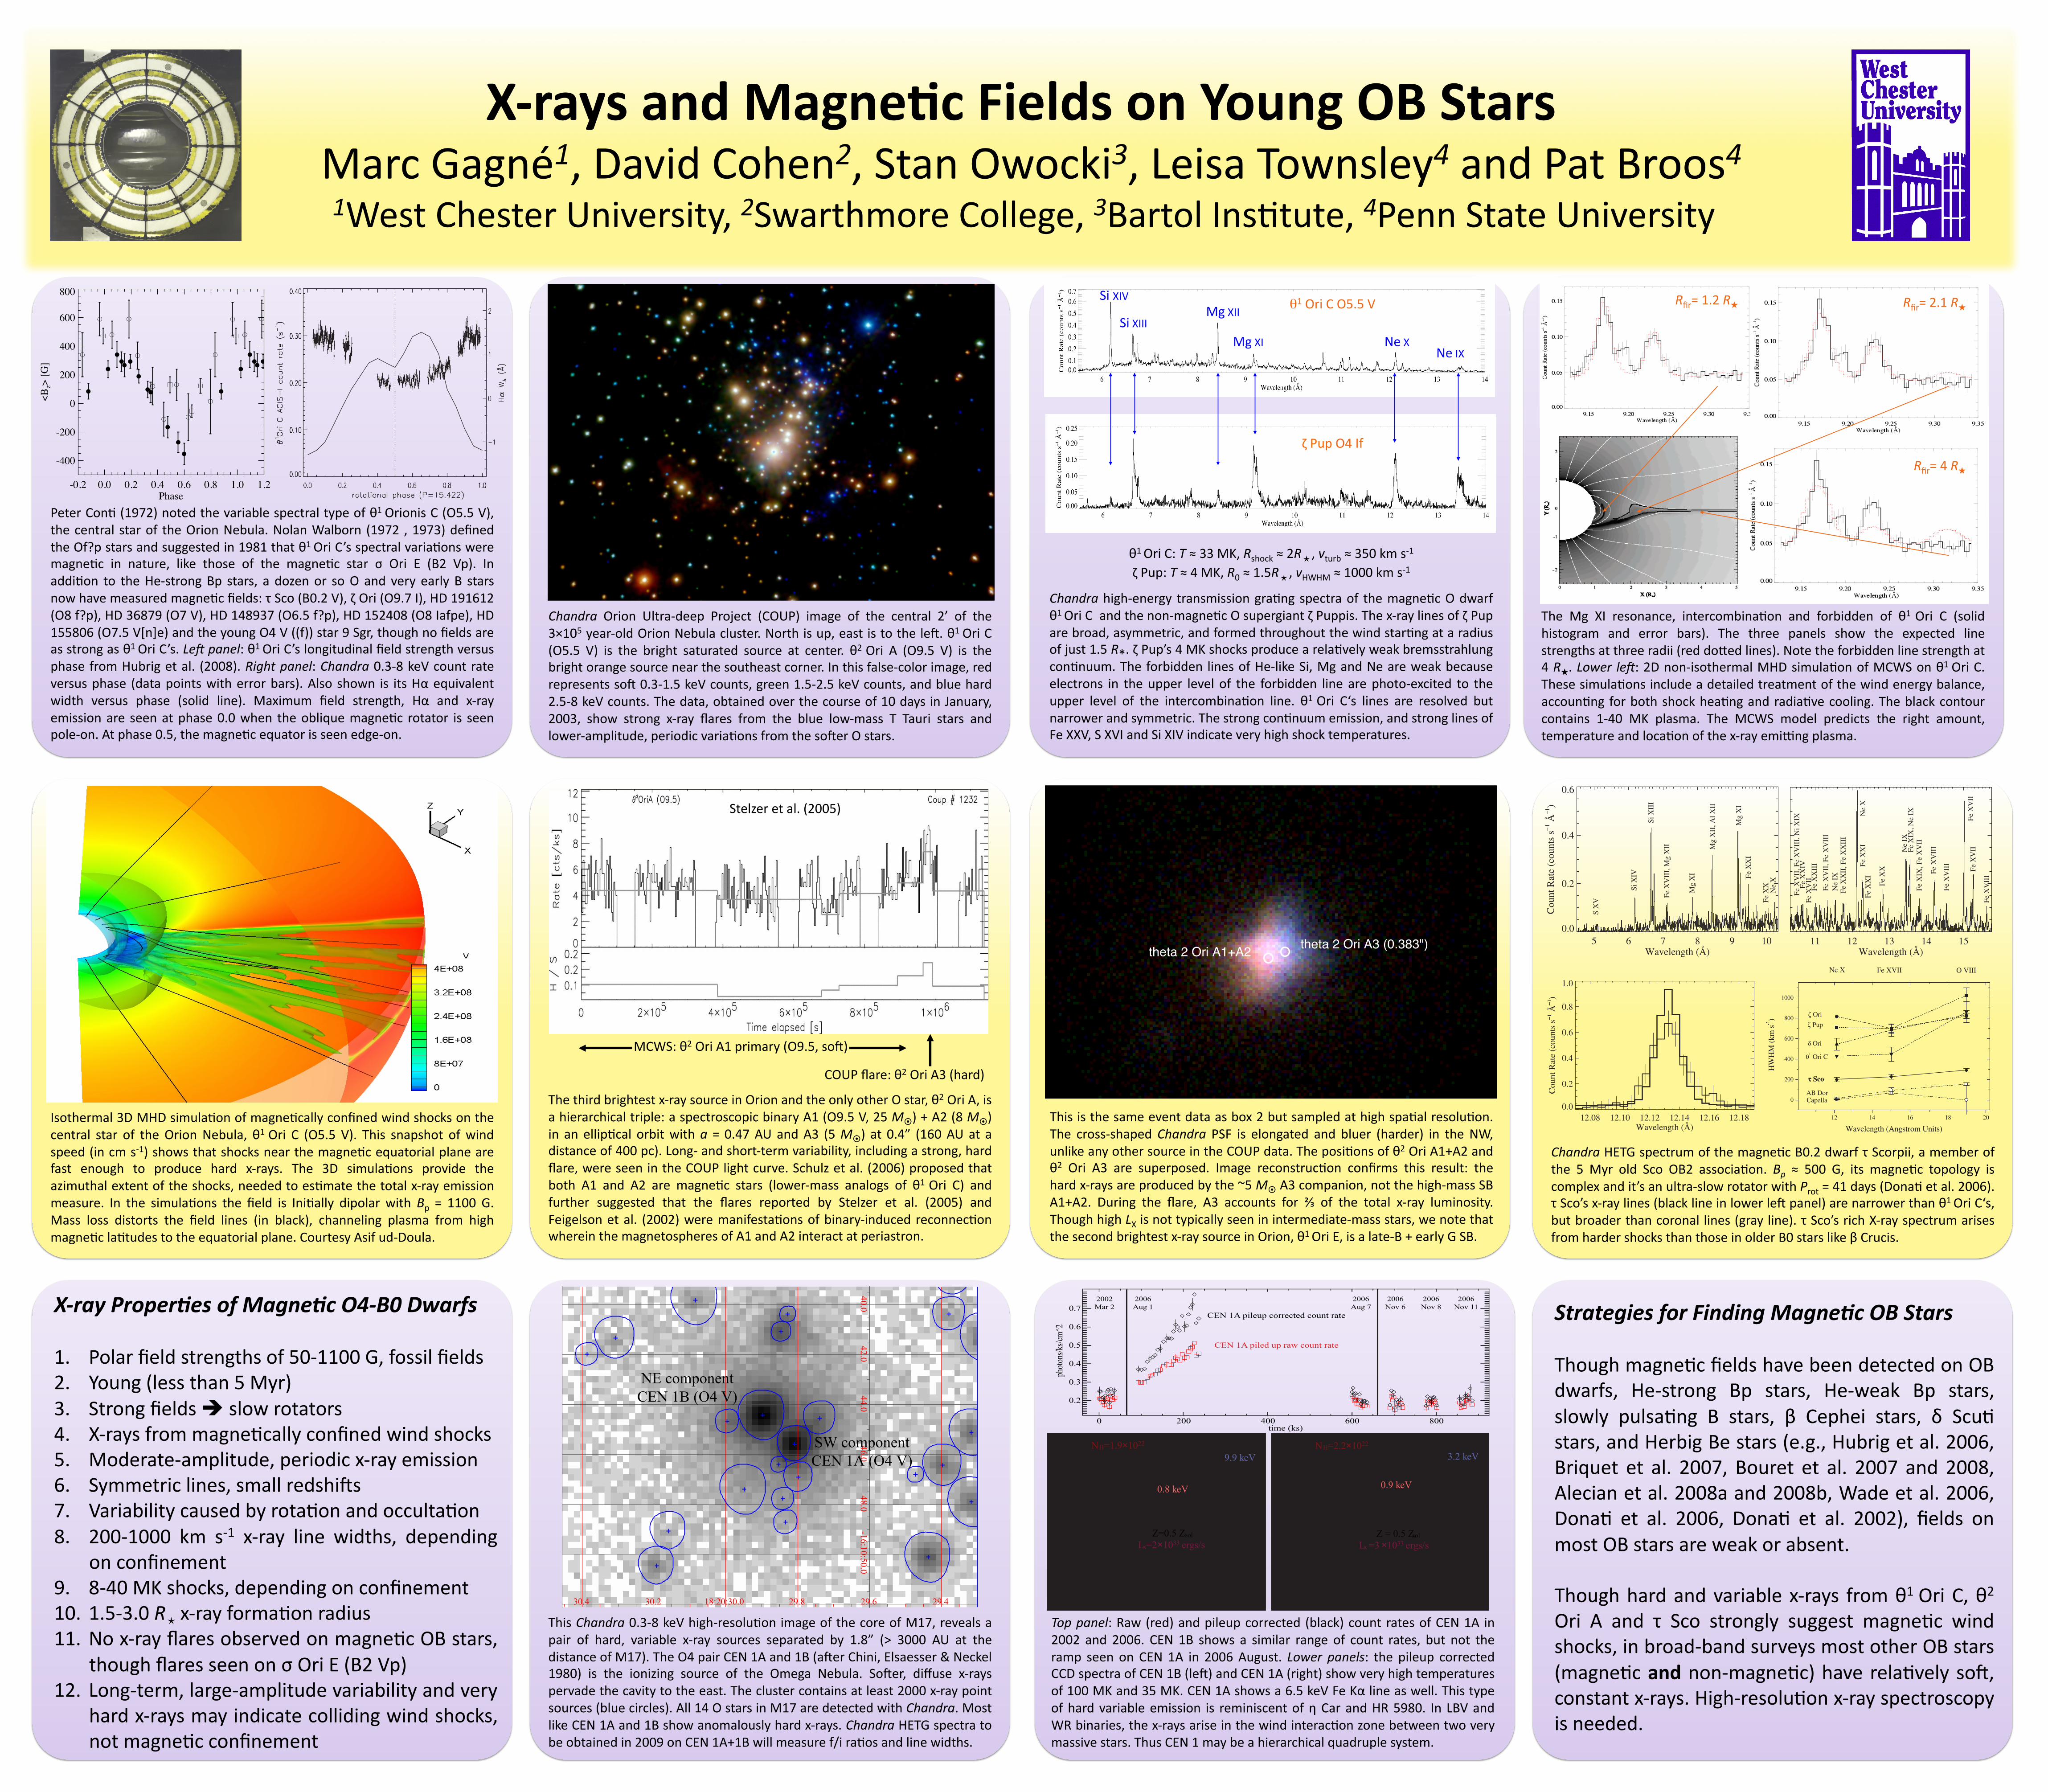
Thisisthesameeventdataasbox2butsampledathighspa5alresolu5on.The cross‐shapedChandra PSF is elongated and bluer (harder) in theNW,unlikeanyothersourceintheCOUPdata.Theposi5onsofθ2OriA1+A2andθ2 Ori A3 are superposed. Image reconstruc5on confirms this result: thehardx‐raysareproducedbythe~5MA3companion,notthehigh‐massSBA1+A2. During the flare, A3 accounts for ⅔ of the total x‐ray luminosity.ThoughhighLXisnottypicallyseeninintermediate‐massstars,wenotethatthesecondbrightestx‐raysourceinOrion,θ1OriE,isalate‐B+earlyGSB.

-0.2 0.0 0.2 0.4 0.6 0.8 1.0 1.2

Phase

-400

-200

0

200

400

600

800

<B

z>

[G

]

Chandra Orion Ultra‐deep Project (COUP) image of the central 2’ of the3×105year‐oldOrionNebulacluster.Northisup,eastistothele^.θ1OriC(O5.5 V) is the bright saturated source at center. θ2Ori A (O9.5 V) is thebrightorangesourcenearthesoutheastcorner.Inthisfalse‐colorimage,redrepresentsso^0.3‐1.5keVcounts,green1.5‐2.5keVcounts,andbluehard2.5‐8keVcounts.Thedata,obtainedoverthecourseof10daysinJanuary,2003, show strong x‐ray flares from the blue low‐mass T Tauri stars andlower‐amplitude,periodicvaria5onsfromtheso^erOstars.

X‐raysandMagne-cFieldsonYoungOBStarsMarcGagné1,DavidCohen2,StanOwocki3,LeisaTownsley4andPatBroos4

1WestChesterUniversity,2SwarthmoreCollege,3BartolIns5tute,4PennStateUniversity

Isothermal3DMHDsimula5onofmagne5callyconfinedwindshocksonthecentral star of theOrionNebula, θ1Ori C (O5.5 V). This snapshot ofwindspeed(incms‐1)showsthatshocksnearthemagne5cequatorialplanearefast enough to produce hard x‐rays. The 3D simula5ons provide theazimuthalextentoftheshocks,neededtoes5matethetotalx‐rayemissionmeasure. In the simula5ons the field is Ini5ally dipolar withBp = 1100 G.Mass loss distorts the field lines (in black), channeling plasma from highmagne5cla5tudestotheequatorialplane.CourtesyAsifud‐Doula.

PeterCon5(1972)notedthevariablespectraltypeofθ1OrionisC(O5.5V),thecentral starof theOrionNebula.NolanWalborn (1972 ,1973)definedtheOf?pstarsandsuggestedin1981thatθ1OriC’sspectralvaria5onsweremagne5c in nature, like those of the magne5c star σ Ori E (B2 Vp). Inaddi5on to theHe‐strongBp stars, a dozenor soOand very earlyB starsnowhavemeasuredmagne5cfields:τSco(B0.2V),ζOri(O9.7I),HD191612(O8f?p),HD36879(O7V),HD148937(O6.5f?p),HD152408(O8Iafpe),HD155806(O7.5V[n]e)andtheyoungO4V((f))star9Sgr,thoughnofieldsareasstrongasθ1OriC’s.Le0panel:θ1OriC’slongitudinalfieldstrengthversusphasefromHubrigetal. (2008).Rightpanel:Chandra0.3‐8keVcountrateversusphase (datapointswitherrorbars).Alsoshown is itsHαequivalentwidth versus phase (solid line). Maximum field strength, Hα and x‐rayemissionare seenatphase0.0when theobliquemagne5c rotator is seenpole‐on.Atphase0.5,themagne5cequatorisseenedge‐on.

ChandraHETGspectrumofthemagne5cB0.2dwarfτScorpii,amemberofthe 5 Myr old Sco OB2 associa5on. Bp ≈ 500 G, its magne5c topology iscomplexandit’sanultra‐slowrotatorwithProt=41days(Dona5etal.2006).τSco’sx‐raylines(blacklineinlowerle^panel)arenarrowerthanθ1OriC‘s,butbroaderthancoronallines(grayline).τSco’srichX‐rayspectrumarisesfromhardershocksthanthoseinolderB0starslikeβCrucis.

theta 2 Ori A3 (0.383")theta 2 Ori A1+A2

29.429.629.818:20:30.030.230.4

-16

:10

:50

.04

8.0

46

.04

4.0

42

.04

0.0

NE component

CEN 1B (O4 V)

SW component

CEN 1A (O4 V)

Toppanel:Raw(red)andpileupcorrected(black)countratesofCEN1A in2002 and 2006. CEN 1B shows a similar range of count rates, but not theramp seen on CEN 1A in 2006August. Lower panels: the pileup correctedCCDspectraofCEN1B(le^)andCEN1A(right)showveryhightemperaturesof100MKand35MK.CEN1Ashowsa6.5keVFeKαlineaswell.Thistypeofhardvariableemission is reminiscentofηCarandHR5980. In LBVandWRbinaries,thex‐raysariseinthewindinterac5onzonebetweentwoverymassivestars.ThusCEN1maybeahierarchicalquadruplesystem.

10 4

10 3

0.01

0.1

Counts

/s/k

eV

1 525.0

0.01

0

0.01

resi

dual

s

Energy (keV)

0.8 keV

9.9 keV

NH=1.9 1022

Z=0.5 Z sol

Lx=2 1033 ergs/s

3.2 keV

0.9 keV

NH=2.2 1022

Z = 0.5 Z sol

Lx =3 1033 ergs/s

10 4

10 3

0.01

0.1

Counts

/s/k

eV

1 525.0

0.01

0

0.01

resi

dual

s

Energy (keV)

0 200 400 600 800time (ks)

0.2

0.3

0.4

0.5

0.6

0.7

phot

ons/

ks/c

m^2

CEN 1A pileup corrected count rate

CEN 1A piled up raw count rate

2002

Mar 2

2006

Aug 1

2006

Aug 7

2006

Nov 6

2006

Nov 8

2006

Nov 11

ThisChandra0.3‐8keVhigh‐resolu5onimageofthecoreofM17,revealsapair of hard, variable x‐ray sources separated by 1.8” (> 3000 AU at thedistanceofM17).TheO4pairCEN1Aand1B(a^erChini,Elsaesser&Neckel1980) is the ionizing source of the Omega Nebula. So^er, diffuse x‐rayspervadethecavitytotheeast.Theclustercontainsatleast2000x‐raypointsources(bluecircles).All14OstarsinM17aredetectedwithChandra.MostlikeCEN1Aand1Bshowanomalouslyhardx‐rays.ChandraHETGspectratobeobtainedin2009onCEN1A+1Bwillmeasuref/ira5osandlinewidths.

TheMg XI resonance, intercombina5on and forbidden of θ1 Ori C (solidhistogram and error bars). The three panels show the expected linestrengthsatthreeradii(reddo�edlines).Notetheforbiddenlinestrengthat4R★.Lower le0:2Dnon‐isothermalMHDsimula5onofMCWSonθ1OriC.Thesesimula5onsincludeadetailedtreatmentofthewindenergybalance,accoun5ngforbothshockhea5ngandradia5vecooling.Theblackcontourcontains 1‐40 MK plasma. The MCWS model predicts the right amount,temperatureandloca5onofthex‐rayemi�ngplasma.

Chandrahigh‐energy transmissiongra5ngspectraof themagne5cOdwarfθ1OriCandthenon‐magne5cOsupergiantζPuppis.Thex‐raylinesofζPuparebroad,asymmetric,andformedthroughoutthewindstar5ngataradiusofjust1.5R*.ζPup’s4MKshocksproducearela5velyweakbremsstrahlungcon5nuum.Theforbidden linesofHe‐likeSi,MgandNeareweakbecauseelectrons in theupper level of the forbidden line arephoto‐excited to theupper level of the intercombina5on line. θ1Ori C‘s lines are resolved butnarrowerandsymmetric.Thestrongcon5nuumemission,andstronglinesofFeXXV,SXVIandSiXIVindicateveryhighshocktemperatures.

ζPupO4If

θ1OriCO5.5VSiXIII

SiXIV

MgXI

MgXII

NeIXNeX

θ1OriC:T≈33MK,Rshock≈2R⋆,vturb≈350kms‐1

ζPup:T≈4MK,R0≈1.5R⋆,vHWHM≈1000kms‐1

Thethirdbrightestx‐raysourceinOrionandtheonlyotherOstar,θ2OriA,isahierarchicaltriple:aspectroscopicbinaryA1(O9.5V,25M)+A2(8M)in anellip5cal orbitwitha = 0.47AUandA3 (5M) at 0.4” (160AUat adistanceof400pc).Long‐andshort‐termvariability,includingastrong,hardflare,wereseenintheCOUPlightcurve.Schulzetal.(2006)proposedthatboth A1 and A2 are magne5c stars (lower‐mass analogs of θ1Ori C) andfurther suggested that the flares reported by Stelzer et al. (2005) andFeigelsonetal. (2002)weremanifesta5onsofbinary‐inducedreconnec5onwhereinthemagnetospheresofA1andA2interactatperiastron.

Stelzeretal.(2005)

MCWS:θ2OriA1primary(O9.5,so^)

COUPflare:θ2OriA3(hard)

X‐rayProper+esofMagne+cO4‐B0Dwarfs

1.  Polarfieldstrengthsof50‐1100G,fossilfields2.  Young(lessthan5Myr)3.  Strongfieldsslowrotators4.  X‐raysfrommagne5callyconfinedwindshocks5.  Moderate‐amplitude,periodicx‐rayemission6.  Symmetriclines,smallredshi^s7.  Variabilitycausedbyrota5onandocculta5on8.  200‐1000 km s‐1 x‐ray line widths, depending

onconfinement9.  8‐40MKshocks,dependingonconfinement10.  1.5‐3.0R⋆x‐rayforma5onradius11.  Nox‐rayflaresobservedonmagne5cOBstars,

thoughflaresseenonσOriE(B2Vp)12.  Long‐term,large‐amplitudevariabilityandvery

hardx‐raysmayindicatecollidingwindshocks,notmagne5cconfinement

StrategiesforFindingMagne+cOBStars

Thoughmagne5cfieldshavebeendetectedonOBdwarfs, He‐strong Bp stars, He‐weak Bp stars,slowly pulsa5ng B stars, β Cephei stars, δ Scu5stars,andHerbigBestars(e.g.,Hubrigetal.2006,Briquet et al. 2007,Bouret et al. 2007 and2008,Alecianetal.2008aand2008b,Wadeetal.2006,Dona5 et al. 2006, Dona5 et al. 2002), fields onmostOBstarsareweakorabsent.

Thoughhardandvariablex‐rays fromθ1OriC,θ2Ori A and τ Sco strongly suggest magne5c windshocks,inbroad‐bandsurveysmostotherOBstars(magne5candnon‐magne5c)haverela5velyso^,constantx‐rays.High‐resolu5onx‐rayspectroscopyisneeded.

Rfir=1.2R★ Rfir=2.1R★

Rfir=4R★