Embed Size (px)
Citation preview
1100tthh SSlloovvaakk GGeeoopphhyyssiiccaall CCoonnffeerreennccee August 19 – 21, 2013, Smolenice, Slovak Republic
Abstracts
60th Anniversary Geophysical Institute, Slovak Academy of Sciences
1953 – 2013

ISBN 978-80-85754-27-8
EAN 9788085754278
Geophysical Institute, Slovak Academy of Sciences Dúbravská cesta 9, 845 28 Bratislava, Slovak Republic

Organized by
Geophysical Institute, Slovak Academy of Sciences Dúbravská cesta 9, 845 28 Bratislava, Slovak Republic
Department of Astronomy, Physics of the Earth and Meteorology, Faculty of Mathematics, Physics and Informatics, Comenius University
Mlynská dolina F1, 842 48, Bratislava, Slovak Republic
Department of Applied and Environmental Geophysics, Faculty of Natural Sciences, Comenius University
Mlynská dolina, pav. G, 842 15, Bratislava, Slovak Republic
Department of Theoretical Geodesy, Faculty of Civil Engineering, Slovak University of Technology,
Radlinského 11, 813 68 Bratislava, Slovak Republic

Scientific Organizing Committee
Miroslav Bielik, DAEG FNS UK Ladislav Brimich, GI SAS
Ján Hefty, DTG STU Peter Moczo, DAPEM FMFI UK
Sebastián Ševčík, DAPEM FMFI UK Jozef Kristek, DAPEM FMFI UK
Miriam Kristeková, GI SAS Peter Vajda, GI SAS
Dušan Majcin, GI SAS Fridrich Valach, GI SAS
Local Organizing Committee
Jana Dérerová, GI SAS Tomáš Šoltis, GI SAS
Andrej Cipciar, GI SAS Igor Kohút, GI SAS
Jaroslava Pánisová, GI SAS

Abstracts

10th Slovak Geopysical Conference August 19 – 21, 2013, Smolenice
7
Stability monitoring of Bratislava urban area through time series InSAR image analysis
Matúš BAKOŇ1, Juraj PAPČO1, Kristína BÁTOROVÁ2 1 Department of Theoretical Geodesy, Faculty of Civil Engineering, Slovak University of
Technology in Bratislava, Radlinského 11, 813 68 Bratislava 1, Slovak Republic, e-mail: [email protected], [email protected]
2 Department of Engineering Geology, Faculty of Natural Sciences, Comenius University in Bratislava, Mlynská dolina, 842 15 Bratislava 4, Pavilón G, Slovak Republic, e-mail: [email protected]
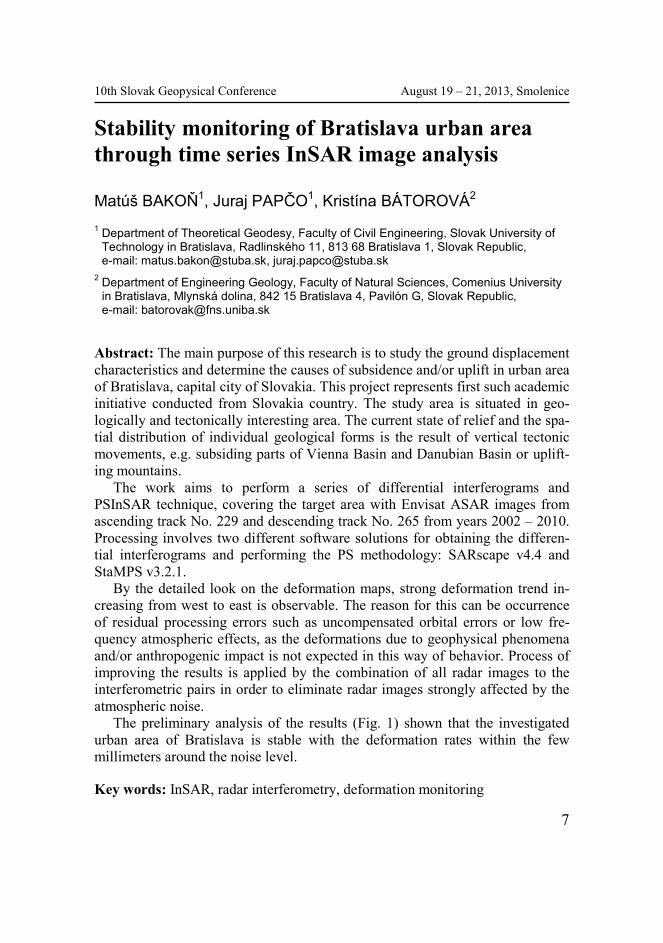
Abstract: The main purpose of this research is to study the ground displacement characteristics and determine the causes of subsidence and/or uplift in urban area of Bratislava, capital city of Slovakia. This project represents first such academic initiative conducted from Slovakia country. The study area is situated in geo-logically and tectonically interesting area. The current state of relief and the spa-tial distribution of individual geological forms is the result of vertical tectonic movements, e.g. subsiding parts of Vienna Basin and Danubian Basin or uplift-ing mountains.
The work aims to perform a series of differential interferograms and PSInSAR technique, covering the target area with Envisat ASAR images from ascending track No. 229 and descending track No. 265 from years 2002 – 2010. Processing involves two different software solutions for obtaining the differen-tial interferograms and performing the PS methodology: SARscape v4.4 and StaMPS v3.2.1.
By the detailed look on the deformation maps, strong deformation trend in-creasing from west to east is observable. The reason for this can be occurrence of residual processing errors such as uncompensated orbital errors or low fre-quency atmospheric effects, as the deformations due to geophysical phenomena and/or anthropogenic impact is not expected in this way of behavior. Process of improving the results is applied by the combination of all radar images to the interferometric pairs in order to eliminate radar images strongly affected by the atmospheric noise.
The preliminary analysis of the results (Fig. 1) shown that the investigated urban area of Bratislava is stable with the deformation rates within the few millimeters around the noise level.
Key words: InSAR, radar interferometry, deformation monitoring

10th Slovak Geopysical Conference August 19 – 21, 2013, Smolenice
8
References Papčo, J., Bakoň, M., 2011: Detection of Ground Deformation Using Radar Interferometry Tech-
niques. European Space Agency (ESA) Earth Observing Category 1 Project ID 9981. Papčo, J., Bakoň, M., 2012: Object Recognition Based on High Resolution Radar Imagery.
Deutschen Zentrum furn Luft- und Raumfahrt (DLR) TSX-Archive-2012 Project ID LAN1583.
Fig. 1. Deformation maps of the Bratislava and surrounding area.

10th Slovak Geopysical Conference August 19 – 21, 2013, Smolenice
9
Colours of stress
Martin BEDNÁRIK1, Igor KOHÚT1 1 Geophysical Institute of the Slovak Academy of Sciences,
Dúbravská cesta 9, 845 28 Bratislava, Slovak Republic, e-mail: [email protected]
Abstract: Stress tensor at a point cannot be rendered by colour only. Neverthe-less, the relationships between the three principal stress values can be efficiently translated into an intuitively-readable colour map of stress. For this purpose we constructed three-dimensional colour functions (Bednárik and Kohút, 2012). We tested their performance on a stress field generated by the Brazilian test (Fig. 1). We can only recommend this promising visualization technique for applications in tectonics, geotechnics or seismic wave propagation modelling.
Key words: principal stress values, three-dimensional colour function
References Bednárik M., Kohut I., 2012: Three-dimensional colour functions for stress state visualisation.
Computers and Geosciences, 48, 117–125.
Fig. 1. Detail of the colour map of the stress field near one of the load application regions in Brazilian test.

10th Slovak Geopysical Conference August 19 – 21, 2013, Smolenice
10
Deep-seated magnetic and geoelectric anomalies in the Western Carpathians
Vladimír BEZÁK1, Ľudovít KUCHARIČ2, Ján VOZÁR1 1 Geophysical Institute of the Slovak Academy of Sciences,
Dúbravská cesta 9, 845 28 Bratislava, Slovak Republic, e-mail: [email protected] 2 State Geological Institute of Dionýz Štúr,
Mlynská dolina 1, 817 04 Bratislava 11, Slovak Republic
Abstract: Magnetic map of Slovakia (Kubeš et al., 2008) shows distribution of rock complexes with higher magnetic properties. A basic division of magnetic anomalies according to geological provenance is as follows: • The first group contains well identifiable rock complexes situated mostly on
the surface, or in the shallow depths, represented by Neogene volcanic rocks developed on the surface and inside of Neogene sedimentary filling. There are also the Early and Late Paleozoic volcanics (mailny in Gemericum and Hronicum), basic and ultrabasic rocks of oceanic crust in Meliaticum and finally magnetic rocks belonging to crystalline basement (amphibolites, tonalites, mica-schists, gneisses) of various tectonic units.
• The second group is represented by large deep-seated (a depth more than 3 – 4 km) magnetic anomalies caused mainly by Cadomian basement or similar type of relatively heavy and magnetic crust. These are occured in the North below overthrusted the Outer Carpahians (Brunia); or in the blocks of the structure of the Inner Western Carpathians – mainly to the South of the Klippen belt and finaly in the South of Slovakia. Another types of deep-seated anomalies are connected with Neogene extension tectonics, that were caused by asthenolite ascent and accompanied of basic intrusions into crust (Danube and Transcarpathian basins). Several deep magnetic anomalies are situated within crystalline basement (tonalites?) bellow Tertiary sedimentary filling. Deep geoelectic anomalies (high conductivity zones) are connected with deep
and steep Neoalpine fault zones. A high condustivity is generated perhaps by crushed rocks containing higher amounts of carbon and fluids. Neoalpine faults are mostly of strike-slip character and separate the Inner Carpathians from the European platforme and individual tectonic blocks within Carpathians. That document “strike-slip type” of final stage of Western Carpathians Neoalpine

10th Slovak Geopysical Conference August 19 – 21, 2013, Smolenice
11
orogeny, which ended by “basin and ranges type of structure” connected with volcanic activity. Other types of higher conductive zones are caused by underlying metasedimentary complexes under granitic ones as a remnants of Hercynian tectonic pattern.
References
Kubeš P., Kucharič Ľ., Gluch A., Kohút M., Bezák V., Potfaj M. (2008): Magnetic map of Slovakia. Final report Manuscript, Geofond ŠGÚDŠ Bratislava, 1–45 (in Slovak).

10th Slovak Geopysical Conference August 19 – 21, 2013, Smolenice
12
Results of the extensometric measurements in Slovakia
Ladislav BRIMICH1, Martin BEDNÁRIK1 1 Geophysical Institute of the Slovak Academy of Sciences,
Dúbravská cesta 9, 845 28 Bratislava, Slovak Republic, e-mail: [email protected]
Abstract: The interpretation of the non-tidal deformations observed at the Vyhne tidal station showed that these deformations could be divided into three parts. The first component is periodical with the period about one year. The second one is not periodic. Moreover the short considerable changes in the rate of the slow deformations were observed. The comparison of the short changes of the slow deformations and the air pressure variations was made. From this comparison we can conclude that this part of the slow deformations is induced by the air pressure changes.
10th Slovak Geopysical Conference August 19 – 21, 2013, Smolenice
13
Surface displacements, deformations and gravity changes due to underground heat source
Ladislav BRIMICH1, Igor KOHÚT1 1 Geophysical Institute of the Slovak Academy of Sciences,
Dúbravská cesta 9, 845 28 Bratislava, Slovak Republic, e-mail: [email protected]
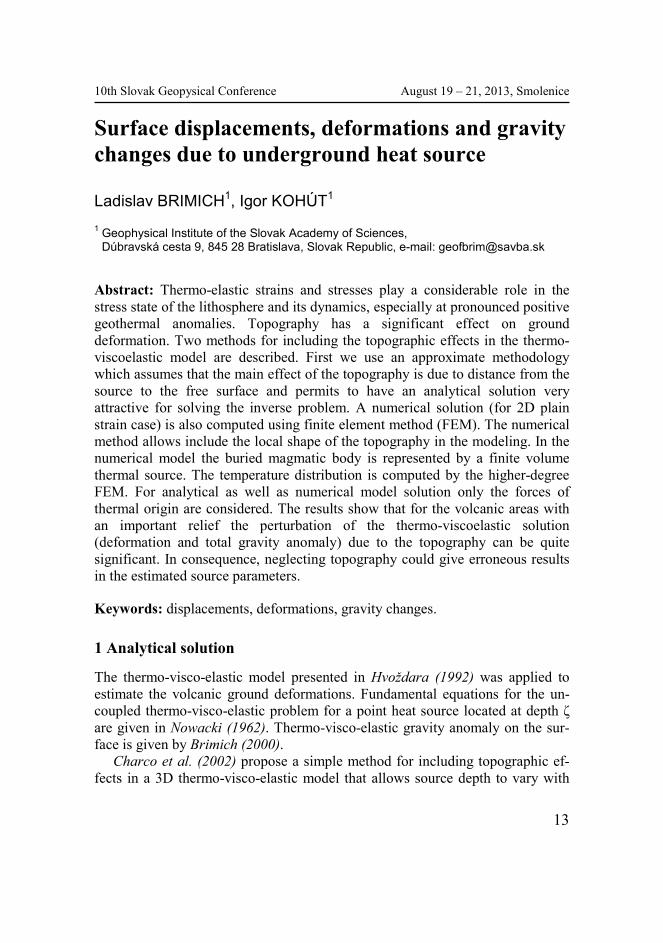
Abstract: Thermo-elastic strains and stresses play a considerable role in the stress state of the lithosphere and its dynamics, especially at pronounced positive geothermal anomalies. Topography has a significant effect on ground deformation. Two methods for including the topographic effects in the thermo-viscoelastic model are described. First we use an approximate methodology which assumes that the main effect of the topography is due to distance from the source to the free surface and permits to have an analytical solution very attractive for solving the inverse problem. A numerical solution (for 2D plain strain case) is also computed using finite element method (FEM). The numerical method allows include the local shape of the topography in the modeling. In the numerical model the buried magmatic body is represented by a finite volume thermal source. The temperature distribution is computed by the higher-degree FEM. For analytical as well as numerical model solution only the forces of thermal origin are considered. The results show that for the volcanic areas with an important relief the perturbation of the thermo-viscoelastic solution (deformation and total gravity anomaly) due to the topography can be quite significant. In consequence, neglecting topography could give erroneous results in the estimated source parameters.
Keywords: displacements, deformations, gravity changes.
1 Analytical solution
The thermo-visco-elastic model presented in Hvoždara (1992) was applied to estimate the volcanic ground deformations. Fundamental equations for the un-coupled thermo-visco-elastic problem for a point heat source located at depth ζ are given in Nowacki (1962). Thermo-visco-elastic gravity anomaly on the sur-face is given by Brimich (2000).
Charco et al. (2002) propose a simple method for including topographic ef-fects in a 3D thermo-visco-elastic model that allows source depth to vary with

10th Slovak Geopysical Conference August 19 – 21, 2013, Smolenice
14
the relief. On the Figs 1, 2 and 3 are given horizontal, vertical thermo-viscoelas-tic displacement (in m) as well as the gravity changes computed for different relaxation times and the static value (thermoelastic case) considering (a) a flat
Fig. 1. Radial displacements Fig. 2. Vertical displacements
Fig. 3. Gravity changes.

10th Slovak Geopysical Conference August 19 – 21, 2013, Smolenice
15
surface, and (b)-(d) axis-symmetric volcanic cone with an average slope of the flanks of 15º, 20º and 30º respectively. The influence of the topography is visible as the horizontal shift of maximal values of the both displacement components and particularly gravity changes.
2 Numerical solution
To include the topography effect in the thermoelastic solution we have used the finite element method computation. The principles and basics of finite-element method are generally known and are described in numerous monographs (e.g. Irons and Ahmad, 1986; Babuška and Szabo, 1990). All the computations are obtained by the COMSOL Multiphysics© software. Although numerical meth-ods are time consuming, their results are more precise than the analytical ap-proximate solutions since they allow to include structural characteristics of the medium as the topography.
The models are homogeneous, isotropic, axi-symmetric with respect to verti-cal axis. In this way, the 3D rock massif has been modeled by an axi-symmetric section with respect to vertical axis passing through the heat source with 2 ver-sions – with and without topographical feature modeling the volcano cone (of 2 km height). The summit of the volcano is located over the thermal source. The domain horizontal length is 120 km and the vertical span is from +2 to –38 km in order to minimize the influence of the external boundaries. The heat source is modeled by the spherical body in the 5 km depth. In the computation only the forces of thermal origin are considered.
At first step, the domain was divided into finite elements. The mesh corre-sponding to each plane section is formed by 19568 triangular elements. In the neighborhood of the thermal source, the mesh is refined into smaller elements due to the large gradients of computed fields in this area (see Fig. 4). On the Figs 5 and 6 are given radial and vertical displacements obtained using FEM.
3 Discussion
The methods described in this work can be very suitable to more complex mod-els that consider sources of different geometries and allow elastic properties of the medium to vary with depth. While the analytical approximate methodology can be very attractive for solving the inverse problem, the numerical method de-scribed above may be used to include the topography when accurate solution is desired since it permits the consideration of non-uniform elastic and thermal properties of the medium and the local shape of the Earth’s surface.

10th Slovak Geopysical Conference August 19 – 21, 2013, Smolenice
16
Fig. 4. Mesh with the position of the heat source.
Fig. 5. Radial displacements Fig. 6. Vertical displacements
Acknowledgements: The authors were supported by Vega Grant Agency under project No. 2/0067/12 and by the Slovak Research and Development Agency (contract No. APVV-0724-11).
References Babuška I., Szabo B., 1990: Finite Element Analysis, N.Y., J.Wiley Brimich, L. (2000).Thermoviscoelastic models of the deformations and gravity changes due to
anomalous source of heat. Acta geod. et geoph. Hung.,35, 37–48. Charco M., Brimich L., Fernández J., (2002): Topography effects on dis-placements and gravity
changes due to magma intrusions. Geologica Carpathica, 53, 4, 215–221. Hvoždara M., 1992: Thermo-viscoelastic deformation field due to a point source of heat in the
halfspace. Contr. Geophys. Inst. Slov. Acad. Sci., 22, 48–66. Irons B., Ahmad S., 1986: Techniques of Finite Elements, Chichester, Ellis Horwood. Nowacki, W. (1962). Thermoelasticity. Oxford, Pergamon Press.

10th Slovak Geopysical Conference August 19 – 21, 2013, Smolenice
17
Detailed Profile Gravity Measurements in the Pieniny Klippen Belt (Middle Váh Valley, Western Slovakia)
Jana BUČOVÁ1, Miroslav BIELIK1,2, Roman PAŠTEKA2, Mariana PAŠIAKOVÁ2, Dušan PLAŠIENKA3, Juraj PAPČO4 1 Geophysical Institute of the Slovak Academy of Sciences,
Dúbravská cesta 9, 845 28 Bratislava, Slovak Republic, e-mail: [email protected] 2 Department of Applied and Environmental Geophysics, Faculty of Natural Sciences of
Comenius University, Mlynská dolina, 842 15 Bratislava 4, Slovak Republic; e-mails: [email protected], [email protected], [email protected]
3 Department of Geology and Paleontology, Faculty of Natural Sciences of Comenius University, Mlynská dolina, 842 15 Bratislava 4, Slovak Republic; e-mail: [email protected]
4 Department of Theoretical Geodesy, Faculty of Civil Engineering of Slovak University of Technology, Radlinského 11, 813 68 Bratislava, Slovak Republic; e-mail: [email protected]
Abstract: The examined area is situated in the Púchov section of the Pieniny Klippen Belt (PKB) in western Slovakia, on the territory of municipalities Tuchyňa, Mikušovce, Červený Kameň and Kvašov (Fig.1). The main aim of our research was to broaden the present knowledge on geological structure of the PKB and on its tectonic connection to the surrounding regional units using the geophysical methods.
The profile gravity measurements consist of two parallel profiles named prof_1 and prof_2 of roughly NNW-SSE direction. The eastern section prof_1 has a length of 6.36 km; the western profile prof_2 is about 3.84 km long (Fig.1B). Measurements were carried out at intervals of 20 meters (overall 506 points were gauged) by gravimeters Scintrex CG3 and CG5. The acquire data were processed into the Bouguer gravity anomalies. The software package GM-SYS (Geosoft) was applied for the gravity modelling and the final geologi-cal-geophysical sections represent distribution of the lithological members with their specific density parameters (density values were determined by the own laboratory measurements of rock samples collected along the profiles). The den-sity modelling was also based on the results obtained by the geoelectrical explo-ration (vertical electric sounding and resistivity profiling), new surface geologi-cal mapping and borehole interpretation (continuously cored bores MIK-1 and

10th Slovak Geopysical Conference August 19 – 21, 2013, Smolenice
18
MIK-2). Presented detailed gravity measurements reflect density differences between
klippen (rigid limestone blocks) and their mantle (predominant marlstone) and they demonstrate that the primary fold-nappe system of the PKB was destructed by the subsequent deformation, resulting in the formation of the positive flower structure and backthrusting. Summing up, the new density modelling confirmed complex geological structure of the studied area and helped us to better interpret the tectonic evolution of the PKB.
Fig. 1. Location of the gravimetric profiles (prof_1 and prof_2). A: General position of the profiles in Slovakia. B: Detail 3D topographic map of the studied profiles (black lines).

10th Slovak Geopysical Conference August 19 – 21, 2013, Smolenice
19
Key words: applied geophysics, gravity measurements, Bouguer gravity anom-alies, Pieniny Klippen Belt, Western Carpathians
Acknowledgements: The authors are thankful to the Slovak Research and Development Agency (grants APVV-0465-06 and LPP-0225-06) and the Slovak Grant Agency VEGA (grant No. 1/0095/12) for the financial support.

10th Slovak Geopysical Conference August 19 – 21, 2013, Smolenice
20
Near real-time web based automatic processing of macroseismic questionnaires – testing, verification and validation
Erik BYSTRICKÝ1, Barbara BADOVÁ1, Miriam KRISTEKOVÁ1, Andrej CIPCIAR1, Peter PAŽÁK1 1 Geophysical Institute of the Slovak Academy of Sciences,
Dúbravská cesta 9, 845 28 Bratislava, Slovak Republic, e-mail: [email protected], [email protected], [email protected], [email protected], [email protected]
Abstract: Slovak macroseismic questionnaire and its processing were updated to the EMS-98 scale in 1999 (Labák et al., 1999). However, the macroseismic survey had to be conducted in a manual manner. The approach required signifi-cant effort connected with questionnaires distribution and consequent pro-cessing. It prevented fast estimate of macroseismic impacts of an earthquake.
Semi-automatic procedure was developed and tested in 2002 (Labák and Kováčová, 2002). It provided semi-automatic estimate of intensity values, but still it was necessary to conduct the survey manually (and to collect question-naires by ordinary post service) and to load input data from the questionnaires manually into the software. Later, the web interface enabling to electronically fill in macroseismic questionnaires directly on the institutional web page was created and the new software tool for automatic extraction of input information into semi-automatic processing of macroseismic data was developed at Geo-physical institute of Slovak Academy of Sciences. This recently implemented electronic dissemination and acquisition of the questionnaires significantly re-duced the time necessary for conducting a macroseismic survey. However, the near real-time (NRT) automatic processing and producing of outputs (intensity maps, tables) would be the very useful next improvement of the current macroseismic processing scheme.
Therefore, the new approach based on the web forms connected to the seis-mic database has been developed as a part of the new seismic database develop-ment. The new environment will integrate the earthquake information based on the instrumental measurements with the macroseismic information and it will provide NRT automatic processing of the macroseismic data with corresponding outputs.
10th Slovak Geopysical Conference August 19 – 21, 2013, Smolenice
21
The new XML model of the questionnaire and automatic processing tech-niques have some inherent limitations and hence prevent the exact implementa-tion of the currently used questionnaire into the one suitable for NRT automatic processing. Therefore, the new version of questionnaire and its processing is carefully tested and verified by reprocessing of sets of questionnaires for several earthquakes for which the results of previous manual processing are available. Influence of differences between the two questionnaire versions and of their pro-cessing on the estimated macroseismic intensity values is investigated and dis-cussed.
Key words: macroseismic questionnaire, EMS-98, near real-time (NRT), auto-matic processing, seismic database
References Labák P., Moczo P., Kristek J., Bystrický E., Cipciar A., Bednárik M., 1999: Nový slovenský
makroseizmický dotazník a analýza údajov pomocou stupnice EMS-98. (Prednáška). III. celoslovenská geofyzikálna konferencia, 15.-16. júna 1999, Bratislava
Labák P., Kováčová M., 2002: Semiautomatic Intensity Estimation for the Macroseismic Data Acquired Using the New Slovak Macroseismic Questionnaire, In: European Seismological Commision (ESC), XXVIII General Assembly, ISBN 88-7388-008-8, 2002, p.280.
10th Slovak Geopysical Conference August 19 – 21, 2013, Smolenice
22
Earthquakes in Slovakia
Andrej CIPCIAR1, Miriam KRISTEKOVÁ1, Kristián. CSICSAY1, Miroslav SRBECKÝ1, Lucia FOJTÍKOVÁ1, Peter PAŽÁK1, Erik BYSTRICKÝ1, Peter MOCZO2, Jozef KRISTEK2 1 Geophysical Institute of the Slovak Academy of Sciences,
Dúbravská cesta 9, 845 28 Bratislava, Slovak Republic, e-mail: [email protected] 2 Faculty of Mathematics, Physics and Informatics, Comenius University,
Mlynská dolina F1, 842 48, Bratislava, Slovak Republic
Abstract: The monitoring of seismic activity of the territory of Slovakia is one of the main tasks of the Geophysical Institute of the Slovak Academy of Sci-ences. The Department of Seismology operates the National Network of Seismic Stations that consists of 12 seismic stations. The Iža seismic station is temporary out of operation due to security reasons and considerable increase of seismic noise level. Replacement of this seismic station to new and more appropriate location is considered. Data from seismic stations are transmitted to the data center in Bratislava in real-time and processed in two steps – an automatic proc-essing with real-time first localizations, and a detailed manual interpretation on daily basis. In addition to data from the national network, the center also collects data from the Virtual Network of Seismic Stations comprising seismic stations of the cooperating institutions from the Central and East-Western Europe.
The Department of Astronomy, Physics of the Earth and Meteorology of the Faculty of Mathematics, Physics and Informatics, Comenius University operates the Local Seismic Network of Eastern Slovakia. The local network consists of 6 seismic stations with real-time data transmission to the data center in Bratislava. Data processing and analysis is similar to that in the national network. There is a close cooperation between both research institutions.
The Department of Seismology of the Slovak Academy of Sciences also co-operates with the Progseis company that operates the local networks of seismic stations deployed around nuclear power plants Mochovce and Jaslovské Bohunice. These data are particularly usefull for studying the Dobrá Voda source zone. Monitoring of the northern part of this source zone was improved by three additional temporal seismic stations built in cooperation between Geo-physical institute of Slovak Academy of Sciences, the Progseis company and the Institute of Rock Structure and Mechanics of the Academy of Sciences of the Czech Republic, Prague. The three new stations started their operation at the end of 2011/beginning of 2012.

10th Slovak Geopysical Conference August 19 – 21, 2013, Smolenice
23
Using seismic data from the National Network of Seismic Stations and the Local Seismic Network of Eastern Slovakia about 155 earthquakes with epicen-ters on the territory of Slovakia were seismometrically localized in the period 2011-2012. In the same period, 8 earthquakes with macroseismic effects were observed on the territory of Slovakia - 1 of them with epicenter in northern Hun-gary (near Tatabánya), 7 with epicenters in Slovakia. The highest reported macroseismic intensity on the territory of Slovakia was 4° EMS-98 for the March 5, 2012 Záhorie area earthquake and the May 2, 2012 Vihorlat area earthquake. We experienced quite large amount of macroseismic questionnaires submitted through web interface (more than 1800 questionnaires for the January 29, 2011 northern Hungary earthquake and more then 800 questionnaires for the May 31, 2012 Vernár area earthquake). The new software tool for automatic ex-traction of input information for the processing of macroseismic data was devel-oped in 2011.
Key words: seismic stationc, monitoring, earthquakes in Slovakia
10th Slovak Geopysical Conference August 19 – 21, 2013, Smolenice
24
Calculation of temperature distribution and rheological properties of the lithosphere along transect I in the Western Carpathians
Jana DÉREROVÁ1, Igor KOHÚT1, Miroslav BIELIK1,2 1 Geophysical Institute of the Slovak Academy of Sciences,
Dúbravská cesta 9, 845 28 Bratislava, Slovak Republic, e-mail: [email protected] 2 Department of Applied and Environmental Geophysics, Faculty of Natural Sciences of
Comenius University, Mlynská dolina, 842 15 Bratislava 4, Slovak Republic; e-mail: [email protected]
Abstract: Using the 2D integrated modelling method, we calculated the tem-perature model of the lithosphere along transect I passing through the Western Carpathians. Based on the extrapolation of failure criteria, lithology and calcu-lated temperature distribution, we derived the rheology model of the lithosphere in the area. Our results indicate clearly that the strength decreases from the Bo-hemian Massif via the Western Carpathians to the Pannonian Basin. The largest strength can be observed within the upper crust on the boundary between the upper and lower crust. This phenomenon is typical for all studied tectonic units: the Bohemian Massif, the Western Carpathians and the Pannonian Basin. These results suggest mostly rigid deformation in the upper crust of the units. By con-trast, the lower crust in the Bohemian Massif and the Western Carpathians re-flects significantly lower strength, while in the Pannonian Basin the strength is the smallest. In all tectonic units the strength within the uppermost mantle (lower lithosphere) disappears. It can be suggested that the ductile deformation domi-nates in this part of the lithosphere.
Key words: integrated modelling, temperature, rheology, strength, compression, extension, the Western Carpathians

10th Slovak Geopysical Conference August 19 – 21, 2013, Smolenice
25
Effect of artificial disturbances from magnetic dipole sources in the geomagnetic field at the GO Hurbanovo
Peter DOLINSKÝ1, Magdaléna VÁCZYOVÁ1, Fridrich VALACH1 1 Geomagnetic observatory,Geophysical Institute of the Slovak Academy of Sciences,
947 01 Hurbanovo, Slovak Republic, e-mail: [email protected]
Abstract: Geomagnetic Observatory at Hurbanovo is one of the few observato-ries in the world, which from beginning of their existence – although with inter-ruptions – register the changes of the geomagnetic field at the same place. This also entails problems: more and more artificial disturbances appear. The obser-vatory is located in the built-up area of the city, 200 meters from the main road. In this work we try to calculate the possible effects of external sources which have dipole character and appear mainly in the registration of the Z component of the geomagnetic field.
Key words: geomagnetic observatory, artificial disturbances

10th Slovak Geopysical Conference August 19 – 21, 2013, Smolenice
26
ERT reciprocal measurements
Ivan DOSTÁL1, René PUTIŠKA1, David KUŠNIRÁK1 1 Department of Applied and Environmental Geophysics, Faculty of Nature Sciences,
Comenius University, Mlynská dolina, pav. G, 842 48 Bratislava, Slovak Republic, e-mail: [email protected], [email protected], [email protected]
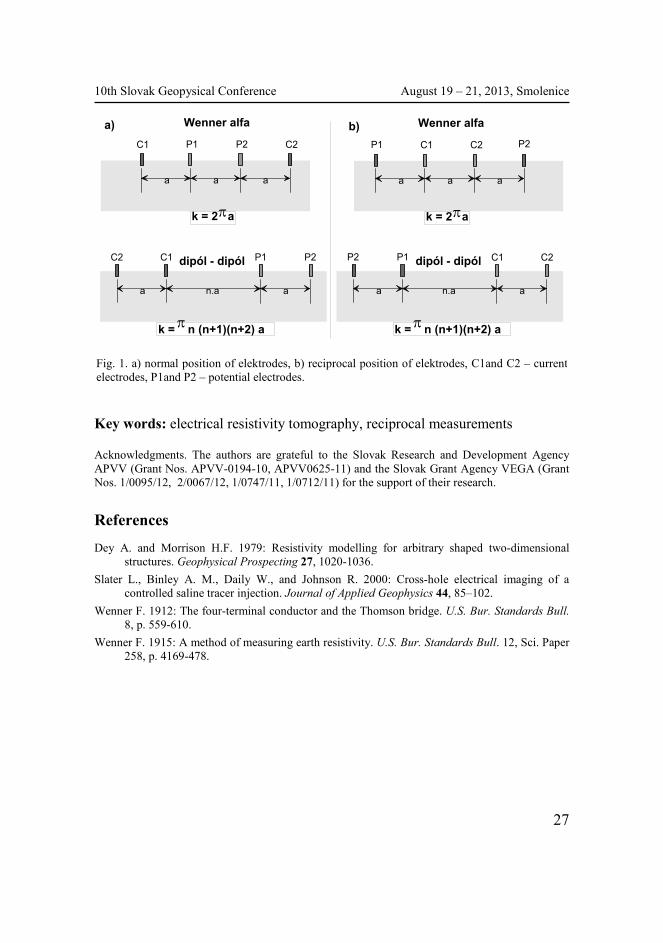
Abstract: In recent years, the reciprocal measurements are often carried out to estimate data quality for resistivity methods (Slater et al., 2000). The reciprocal resistance measure is obtained by exchanging the current electrodes with the potential electrodes of the normal resistance measure (Fig. 1). The reciprocity theory was described by Frank Wenner (1912 and 1915) for homogeneous envi-ronments. Theoretically, without any noise the normal and reciprocal measure-ments should give same observed values, so the difference between the two measurements will give an estimate of the measurement errors.
This principle was tested by the synthetic models of vertical stratification en-vironment and prism in a homogeneous environment, which are represented heterogeneous environment. The apparent resistivity values for synthetic models were calculated using an algorithm based on the method of finite differences by Dey and Morrison (1979) for Wenner-alpha and dipole-dipole electrode arrays. The common differences were found in terms of the apparent resistivity due to heterogenity of environment. The largest differences occur in the areas of the vertical contacts resistivity bodies. The differences observed by reciprocal measurements are influenced by the type of electrode array and value of resis-tivity contrast at the boundary of the model bodies.
Reciprocal measurements are applied in real measurements at several loca-tions. To detect noise in the measured apparent resistivity values we used re-peated measurements of the same electrode position. Observed differences reached values up to 10%. Comparing the normal and reciprocal measurements, we found significantly higher differences. The position of differences was de-tected in the areas around the resistivity of lithological units, in cases with relatively simple geological structures. In cases with complicated geological structure, the differences characterize the overall heterogeneity of the environ-ment.
The principle of reciprocal measurements therefore can not strictly be used to assess the quality of the measured data in heterogeneous environments. On the other hand, reciprocal measurement allows locating the position of anomalous structures.
10th Slovak Geopysical Conference August 19 – 21, 2013, Smolenice
27
Key words: electrical resistivity tomography, reciprocal measurements
Acknowledgments. The authors are grateful to the Slovak Research and Development Agency APVV (Grant Nos. APVV-0194-10, APVV0625-11) and the Slovak Grant Agency VEGA (Grant Nos. 1/0095/12, 2/0067/12, 1/0747/11, 1/0712/11) for the support of their research.
References
Dey A. and Morrison H.F. 1979: Resistivity modelling for arbitrary shaped two-dimensional structures. Geophysical Prospecting 27, 1020-1036.
Slater L., Binley A. M., Daily W., and Johnson R. 2000: Cross-hole electrical imaging of a controlled saline tracer injection. Journal of Applied Geophysics 44, 85–102.
Wenner F. 1912: The four-terminal conductor and the Thomson bridge. U.S. Bur. Standards Bull. 8, p. 559-610.
Wenner F. 1915: A method of measuring earth resistivity. U.S. Bur. Standards Bull. 12, Sci. Paper 258, p. 4169-478.
C1 P1 P2 C2
a a a
Wenner alfa
πk = 2 a
P1 C1 C2 P2
a a a
Wenner alfa
πk = 2 a
C2 C1 P1 P2
a n.a a
dipól - dipól
πk = n (n+1)(n+2) a
P2 P1 C1 C2
a n.a a
dipól - dipól
πk = n (n+1)(n+2) a
a) b)
Fig. 1. a) normal position of elektrodes, b) reciprocal position of elektrodes, C1and C2 – current electrodes, P1and P2 – potential electrodes.

10th Slovak Geopysical Conference August 19 – 21, 2013, Smolenice
28
Geodetic monitoring of earthquake-related displacements
Ľubomíra GERHÁTOVÁ1, Ján HEFTY1 1 Department of Theoretical Geodesy, Faculty of Civil Engineering, Slovak University
of Technology, Radlinského 11, 813 68 Bratislava, Slovak Republic, e-mail: [email protected], [email protected]
Abstract: The method of Precise Point Positioning (PPP) is based on simultane-ous processing of code and carrier phase measurements of satellites of the Global navigation satellite systems (GNSS) in un-differenced mode. Application of PPP algorithms requires consistent modeling of all relevant disturbing effects (relativity, troposphere and ionosphere delays, etc.) as well as use of precise sat-ellite orbits and satellite clock parameters. The data processing by PPP allow to determine geocentric coordinates of points on the Earth’s surface with sub-cen-timeter accuracy without requiring the reference to terrestrial coordinate frame.
The modern geodetic GNSS receivers enable to record satellite observations with 1 Hz or higher (up to 100 Hz) sampling frequency. Application of PPP then offers continuous monitoring of short-term coordinate variations of individual site during specified time interval without relation to other GNSS observing sites. Such possibility can be used for evaluation of short-term displacements related to seismic activity.
In this paper we show the possibility of detection and monitoring of earth-quake-related horizontal and vertical displacements. The changes of position due to seismic events of various magnitudes and with various distances from epi-center will be presented. Our analyses are based on 1 s sampled GPS observa-tions on selected permanent stations, with data available before, during and after the earthquake. The GPS data processing was realized with ABSOLUTE soft-ware package designed for the analysis of satellite observations using PPP method, developed at the Department of Theoretical Geodesy, Slovak University of Technology.
For study of earthquake related displacements the software ABSOLUTE was modified to determine the instantaneous site coordinates for each epoch as a new independent parameter. We use the iono-free ranges obtained from combination of code and phase measurements. Troposphere is eliminated with the standard model in combination with stochastic modeling. The estimated parameters are the updated real valued ambiguities, station coordinates and receiver clocks for each observing epoch. For the estimation procedure the Kalman filtering ap-

10th Slovak Geopysical Conference August 19 – 21, 2013, Smolenice
29
proach is applied. For detection and description of the earthquake related dis-placements we propose two modifications of data processing: PPP in kinematic mode at stations with significant changes in the position and PPP residuals from static mode to detect small positional changes.
Results of application of the software ABSOLUTE are demonstrated on earthquakes with magnitudes from 4.3 to 9.0 on permanent GNSS stations with distances from 5 km up to 2700 km from the epicenter.
Key words: GPS seismology, geo-kinematics, Precise Point Positioning
References
Hefty J., Gerhátová Ľ., 2012: Potential of precise point positioning using 1 Hz GPS data for de-tection of seismic-related displacements. Acta Geodynamica et Geomaterialia, Vol. 9, No. 3 (167).
Larson K. M., 2009: GPS Seismology. Journal of Geodesy, 83, 227–233.
Fig. 1. Coordinate displacements in north-south, east-west and up components on IGS permanent station MIZU during Honshu earthquake 2011, Japan.

10th Slovak Geopysical Conference August 19 – 21, 2013, Smolenice
30
Integrated modelling of the lithosphere in the Carpathian – Pannonian Region
Michal GRINČ1, Miroslav BIELIK1,2, Hermann ZEYEN3 1 Department of Applied and Environmental Geophysics, Faculty of Natural Sciences of
Comenius University, Mlynská dolina, 842 15 Bratislava 4, Slovak Republic, e-mail: [email protected]
2 Geophysical Institute of the Slovak Academy of Sciences, Dúbravská cesta 9, 845 28 Bratislava, Slovak Republic, e-mail: [email protected]
3 Département des Sciences de la Terre, Université de Paris-Sud, UMR 8146, Orsay, France, e-mail: [email protected]
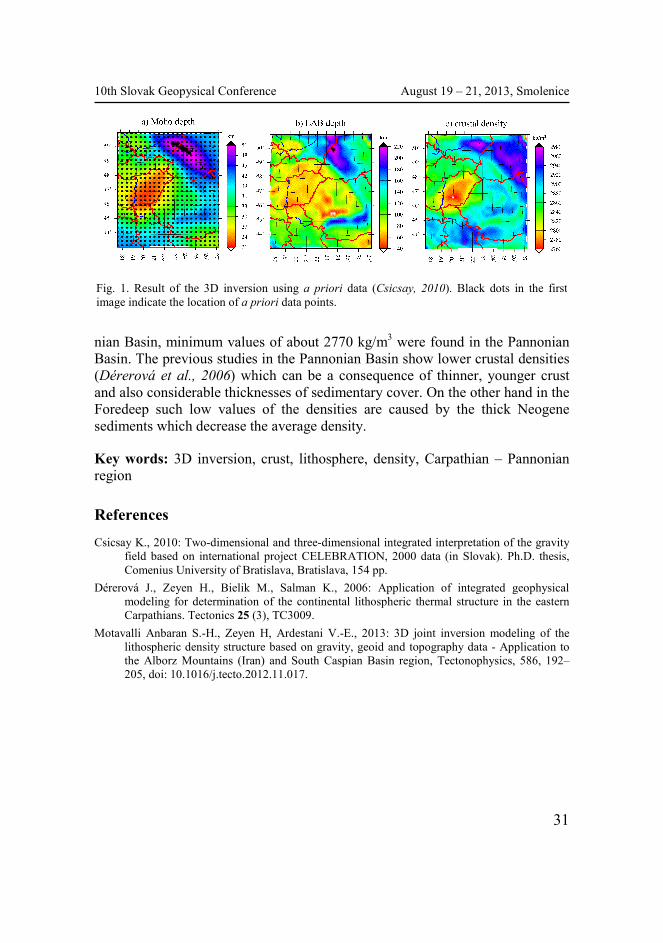
Abstract: We applied 3D inversion (Motavalli et al., 2013) to obtain 3D model of the lithosphere in the Carpathian – Pannonian region. The algorithm used is a very fast method based on a Bayesian approach with Gaussian probability den-sity functions. We used a 3D algorithm (GT_3D_INV) to obtain the density structure of the lithosphere from joint inversion of free air gravity, geoid and topography data. The algorithm delivers the crustal and lithospheric thicknesses and the average crustal density in vertical columns. The inversion process may be stabilised by using damping and smoothing parameter as well as use of a priori information like crustal thicknesses from seismic profile. In this work we used a new Moho map of the Carpathian – Pannonian region (Csicsay, 2010) as a priori input data file.
The Moho thickness is therefore very similar to the input file with maximum crustal thickness under the Eastern Carpathians Foredeep and minimum crustal thickness of 23 km under the Pannonian Basin. In general, the thickness of the lithosphere decreases from the older and colder Platforms to the younger and hotter Pannonian Basin. The resulting lithospheric thickness varies from a maximum depth of 240 km under the Eastern Carpathians to 180 km under the Southern Carpathians, 100 km under the Transylvanian basin, 100 km under the Aegean Sea and more than 70 km under the whole Panonnian Basin region with some local higher values. Values of less than 40 km can be found in the South-ern Carpathians. However, we do not interpret this as real lithospheric thickness. Extremely high values of average crustal density of about 2950 kg/m3 were ob-tained in the East European Platform with its Precambrian basement. Up to 2900 kg/m3 were obtained in the Southern Carpathians, in the western part of the Moesian Platform, in the southern part of Pannonian Basin and in the Transylva-
10th Slovak Geopysical Conference August 19 – 21, 2013, Smolenice
31
nian Basin, minimum values of about 2770 kg/m3 were found in the Pannonian Basin. The previous studies in the Pannonian Basin show lower crustal densities (Dérerová et al., 2006) which can be a consequence of thinner, younger crust and also considerable thicknesses of sedimentary cover. On the other hand in the Foredeep such low values of the densities are caused by the thick Neogene sediments which decrease the average density.
Key words: 3D inversion, crust, lithosphere, density, Carpathian – Pannonian region
References Csicsay K., 2010: Two-dimensional and three-dimensional integrated interpretation of the gravity
field based on international project CELEBRATION, 2000 data (in Slovak). Ph.D. thesis, Comenius University of Bratislava, Bratislava, 154 pp.
Dérerová J., Zeyen H., Bielik M., Salman K., 2006: Application of integrated geophysical modeling for determination of the continental lithospheric thermal structure in the eastern Carpathians. Tectonics 25 (3), TC3009.
Motavalli Anbaran S.-H., Zeyen H, Ardestani V.-E., 2013: 3D joint inversion modeling of the lithospheric density structure based on gravity, geoid and topography data - Application to the Alborz Mountains (Iran) and South Caspian Basin region, Tectonophysics, 586, 192–205, doi: 10.1016/j.tecto.2012.11.017.
Fig. 1. Result of the 3D inversion using a priori data (Csicsay, 2010). Black dots in the first image indicate the location of a priori data points.

10th Slovak Geopysical Conference August 19 – 21, 2013, Smolenice
32
Pre-Tertiary basement structure of the Turiec Basin using 3D density modelling
Martin KRAJŇÁK1, Miroslav BIELIK1,2, Irina MAKARENKO3, Olga LEGOSTAEVA3, Vitaly I. STAROSTENKO3, Marián BOŠANSKÝ1, Roman PAŠTEKA1, Jozef HÓK4 1 Department of Applied and Environmental Geophysics, Faculty of Natural Sciences,
Comenius University, Mlynská dolina, pav. G, 842 48 Bratislava, Slovak Republic, e-mail: [email protected]
2 Geophysical Institute of the Slovak Academy of Sciences, Dúbravská cesta 9, 845 28 Bratislava, Slovak Republic, e-mail: [email protected]
3 Institute of Geophysics National Academy of Sciences of Ukraine, Palladin, av. 32, Kiev, 03680, Ukraine
4 Department of Geology and Paleontology, Faculty of Natural Sciences, Comenius University, Mlynská dolina, pav. G, 842 48 Bratislava, Slovak Republic
Abstract: New results related to the thickness and density of the sedimentary fill of the Turiec Basin allowed us to construct the first stripped gravity map for this typical intramontane Neogene depression of the Western Carpathians (Krajňák et al., 2012). The stripped gravity map of the Turiec Basin reflects the gravity effects of the density inhomogeneities which are located beneath the sedimen-tary basin fill. This map is therefore suitable for the interpretation of the struc-ture and composition of the pre-Tertiary basement. The 3D density modelling was used to calculate the gravity effect of two density models. The stripped gravity maps were produced by subtracting the density model gravity effects from Bouguer anomalies. Regional trend was removed from the stripped gravity maps also. The residual stripped gravity maps were consequently used for geo-logical interpretation of the pre-Tertiary basement of the Turiec Basin. The pre-Tertiary basement of the Turiec Basin can be divided into northern and southern parts due to its gravity characteristics. Furthermore the northern part can be split into two domains: western and eastern. The crystalline basement of the western domain is likely built by the Hercynian crystalline basement of the Tatric Unit. In the eastern domain the basement consist mostly of the Mesozoic complexes of the Fatric unit. The southern part of the pre-Tertiary basement of the Turiec Ba-sin is built predominantly by Mesozoic complexes of the Hronic unit. It is sug-gested that the Hronic unit also forms the bedrock of the volcano-sedimentary complex of the Kremnické vrchy Mts. Total horizontal gradients using the

10th Slovak Geopysical Conference August 19 – 21, 2013, Smolenice
33
regularized derivatives in the Fourier domain, selecting the optimum regulari-zation (low-pass filter) parameter by means of the C-norm functions analysis (Pašteka et al., 2009, 2012) we calculated for the resultant stripped gravity maps and have also proven to be very useful for the interpretation of faults or fault systems in the study area. Various faults, particularly of NNE-SSW and NW-SE directions were discovered. The analysis of the faults indicates clearly that the contact of the Turiec Basin with the Malá Fatra Mts and the Veľká Fatra Mts is tectonic.
Key words: applied geophysics, gravity, 3D density modelling, stripped gravity map, Turiec Basin, Western Carpathians.
References Krajňák M., Bielik M., Makarenko I., Legostaeva O., Starostenko V. I., Bošanský M., 2012: The
stripped gravity map of the Turčianská Kotlina Basin. Contribution to Geophysics and Geodesy, 42, 2, 181–199.
Pašteka R., Richter F. P., Karcol R., Brazda K., Hajach M., 2009: Regularized derivatives of potential fields and their role in semi-automated interpretation methods. Geophysical Prospecting, Vol. 57, Nr. 4, 507–516
Pašteka R., Karcol R., Kušnirák D., Mojzeš A., 2012: REGCONT: A Matlab based program for stable downward continuation of geophysical potential fields using Tikhonov regularization. Computers and Geosciences 49, 278–289.

10th Slovak Geopysical Conference August 19 – 21, 2013, Smolenice
34
Comparison of discrete representations of heterogeneous medium using canonical models of the Mygdonian basin (near Thessaloniki, Greece)
Jozef KRISTEK1,2, Peter MOCZO1,2, Miriam KRISTEKOVÁ1,2 1 Comenius University in Bratislava, Faculty of Mathematics, Physics and Informatics,
Mlynská dolina F1, 842 48 Bratislava, e-mail: [email protected] 2 Geophysical Institute of the Slovak Academy of Sciences,
Dúbravská cesta 9, 845 28 Bratislava, Slovak Republic
Abstract: The Mygdonian basin, an elongated tectonic graben located approxi-mately 30 km ENE of the city of Thessaloniki, is one of the major threats for the city, as witnessed by the 1978 Stivos earthquake which occurred on one of the fault branches shaping the graben. A realistic 3D seismic model of the Mygdo-nian sedimentary basin has been developed with more than one decade of fo-cused seismological, geophysical and geotechnical investigations by Greek seismologists and their international collaborators zones. The model is charac-terized by complicated geometry of the internal interfaces in sediments and sediment-bedrock interface, relatively low S wave speed in the uppermost sedi-ment layer, large velocity contrast between sediments and bedrock ranging from 4 to 13, large P wave to S wave speed ratio in the uppermost sediment layer (7.5). The verification phase of the international E2VP project (Euroseistest Verification and Validation Project organized by the CEA – Commissariat à l'énergie atomique et aux énergies alternatives in France) led to decision to com-pare the most advance numerical-modelling methods using canonical modifica-tions of the realistic 3D model of the basin. The canonical models include 3 ho-mogeneous layers over halfspace, 3 gradient layers over halfspace, simplified 2D vertical North-South cross-section of the basin with the wedge-type northern margin and vertical southern margin of sediments. We simulated seismic wave propagation in the models using our finite-difference methodology and com-pared four alternative discrete representations of continuous and discontinuous heterogeneities of material properties - LOC – local (point) values of the elastic moduli and density, ARI – volume arithmetic averages of the elastic moduli and volume arithmetic averages of density evaluated using numerical integration over a grid cell centred at the grid position of the elastic modulus or density,
10th Slovak Geopysical Conference August 19 – 21, 2013, Smolenice
35
HAR – volume harmonic averages of the elastic moduli and volume arithmetic averages of density evaluated using numerical integration over a grid cell cen-tred at the grid position of the elastic modulus or density, ORT – volume effec-tive coefficients corresponding to the orthorhombic averaged medium. The LOC and ARI are still used by some modellers despite the fact that they violate trac-tion continuity condition at material interfaces. The HAR and ORT approximate the boundary condition. We demonstrate that the two latter representations yield considerably more accurate results. The difference is significant in presence of clear material interfaces in the model.
Key words: finite-difference modelling, Mygdonian basin, material parameteri-zation, verification and validation
10th Slovak Geopysical Conference August 19 – 21, 2013, Smolenice
36
Data processing in archeomagnetism
Lenka KUBIŠOVÁ1, Igor TÚNYI1, Jana BUČOVÁ1, Jozef MICHALÍK2, Matej RUTTKAY3 1 Geophysical Institute of the Slovak Academy of Sciences,
Dúbravská cesta 9, 845 28 Bratislava, Slovak Republic, e-mail: [email protected], [email protected], [email protected]
2 Geological Institute of the Slovak Academy of Sciences, Dúbravská cesta 9, 845 28 Bratislava, Slovak Republic, e-mail: [email protected]
3 Institute of Archaeology of the Slovak Academy of Sciences, Akademická 2, 949 21 Nitra, e-mail: [email protected]
Abstract: Archeomagnetism is the study of the record of the Earth´s magnetic field in the burning archeological objects (clay bricks, furnaces). It is possible because the iron-bearing minerals may record past directions of the Earth´s magnetic field (Krs, 1969).
When a thermally altered archeological object cools, it acquires a thermoremanent magnetization from the actual Earth´s field. For the laboratory results processing of thermally altered archelogical material the Thellier method is used (Thellier and Thellier, 1959).
Five processing programs, working only for older version of operating sys-tems, have been used up to now. Now we are testing new program based on Thellier method. It was written in Fortran 90. Two ways of data processing are compared on the samples from locality Starý Plášť. It turns out that both treat-ments give similar results.
Key words: archeomagnetism, Thellier method, data processing
References
Thellier E., Thellier O., 1959: Sur l’intensite du champ magnétique terrestre dans le passe histori-que et géologique. Ann. Geophys. 15, 285–376.
Krs M., 1969: Paleomagnetizmus. Praha, Geofond.

10th Slovak Geopysical Conference August 19 – 21, 2013, Smolenice
37
Matlab based ERT forward modeling and inversion by means of 3D finite differences approach
David KUŠNIRÁK1, Roman PAŠTEKA1, Ivan DOSTÁL1, René PUTIŠKA1 1 Department of Applied and Environmental Geophysics, Comenius University in
Bratislava, Faculty of Natural Sciences, Mlynská dolina, pav. G, 842 15, Bratislava, Slovak Republic, e-mail: [email protected]
Abstract: The main aim of the work is to develop stable, robust and reliable al-gorithm, based on the minimal structure inversion, producing minimal structure and sharp boundaries models. Preliminary results of ERT inversion and forward modeling Matlab package are presented. The main core of the forward modeling code is based on the 3D finite differences modeling code adopted from Dey and Morrisson (1979), where several improvements has been made. Singularity re-moval technique seems to be most significant improvement to the final results. An up to date numerical techniques, like parallelization and modified precondi-tioning speed up the solution. These techniques enables us to employ 3D geom-etry concept to calculate very accurate 2D and 2.5D structures as well with com-parable time requirements to the 2D algorithms, which makes the forward mod-eling code very versatile.
The inverse problem in ERT method is non-linear, so it has to be solved iter-atively, where a sensitivity matrix is needed to make a linearized approximation. Presented algorithm is based on the IRLS method (Farquharson, 2008), which adaptively adjusts data weights during the inversion on the most non-fitting data during each iteration. The objective function to be minimized in our case fol-lows:
md λφφ +=Φ ,
where index d and m represent data and model misfits respectively and λ is dumping factor, which is decreasing during the inversion. For minimum structure and sharp models the l1 norm is mostly used to evaluate the misfit function.
A series of synthetic models has been computed to test the forward modeling code and the inversion code as well with very satisfactory results. An example is shown in Fig. 1.

10th Slovak Geopysical Conference August 19 – 21, 2013, Smolenice
38
Fig. 1. Comparisson between the model data (a) and the inverse image (b) obtained for dipole-dipole electrode configuration in iteration 8 with relative RMS error 2%.
Key words: inversion, forward modeling, ERT, Matlab
Acknowledgment: The authors are grateful to the Slovak Research and Development Agency APVV (Grant Nos. APVV-0194-10, APVV0625-11) and the Slovak Grant Agency VEGA (Grant Nos. 1/0095/12, 2/0067/12, 1/0747/11) for the support of their research.
References Dey A., Morrison, H. F., 1979: Resistivity modeling for arbitrarily shaped three-dimensional
structures. Geophysics, 44(4), 753–780. Farquharson C. G., 2008: Constructing piecewise-constant models in multidimensional minimum-
structure inversions. Geophysics, 73(1), K1 – K9.
10th Slovak Geopysical Conference August 19 – 21, 2013, Smolenice
39
Compilation, processing and analysis of earthquake catalogue for the NNPP region
Róbert KYSEL1,2, Jozef KRISTEK1,2, Peter MOCZO1,2, Kristián CSICSAY2, Andrej CIPCIAR2, Miroslav SRBECKÝ2 1 Comenius University in Bratislava, Faculty of Mathematics, Physics and Informatics,
Mlynská dolina F1, 842 48 Bratislava, e-mail: [email protected] 2 Geophysical Institute of the Slovak Academy of Sciences,
Dúbravská cesta 9, 845 28 Bratislava, Slovak Republic
Abstract: The NNPP region is a symmetric geographic area of a circular shape with a radius of 305 km centred at the site of the potential New Nuclear Power Plant near Jaslovské Bohunice. The NNPP region includes parts of the territories of Slovakia, Hungary, Austria, the Czech Republic and Poland, and it partly ex-tends up to Germany, Slovenia, Croatia and Serbia. We elaborated a new earth-quake catalogue relevant for the probabilistic seismic hazard assessment for the NNPP site. Preparation of the catalogue consisted in the following steps: A. Compilation. 1. Merging of the so-called national catalogues, bulletins (year-books) of national seismological agencies, regional catalogues and global data-bases of earthquakes (e.g., ISC catalogue); the total number of the used primary catalogues is 10, selected articles were also used. 2. Identification of multiple entries. 3. Selection of primary entries. The resulting database consists of 9142 entries (one entry corresponding to one earthquake). B. Processing. 1. Homog-enization of database for a single quantity determining the earthquake size – the moment magnitude Mw. 2. The subset of the database including only earth-quakes with Mw >= 1.5 was defined as the earthquake catalogue for the NNPP region. It includes 2652 earthquakes. C. Analysis. 1. Catalogue declustering – identification of foreshocks, main shocks and aftershocks. 2. Analysis of spatial and temporal completeness of the catalogue.
The declustered catalogue served as the basis for determination of magni-tude-frequency relationships and maximum magnitudes for identified seismic source zones.
Key words: earthquake database, earthquake catalogue, catalogue declustering, analysis of completeness, probabilistic seismic hazard assessment
10th Slovak Geopysical Conference August 19 – 21, 2013, Smolenice
40
Thermal state of the Trancarpathian depression lithosphere
Dušan MAJCIN1, Roman I. KUTAS2, Dušan BILČÍK1, Milan HVOŽDARA1
1 Geophysical Institute of the Slovak Academy of Sciences, Dúbravská cesta 9, 845 28 Bratislava, Slovak Republic, e-mail: [email protected]
2 Institute of Geophysics, National Academy of Sciences of Ukraine, Palladin av. 32, Kiev, 03680, Ukraine
Abstract: The contribution deals with the interpretation of the geothermal data measured and determined in the region of the Transcarpathian depression and surrounding units, modelling results along profiles crossing this region and of additional local heat flow refraction and/or source-type models. For qualitative and quantitative analysis of the thermal field we used also the modelling results of other authors ( stationary and transient models, integrated approaches,...), other geophysical/geological data and the tectonic development of the region under study that influences the temperature and heat flow density distributions.
The mathematical tasks arising from the heat transfer equation solution were fulfilled mainly by the means of the finite difference methods, finite element methods, boundary integral technique or by application of various exact solu-tions.
Presented results have a great importance both for interpretation of measured geothermal data, modelling of thermal fields, geothermal maps constructions etc. The results are also applicable by prospection of the geothermal energy re-sources in the most perspective region both for Slovakia and Ukraine.
The works were accomplished within the bilateral project between Slovak and Ukrainian geophysical institutions and with partial support of grants APVV-0724-11, VEGA 2/0067/12 and VEGA 1/0095/12.
Key words: geothermal models, heat flow density, tectonics, Transcarpathian depression

10th Slovak Geopysical Conference August 19 – 21, 2013, Smolenice
41
Fig. 1. Terrestrial heat flow density distribution in Transcarpathian depression and surrounding units. 1 – East European platform, 2 – Carpathian Foredeep, 3 – Outer Carpathian Flysch, folded molasse units, 4 – Krosno Nappes group of the Flysh Belt, 5 – Foremagurian units of the Flysch Belt,6 – Outer Magura Nappes of the Flysch Belt, 7 – Inner Magura nappes of the Flysch Belt, 8 – Pieniny Klippen Belt, 9 – Neogene and Quaternary sediments of the Inner Carpathians, 10 – Neo-gene volcanic rocks (andesites, rhyolites), 11 – Paleogene sediments of the Inner Carpathians, 12 – Tatricum: a. basement, b. sedimentary cover, 13 – Veporicum, Zemplinicum: a. basement, b. sedi-mentary cover and Krížna Nappe, 14 – Marmarosh Massif, 15 – Hronicum, 16 – Gemericum, 17 – Meliaticum, 18 – Turnaicum, 19 – Silicicum, 20 – Paleozoic of the Uppony-Szendrő, 21 – Faults, Alpine overthrust lines and geological boundaries, 22 – State borders, 23 – Isolines of heat flow density distribution in mW/m².

10th Slovak Geopysical Conference August 19 – 21, 2013, Smolenice
42
A kinematic model of vertical geomagnetic field variation resulting from a steady convective flow
Alexandra MARSENIĆ1,2 1 Geophysical Institute of the Slovak Academy of Sciences,
Dúbravská cesta 9, 845 28 Bratislava, Slovak Republic 2 Institute of Geophysics, Academy of Sciences of Czech Republic,
Boční II/1401, 141 31 Prague 4, Czech Republic, e-mail: [email protected]
Abstract: A kinematic hydromagnetic problem is investigated in order to follow effects of a prescribed three-dimensional convection on an initially given mag-netic field. The vertical velocity profile is z-dependent, z being the vertical coor-dinate, and consists of two parts in a manner to define the diffusionless region of the main volume of the fluid and the resistive boundary layer at the rigid wall. The induction equation for the vertical component of the magnetic field is solved analytically in Cartesian geometry in these two distinct regions. Besides of hori-zontal transport of the field in the main volume, there is also field's distortion due to the vertical velocity gradient causing its weakening at the upwelling and intensifying at the downwelling flow. The resultant solution at the surface of the main volume is a time-varying magnetic field which then penetrates into the boundary layer. This thin region where the velocity rapidly tends to zero, be-haves like a solid conductor thanks to the assumption of a steady flow in the main volume and generally attenuates the magnetic field. Depending on the given velocity field configuration, it may also cause its sinusoidal alternation in z. At appropriate conditions a reversed field on the surface is obtained. In the context of the geomagnetic secular variation this may be an explanation of the westwardly drifting reversed magnetic flux patches.
Key words: magnetohydrodynamics, induction equation, geomagnetic secular variation, reversed flux patches
References Marsenić A., 2013: A kinematic model of vertical geomagnetic field variation resulting from a
steady convective flow. Geophys. Astrophys. Fluid Dynamics, under review

10th Slovak Geopysical Conference August 19 – 21, 2013, Smolenice
43
Different geophysical methods applied to investigation of burial mound, Mohyla, Most pri Bratislave
Igor MURIN1 1 Department of Applied and Environmental Geophysics, Comenius University in
Bratislava, Faculty of Natural Sciences, Mlynská dolina, 842 15, Bratislava, Slovak Republic, e-mail: [email protected]
Abstract: The application of geophysical methods to archaeology grew rapidly over the last decade and become an important part of archaeological prospection. Applied geophysics as non-destructive and fast survey technique becomes very useful with increased land development. It helps archaeologist save the time and labor by identifying and targeting potential archaeological structures and re-vealing additional information about archaeological sites.
The aim of this project is to test different geophysical methods on selected archaeological sites and evaluate their success and suitability for their further use in investigation of burial mounds. The site of geophysical survey, burial mound,
Fig. 1. Mohyla, Most pri Bratislave

10th Slovak Geopysical Conference August 19 – 21, 2013, Smolenice
44
is situated south of village Most pri Bratislave. Up to this time there have been applied geophysical methods as electrical resistivity tomography (ERT), ground penetrating radar (GPR) and magnetic method. The results from these surveys reveal some information about the structure, construction and later use of the burial mound.
Key words: Applied geophysics, non-destructive, ERT, GPR, magnetic method
Acknowledgements: I would like to thanks to all students a pedagogues who helped me with this geophysical survey. As well thank for financial support by grant project (VEGA č. 1/0924/12).

10th Slovak Geopysical Conference August 19 – 21, 2013, Smolenice
45
Schumann resonances during a solar proton event
Adriena ONDRÁŠKOVÁ1, Sebastián ŠEVČÍK1 1 Department of Astronomy, Physics of the Earth and Meteorology, Faculty of
Mathematics, Physics and Informatics, Comenius University, Mlynská dolina F1, 842 48 Bratislava, e-mail: [email protected]
Abstract: The cavity between the conductive Earth and the conductive iono-sphere is a global spherical waveguide for electromagnetic waves, which are permanently excited by the lightning activity. The existence of the resonant modes, called Schumann resonances (SchR), due to interference of the electro-magnetic waves within the Earth-ionosphere waveguide was theoretically pre-dicted by Schumann (1952). These resonance modes are in the extremely low frequency (ELF) range and they are close to 8, 14, 20, 26 Hz, etc. The electric field SR component is recorded with a capacitive (ball) antenna mounted on a 5 m insulator mast at the Astronomical and Geophysical Observatory (AGO) of Comenius University near Modra. Details are given in Kostecký et al. (2000) and in Ondrášková et al. (2007). Since October 2001 up to August 4, 2009 there were only short interruptions when hardware or software was being updated or repaired, which lasted about a month, or shorter interruptions due to power out-ages or unfavourable weather situation (in some cases days). The raw time series data were collected every half hour for 327.68 seconds (which is 65536 samples taken with 200 Hz sampling frequency). Since July 2006 data of the same length were collected more frequently: every 6 minutes, i.e. 240 files were stored per day.
During some strong eruptive processes on the Sun, energetic protons are emitted from the active regions besides increased X-ray fluxes. Arriving to the Earth they penetrate to the atmosphere where they interact with the molecules. They cause a number of effects, called solar proton events. Increased ionization, changes of ion chemistry, changes of the electric conductivity itself and also the profile of the conductivity are only some of them. The two latter play a decisive role in the electromagnetic wave reflectivity and thus in propagation and eigen-frequecies of ELF waves in the Earth-ionosphere wave guide.
Using our code, we obtaine the SchR mode frequencies from our measured electric field component. During the well-pronounced SPE of December 2006, the X-ray induced increase and subsequent proton-induced decrease of the first SchR mode frequency are clearly observed.

10th Slovak Geopysical Conference August 19 – 21, 2013, Smolenice
46
Key words: Schumann resonance, solar proton events
References Schumann W. O., 1952: On the Free Oscillations of a Conducting Sphere which is surrounded by
an Air Layer and a Ionosphere Shell. Zs. Naturforschung 7a, 149–154 (in German). Kostecký P., Ondrášková A., Rosenberg L., Turňa L., 2000: Experimental setup for the monitoring
of Schumann resonance electric and magnetic field variations at the Geophysical Observa-tory at Modra-Piesok. Acta Astron. et Geophys., XXI–XXII, 71–92.
Ondrášková A., Kostecký P., Ševčík S., Rosenberg L., 2007: Long-term observations of Schu-mann resonances at Modra Observatory. Radio Science, 42, RS2S09, doi: 10.1029/ 2006RS003478.

10th Slovak Geopysical Conference August 19 – 21, 2013, Smolenice
47
Polyhedral appoximation of buildings in microgravity data processing: a case study from the St Catherine’s church, Little Carpathians
Jaroslava PÁNISOVÁ1, Roman PAŠTEKA2, Marek FRAŠTIA3 1 Geophysical Institute of the Slovak Academy of Sciences,
Dúbravská cesta 9, 845 28 Bratislava, Slovak Republic, e-mail: [email protected] 2 Department of Applied and Environmental Geophysics, Faculty of Natural Sciences of
Comenius University, Mlynská dolina, 842 15 Bratislava 4, Slovak Republic; e-mail: [email protected]
3 Department of Surveying, Faculty of Civil Engineering, Slovak University of Technology, Radlinského 11, 813 68 Bratislava,, Slovak Republic; e-mail: [email protected]
Abstract: The use of the microgravity technique for cavity detection in the ex-ploration of historical buildings requires the calculation of additional cor-rections that take into account the gravitational effects of surrounding man-made structures (buildings, known underground spaces, e.g. cellars, tunnels). The ca-pability of digital photogrammetry to improve microgravity data processing was introduced by Pánisová et al. (2012), where a new method for calculating build-ing corrections based on photogrammetric reconstruction was used. This case study demonstrates the application of this method with a microgravity survey undertaken at the Slovak archaeological site (Pánisová et al., 2013).
The traditional approach to the calculation of building correction is based on an approximation of the walls by a set of prisms (Fig. 1a, Potent, Geophysical Software Solutions). The polyhedral model (Fig. 1b) described by a TIN (Trian-gular Irregular Network) was reconstructed in PhotoModeler software (Eos Systems, www.photomodeler.com). The attraction effect of this detailed model was calculated in program Polygrav as the summation of the integrations along the line elements of its individual faces using the equation of Götze and Lahme-yer (1988). The differences between building corrections attain up to 45 μGals in the northern part of the map (Fig. 1c). These high values are caused by an inac-curate modelling of the tower in the Potent software. In general, it may influence the identification of probable subsurface features (in our case, medieval crypt excavated in 2001).
We have shown that digital models of the historical buildings created from photographs with a special photogrammetric software can be directly utilized for the calculation of their gravitational effects in microgravity method. A novel ap-

10th Slovak Geopysical Conference August 19 – 21, 2013, Smolenice
48
proach of microgravity data processing designed particularly for archaeological applications provides for high accuracy of calculated building corrections.
Key words: microgravity method, digital photogrammetry, historical buildings, polyhedral body, cavity detection
References Götze H. J., Lahmeyer B., 1988: Application of three-dimensional interactive modeling in gravity
and magnetics. Geophysics 53, 1096–1108. Pánisová J, Fraštia M, Wunderlich T, Pašteka R, Kušnirák D., 2013: Microgravity and Ground-
penetrating radar investigations of subsurface features at the St Catherine’s Monastery, Slovakia. Early View in Archaeological Prospection, doi: 10.1002/arp.1450.
Pánisová J, Pašteka R, Papčo J., Fraštia M., 2012: The calculation of building corrections in mi-crogravity surveys using close range photogrammetry. Near Surface Geophysics 10, 391–399.
a) b) c)
Fig. 1. 3D models of St. Catherine’s church ruin (Dechtice) approximated by a set of rectangular prisms – Potent software (a) and one polyhedron – PhotoModeler software (b). (c) Difference map of corresponding building corrections (model a – model b).

10th Slovak Geopysical Conference August 19 – 21, 2013, Smolenice
49
Modern methods for determinations of physical heights
Juraj PAPČO1, Miroslava MAJKRÁKOVÁ1, Blažej BUCHA1, Pavol ZAHOREC2 1 Department of Theoretical Geodesy, Faculty of Civil Engineering, Slovak University of
Technology, Radlinského 11, 813 68 Bratislava, Slovak Republic, e-mail: [email protected], [email protected], [email protected]
2 Geophysical Institute of the Slovak Academy of Sciences, Ďumbierska 1, 974 01 Banská Bystrica, Slovak Republic, e-mail: [email protected]
Abstract: The contribution deals with the precise determination of normal heights according to Molodensky in the selected part of the Slovak national lev-eling network. Introduction to the theory of physical heights and methods for their numerical evaluation is supported by the practical experiment. It was per-formed the central part of Slovakia around the reference point Pitelova, where four different methods were applied: classical method, method using geo-potential numbers, method using GNSS leveling and method using combination of Earth gravity model (EGM) with residual terrain effect. In the solution, different approaches for computing the gravity value (using Bouguer anomalies or EGM) at the points in which it is not directly measured were applied. Values of gravity were determined on the basis of two digital elevation models, DMR-3 (DTM3, 2013) and DTM2006.0 (Pavlis et al, 2007). Our tests point out to the quality of the regional gravimetric database of Slovakia in respect of geodetic applications. The experiment showed the highest precision of the method using geopotential numbers, which are based on measured gravity and leveled eleva-tions. The classical method is very similar by the results, but nowadays it is practically obsolete. Combination of gravity, obtained from EGM2008 (Pavlis et al., 2012) and residual terrain effect computed from residual terrain model is promising, especially in the area with sparse distribution of gravity data. Despite of worse results in comparison with the previous methods, GNSS leveling verified reliability of the used quasigeoid model.
Key words: physical heights, geopotential number, GNSS leveling, Bouguer anomaly, free-air anomaly, Earth gravity model, Residual terrain effect

10th Slovak Geopysical Conference August 19 – 21, 2013, Smolenice
50
References Digital Terrain Model version 3, 2012: http://www.topu.mil.sk/14971/. Pavlis N. K., Factor J. K., Holmes S. A., 2007: Terrain-related gravimetric quantities computed for
the next EGM. In: Proceedings of the 1st International Symposium of the International Gravity Field Service vol. 18. Harita Dergisi, Istanbul, pp 318–323
Pavlis N. K., Holmes S. A., Kenyon S., Factor J. K., 2012: The development and evaluation of the Earth Gravitational Model 2008 (EGM2008); Journal of Geophysical Research: Solid Earth (1978-2012) Volume 117, Issue B4.
Fig. 1. Points distribution in the central part of the Slovakia.

10th Slovak Geopysical Conference August 19 – 21, 2013, Smolenice
51
Geophysical image of sedimentary structure along the Dunajská Streda – Veľký Meder profile: reinterpretation of geoelectrical data of vertical electrical sounding (VES) method
Mariana PAŠIAKOVÁ1, Vojtech GAJDOŠ1, Andrej MOJZEŠ1, Bibiána BRIXOVÁ1, Miroslav BIELIK1,2, Jana BUČOVÁ2 1 Department of Applied and Environmental Geophysics, Comenius University in
Bratislava, Faculty of Natural Sciences, Mlynská dolina, 842 15 Bratislava, Slovak Republic, e-mail: [email protected], [email protected]
2 Geophysical Institute of the Slovak Academy of Sciences, Dúbravská cesta 9, 845 28 Bratislava, Slovak Republic, e-mail: [email protected]
Abstract: The central part of the Danube Basin is filled in the near-surface parts of the aquifers, the Danube gravel and sand. Geophysical information originat-ing mainly from geoelectrical measurements are used for better understanding of the structure and development of the sedimentation environment of the central part of this basin. The aim of this study was to compile a detailed geoelectrical cross-section (section A – A') through the gravel-sand horizons based on the re-interpretation of the geophysical measurements (vertical electrical sounding method – VES) and by the use of all available wells of the study area, which were taken from the archive of Geofond division in Bratislava.
Performed qualitative and quantitative interpretation was completed by the statistical-empirical interpretation. On the observed profile was determined the approximate thickness of the youngest Quaternary coarse-grained fluvial sedi-ments and also were indicated possible significant tectonic lines. Lithofacial changes of the sedimentary fill within the three allocated geoelectrical horizons were analyzed. In the gravel-sand sediments was confirmed gradual reduction trend of the grain size towards the SE. On the contrary, in the lowest-lying clay-sandy horizon was demonstrated the opposite trend, gradually more frequent sandy fraction towards the SE.
Key words: applied geophysics, vertical electrical sounding, qualitative inter-pretation, quantitative interpretation, the Western Carpathians, Danube Basin
Acknowledgements: This work was supported by the Slovak Research and Development Agency under contracts No. APVV-0099-11 and APVV-0194-10 and by the VEGA grant agency under

10th Slovak Geopysical Conference August 19 – 21, 2013, Smolenice
52
projects No. 1/0095/12 and 1/0067/12.
References Tkáčová H., Májovský J., 1989: Geofyzikálny výskum územia Veľkej Bratislavy a okolia, III. eta-
pa – geoelektrika. Čiastková správa, Manuskript, archív GÚDŠ (Bratislava), 14 p. Tkáčová H., Kováčik M., Caudt Ľ., Elečko M., Halouzka R., Hušták J., Kubeš P., Malík P.,
Nagy A., Petro Ľ., Piovarči M., Pristaš J., Rapant S., Remšík A., Šefara J., Vozár, J., 1996: Podunajsko – DANREG – národný projekt – geofyzikálny prieskum, vypracovanie máp a štúdií. Záverečná správa, Manuskript, archív GÚDŠ (Bratislava), 266 p.
10th Slovak Geopysical Conference August 19 – 21, 2013, Smolenice
53
Radiometric measurements in the Bridlicová štôlňa Gallery (Marianka) and its surroundings
Mariana PAŠIAKOVÁ1, Andrej MOJZEŠ1, Jana BUČOVÁ2, Barbara PORUBČANOVÁ2 1 Department of Applied and Environmental Geophysics, Comenius University in
Bratislava, Faculty of Natural Sciences, Mlynská dolina, 842 15 Bratislava, Slovak Republic, e-mail: [email protected], [email protected]
2 Geophysical Institute of the Slovak Academy of Sciences, Dúbravská cesta 9, 845 28 Bratislava, Slovak Republic, e-mail: [email protected], [email protected]
Abstract: Several types of radiometric measurements were carried out in the Bridlicová štôlňa Gallery in the Marianske údolie Valley in Marianka Village near Bratislava as well as in its surroundings at the surface (Malé Karpaty Mts.). The target was to find out the character and quantity of radioactivity of rocks (Jurassic black clayey and marly shales of the Marianka Formation), soil cover and geological structures respectively.
There were realized in situ dosimetry measurements of dose equivalent rate (μSv·h-1) of gamma rays at height approx. 1 m above ground by portable Geiger-Müller dosimeter and gamma-ray spectrometry measurements of 40K (%), 238U (ppm eU) and 232Th (ppm eTh) concentrations at ground level by portable scin-tillation NaI(Tl) gamma-ray spectrometer. Both measurements of gamma-ray field of rocks were done both in the underground mine adit (Fig. 1) and at the surface in surrounding area. Except of this, the soil emanometry measurements were performed at the surface above gallery body for the purpose to determine the content of 222Rn radioactive gas in soil air.
The results show the homogeneity of studied, formerly mined, black shales block from the point of radioactivity with relatively low values of natural K, U and Th radioisotopes concentration as well as its tectonic integrity from the soil emanometry measurements.
Key words: Marianka Formation, Malé Karpaty Mts., concentration of 40K, 238U and 232Th in rock, volume activity of 222Rn in soil air, dose equivalent rate of gamma rays
Acknowledgements: This work was supported by the State Geological Institute of Dionýz Štúr under the contract No. 10 11 “Sandberg – Pajštún Geopark (SAPAG)”, by the Slovak Research

10th Slovak Geopysical Conference August 19 – 21, 2013, Smolenice
54
and Development Agency under contracts No. APVV-0194-10 and by the VEGA grant agency under projects No. 1/0095/12 and 1/0067/12.
References
Madarás J., Gargulák M., Šoltés S., Kráľ J., Lehotský R., Ondrus P. and Chmulík M., 2013: Bridli-cová štôlňa v Marianskom údolí. Montanrevue, 1, 20–22 (in Slovak).
Magdolen P., Ďurka T., 2006: Baňa v Marianke. Spravodaj Slovenskej speleologickej spoločnosti, 37, 2, 36–37 (in Slovak).
Fig. 1. Detailed plan view of the gallery.

10th Slovak Geopysical Conference August 19 – 21, 2013, Smolenice
55
Results of the archaeogeophysical research of the site Katarínka realized during the years 2011 – 2012
Roman PAŠTEKA1, Tina WUNDERLICH2, Dennis WILKEN2, Harald STÜMPEL2, Wolfgang RABBEL2, Ercan ERKUL2, Peter HERCEG3, Ivana KVETÁNOVÁ3, Jaroslava PÁNISOVÁ4, Juraj PAPČO5, René PUTIŠKA1, David KUŠNIRÁK1, Martin KRAJŇÁK1 1 Department of Applied and Environmental Geophysics, Faculty of Natural Sciences,
Comenius University, Mlynská dolina, 842 15 Bratislava, Slovak Republic, e-mail: [email protected], [email protected], [email protected], [email protected]
2 Institute of Geosciences, Dept. Geophysics, Christian Albrechts University in Kiel, Otto Hahn Platz 1, 24118 Kiel, Germany, e-mail: [email protected], [email protected], [email protected], [email protected], [email protected]
3 Non-government association Katarínka, Bratislava, Šándorova 8, 821 03 Bratislava, Slovak Republic, e-mail: [email protected]
4 Geophysical Institute of the Slovak Academy of Sciences, Dúbravská cesta 9, 845 28 Bratislava, Slovak Republic, e-mail: [email protected]
5 Department of Theoretical Geodesy, Faculty of Civil Engineering, Slovak University of Technology, Radlinského 11, 813 68 Bratislava, Slovak Republic, e-mail: [email protected]
Abstract: In the frame of a long-year collaboration among universities and non-government organizations (focused on the research and salvation of the monas-tery complex Katarínka close to Dechtice) several stages of geophysical research have been realized. It was concentrated on the detection of crypts in the main church aisle and covered walls remains in the territory of the monastery (and its close surroundings). Thanks to state of the art geophysical equipment of the German university in Kiel we have been able to perform the widest complex of geophysical methods, which have been ever realized on an archaeological site in Slovakia. It was based on GPR measurements (GSSI SIR-20 with 200 and 400 MHz antennas), microgravimetric measurements (Scintrex CG-5), electrical to-mography (RESECS system with 48 electrodes), high definition magnetometric measurements (Bartington Grad 601 with 4 sensors Sensys CON650), electro-
10th Slovak Geopysical Conference August 19 – 21, 2013, Smolenice
56
magnetic method (EM38) and as additional ones seismic and radiometric meth-ods have been applied. Results brought several very interesting information. Next two until unknown crypts have been detected in the main church aisle (by means of GPR and microgravimetry). Further side chapels of the church, exter-nal and internal walls in the western and northern part of the monastery and foundations of a large building. In the northern part (in the front of the complex) foundations of several chapels have been delineated (GPR, ERT and magnetometry). All these results have confirmed the need of a complex geo-physical approach in the utilization of non-invasive prospection methods in ar-chaeology and have brought new insights into the architectonic and functional features analysis of this unique baroque monastery complex.
Key words: GPR, magnetometry, ERT, non-invasive archaeological prospection methods

10th Slovak Geopysical Conference August 19 – 21, 2013, Smolenice
57
Local gravity field model from GOCE and terrestrial measurements
Martin PITOŇÁK1, Juraj JANÁK1, Zuzana MINARECHOVÁ2 1 Department of Theoretical Geodesy, Faculty of Civil Engineering, Slovak University
of Technology, Radlinského 11, 813 68 Bratislava, Slovak Republic, e-mail: [email protected], [email protected]
2 Department of Mathematics and Constructive Geometry, Faculty of Civil Engineering, Slovak University of Technology, Radlinského 11, 813 68 Bratislava, Slovak Republic, e-mail: [email protected]
Abstract: Our contribution deals with determination of local or regional gravity field model solving geodetic boundary-value problem by Finite Element Meth-od. We combine two different types of data sources, terrestrial and satellite data sets. On the upper boundary, represented by a part of a sphere, we used gravity anomalies obtained from downward continuation of GOCE gravity gradiometry measurements. Two regularization methods and several methods for regulariza-tion parameter estimation are tested. On the bottom boundary, represented by a part of the real Earth surface, we use the gravity anomalies obtained from real measurements. The final local gravity field model is compared with the global gravity field model.
Key words: GOCE, downward continuation, geodetic boundary-value problem, regularization

10th Slovak Geopysical Conference August 19 – 21, 2013, Smolenice
58
Waterborne GPR survey for riverbed-sediment mapping
René PUTIŠKA1, David KUŠNIRÁK1, Ivan DOSTÁL1 1 Department of Applied and Environmental Geophysics, Faculty of Natural Sciences,
Comenius University, Mlynská dolina, pav. G, 842 15 Bratislava, Slovak Republic, e-mail: putiska @fns.uniba.sk, kusnirak @fns.uniba.sk, [email protected]
Abstract: We performed the Ground Penetrating Radar (GPR) survey on a stretch of the Morava River in order to check the GPR ability to discriminate the riverbed sediments through an analysis of the bottom reflection amplitudes. We used GSSI SIR3000 system with 400 MHz central-frequency antenna, which was placed on the flat bottom of an inflatable boat. For boat positioning and tracking have been use the global positioning system (GPS), connected directly to the GPR unit.
Data processing has been done using Reflexw software package (Sandmeier, 2012) with a series of simple processing steps (filtering operations).
Processing followed these steps: 1. GPS data have been imported into the traceheaders, 2. subtract-mean (dewow) – remove the very-low-frequency components
from all traces, present in the signal because the acquisitions were performed without a filter,
3. make equidististant traces – the option allows to interpolate non-equidistant data in such a way that the resulting data are equidistant. The precondition is that the true position of each trace is stored in the parameter distance within the individual trace header,
4. move starttime – the processing step move starttime facilitates a static correction in time direction by a given value,
5. background removal – apply a high-pass horizontal filter to the profiles to remove a horizontally coherent component to suppress unwanted reverberations,
6. bandpassfrequency – is specified by the setting of the two frequency values lower cutoff and upper cutoff,
7. stack traces – the option allows the temporal simultaneous stacking of a selectable number of traces,
8. subtract traces – the option allows the temporal simultaneous subtraction of a selectable number of traces.

10th Slovak Geopysical Conference August 19 – 21, 2013, Smolenice
59
Applying the processing flow to the raw data improved the radargram. The processed radargram shows sharp contrasts in the bottom reflections (Fig. 1). This high reflectivity prevents an unambiguous identification of the reflections within the sediments.
Key words: Ground Penetrating Radar (GPR), riverbed-sediment mapping
Acknowledgments: The authors are grateful to the Slovak Research and Development Agency APVV (Grant Nos. APVV-0194-10, APVV0625-11), the Slovak Grant Agency VEGA (Grant Nos. 1/0095/12, 2/0067/12, 1/0747/11, 1/0712/11, 1/0937/11) and Visegrad fund, Strategic project n. 31210058 for the support of their research.
References
Sandmeier K. J. 2012: Reflexw, v.7, manual for the processing of seismic, acoustic or electromag-netic reflection, refraction and transmission data.
Fig. 1. 3D radargram visualization of the waterborne GPR survey on the Morava River.

10th Slovak Geopysical Conference August 19 – 21, 2013, Smolenice
60
Modeling of intense geomagnetic storms by using an empirical model and artificial neural networks
Miloš REVALLO1, Fridrich VALACH2, Pavel HEJDA3, Josef BOCHNÍČEK3 1 Geophysical Institute of the Slovak Academy of Sciences,
Dúbravská cesta 9, 845 28 Bratislava, Slovak Republic, e-mail: [email protected] 2 Geophysical Institute of the Slovak Academy of Sciences,
Komárňanská 108, 947 01 Hurbanovo, Slovak Republic, e-mail: [email protected] 3 Institute of Geophysics, Academy of Sciences of the Czech Republic,
Boční II/1401, 141 31 Prague, Czech Republic, e-mail: [email protected], [email protected]
Abstract: An empirical model of the solar wind-magnetosphere interaction to-gether with the approach based on artificial neural networks are considered. We set up a more comprehensive model and employ it to selected intense geomag-netic storms of the 23-rd solar activity cycle. The input of the model consists of the set of solar wind data obtained from the ACE satellite operating at the libra-tion point L1. The output of the model is related to geomagnetic activity in terms of the Dst index. This kind of index can serve as a good measure of the overall strength of the near-Earth currents, especially the ring current, thereby providing the proper characteristics for geomagnetic storm intensity. Here, we prove the model for production of the Dst index to be a forecasting scheme for geomag-netic storms with one-hour lead time.
Keywords: magnetosphere, geomagnetic storms, artificial neural networks

10th Slovak Geopysical Conference August 19 – 21, 2013, Smolenice
61
Analysis of Schumann resonance frequencies determined by two different methods – Lorentz functions fitting and complex demodulation
Sebastián ŠEVČÍK1, Adriena ONDRÁŠKOVÁ1 1 Department of Astronomy, Physics of the Earth and Meteorology, Faculty of
Mathematics, Physics and Informatics, Comenius University, Mlynská dolina F1, 842 48 Bratislava, e-mail: [email protected]
Abstract: Schumann resonances (SR) are electromagnetic oscillations in ex-tremely low frequency range (ELF, 3-300 Hz) generated in the Earth-ionosphere cavity by the lightning strokes randomly distributed over the Earth's globe in given time. Despite the fact that lightning discharges radiate the most of power in tens kHz range, the low energy radiated part in ELF-band is very useful due to its weak damping. Measuring the signal in ELF this aspect gives opportunity to catch an instant integrated state of the global lightning activity.
The vertical electric component of the SR was measured at AGO FMPHI CU by a capacitive antenna since October 2001 up to August 2009. Duration of one measured sequence was 327,675 sec., sampling frequency of A/D converter was 200 Hz. Applying FFT, spectral peaks close to 8, 14, 20, 26,... Hz can be found. They reveal a daily, seasonal and inter-annual variations as a consequence of changes of the conductivity of the upper boundary of the cavity. To detect these variations it is important to determine the central frequency of the peaks. Each resonance peak in the forced system with damping (like a cavity with lightning) has the shape of the known Lorentz function. Fitting of four spectral peaks by Lorentz functions using least squares method was applied on the long-term measurement series at AGO, and details of the analysis made in the past were given in Ondrášková et al. (2007, 2011).
Complex demodulation (CD) is a different method of the assessment of cen-tral peak frequency. It is often used for narrow-band signals in many applica-tions. The aim of CD is to find approximations of the amplitude A(t) and phase φ(t) of a central frequency component fd (demodulation frequency) from the time series as a function of time, and to obtain a shifted and filtered (low pass filter) version of the signal around fd. Frequency fd is a priori estimated. After determination of phase function φ(t) for given fd, the so-called instant frequency can be computed. Its mean value can be used as new guess of fd and CD is re-peated. It was found that after 5-10 iteration steps fd converges to central peak
10th Slovak Geopysical Conference August 19 – 21, 2013, Smolenice
62
frequency. Two independent codes for CD were used. In the first code (author Pavel
Kostecký) a measured sequence was divided to 16 equal parts. CD was itera-tively applied on each part and their mean value of fd's was accepted as the cen-tral peak frequency. In the second code, a set of the subroutines for CD from STARPAC-package was used and applied on the whole sequence again by itera-tive approach as mentioned above. It is advantageous firstly to cut the analysed peak by band-pass filter, especially in case of the first peak which can be influ-enced by low frequency noise (e.g. under 5 Hz) caused by local meteorological conditions in the vicinity of the antenna (strong wind and swinging of the trees).
Tests of both codes were performed on 7440 sequences measured in January 2007. Mean daily frequency variations of the three modes are given and com-pared with previous results obtained by Lorentz function fitting.
Key words: Schumann resonances, Lorentz function, complex demodulation
References
Ondrášková A., Kostecký P., Ševčík S., Rosenberg L., 2007. Long-term observations of Schu-mann resonances at Modra Observatory. Radio Science, 42, RS2S09, doi: 10.1029/ 2006RS003478.
Ondrášková A., Ševčík S., Kostecký P., 2011. Decrease of Schumann resonance frequencies and changes in the effective lightning areas toward the solar cycle minimum of 2008–2009. J. Atmos. Sol.-Terr. Phys., 73, 534–543.

10th Slovak Geopysical Conference August 19 – 21, 2013, Smolenice
63
Integration measurements of indoor radon and thoron activity concentration in family houses in Ružomberok town (Northern Slovakia)
Iveta SMETANOVÁ1, Monika MÜLLEROVÁ2, Karol HOLÝ2, Attila MORAVCSÍK2, Tibor KOVÁCS3, Anita CSORDÁS3, Martin NEZNAL4, Matej NEZNAL4, Krzysztof KOZAK5, Jadwiga MAZUR5, Dominik GRZADZIEL5 1 Geophysical Institute of the Slovak Academy of Sciences,
Dúbravská cesta 9, 845 28 Bratislava, Slovak Republic, e-mail: [email protected] 2 Department of Nuclear Physics and Biophysics, FMFI, Comenius University,
Mlynská dolina, Bratislava, Slovak Republic, e-mail: [email protected] 3 Institute of Radiochemistry and Radioecology, University of Pannonia,
Egyetem str. 10, Veszprém, 8200, Hungary, e-mail: [email protected] 4 RADON v. o. s., Novakovych 6, 180 00 Praha 8, Czech Republic,
e-mail: [email protected] 5 Institute of Nuclear Physics PAN (IFJ PAN), Laboratory of Radiometric Expertise,
Radzikowskiego 152, Krakow, 31-342, Poland
Abstract: Exposure to radon gas in the home accounts for about half of all non-medical exposure to ionizing radiation. The building materials of houses and the design and ventilation systems strongly influence indoor levels of the radioactive gas radon and its decay products, which contribute significantly to doses through inhalation (UNSCEAR, 2000). Radon in the home accounts for about 9% of deaths from lung cancer and about 2% of all deaths from cancer in Europe (Darby et al., 2005).
Intergrational measurements of indoor radon and thoron in family houses were performed in the framework of the project “Harmonization of determining the radiation dose of the population originating from radon in V4 countries”. The objective of the project was to elaborate a common measurement protocol of the Visegrad countries for measuring of indoor radon and thoron concentration (placement of detectors, type of detectors, questionnaires).
In Slovakia, the survey was performed in three localities: Záhorská Bystrica (high Rn risk area), Mochovce and Ružomberok (medium and low Rn risk ar-eas). Monitoring started in March 2012 and lasted for one year. Passive alpha track detectors Raduet were used, for discriminatively determining radon and

10th Slovak Geopysical Conference August 19 – 21, 2013, Smolenice
64
thoron concentrations. Fours sets of detectors were used, sets were changed after three months of an exposure to compare the changes of radon and thoron activi-ties during the year.
In Ružomberok ten family houses were selected for the monitoring purposes. Measurements were performed in two rooms situated on the ground floor of a house, detectors were placed 15-20 cm from the wall. The houses built before 1990 were predominantly chosen for the investigation. Information about the building material, window tightness, intensity of the ventilation, year of the con-struction and reconstruction, number of inhabitants and time spent in monitored room were obtained by the questionnaire.
According to the Regulation of the Ministry of Health SR No. 528/2007, so-called action level 400 Bq/m3 is recommended for nexisting residential buildings and 200 Bq/m3 for new residential buildings for annual average radon activity concentration. In selected houses in Ružomberok, radon activity concentration rarely exceeded 400 Bq/m3 in a three month period, in that case the inhabitants were advised how to lower radon exposure. No house with annual radon activity concentration more than 400 Bq/m3 was found.
Key words: radon, thoron, activity concentration, intergation monitoring, family house
References
Darby S., Hill D., Auvinen A., Barros-Dios J. M., Baysson H., Bochicchio F., Deo H., Falk R., Forastiere F., Hakama M., Heid I., Kreienbrock L., Kreuzer M., Lagarde F., Mäkeläinen I., Muirhead C., Oberaigner W., Pershagen G., Ruano-Ravina A., Ruosteenoja E., Schaffrath Rosario A., Tirmarche M., Tomásek L., Whitley E., Wichmann H.-E., Doll R., 2005: Radon in homes and risk of lung cancer: collaborative analysis of individual data from 13 European case-control studies. BMJ, doi: 10.1136/bmj.38308.477650.63, 1–6.
United Nations Scientific Committee on the Effects of Atomic Radiation. Sources and Effects of Ionizing Radiation. UNSCEAR 2000 Report to the General Assembly, with Scientific Annexes. Vol I: Sources. New York: United Nations, 2000.

10th Slovak Geopysical Conference August 19 – 21, 2013, Smolenice
65
Imaging subsurface cavities using geoelectric tomography, ground-penetrating radar and microgravity
Mohamed SOBH1, Elsayed ISSAWY1, Anwar RADWAN1, Gad EL-QADY1 1 National Research Institute of Astronomy and Geophysics, Helwan, Egypt
e-mail: [email protected]
Abstract: In the past few years, construction extended extraordinarily to the southeast of Cairo, Egypt, where limestone caves occur. The existence of caves and sinkholes represents a hazard for such new urban areas. Therefore, it is im-portant to know the size, position, and depth of natural voids and cavities before building or reconstruction. Recently, cavity imaging using geophysical surveys has become common. In this paper, geoelectric-resistivity tomography using a dipole-dipole array, ground-penetrating radar (GPR) and microgravity have been applied to the east of Kattamya at Al-Amal Town, Cairo, to image shallow sub-surface cavities. Micro gravity measurement was done to detect density varia-tions in rock strata at Kattamiaa city to delineate the shallow subsurface cavities. Several gravity anomalies were found in the residual Bouguer anomaly map. Semi-automated interpretation techniques including the Euler deconvolution, analytic signal and AN-EUL have been used to investigate the depth and size of anomalous sources. Following this the resistivity survey was conducted along three profiles over an exposed cave with unknown extensions. Results from 27 GPR profiles obtained by a SIR-2000 instrument equipped with a 200 MHz an-tenna were visualized in the form of horizontal time slices and vertical time sec-tions, and both sets of data were processed and interpreted integrally to image the cave as well as the shallow subsurface structure of the site. As a result, the cave at a depth of about 2 m and a width of about 4 m was detected using the geophysical data, which correlates with the known cave system. Moreover, an extension of the detected cave has been inferred. The survey revealed that the area is also affected by vertical and nearly vertical linear fractures. Additionally, zones of marl and fractured limestone and some karstic features were mapped.

10th Slovak Geopysical Conference August 19 – 21, 2013, Smolenice
66
Earth's core rotating magnetoconvection models in the plane layer; two different orientations of rotation axis
Tomáš ŠOLTIS1, Jozef BRESTENSKÝ2 1 Geophysical Institute of the Slovak Academy of Sciences,
Dúbravská cesta 9, 845 28 Bratislava, Slovak Republic, e-mail: [email protected] 2 Department of Astronomy, Physics of the Earth and Meteorology, Faculty of
Mathematics, Physics and Informatics, Comenius University, Mlynská dolina F1, 842 48 Bratislava, Slovak Republic, e-mail: [email protected]
Abstract: The models of planar layer allow to solve geodynamo paradox con-sisting in the fact that since 1995 computer simulations of geodynamo in spheri-cal geometry simulate the geomagnetic field with its secular variations unbeliev-ably well despite of unrealistic values of some key parameters. The geodynamo related to the problem of planetary dynamos best exhibits known facts among all astrophysical dynamos. The facts are bond to the nature of generated magnetic fields (of Earth, planets or moons, Sun, stars, galaxies, ...) as well as domains of dynamo operation (Earth's liquid core, the shell of metalic hydrogen in Jupiter or Saturn,...).
In this contribution we present our models (Šoltis and Brestenský, 2010) of anisotropic diffusion coefficients influence on the basic dynamics in the Earth's core determined by Coriolis, buoyancy and magnetic force (Roberts and Jones, 2000).
A linear stability analysis of convection arising in a horizontal plane layer is performed. The layer is rotating about the horizontal axis like in Eltayeb and Rahman (2013) (in the case H) and about the vertical axis like in Roberts and Jones (2000) and Šoltis and Brestenský (2010) (in the case V), and is permeated by a homogeneous horizontal magnetic field perpendicular to the rotation axis. Resulting horizontal convective rolls are inclined to the magnetic field at an an-gle (Roberts and Jones, 2000) dependent on the dimensionless numbers – the Elsasser, Ekman and Roberts numbers, and moreover on the anisotropy param-eter, the ratio of horizontal and vertical diffusion coefficients. The investigated cases H and V are analysed in the sense how linear convection properties corre-spond to dynamo scaling laws by Christensen et al (see e.g. King et al. (2010) and Soderlund et al. (2012)).
10th Slovak Geopysical Conference August 19 – 21, 2013, Smolenice
67
Key words: anisotropic diffusive coefficients, rotating magnetoconvection, Earth's core, geomagnetic field
References:
Eltayeb I. A., Rahman M. M., 2013: Model III: Benard convection in the presence of horizontal magnetic field and rotation. Phys. Earth Planet. In. (2013), http://dx.doi.org/10.1016/ j.pepi.2013.05.002
King E. M., Soderlund K. M., Christensen U. R., Wicht J., Aurnou J. M., 2010: Convective heat transfer in planetary dynamo models. Geochem. Geophys. Geosyst., 11, Q06016.
Roberts P. H., Jones C. A., 2000: The Onset of Magnetoconvection at large Prandtl Number in a rotating Layer I. Infinite magnetic Diffusion GAFD, 92, 289–325.
Soderlund K. M., King E. M., Aurnou J. M., 2012: The influence of magnetic fields in planetary dynamo models, Earth and Planet. Sci. Lett., 333–334, 9–20.
Šoltis T., Brestenský J., 2010: Rotating magnetoconvection with anisotropic diffusivities in the Earth's core. Phys. Earth Planet. Inter., 178, 27–38.

10th Slovak Geopysical Conference August 19 – 21, 2013, Smolenice
68
Magnetic field and velocity structures in rotating uniformly and non-uniformly stratified spherical fluid shells in dependence on the Prandtl number and electromagnetic boundary conditions
Tomáš ŠOLTIS1, Ján ŠIMKANIN2 1 Geophysical Institute of the Slovak Academy of Sciences,
Dúbravská cesta 9, 845 28 Bratislava, Slovak Republic, e-mail: [email protected] 2 Institute of Geophysics, Academy of Sciences of Czech Republic,
Boční II/1401, 141 31 Prague 4, Czech Republic, e-mail: [email protected]
Abstract: It is assumed that the upper part of the outer liquid Earth's core (close to the core-mantle boundary, CMB) is stably stratified (subadiabatic radial tem-perature gradient) and the lower part (towards the inner core boundary, ICB) unstably (superadiabatic radial temperature gradient). The stably stratified sublayer is probably very thin, thus, the outer Earth's core is almost unstably stratified. The models of the non-uniformly stratified fluid shell are an accepta-ble simplification of the real Earth-like conditions.
Non-uniform stratification can be simulated thermodynamically also in the Boussinesq models by means of internal heat sources. A systematical parameter study is presented, i.e. we investigated the dependence of hydromagnetic dyna-mos in uniformly and non-uniformly stratified spherical shells on the Prandtl number and various electrical conductivity of ICB. Results indicate a significant dependence of dynamos on stratification.
Keywords: numerical simulations of gedynamo, Earth's core, geomagnetic field
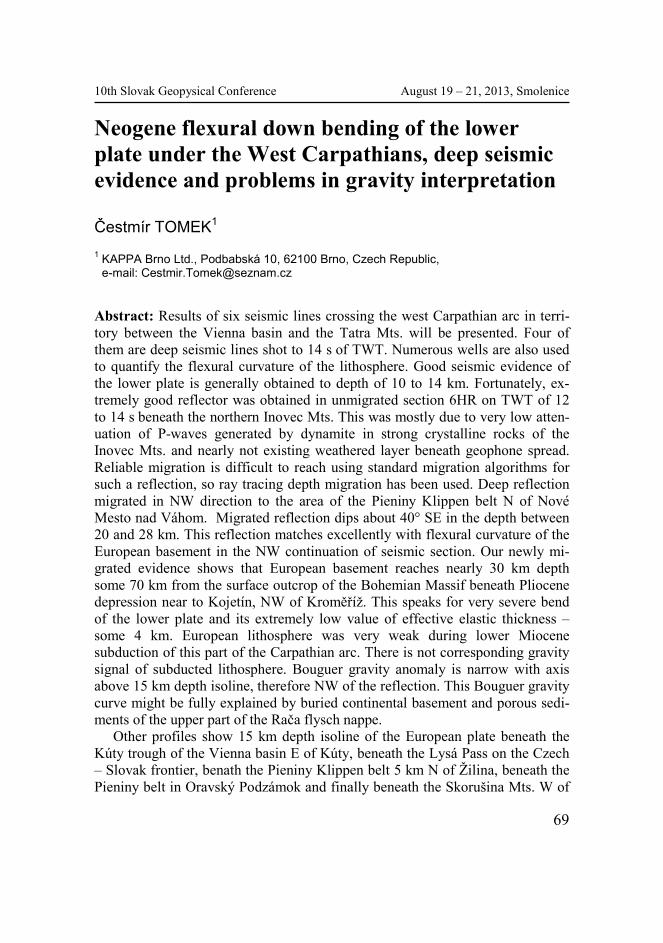
10th Slovak Geopysical Conference August 19 – 21, 2013, Smolenice
69
Neogene flexural down bending of the lower plate under the West Carpathians, deep seismic evidence and problems in gravity interpretation
Čestmír TOMEK1 1 KAPPA Brno Ltd., Podbabská 10, 62100 Brno, Czech Republic,
e-mail: [email protected]
Abstract: Results of six seismic lines crossing the west Carpathian arc in terri-tory between the Vienna basin and the Tatra Mts. will be presented. Four of them are deep seismic lines shot to 14 s of TWT. Numerous wells are also used to quantify the flexural curvature of the lithosphere. Good seismic evidence of the lower plate is generally obtained to depth of 10 to 14 km. Fortunately, ex-tremely good reflector was obtained in unmigrated section 6HR on TWT of 12 to 14 s beneath the northern Inovec Mts. This was mostly due to very low atten-uation of P-waves generated by dynamite in strong crystalline rocks of the Inovec Mts. and nearly not existing weathered layer beneath geophone spread. Reliable migration is difficult to reach using standard migration algorithms for such a reflection, so ray tracing depth migration has been used. Deep reflection migrated in NW direction to the area of the Pieniny Klippen belt N of Nové Mesto nad Váhom. Migrated reflection dips about 40° SE in the depth between 20 and 28 km. This reflection matches excellently with flexural curvature of the European basement in the NW continuation of seismic section. Our newly mi-grated evidence shows that European basement reaches nearly 30 km depth some 70 km from the surface outcrop of the Bohemian Massif beneath Pliocene depression near to Kojetín, NW of Kroměříž. This speaks for very severe bend of the lower plate and its extremely low value of effective elastic thickness – some 4 km. European lithosphere was very weak during lower Miocene subduction of this part of the Carpathian arc. There is not corresponding gravity signal of subducted lithosphere. Bouguer gravity anomaly is narrow with axis above 15 km depth isoline, therefore NW of the reflection. This Bouguer gravity curve might be fully explained by buried continental basement and porous sedi-ments of the upper part of the Rača flysch nappe.
Other profiles show 15 km depth isoline of the European plate beneath the Kúty trough of the Vienna basin E of Kúty, beneath the Lysá Pass on the Czech – Slovak frontier, benath the Pieniny Klippen belt 5 km N of Žilina, beneath the Pieniny belt in Oravský Podzámok and finally beneath the Skorušina Mts. W of

10th Slovak Geopysical Conference August 19 – 21, 2013, Smolenice
70
Tatra Mts. It is evident that the 15 km depth isoline does not correspond to boundaries of Carpathian geological units but very well correspond to the axis of the Carpathian gravity low.
European basement dipping 40°SE N of Nové Mesto nad Váhom is probably represented only by very thin buried passive continental margin. Oceanic litho-sphere breakoff occurred during Early Badenian very near to the end of this reflector. It is probably the only way how to explain missing gravity anomaly response. Slab breakoff during early Badenian caused sudden uplift of the Carpathian foredeep of several hundreds meters. This is well documented by ex-tremely fast shallowing of the foredeep sea from pelagic dark clays to shelf limestones (Leithakalk) sedimentation. Very short trench–arc distance (100 – 130 km) of the Neogene Carpathians might be explained also by extreme bend-ing of the Carpathian lithosphere. Original passive margin was created during Late Jurassic rifting which was oblique with lot of transtension and, therefore, this margin was very narrow. Evidence for it we see in very fast changed Late Jurassic (Malmian) sediments from platform facies to pelagic facies found be-neath the Ždánice nappe in Moravia by numerous boreholes drilled by MND.

10th Slovak Geopysical Conference August 19 – 21, 2013, Smolenice
71
Joint 3D interpretation of Kolárovo gravity and magnetic anomalies by the inversion method of local corrections
Peter VAJDA1, Ilya PRUTKIN2, Miroslav BIELIK3, Vladimír BEZÁK1, Robert TENZER4 1 Geophysical Institute of the Slovak Academy of Sciences,
Dúbravská cesta 9, 845 28 Bratislava, Slovak Republic, e-mail: [email protected], [email protected]
2 Institute of Geosciences, Jena University, Jena, Germany, e-mail: [email protected]
3 Department of Applied and Environmental Geophysics, Faculty of Natural Sciences of Comenius University, Mlynská dolina, 842 15 Bratislava 4, Slovak Republic; e-mail: [email protected]
4 Institute of Geodesy and Geophysics, School of Geodesy and Geomatics, Wuhan University, 129 Louyu Rr., Wuhan, 430079 China, e-mail: [email protected]
Abstract: We present a new interpretation of both the Kolárovo gravity and magnetic anomalies in the Danube Basin based on inverting these data by the so called method of local corrections. First a regional trend is removed from both the gravity and magnetic data in the study area. Two classes of sources are sought by the inversion: contact surfaces (interfaces) and star-convex compact homogenous bodies (Prutkin et al., 2011). When searching for compact bodies, inversion is performed first in terms of 3D line segments approximation (ibid). These line segments, as initial representation of the sources, facilitate the inver-sion by local corrections. The inversion results in several admissible solutions.
Inversion solution A (fig. 1) represents a combination of an intrusive body in the upper crust (density contrast of 300 kg/m3) and an uplift of the basement above the intrusion. Solution B (fig. 2) is a contact surface (interface with den-sity contrast of 300 kg/m3) between the upper and lower crusts. Solution C (fig. 3) is an intrusive body in the upper crust. Compared to solution A its shape is more complex since in this case all the gravity signal is attributed to the intru-sion. Solution D represents a combination of an uplift of the lower crust with an intrusive body above it (both density contrasts are 300 kg/m3). These solutions are in fair agreement with several previous interpretations of the Kolárovo gravity anomaly.

10th Slovak Geopysical Conference August 19 – 21, 2013, Smolenice
72
Fig. 1a. Solution A: W-E cross-section. Fig. 1b. Solution A: S-N cross-section.
Fig. 2a. Solution B: Depth isolines. Fig. 2b. Solution B: 3D surface.
Fig. 3a. Solution C: Intrusion. Fig. 3b. Solution C: W-E cross-section.

10th Slovak Geopysical Conference August 19 – 21, 2013, Smolenice
73
Fig. 4a. Solution D: Intrusion with elevation of lower crust.
Fig. 4b. Solution D: W-E cross-section.
Next we interpret the magnetic data. The residual magnetic anomaly is trans-
formed into pseudo-gravity. This procedure is described in detail in (Prutkin et al., 2012, pp 112–127). Pseudogravity is then approximated by line segments. They are located at depths between 5 and 10 km, just like those in the case of the Kolárovo residual gravity anomaly. This coincidence gives a strong case for the notion that both the gravity and the magnetic fields are caused by the same source. Finally the method of local corrections is applied to invert the pseudo-gravity to obtain a magnetic contact surface. Depths to the contact surface are between 7.7 and 23.5 km, which approximately matches solution B, i.e., contact surface obtained by inverting gravity data. The shapes of the magnetic and den-sity contact surfaces are similar, but do not coincide entirely. A possible expla-nation is that the up-thrusted lower crustal mafic material is magnetically heterogenous, or not entirely magnetic.
The inversion methodology presented here represents a versatile approach to interpreting potential field data in tectono-geological studies. Its flexibility dwells in separation of multiple source signals. Its merit is in producing several admissible solutions that can be from the viewpoint of geological or tectonic interpretation studied, compared and evaluated in terms of their feasibility in the context of the tectono-geological situation and evolution in the studied area. The four solutions presented above equally well match the observed gravity anomaly. They cannot be discriminated based on observed surface potential field data. The discrimination among these solutions must be carried out based on additional geophysical or earth science constraining information and tectonic and geologi-cal considerations. In the light of the tectonic evolution of the Carpatho-Pannonian area we consider solution D as the most realistic, though not unique. The joint interpretation of magnetic and gravity data in the area of the Kolárovo anomaly has confirmed that the higher density basic intrusive body is to a great extent also magnetic.

10th Slovak Geopysical Conference August 19 – 21, 2013, Smolenice
74
Key words: Kolárovo anomaly, inverse problem, interpretation, intrusion, ap-plied geophysics
Acknowledgements: This work was supported by the Slovak Research and Development Agency (contracts No. APVV-0194-10 and No. APVV-0724-11) and by Vega grant agency (projects No. 2/0067/12 and 1/0095/12).
References
Prutkin I., Vajda P., Tenzer R., Bielik M., 2011: 3D inversion of gravity data by separation of sources and the method of local corrections: Kolarovo gravity high case study. Journal of Apllied Geophysics 75(3), 472–478.
Prutkin I., Jentzsch G., Jahr T., 2012: Separation of sources and 3D inversion of gravity and mag-netic data for the Thuringian Basin, Germany. Contributions to Geophysics and Geodesy 42(2): 119–132

10th Slovak Geopysical Conference August 19 – 21, 2013, Smolenice
75
Gravimetric search for magmatic sources during the 2004–2005 Teide (Tenerife) hybrid unrest
Peter VAJDA1, Ilya PRUTKIN2, Jo GOTTSMANN3 1 Geophysical Institute of the Slovak Academy of Sciences,
Dúbravská cesta 9, 845 28 Bratislava, Slovak Republic, e-mail: [email protected]
2 Institute of Geosciences, Jena University, Jena, Germany, e-mail: [email protected]
3 Dept. of Earth Sciences, University of Bristol, Bristol, UK, e-mail: [email protected]
Abstract: During the seismic unrest at the central volcanic complex (CVC) on Tenerife bulk gravity increase was recorded between May 2004 and July 2005 (Gottsmann et al., 2006). Here we interpret the gravity signal in terms of multi-ple sources using a non-linear inversion method based on line segments ap-proximation. Residual gravity changes were decomposed into shallow (Fig. 1) and deep (Fig. 2) constituents (fields) using a triple upward-downward-upward harmonic continuation (Prutkin et al., 2011). Each field was inverted based on best-fitting the attraction of line segments, yielding a set of 3 shallow near-sur-face segments and one deep short bent line segment at 5.7 km b.s.l. (Fig. 3).
Fig. 1. Shallow field (mGal) Fig. 2. Deep field (mGal)
10th Slovak Geopysical Conference August 19 – 21, 2013, Smolenice
76
Fig. 3. Inversion results: Shallow and deep sources represented by line segments.
The two NW and one SW shallow segments correlate with the NW and SW
seismogenic zones of (Cerdeña et al., 2011). We interpret them as risen hydro-thermal fluids initiated by deeper magma injection. We interpret the short deep segment as a magma injection at a depth of about 6 km, within the NW zone of VT events swarm identified by [Cerdeña et al., 2011]. This hybrid nature of the observed unrest is best explained by the migration of hydrothermal fluids as a result of magma injection. Our inversion results and interpretation appear to be in fair agreement with the model of the tree-like magma intrusion proposed by (Cerdeña et al., 2011).
Key words: gravity change interpretation, volcano reactivation, hybrid unrest

10th Slovak Geopysical Conference August 19 – 21, 2013, Smolenice
77
Acknowledgements: Jo Gottsmann acknowledges support by the Royal Society University Research Fellowship and EC FP7 project “VUELCO” (grant #: 282759). Peter Vajda was supported by the Slovak Research and Development Agency (contract No. APVV-0724-11) and by Vega grant agency (projects No. 2/0067/12 and 1/0095/12).
References Cerdeña D. I., del Fresno C., Rivera L., 2011: New insight on the increasing seismicity during
Tenerife's 2004 volcanic reactivation. J. Volcanol. Geotherm. Res. 206, 15–29. Gottsmann J., Wooller L., Martí J., Fernández J., Camacho A. G., Gonzalez P. J., Garcia A.,
Rymer H., 2006: New evidence for the reawakening of Teide volcano. Geophys. Res. Lett., 33, L20311.
Prutkin I., Vajda P., Tenzer R., Bielik M., 2011: 3D inversion of gravity data by separation of sources and the method of local corrections: Kolarovo gravity high case study. Journal of Apllied Geophysics 75(3), 472–478.
10th Slovak Geopysical Conference August 19 – 21, 2013, Smolenice
78
The historical data of the Hurbanovo Geomagnetic Observatory reconstructed by means of neural networks
Fridrich VALACH1, Magdaléna VÁCZYOVÁ1, Peter DOLINSKÝ1, Melinda VAJKAI1 1 Geomagnetic observatory,Geophysical Institute of the Slovak Academy of Sciences,
947 01 Hurbanovo, Slovak Republic, e-mails: [email protected], [email protected], [email protected], [email protected]
Abstract: The time series of the Hurbanovo Geomagnetic Observatory have been registered since 1893. Up to date, the data represent 120 years of magnetic records. However, there are many magnetograms in the observatory archive for which the baselines and the scales are unknown. Such magnetograms were found for some periods in the first half of the 20th century. Unfortunately, rele-vant information about the absolute measurements or the corresponding one-hour data, which could be used to determine both the baselines and the scales, are not available. We employed artificial neural networks in order to substitute for the missing one-hour data at the Hurbanovo Observatory. The data of ob-servatories Potsdam, Seddin and Niemegk served as input to our model. In this paper we present the results of our neural-network model for geomagnetic ele-ments D, H and Z (magnetic declination, horizontal and vertical components, respectively).
Key words: Geomagnetic field, geomagnetic elements, artificial neural network
10th Slovak Geopysical Conference August 19 – 21, 2013, Smolenice
79
Compilation of detailed gravimetric data from whole area of Slovakia
Pavol ZAHOREC1, Viktória SZALAIOVÁ2, Juraj PAPČO3, Ján MIKUŠKA4, Roman PAŠTEKA5, David KUŠNIRÁK5, Martin KRAJŇÁK5, Peter VAJDA6 1 Geophysical Institute of the Slovak Academy of Sciences,
Ďumbierska 1, 974 01 Banská Bystrica, Slovak Republic, e-mail: [email protected] 2 Geocomplex Inc., Geologická 21, 821 06 Bratislava, Slovak Republic,
e-mail: [email protected] 3 Department of Theoretical Geodesy, Faculty of Civil Engineering, Slovak University of
Technology, Radlinského 11, 813 68 Bratislava, Slovak Republic, e-mail: [email protected]
4 G-trend Ltd., Kolískova 1, 845 01 Bratislava, Slovak Republic, e-mail: [email protected]
5 Department of Applied and Environmental Geophysics, Faculty of Natural Sciences, Comenius University, Mlynská dolina, 842 15, Bratislava, Slovak Republic, e-mail: [email protected], [email protected], [email protected]
6 Geophysical Institute of the Slovak Academy of Sciences, Dúbravská cesta 9, 845 28 Bratislava, Slovak Republic, e-mail: [email protected]
Abstract: The results of the first phase of running project Bouguer anomalies of new generation and the gravimetrical model of Western Carpathians (APVV-0194–10) are presented. The total number of approximately 106 000 archive measurements was collected, Fig. 1. These data were measured since the year 1976 to the present, therefore they need to be unified and reprocessed. The im-proved positions of more than 8500 measured points were acquired by digitizing of archive maps (we recognized some local errors within particular data sets).
Besides the local errors (due to the wrong positions, heights or gravity of measured points) we have found some areas of systematic errors probably due to the gravity measurement or processing errors. Some of them were confirmed and consequently corrected by field measurements within the frame of current pro-ject.
Special attention is paid to the recalculation of the terrain corrections. We use a new developed software as well as the latest version of digital terrain model of Slovakia DMR-3 (DTM3, 2013).

10th Slovak Geopysical Conference August 19 – 21, 2013, Smolenice
80
A new interesting regional structure was recognized in the map of complete Bouguer anomalies of Slovakia. It was confirmed by new detailed field measurements.
Key words: detailed gravity measurements, Bouguer anomaly, digital terrain model
References
Digital Terrain Model version 3, 2012: http://www.topu.mil.sk/14971/.
Fig. 1. Detailed gravity data of Slovakia, approx. 106 000 points.

81
Index of Authors
Badová B. 20 Bakoň M. 7 Bátorová K. 7 Bednárik M. 9, 12 Bezák V. 10, 71 Bielik M. 17, 24, 30, 32, 51, 71 Bilčík D. 40 Bochníček J. 60 Bošanský M. 32 Brestenský J. 66 Brimich L. 12, 13 Brixová B. 51 Bucha B. 49 Bučová J. 17, 36, 51, 53 Bystrický E. 20, 22 Cipciar A. 20, 22, 39 Csicsay K. 22, 39 Csordás A. 63 Dérerová J. 24 Dolinský P. 25, 78 Dostál I. 26, 37, 58 El-Qady G. 65 Erkul E. 55 Fojtíková L. 22 Fraštia M. 47 Gajdoš V. 51 Gerhátová Ľ. 28 Gottsmann J. 75 Grinč M. 30 Grzadziel D. 63 Hefty J. 28 Hejda P. 60 Herceg P. 55 Hók J. 32 Holý K. 63
Hvoždara M. 40 Issawy E. 65 Janák J. 57 Kohút I. 9, 13, 24 Kovács T. 63 Kozak K. 63 Krajňák M. 32, 55, 79 Kristek J. 22, 34, 39 Kristeková M. 20, 22, 34 Kubišová L. 36 Kucharič Ľ. 10 Kušnirák D. 26, 37, 55, 58, 79 Kutas R. I. 40 Kvetánová I. 55 Kysel R. 39 Legostaeva O. 32 Majcin D. 40 Majkráková M. 49 Makarenko I. 32 Marsenić A. 42 Mazur J. 63 Michalík J. 36 Mikuška J. 79 Minarechová Z. 57 Moczo P. 22, 34, 39 Mojzeš A. 51, 53 Moravcsík A. 63 Müllerová M. 63 Murin I. 43 Neznal Martin 63 Neznal Matej 63 Ondrášková A. 45, 61 Pánisová J. 47, 55 Papčo J. 7, 17, 49, 55, 79
82
Pašiaková M. 17, 51, 53 Pašteka R. 17, 32, 37, 47, 55, 79 Pažák P. 20, 22 Pitoňák M. 57 Plašienka D. 17 Porubčanová B. 53 Prutkin I. 71, 75 Putiška R. 26, 37, 55, 58 Rabbel W. 55 Radwan A. 65 Revallo M. 60 Ruttkay M. 36 Ševčík S. 45, 61 Šimkanin J. 68 Smetanová I. 63 Sobh M. 65
Šoltis T. 66, 68 Srbecký M. 22, 39 Starostenko V. I. 32 Stümpel H. 55 Szalaiová V. 79 Tenzer R. 71 Tomek Č. 69 Túnyi I. 36 Váczyová M. 25, 78 Vajda P. 71, 75, 79 Vajkai M. 78 Valach F. 25, 60, 78 Vozár J. 10 Wilken D. 55 Wunderlich T. 55 Zahorec P. 49, 79 Zeyen H. 30

83
Contents
Abstracts .............................................................................................................. 5
M. Bakoň, J. Papčo, K. Bátorová: Stability monitoring of Bratislava urban area through time series InSAR image analysis ............................... 7
M. Bednárik, I. Kohút: Colours of stress ........................................................... 9
V. Bezák, Ľ. Kucharič, J. Vozár: Deep-seated magnetic and geoelectric anomalies in the Western Carpathians ...................................................... 10
L. Brimich, M. Bednárik: Results of the extensometric measurements in Slovakia ................................................................................................ 12
L. Brimich, I. Kohút: Surface displacements, deformations and gravity changes due to underground heat source .................................................. 13
J. Bučová, M. Bielik, R. Pašteka, M. Pašiaková, D. Plašienka, J. Papčo: Detailed Profile Gravity Measurements in the Pieniny Klippen Belt (Middle Váh Valley, Western Slovakia) .................................................. 17
E. Bystrický, B. Badová, M. Kristeková, A. Cipciar, P. Pažák: Near real-time web based automatic processing of macroseismic questionnaires – testing, verification and validation ................................ 20
A. Cipciar, M. Kristeková, K. Csicsay, M. Srbecký, L. Fojtíková, P. Pažák, E. Bystrický, P. Moczo, J. Kristek: Earthquakes in Slovakia .................................................................................................... 22
J. Dérerová, I. Kohút, M. Bielik: Calculation of temperature distribution and rheological properties of the lithosphere along transect I in the Western Carpathians ....................................................... 24
P. Dolinský, M. Váczyová, F. Valach: Effect of artificial disturbances from magnetic dipole sources in the geomagnetic field at the GO Hurbanovo ................................................................................................ 25
I. Dostál, R. Putiška, D. Kušnirák: ERT reciprocal measurements ................. 26
Ľ. Gerhátová, J. Hefty: Geodetic monitoring of earthquake-related displacements ........................................................................................... 28
Michal Grinč, Miroslav Bielik, Hermann Zeyen: Integrated modelling of the lithosphere in the Carpathian – Pannonian Region ........................ 30

84
M. Krajňák, M. Bielik, I. Makarenko, O. Legostaeva, V. I. Starostenko, M. Bošanský, R. Pašteka, J. Hók: Pre-Tertiary basement structure of the Turiec Basin using 3D density modelling ...................................... 32
J. Kristek, P. Moczo, M. Kristeková: Comparison of discrete representations of heterogeneous medium using canonical models of the Mygdonian basin (near Thessaloniki, Greece) ............................... 34
L. Kubišová, I. Túnyi, J. Bučová, J. Michalík, M. Ruttkay: Data processing in archeomagnetism ................................................................ 36
D. Kušnirák, R. Pašteka, I. Dostál, R. Putiška: Matlab based ERT forward modeling and inversion by means of 3D finite differences approach ................................................................................................... 37
R. Kysel, J. Kristek, P. Moczo, K. Csicsay, A. Cipciar, M. Srbecký: Compilation, processing and analysis of earthquake catalogue for the NNPP region ................................................................................. 39
D. Majcin, R. I. Kutas, D. Bilčík, M. Hvoždara: Thermal state of the Trancarpathian depression lithosphere ..................................................... 40
A. Marsenić: A kinematic model of vertical geomagnetic field variation resulting from a steady convective flow .................................... 42
I. Murin: Different geophysical methods applied to investigation of burial mound, Mohyla, Most pri Bratislave.............................................. 43
A. Ondrášková, S. Ševčík: Schumann resonances during a solar proton event .............................................................................................. 45
J. Pánisová, R. Pašteka, M. Fraštia: Polyhedral appoximation of buildings in microgravity data processing: a case study from the St Catherine’s church, Little Carpathians ........................................... 47
J. Papčo, M. Majkráková, B. Bucha, P. Zahorec: Modern methods for determinations of physical heights ...................................................... 49
M. Pašiaková, V. Gajdoš, A. Mojzeš, B. Brixová, M. Bielik, J. Bučová: Geophysical image of sedimentary structure along the Dunajská Streda – Veľký Meder profile: reinterpretation of geoelectrical data of vertical electrical sounding (VES) method ............. 51
M. Pašiaková, A. Mojzeš, J. Bučová, B. Porubčanová: Radiometric measurements in the Bridlicová štôlňa Gallery (Marianka) and its surroundings ........................................................................................ 53
85
R. Pašteka, T. Wunderlich, D. Wilken, H. Stümpel, W. Rabbel, E. Erkul, P. Herceg, I. Kvetánová, J. Pánisová, J. Papčo, R. Putiška, D. Kušnirák, M. Krajňák: Results of the archaeo- geophysical research of the site Katarínka realized during the years 2011 – 2012 ..................................................................................... 55
M. Pitoňák, J. Janák, Z. Minarechová: Local gravity field model from GOCE and terrestrial measurements ................................................ 57
R. Putiška, D. Kušnirák, I. Dostál: Waterborne GPR survey for riverbed-sediment mapping ...................................................................... 58
M. Revallo, F. Valach, P. Hejda, J. Bochníček: Modeling of intense geomagnetic storms by using an empirical model and artificial neural networks ........................................................................................ 60
S. Ševčík, A. Ondrášková: Analysis of Schumann resonance frequencies determined by two different methods – Lorentz functions fitting and complex demodulation ............................................ 61
I. Smetanová, M. Müllerová, K. Holý, A. Moravcsík, T. Kovács, A. Csordás, M. Neznal, M. Neznal, K. Kozak, J. Mazur, D. Grzadziel: Integration measurements of indoor radon and thoron activity concentration in family houses in Ružomberok town (Northern Slovakia) ......................................................................... 63
M. Sobh, E. Issawy, A. Radwan, G. El-Qady: Imaging subsurface cavities using geoelectric tomography, ground-penetrating radar and microgravity ....................................................................................... 65
T. Šoltis, J. Brestenský: Earth's core rotating magnetoconvection models in the plane layer; two different orientations of rotation axis ............................................................................................................ 66
T. Šoltis, J. Šimkanin: Magnetic field and velocity structures in rotating uniformly and non-uniformly stratified spherical fluid shells in dependence on the Prandtl number and electromagnetic boundary conditions ................................................................................. 68
Č.Tomek: Neogene flexural down bending of the lower plate under the West Carpathians, deep seismic evidence and problems in gravity interpretation ................................................................................ 69
86
P. Vajda, I. Prutkin, M. Bielik, V. Bezák, R. Tenzer: Joint 3D interpretation of Kolárovo gravity and magnetic anomalies by the inversion method of local corrections ................................................. 71
P. Vajda, I. Prutkin, J. Gottsmann: Gravimetric search for magmatic sources during the 2004–2005 Teide (Tenerife) hybrid unrest................. 75
F. Valach, M. Váczyová, P. Dolinský, M. Vajkai: The historical data of the Hurbanovo Geomagnetic Observatory reconstructed by means of neural networks .................................................................... 78
P. Zahorec, V. Szalaiová, J. Papčo, J. Mikuška, R. Pašteka, D. Kušnirák, M. Krajňák, P. Vajda: Compilation of detailed gravimetric data from whole area of Slovakia .......................................... 79
Index of Authors ................................................................................................ 81
Contents .............................................................................................................. 83