Embed Size (px)
Citation preview
Subscriber access provided by University of Texas Libraries
Journal of the American Chemical Society is published by the American ChemicalSociety. 1155 Sixteenth Street N.W., Washington, DC 20036
In-trough cyclic voltammetric studies of Langmuir-Blodgettmonolayers of a surfactant derivative of
tris(2,2'-bipyridine)ruthenium(2+) at an indium-tin oxide electrodeXun Zhang, and Allen J. Bard
J. Am. Chem. Soc., 1989, 111 (21), 8098-8105 • DOI: 10.1021/ja00203a005
Downloaded from http://pubs.acs.org on January 30, 2009
More About This Article
The permalink http://dx.doi.org/10.1021/ja00203a005 provides access to:
• Links to articles and content related to this article• Copyright permission to reproduce figures and/or text from this article

8098 J . Am. Chem. SOC. 1989, 111, 8098-8105
barrier of 39.4 f 2.1 kJ mol-I has been reported for rotation in the extremely asymmetric terphenylenechromium tricarbonyl.'
A recent IR study by Manceron and A n d r e ~ s ~ ~ of the products resulting from the cocondensation of lithium atoms with benzene led the authors to propose a structure for Li(C6H6) similar to that which we suggest for AI(C6H6) with the Li along the C,, axis of the benzene ring.
Conclusion The same monoligand aluminum(0) complex is formed in
benzene and inert hydrocarbon matrices a t 77 K as is produced in solid neon at 10 K. The temperature dependence of the proton
(24) Manceron, L.; Andrews, L. J . Am. Chem. SOC. 1988, 110, 3840.
couplings of A1(C6H6) and its stability a t ambient temperatures are consistent with a 1,4 cheleotropic adduct at low temperatures, which becomes fluxional at higher temperatures, with the AI atom bonding clicking from one 1,4-position of the benzene ring to the next. A 1,2 *-complex in which the six protons become equivalent by migration of the aluminum atom from one C=C unit of the benzene ring to the next appears less probable.
Acknowledgment. We thank Dr. J. S. Tse for many helpful discussions and Professor R. L. Belford for making his ESR spectral simulation programs available to us. The collaboration of Dr. R. Sutcliffe during the early part of this work is gratefully acknowledged.
Registry NO. AI(C,D,), 122358-76-3; AI(C,H,), 122358-77-4.
In-Trough Cyclic Voltammetric Studies of Langmuir-Blodgett Monolayers of a Surfactant Derivative of Ru(bpy)32+ at an Indium-Tin Oxide Electrode
Xun Zhang and Allen J. Bard*
Contribution from the Department of Chemistry, The University of Texas, Austin, Texas 7871 2. Received March 22, I989
Abstract: Langmuir-Blodgett (L-B) monolayers of a surfactant derivative of ruthenium tris(bipyridine) complex, Ru- (bpy)2(bpy-C19)2+, where bpy = 2,2'-bipyridine and C19 = CH2NHOC(CH2),,CH3, confined to the surface of an indium-tin oxide electrode have been studied by cyclic voltammetry (CV) carried out in a Langmuir trough. The surfactant monolayer spread on an electrolyte subphase solution was brought to contact with the electrode by either vertical dipping under a surface pressure or horizontal touching at arbitrary surface concentrations. In the horizontal touch experiment, the surface tension was used to sustain contact of the subphase solution with the electrode, which was held at a position slightly above the air/water interface. In this arrangement the exact electrode alignment with the surfactant layer is not important. The data obtained from in-trough CV measurements reveal that the spread surfactant molecules at submonolayer concentrations were highly aggregated at the air/water interface rather than distributed homogeneously as a two-dimensional gaseous state, and a major cause for the incomplete electrochemical recovery of deposited L-B monolayers frequently observed is the relaxation of the compressed surfactant molecules toward the limiting molecular area in an ionic aqueous solution. The CV measurements performed also provided information concerning electron transfer in the organized monolayer assemblies, the physical and chemical changes of the spread surfactant layer at the air/water interface, and the mass transfer of solution species across the L-B monolayer films.
In a previous paper we reported for the first time the observation of the electrogenerated chemiluminescence (ECL) from an or- ganized monomolecular layer of a surfactant derivative of Ru- (bpy)32+ consisting of a single stearamidomethylene chain linked to one bipyridine unit a t the 4-position (abbreviated Ru(bpy),- (bpy-C19)2+) on the surface of indium-doped tin oxide (ITO), Pt, and Au electrodes.' The surfactant monolayer was coated on the substrate electrodes by the L-B method and the ECL was generated in an electrochemical cell containing an aqueous oxalate solution by applying a positive potential to the electrode modified by the monolayer of R~(bpy)~(bpy-C~?+) .~ The ECL observation revealed that a Ru(bpy)2(bpy-Clg)z+ monolayer confined to a conductive surface by the L-B technique was excitable through an electrochemical route and that the radiative decay of the excited states could compete with the nonradiative ones. While this concept of immobilizing luminescent molecules on electrode
( I ) Zhang, X.; Bard, A. J . J . Phyys. Chem. 1988, 92, 5566. (2) For the proposed mechanism of this ECL system, see: (a) Chang, M.;
Saji, T.; Bard, A. J. J . Am. Chem. SOC. 1977, 99, 5399. (b) Rubinstein, I.; Bard, A. J. J . Am. Chem. SOC. 1981, 103, 512.
0002-7863/89/1511-8098$01.50/0
surfaces led to the development of a new class of ECL systems that can be useful for a variety of purpo~es,~ it also motivated us to characterize these organized monolayers at electrodes by electrochemical techniques. Although monolayer assemblies of Ru(bpy)32+ derivatives formed by L-B and other methods have been the subject of extensive photochemical and spectroscopic ~ t u d i e s , ~ their electrochemical studies have been limited.5
In this paper we describe the application of cyclic voltamme- try(CV) carried out in a Langmuir trough to the characterization of the L-B monolayer films of R~(bpy)~(bpy-C,#+. There have been a number of reported studies about the electrochemical behavior of organized assemblies of surfactant molecules on electrode In particular, two previous reports have
(3) Zhang, X.; Bard, A. J. U. S. Patent, in preparation. (4) Kalyanasundaram, K. Coord. Chem. Rev. 1982, 46, and references
( 5 ) Daifuku, H.; Aoki, K.; Tokuda, K.; Matsuda, H. J . Elecrroanal. Chem.
( 6 ) (a) Fujihira, M.; Araki, T. (a) Chem. L e f f . 1986, 921. (b) Fujihira,
therein.
1985, 183, 1.
M. Bull . Chem. SOC. Jpn. 1986, 59, 2319.
0 1989 American Chemical Society
Monolayers of a Derivative of Ru(bpy)32+ J . Am. Chem. SOC., Vol. I 1 I. No. 21. 1989 8099
dealt with the use of CV in the studies of electroactive surfactant molecules spread on the air/water interface.6a*8 Fujihira and Araki6" reported briefly CV measurements of an anthraquinone surfactant derivative in the monolayer assembly spread on trough by horizontal touching the monolayer film with a glassy carbon electrode. In the experiment of Majda et a1.: the cyclic voltam- mograms were recorded with a gold micro-band electrode floated on the air/water interface to address the possibility of lateral electron transfer in a compressed monolayer film of a ferroc- ene-based surfactant molecule. Our cyclic voltammetric char- acterization of the R ~ ( b p y ) ~ ( b p y - C , ~ ) ~ + monolayer assemblies has been carried out under various conditions with several new experimental approaches. These have been used to obtain in- formation about the structural features of the molecular organ- ization, the electron-transfer properties, and other chemical characteristics. The type of CV measurements that were developed in this experiment to characterize the R~(bpy),(bpy-C,,)~+ sur- factant should prove useful for layers of other electroactive organic molecules.
Experimental Section Reagents and Electrodes. The synthesis and purification of Ru-
(bpy),( bpy-C19),+ was described previously.' The aqueous subphase solutions used both for the L-B film formation and electrochemical measurements were prepared from NaC104 (Fisher Scientific, Fairlawn, NJ), Na2S04 (MCB, Norwood, OH), and Milli-Q water. The solutions were cleaned by filtration through a Nylon-66 filter, pore size 0.2 p m (Rainin, Woburn, MA), and their acidities were adjusted with dilute HzSO4. An ITO/glass slide (ca. 0.5 cm2) was glued horizontally with Torr Seal onto a Teflon rod and was used as the working electrode for most measurements. Electrical contact to the IT0 was made by atta- ching a thin copper wire on one edge of the IT0 with silver paint, which was insulated by epoxy cement. The electrode was cleaned by soaking in a KOH/EtOH bath, sonicating in PrOH, and rinsing with water. Between consecutive CV measurements, it was cleaned by soaking in MeOH, rinsing with water, and then blow-drying with an air gun.
Apparatus. A Lauda film balance (Brinkmann, Westburg, NY) was used for the formation of the R~(bpy)~(bpy-C~~)~+ monolayer and also for the in-trough electrochemical measurements. The balance is equipped with a motor-driven lifter capable of a slow vertical motion of ca. 10 bm/s and a thermostat for the temperature control of the trough up to ca. 90 OC. The surface pressuremolecular area isotherms were recorded with the film balance. A PAR (Princeton Applied Research, Princeton, NJ) Model 175 potential programmer and a PAR Model 173 potent- iostat were used for the electrochemical measurements. The cyclic voltammograms were recorded with a Model 2000 X-Y recorder (Houston Instruments, Inc., Austin, TX).
Procedures. Preparation of R~(bpy),(bpy-C~~)~+ Film at the Air- Water Interface. The desired amount of a 2.00 mM chloroform solution of R~(bpy),(bpy-C~~)~+ was applied to the surface of a subphase solution, aqueous 1.0 mM NaC104 + 0.4 M NaS04 (pH 4.9, with a microliter syringe. The molecular surface concentration could be varied in two ways: by the control of the applied solution quantity and by a change of the total trough area through the motion of the film barrier. The surfactant layer was usually spread at the largest trough area and the electrochemical measurements begun from the lowest surface concen- tration.
Electrochemical Measurements. Most of the cyclic voltammograms shown in this paper were obtained with the electrode in contact with the film in the Langmuir trough, as first described by Fujihira et a1.6a In this method, the trough serves as the electrochemical cell. The electro- chemical measurements were carried out immediately after the contact between the electrode, and the molecular layer was made to avoid any possible reorganization of the structures during or after the transfer of the film from the air-water interface to the surfaces of the solid elec- trodes. The electrodes employed were an ITO/glass working electrode, a Pt-gauze counter electrode, and a saturated calomel reference electrode (SCE), all arranged in close proximity in the subphase solution (see Figure 1). To deposit the spread R~(bpy),(bpy-C~~)~+ molecules on the IT0 surface, two different methods were employed: the more usual
(7) See, for example: (a) Lee, C.-W.; Bard, A. J. J. Electroanul. Chem. 1988,239,441. (b) Facci, J. S.; Falcigno, P. A.; Gold, J. M. Langmuir 1986, 2,732. (c) Yokota, T.; Itoh, K.; Fujishima, A. J. Electroanal. Chem. 1987, 216,287. (d) Matsuda, H.; Aoki, K.; Tokuda, K. J. Electroanul. Chem. 1987, 217, 1, 15.
(8) Widrig, C. A.; Miller, C. J.; Majda, M. J. Am. Chem. Soc. 1988,110. 2009.
Surfactant Indium-Tin Oxide Monolayer on Glass
\ I
- 1-b Aqueous 1.0 mM NaC104+ 0.4 M Na2SCb ( pH 4.5 )
Barrier
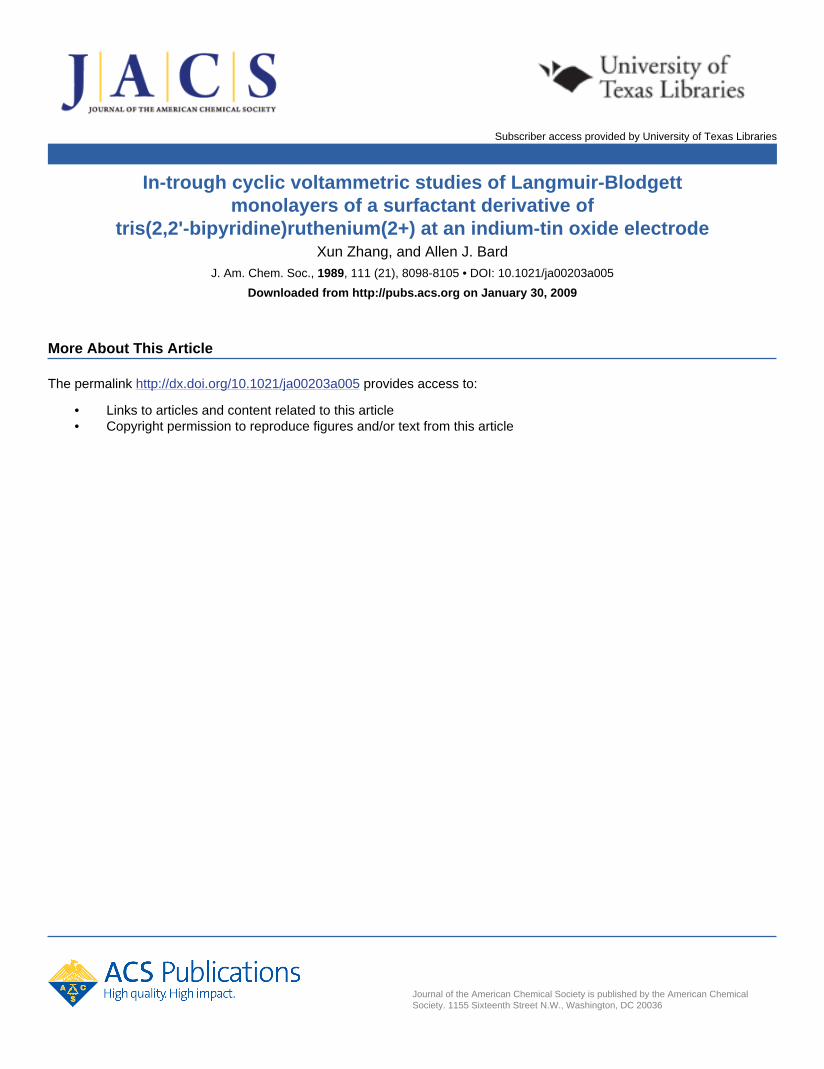
'I Figure 1. Experimental setup for in-trough cyclic voltammetry by the horizontal touching (HT) method: W, Indium-tin oxide (ITO) working electrode (ca. 0.5 cm2); C, Pt gauze counter electrode; R, saturated calomel reference electrode (SCE).
vertical dipping (VD) method9 and the horizontal touching (HT) me- thod.6a,'0 The VD method can only be employed when the monolayer is formed at the air/water interface with a surface pressure on the rising part of the isotherm. In a VD preparation, the IT0 electrode was initially immersed in the subphase solution. Then R~(bpy)~(bpy-C~~)~+ was spread and compressed. The monolayer was transferred from the water surface onto the electrode by lifting the electrode slowly (0.5 cm/min) out of the subphase solution at a controlled constant surface pressure. The surfactant monolayer was thus coated on the electrode with the hydrophilic site, the Ru(bpy)32+ head group, against the electrode surface and the hydrophobic hydrocarbon chain extending out. After quickly removing the surfactant from the water surface, the monolayer-covered electrode was placed back into the subphase solution and the cyclic voltammetric measurements were carried out. The HT method, on the other hand, is generally applicable at different surface pressures or dif- ferent surface concentrations, either before or after the formation of a complete monolayer on the water surface. In a HT preparation, Ru- (bpy)2(bpy-C19)2+ was spread on the surface of the subphase solution and the desired surface concentration was attained by moving the film barrier. The IT0 electrode, initially held above the air/water interface with its surface parallel to the interface, was first brought into contact with the surfactant molecules underneath it with the motor-driven lifter at a displacement speed of ca. 10 pm/s. The contact between the electrode and the surfactant/solution was sensed by monitoring the electronic noise level of the potentiostat (with the cell selector switch in the off-position) with the X-Y recorder at a response time of less than a second. Once contact was made, the direction of the displacement of the electrode was reversed and the electrode was pulled slightly away from the water surface. Because of the surface tension at the solid-water junction, the solution underneath the electrode was pulled upward by the electrode so that the contact between the electrode and solution was maintained even after the electrode had been moved slightly away from the original in- terface by as much as 1 mm. This phenomenon was important for the success of the in-trough HT experiment, because it allowed the electro- chemical measurements to be carried out without problems with the electrode alignment or of pushing the surfactant layer down into the subphase solution (see Figure 1).
Results and Discussion Monolayer Formation. A monolayer of R~(bpy)~(bpy-C,~)*+,
formed by spreading a small quantity of the surfactant dissolved in chloroform on the surface of an aqueous 1 .O mM NaC104/0.4 M Na2S04 solution (pH 4.9, showed the surface pressure-mo- lecular area isotherm given in Figure 2 (curve b). Curve a in
(9) See, for example: (a) Blodgett, K. B. J. Am. Chem. Soc. 1934,56,495. (b) Blodgett, K. B.; langmuir, I. Phys. Rev. 1937, 51, 964.
(1 0) See, for example: (a) Langmuir, I.; Schaefer, V. J. J. Am. Chem. Soc. 1938.60, 1351. (b) Fukuda, K.; Nakahara, H.; Kato, T. J. Colloid. Interjbce Sci. 1976,54,430. (c) Kamata, T.; Umemura, J.; Takenaka, T. Chem. Lett. 1988, 1231.
8100 J . Am. Chem. SOC.. Vol. 111. No. 21, 1989 Zhang and Bard
I I I I I I I 0 5 0 100 150 200
Area / A2/molecUle
Figure 2. Surface pressure-molecular area isotherms of Ru(bpy),(bpy- CI9)'+ at 22 1 O C . Subphase: (a) 1.0 mM NaC104 aqueous solution (pH 6 . 7 ) , (b) 1.0 mM NaC104, 0.4 M Na2S04 aqueous solution (pH 4.5).
Figure 2 is the isotherm obtained with a subphase solution con- taining no Na2SO4.I Sodium sulfate was added into the subphase solution to make the solution sufficiently conductive for the electrochemical measurements. Thus, it was used primarily as a supporting electrolyte rather than as a component for monolayer formation. Nevertheless, the presence of Na2S04 was also found to stabilize the monolayer. With Na2S0, in the subphase solution, the pressure-area isotherm was reproduced in both the com- pression and expension modes over time periods of several hours, while it was reproducible only over time periods of several minutes without Na2S04. The pressure-area isotherms of surfactant derivatives of Ru(bpy),2+ are known to be affected by the com- position of the subphase s ~ l u t i o n . ~ As seen in Figure 2, curve b is different from curve a in that b rises more steeply, indicating that the monolayer film was relatively less compressible in the presence of 0.4 M Na2S04. This may result from the increased difficulty in excluding water and salt molecules from the molecular packing structure of Ru(bpy)2(bpy-C19)2+ in the presence of Na2S04. The area per molecule a t which the pressure started to rise and the pressure at which the monolayer film collapsed, however, were essentially unchanged by the addition of Na2S04, remaining at about 125 A/molecule and about 45 dyn/cm, re- spectively.
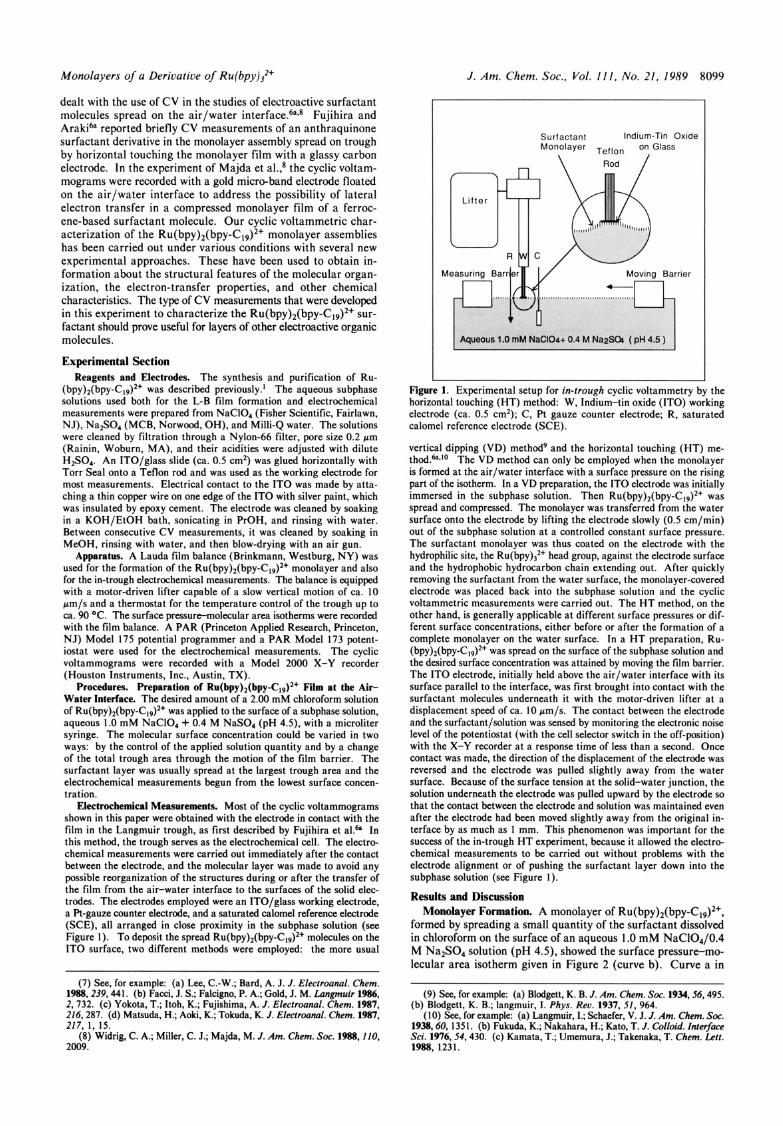
Cyclic Voltammetric Measurements at Submonolayer Coverages. As described in the Experimental Section, the cyclic voltammetry of a surfactant spread on the surface of an electrolyte solution could be carried out by the horizontal touching (HT) method at various surface concentrations even before the rise of surface pressure. Figure 3 shows two sets of cyclic voltammograms ob- tained at two different surface concentrations of Ru(bpy)2(bpy- C19)2+ with the ITO/glass working electrode horizontally touching a 1 .O mM NaC104/0.4 M Na2S04 subphase solution, with the potential scanned between f0.6 and f 1 . 3 V versus SCE at 200 mV/s. Set A corresponds to a Ru(bpy)2(bpy-Clg)z+ surface concentration of 2.8 X lo-" mol/cm2 (Le., 600 A2/molecule) or 20% surface coverage," while set B corresponds to 6.9 X lo-" mol/cm2 (240 A2/molecule) or 50% surface coverage. Each set contains 12 CVs which were recorded over a time period of ca. 15 min. The clean ITO/glass electrode was first brought into contact with the surfactant-applied subphase solution by the lifter at a slow speed and then the CV measurement was performed. After every CV measurement, the electrode was removed from the lifter, cleaned by wiping and soaking with MeOH, rinsed with H 2 0 , and remounted onto the lifter after air-blow-drying for the next measurement. This whole process of electrode cleaning took a little more than 1 min. As seen in Figure 3, among the 12 CVs in set A, 5 showed just the background response, while the other 7 showed CV waves characteristic of the Ru(bpy)3Z+ species with varied peak heights. For comparison, the 12 CVs in set B all showed R~(bpy),(bpy-C,~)~+ waves with the peak heights of most of them much higher than the ones in set A. These CVs were
(1 1) The surface coverage is defined as the ratio of the applied surface concentration to that corresponding to the limiting molecular area of Ru- ( ~ P Y ) ~ ( ~ P Y - C I ~ ~ * , 120 A2.
Set A
Set B I
Figure 3. Cyclic voltammograms (CV) of Ru(bpy)2(bpy-C,9)2+ obtained with the IT0 electrode by the HT method in 1 .O mM NaC104/0.4 M Na2S04 aqueous solution (pH 4.5) at two submonolayer surface con- centrations: 2.8 X lo-" mol/cm2 or 20% coverage (set A) and 6.9 X lo-" mol/cm2 or 50% coverage (set B). The potential of the I T 0 elec- trode was scanned between +0.6 and +1.3 V versus SCE at 200 mV/s. The order in which the 12 CVs in each set were recorded is counter- clockwise from 1. They were obtained over a time period of ca. 15 min. with the electrode cleaned after every CV recording.
reproducible in terms of their stochastic patterns of waves at each surface concentration for hundreds of trials involving several different samples of surfactant applied to the trough. The above CV results provide information about the physical state of spread surfactant molecules at the air/water interface at submonolayer coverage. These results suggest that when the surfactant molecules rest on the water surface, they tend to form monolayer aggregates of certain sizes rather than distribute uniformly over the entire trough as they would in a "gaseous-like" state. Because the surfactant molecules form aggregates on the subphase solution, at low surface concentrations, such as that in set A, a large portion of the water surface area is left uncovered. As the monolayer aggregates float and move around on the trough surface, the electrode might contact aggregates at one dip but not at another. In the former case a CV with the signal of the surfactant molecules would be obtained, while in the latter case only a background CV of the subphase solution is expected. This scheme can explain the CV data shown in Figure 3. At the lower surface concentration of the surfactant (set A), the electrode sometimes touched the monolayer aggregates and sometimes did not, so that the CV data sometimes showed waves for Ru(bpy)2(bpy-C1,)z+ and sometimes did not. At the higher surface concentration (set B), the prob- ability of the electrode encountering aggregates, given the large size of the electrode, was almost unity, so that the waves of R ~ ( b p y ) ~ ( b p y - C , ~ ) ~ + showed up in all the CVs. Since the mon- olayer aggregates picked up by the electrode must vary both in size and quantity in different trials, the CV waves exhibited different peak heights. The CV data shown in Figure 3 also gives a rough idea about the sizes or size distribution of these monolayer aggregates; they were probably quite large considering the large size of the electrode employed (ca. 0.5 cm2). More detailed information about the size distribution of the surfactant aggregates on the aqueous subphase surface could be obtained by using the present method to run a series of CVs with electrodes of different sizes. A statistical model best describing the size distribution of the aggregates should be obtainable on the basis of the CV data obtained.
This CV measurement is actually a very sensitive method for the electrochemical determination of small amounts of surfac- tant-like species. For example, when the Ru(bpy),'+ surfactant

Monolayers of a Derivative of Ru(bpy)j2'
50
J . Am. C h e m S o c . , Vol. 111, No. 21, 1989 8101
. 6 a c x U
40
. 30 IE
20
10
50 75 100 125 150
AREA / ~z/rnolecule Figure 4. The ratios of the surface concentrations of electrochemically recovered Ru(bpy)2(bpy-C,9)2+ evaluated from the integrated CV re- sponses, re, to those of the surfactant molecules transferred from the air/water interface onto the electrode, r, obtained by both the HT (a) and vertical dipping (VD) (b) methods. The pressure-area isotherm is also plotted to indicate the corresponding surface concentrations and pressures of the spread R~(bpy)~(bpy-C,~)~+ monolayer at each data point.
derivative is analyzed by this method at a surface concentration similar to the one used for recording the voltammograms in set A, a detection limit of as low as mol would correspond to an equivalent coverage on an ultramicroelectrode of 25-rm di- ameter. This detection limit represents preconcentration of the total sample on an electrode surface and is orders of magnitude lower than those of other sensitive spectroscopic and photochemical methods, such as luminescent techniques.12 The advantage gained in the present arrangement is through the omission of the mass transfer process of the redox species from the solution bulk to the electrode surface. By spreading the molecules of interest on a two-dimensional surface of an electrolyte solution, one obtains a large preconcentration factor and reduces greatly the quantity of the molecules needed for electrochemical measurements. In principle, the present method should also be applicable to the electrochemical determinations of species other than surfactant derivatives that are insoluble and can be well spread on an ap- propriate electrolyte solution of selected composition.
Cyclic Voltammetry of Compressed Monolayer. As the total film area is reduced by moving the film barrier, a complete monolayer is formed at the air/water interface. The surfactant monolayer could be further compressed until the surface pressure reached a value where the film ruptures; a t this point, the area occupied by each R ~ ( b p y ) , ( b p y - C ~ ~ ) ~ + molecule had shrunk by a factor of 2 from its limiting value of ca. 120 A2 (Figure 2). CV measurements could be made during the course of the compression of the monolayer at any point along the isotherm corresponding to a specific surface pressure and concentration (or equivalent area per molecule). For any specified surface concentration of the surfactant molecule a t the air/water interface, r, a corresponding electrochemical concentration, re, can be obtained from graphical integration of the voltammogram. The ratio, I',/I', is an ex- perimental measure of the electrochemical recovery efficiency of the surfactant molecules immobilized on the electrode surface. Plotted in Figure 4 are two sets of the r,/r data obtained at four different surfactant surface concentrations, one with the H T method for electrode preparation (a) and the other with the VD method (b). The values of re determined from the integrations of the voltammograms were reproducible a t a given surface concentration, with a typical standard deviation of 15 to 20%. The four data points for the HT method (a) do not deviate very much from unity, indicating that almost all the surfactant molecules
(12) See, for example: Ege, D.; Becker, W. G.; Bard, A. J. Anal. Chem. 1984,56, 2413.
confined to the electrode surface by the HT method could be recovered electrochemically a t any surface concentration or pressure. The situation was different, however, when the surfactant molecules were deposited on the electrode by the VD method. As shown by data set b in Figure 4, as the surface concentration on the trough increased from ca. 120 to ca. 60 A2/molecule, which was accompanied by a surface pressure increase of the monolayer film from ca. 5 to 35 dyn/cm, the electrochemical recovery ratio, J?JI', decreased from ca. 0.9 to ca. 0.5. In other words, no matter how much the surface concentration of the surfactant increased, in a VD experiment, the electrochemical response was essentially the same as that obtained at the surface concentration defined by the limiting molecular area of R~(bpy) , (bpy-C,~)~+ (ca. 120 A2). The same result was also observed in our previous experiment, where the electrode coated with a vertically deposited compact monolayer of Ru(bpy),(bpy-CI9)*+ was transferred to a conven- tional electrochemical cell and its integrated CV response always gave a surface coverage equivalent to ca. 130 A2/molecule.' Although there have been reported studies revealing that the structures of deposited L-B monolayers might vary with the de- position method employed,'0c crystallographic and orientation- al-type structural variations probably cannot account for the decrease in r,/r observed with the electrode prepared by the VD method. If we assume that most of the surfactant molecules immobilized on the electrode surface can be oxidized or reduced, then the large decrease in r,/r implies that the molecular surface concentration at the electrode is different from that at the air/ water interface; i.e., there was a loss of the surfactant molecules from the electrode surface. A measurement on the molecular transfer ratio from the water to the electrode surface with a large ITO/glass slide using the VD method at controlled constant pressure resulted in a number very close to unity. The molecular transfer ratio is defined as the ratio between the total area of the surfactant that is transferred to the solid substrate and the change in area on the trough associated with the transfer of the surfactant monolayer from the air/water interface onto the surfaces of the solid substrate a t a constant surface pressure. The loss of the surfactant molecules, therefore, must occur when the electrode is reimmersed in the electrolyte solution for the electrochemical measurement. Depending on the relative strength of the adsorptive interaction between the surfactant and solid substrate, holding the deposited molecules together, to the net repulsive interaction among the compressed surfactant molecules, which drives the deposited molecules apart, the transferred monolayer film is in a state of relative stability. When the electrode is placed in an electrolyte solution, the balance between the two interactions may be broken by the involvement of solvent molecules and ions that introduce new interactions with both the surfactant molecules and solid substrate. In the present experiment the binding force of the L-B monolayer of R ~ ( b p y ) ~ ( b p y - C , ~ ) ~ + to the surface of the ITO/glass electrode was a weak force, while the repulsive in- teraction among the Ru(bpy)>+ head groups was probably offset only partially by the affinitive relation between their hydrophobic chains. When the ITO/glass electrode covered with a monolayer film of R~(bpy)~(bpy-C,~)'+, which was deposited under a certain pressure, reenters the subphase solution, the compressed surfactant molecules might relax to their limiting molecular area at which most of the pressure was released. In this scheme a decrease in the surface concentration of R~(bpy),(bpy-C,,)~' a t the electrode from that at the air/water interface would be induced. Moreover, the more the deposited surfactant molecules are compressed, the more the surface concentration ratio would be decreased. This was exactly what was observed in the VD experiment. The ratio r,/r dropped as the surface pressure for the monolayer deposition increased, while the value of re was not changed much with the deposition pressure within the studied range.
A simple, but demonstrative, experiment was carried out to examine further the above proposed scheme. In the experiment a rectangular ITO/glass electrode 1 cm wide and 2 cm long was divided into three zones (A, B, C), with the middle zone B in- dicated by a wide (ca. 0.5 cm) line drawn on the edge of the glass. A compressed monolayer of Ru(bpy)2(bpy-C,,)2+ was deposited

8102 J . Am. Chem. SOC., Vol. 111, No. 21, 1989 Zhang and Bard
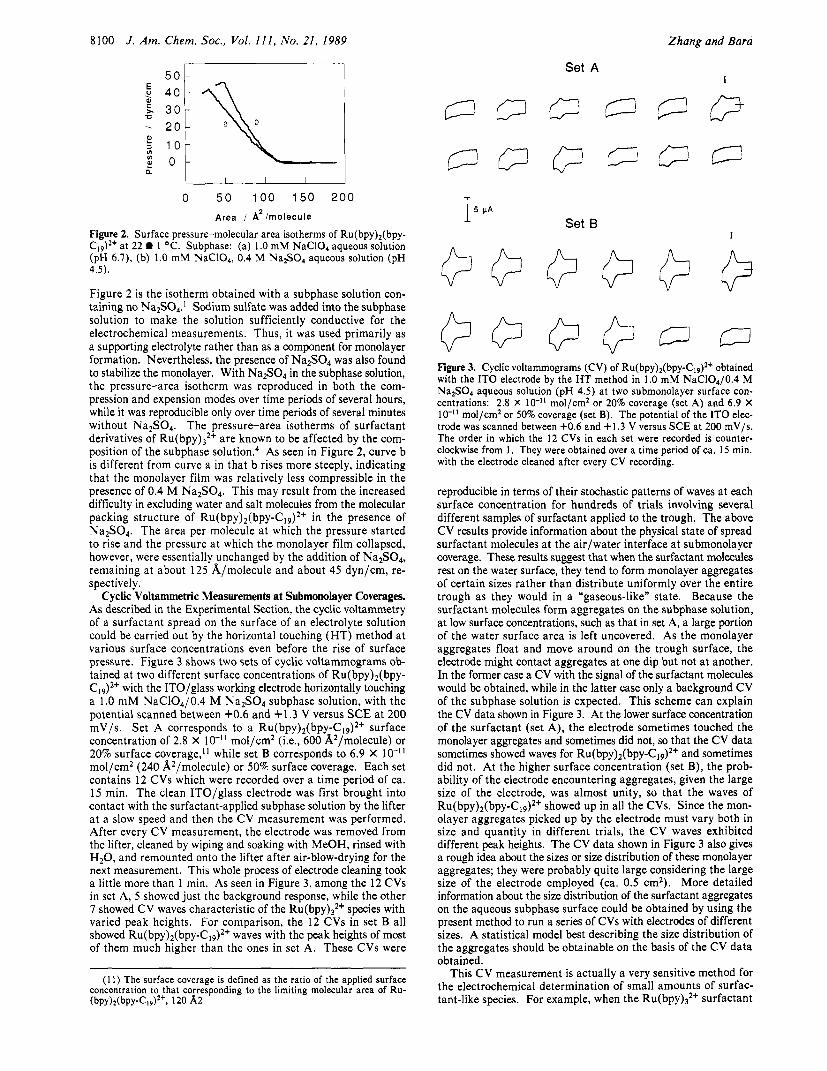
coated with a monolayer, bilayer, and trilayer of Ru(bpy),(bpy- C1#+ through successive dipping or touching. These results are typical of several trials carried out on the same and different L-B films of Ru(bpy)2(bpy-C19)'+ by the VD and HT methods. There are a number of interesting features in the results of Figure 5. First, the integrated charge from the CV of the monolayer-covered electrode was larger in a than in b by a factor of almost 2, for the reasons discussed in the above paragraph. A possible current contribution by lateral electron transfer beyond the electrode edge is probably not important in the HT experiment, because a large electrode was used. To see such contributions, one would need to operate on a much smaller current scale.8 Second, the CV peaks shown in Figure 5a are broader than those in Figure 5b, suggesting a more sluggish electrochemical reaction of the Ru(bpy),(bpy- C19),+ monolayer at the electrode in the HT experiment compared to that in the VD experiment. Note that a decrease in the rate of the heterogeneous electron transfer causes a surface CV wave to broaden and the difference in potential between the cathodic and anodic peaks (AE,) to increase.13 A study of the effect of scan rate ( u ) on AEp showed that AEp was larger for H T films than for VD films at high scan rates; Le., u 2 1 V/s. As described in the Experimental Section, in the VD experiment the first monolayer of Ru(bpy)z(bpy-Cl9)'+ was deposited on the I T 0 electrode with the Ru(bpy),,+ groups in direct contact with the electrode surface, while in the HT experiment the electrode surface was in contact with the hydrocarbon chains of the surfactant with its Ru(bpy)?+ groups spaced away from the electrode surface. The existence of this hydrocarbon layer between the electrode and the redox species would create an additional barrier for the electron transfer (et) reaction, so that slower et kinetics would be observed in the HT experiment. The exact distances between the electrode and Ru(bpy),,+ groups in the electrolyte solution are difficult to know at this stage. The third observation made in our experiment relates to the CV responses of the Ru(bpy),(bpy-CI9)*+ multilayers immobilized on the electrode surface. In the H T experiment the peak current increased with the deposition of each additional monolayer, from.monolayer (1) to bilayer (2) to trilayer (3) (Figure 5a). In the VD experiment, however, the peak current did not increase with the deposition of the additional monolayers, and even decreased very slightly (Figure 5b). An understanding of this observation again requires a consideration of the difference in the molecular packing structure between the surfactant layers prepared by the H T method and those by the VD method. Through consecutive HT operations, a multilayer of Ru(bpy),- ( b p ~ - C , ~ ) ~ + was coated on the electrode surface according to a repetitive tail-head-tail-head sequence so that the separation between two Ru(bpy),'+ head-group layers was limited to just one hydrocarbon chain (see schematic drawing in Figure 5a). Therefore, in direct analogy to the electrochemical reaction of the first monolayer, et to the second and third occurs with a contribution to the observed peak currents. The integration of the CV responses of the bilayer- and trilayer-covered electrodes gave total charges less than expected from the surface concen- tration increases (Le., two and three times, respectively, of the monolayer number), probably indicating an increasing difficulty in electron propagation along the stacked surfactant molecules. In the VD preparation, the first monolayer of R~(bpy) , (bpy-C~~)~+ was put down by lifting the electrode upward across the spread film at the air/water interface and the second monolayer by dipping the electrode downward into the subphase solution. As a result, a bilayer was coated on the electrode surface in head- tail-tail-head sequence. Thus, the second layer of Ru( bpy),,+ head groups was separated from the first layer by two hydrocarbon chains (see schematic drawing in Figure 5b). This large separation distance would prevent et to the second layer, and thus, no increase in peak current would be observed. The very slight decrease in peak current found might result from a decrease in the surface concentration of the first monolayer on the electrode as the
2 2
3 3
a b
u - 1.6 1.1 0.6 1.6 1.1 0.6
V vs. SCE V vs. SCE
Figure 5. CVs of R~(bpy),(bpy-C,9)~+ coated on the IT0 electrode at 30 dyn/cm by the HT (a) and VD (b) methods obtained in 1.0 m M NaC10,/0.4 M Na2S04 aqueous solution (pH 4.5) at 200 mV/s. The numbers, 1, 2, and 3, indicate the responses of the electrode coated with a monolayer, bilayer, and trilayer of the surfactant derivative through successive dipping or touching. The top portion shows idealized sche- matic packing patterns of the surfactant layers on the electrode (repre- sented by the dark line).
by the VD method at controlled constant pressure only on the bottom part of the electrode (ca. 0.7 cm) (zone A). The electrode was removed from the trough and was then immersed in electrolyte solution for times of about 1 to 10 min. After drying in air, the electrode, set perpendicular to the solution surface, was turned around and brought slowly into the solution with only the top part (the initially uncovered zone C) immersed in the solution. A cyclic voltammogram showed a clear wave of R~(bpy),(bpy-C,~)~+. The height of the peak of the CV wave for zone C was 5 to 10% of that of the wave found when only zone A was immersed, and increased with time of immersion of the whole electrode in electrolyte solution after monolayer deposition. After cleaning the electrode with MeOH, only a background voltammogram was recorded in the same solution at the same sensitivity setting, and the Ru wave had disappeared. The result of this experiment suggests that the compressed surfactant molecules on the electrode surface on zone A expanded upon soaking in the electrolyte so- lution into the initially uncovered region, zone C.
Note, however, that in CV measurements done by the H T method, the recovery ratio was almost unity at any surface con- centration of the compressed surfactant molecules. In this case the immobilized molecules on the electrode were prevented from expanding by the surrounding molecules at the air/water interface which were subject to the same surface pressure. This lateral surface pressure in the H T films probably also minimizes any flipping-over of the molecules, although for monolayers formed by the HT method, the molecular arrangement is more stable with the hydrophilic head group pointing toward the aqueous solution rather than the ITO. These findings might also explain the data obtained in other reported studies that showed electrochemical recovery ratios significantly less than unity a t higher deposition surface pressures of L-B monolayer^.^.^
Cyclic Voltammetry of Multilayers. The CVs shown in Figure 5 were recorded at a surface pressure of Ru(bpy),(bpy-C19)'+ of 30 dyn/cm at 200 mV/s by both the HT (a) and VD (b) methods. Note the current scale difference between a and b of a factor of 2. The numbers, 1, 2, and 3, indicate the responses of the electrode
( 1 3 ) (a) Laviron, E. In Elecfroanalyfical Chemistry; Bard, A. J., Ed.; M. Dekker: New York, 1982; Vol. 12. (b) Bard, A. J.; Faulkner, L. R. Elec- frochemical Methods; Wiley Interscience: New York, 1980; pp 519-525.

Monolayers of a Derivative of Ru(bpy)j2'
b
R 0.5pA
C
a
1.6 1.1 0.6 V vs. SCE
u 1.6 1.1 0.6
V vs. SCE
- V vs. SCE
1.6 1.1 0.6
Figure 6. CVs of a partially hydrolyzed Ru(bpy),(bpy-C,9)2+ monolayer compressed at 30 dyn/cm obtained by the HT method with the IT0 electrode in 1 .O mM NaC10,/0.4 M Na2S04 aqueous solution (pH 4.5) a t three scan rates: (a) 10, (b) 25, and (c) 50 mV/s. Partial hydrolysis was induced by thermostating the trough at 60 OC for 44 h.
compressed molecules relaxed further during the measurements. While the above discussion based on the different structures
of H T and VD multilayers provides a reasonable explanation for the observed differences in the CV results, one must be aware of the possibility that structural defects in the monolayer assemblies may be present and also play a role. Because of the hydrophilicity of the I T 0 surface, some of the surfactant molecules might flipover during lifting following the HT process and thus introduce packing defects that can promote the et reaction. Note that the large separation distance between the active redox layers in a multilayer assembly prepared by the VD method is relatively stable, because it is constructed through the affinitive hydrophobic interaction between two hydrocarbon chains. The separation in a multilayer assembly prepared by the HT method, on the other hand, is relatively unstable because it involves interaction of a hydrophobic hydrocarbon chain with a hydrophilic ionic group. This difference in the stability of the separation layers may also account for the different CV results obtained with the multilay- er-covered electrodes prepared by the HT and VD methods. Note that the schematic drawing in Figure 5a is a highly idealized one included to make the discussion of the CV results after the HT and VD film formation easier to follow and is not intended to be an accurate depiction of the layer structure.
Cyclic Voltammetry in the Presence of Dissolved Reactants. In Figure 6 three voltammograms recorded at three different scan rates (IO, 25, and 50 mV/s) of films obtained by the HT method are shown for a partially hydrolyzed R ~ ( b p y ) ~ ( b p y - C , ~ ) ~ + mon- olayer compressed at 30 dyn/cm. Partial hydrolysis, Le., cleavage of the amide linkage with formation of a soluble Ru species, was induced by thermostating the trough at 60 "C for 44 h. The results in Figure 6 demonstrate that the in-trough CV experiments can supplement surface pressure-area isotherm measurements and are capable of sensing both physical and chemical changes of the surfactant molecules occurring at the air/water interface. In these voltammograms, in addition to the previously described but somewhat decreased surface peaks of R ~ ( b p y ) ~ ( b p y - C , ~ ) ~ + , new diffusion-controlled peaks appeared at a less positive potential. The surface peaks increase with potential scan rate (u) , while those of solution species increase with u1/2;13 thus a change in the relative magnitudes of the two waves is seen clearly in Figure 6 with change in u. The new peaks must be caused by the electro- chemically active product of the hydrolysis of Ru(bpy),(bpy- C1$+. Because the diffusional wave appeared at a potential significantly less positive than that corresponding to the oxidation of a simple Ru(bpy),'+ species, the hydrolyzed product may be a ligand-exchanged form or the oxidation involved the free-amine group in one bpy ligand. The new diffusion-controlled peaks were absent in the voltammograms recorded by the VD method, in which the electrode was totally immersed in the bulk of the
J . Am. Chem. SOC., Vol. 1 1 1 , No. 21, 1989 8103
u 1.7 1.2 0.7 0.2
V vs. SCE
1.7 1.2 0.7 0.2 V a. SCE
u 1.7 1.2 0.7 0.2
V vs. SCE
1.7 1.2 0.7 0.2 V v6. SCE
Figure 7. CVs recorded with the IT0 electrode coated with a monolayer of Ru(bpy)2(bpy-C,,)2+ by the VD method at 30 dyn/cm in a conven- tional electrochemical cell containing 0.2 mM Os(bpy)32+ and 0.5 M Na2S04 in water (pH 4). Potential scan rate: (a) 0.02, (b) 0.1, (c) 0.5, and (d) 2 V/s.
subphase solution during the measurements. This result indicates that the hydrolyzed species was not transferred to the electrode surface by the VD method, so it was nonsurfactant, and remained primarily near the air/water interface rather than being distributed into the solution bulk. The charged species were probably preferably held near the interface by their electrostatic or other interactions with the surfactant molecules. The oxidation current seen after the surface peak in the voltammograms probably represents a catalytic contribution to water oxidation by the Ru species, since the current at the bare I T 0 electrode at these potentials was much smaller. The current increased in relative magnitude as u decreased, indicating a larger relative contribution for this catalytic reaction as the time scale increased.
Modified electrodes, including those incorporating immobilized monolayer or monolayer assemblies, have found application as chemical sensors and electrocatalytic surfaces.l4 For example, the R ~ ( b p y ) , ( b p y - C ~ ~ ) ~ + / I T O system was previously shown to be catalytic for the oxidation of oxalate and amines.'-3 In the course of development of the above type of applications, it is important to understand the effect of immobilized layers on the mass transfer of solution species from the bulk solution to the electrode surface. This effect can usually be studied conveniently by electrochemical (e.g., CV) methods with appropriately selected systems and conditions. In Figure 7 a group of four CVs are presented as typical results to be analyzed in the study of this system. The four CVs (a through d) were recorded with a monolayer-covered ITO/glass electrode, which was prepared by the VD method and transferred to a conventional electrochemical cell containing an aqueous 0.2 mM O~(bpy) ,~+/0.5 M Na2S04 solution (pH 4) at scan rates of 0.02, 0.1, 0.5, and 2 V/s. The diffusion-controlled peaks seen at ca. 0.6 V correspond to solution O ~ ( b p y ) , ~ + , while the surface peaks at ca. 1.1 V represent im- mobilized R ~ ( b p y ) ~ ( b p y - C ~ ~ ) ~ + . Analogous CV results were obtained with the same electrode in an aqueous 0.5 mM Fe- (CN)64-/0.5 M Na2S04 solution at different u. O ~ ( b p y ) , ~ + and
(14) See, for example: (a) Murray, R. W. In Electroanalyrical Chemistry; Bard, A. J., Ed; M. Dekker: New York, 1984; Vol. 13. (b) Wrighton, M. S . Science 1986, 231, 32 .

8104 J . Am. Chem. SOC., Vol. 111, No. 21, 1989 Zhang and Bard
Table I. Cyclic Voltammetric Peak Currents for the Oxidations of Solution Os(bpy)32+ and Fe(CN)6e at Bare and R~(bpy)~(bpy-C,~)~+-Covered I T 0 Electrodes'
Os(bpy)32+ (0.2 mM) Fe(CN)64- (0.5 mM) ~~ ~ ~~ ~
U U ' / 2 ip,a (ip,a/cap,a) (PA) iP,, (ip,a/c'p,a) (PA) (V/S) (V'/2/s1/2) c'p,a (PA) monolayer bilayer trilayer kOp,a (PA) monolayer bilayer trilayer 0.02 0.141 8.0 8.0 (1.0) 8.0 (1.0) 7.3 (0.91) 21.5 20.0 (0.93) 20.0 (0.93) 17.5 (0.81) 0.05 0.224 12.9 12.4 (0.96) 12.4 (0.96) 10.8 (0.84) 32.5 29.5 (0.91) 29.0 (0.89) 24.8 (0.76) 0.1 0.3 16 18.1 17.3 (0.96) 16.7 (0.92)) 14.3 (0.79) 43.3 39.0 (0.90) 38.0 (0.88) 31.5 (0.73) 0.2 0.447 25.3 23.8 (0.94) 18.5 (0.73) 18.3 (0.72) 57.0 51.0 (0.89) 49.5 (0.87) 40.0 (0.70) 0.5 0.707 38.8 35.3 (0.91) 26.5 (0.68) 26.0 (0.67) 81.0 71.0 (0.88) 68.0 (0.84) 55.0 (0.68) 1 1 .oo 50.5 44.5 (0.88) 33.0 (0.65) 32.0 (0.63) 101.5 99.0 (0.89) 85.5 (0.84) 69.0 (0.68)
"0, potential scan rate; anodic peak current at bare tin oxide electrode (-0.5 cm2); i , , , anodic peak current at R~(bpy),(bpy-C19)~+-covered tin oxide electrode.
Fe(CN),' were chosen as the solution species for the mass transfer test, because their oxidations occur prior to that of R ~ ( b p y ) ~ - (b~y-C]9)~+ and their relatively rapid heterogeneous et rates yield waves that are not affected kinetically by the presence of the R~(bpy) , (bpy-C,~)~+ layer. In addition, their molecular sizes are either comparable to or smaller than the Ru(bpy)?+ head group and they carry opposite charges. Note that as u increased from a through d, the peak currents of both the surface and diffusional waves increased, with the former increase proportional to u and the latter proportional to un, where cy was evaluated from log iP,, versus log u plot to be ca. 0.43. The observed deviation of cy from 0.5, a number expected for a reversible diffusion-controlled CV, suggests a hindrance (but not total blockage) of the mass transfer of the solution species to the electrode surface imposed by the immobilized surfactant layer. Two full sets of the anodic peak current data, one from the CVs of Os(bpy)?+ and one from those of Fe(CN)6e, are given in Table I. They were recorded with a bare I T 0 electrode ( I ~ a) and the same electrode coated with a monolayer, bilayer, anttrilayer of R~(bpy),(bpy-C~9)~+ by the VD method (ips) at various scan rates. Compared with the values of zaps, those of i , , were generally smaller, and, more importantly, the relative reduction in peak current was larger at higher scan rates and with multilayer-coated electrodes. These data, in the form of the peak current ratios, i , /iQp,a, as a function of v ' / ~ for the oxidations of both Os(bpyf3;+(a) and Fe(CN)64- (b) a t monolayer-, bilayer- and trilayer-covered electrodes are shown in Figure 8. The choice of the peak current ratio, ip,a/z"p,a, rather than the peak current itself, i,,, was made to compensate for any peak current decreases caused by irreversibility of the redox re- action and uncompensated solution resistance that might become involved at high scan rates. Deviations from unity of ip,a/iQp,a should reflect the additional effect of the coated surfactant layer. As shown in both Table I and Figure 8, the peak current ratio deviated from unity more significantly as more surfactant layers were coated on the electrode and as the oxidation was carried out at higher scan rates. The above result suggests a partial blocking effect of the immobilized R~(bpy) , (bpy-C~,)~+ L-B film on the reaction of the solution species a t the electrode surface. The blockage is likely the result of a slowdown in the mass transfer process of the solution species across the surfactant layer, because its relative significance increased with both the measurement time window, potential scan rate, and the thickness of the coated surfactant film. This blockage of the mass transfer of the solution species was not complete, probably because the R ~ ( b p y ) ~ ( b p y - CI9),+ monolayer deposited under pressure relaxed when it was transferred into an electrolyte solution. In this relaxed form, the Ru(bpy),(bpy-C19)2+ surfactant molecules were spaced relatively far apart from each other with their average separation distances in accordance with the limiting molecular area. Since the hy- drocarbon chains of the surfactant could not be held rigid at this separation distance, they would allow the penetration of the so- lution species that are not significantly larger than the Ru(bpy)?+ head group. Film defects created prior to or during the elec- trochemical measurements due to the relative instability of a L-B layer must also contribute to the observed penetration of the solution species through the monolayer films. The suppression in the CV peak current observed at R~(bpy)~(bpy-C,~)~+-coated electrodes were of about the same magnitude for both Os(bpy),2+
0 . 6 1 , I ' I . n . t . T . I 0.0 0 .2 0 .4 0.6 0.8 1 .0 1 . 2
" 1 / 2 ( V 1 1 2 / s 1 1 2 )
1.0 I
b 0.91 b!=y---..-----
0.0 0 .2 0.4 0.6 0.8 1 . 0 1 .2
" 1 / 2 ( V 1 1 2 / ,112)
Figure 8. The ratios between the CV anodic peak currents of the solution species, 0.2 mM Os(bpy)?+ (a) and 0.5 mM Fe(CN)6e (b) in 0.5 M Na2S04 aqueous solution (pH 4), at the bare IT0 electrode, e',,, and those at the R~(bpy)~(bpy-C,~)~'-covered electrode, ip,, as a function of the square root of scan rate, u ' / ~ . The electrode was coated with the surfactant monolayer (X), bilayer (+), and trilayer (u), respectively, by the VD method at 30 dyn/cm.
and Fe(CN)t- species, indicating the blocking effect of the Ru- (bpy)2(bpy-C19)2+ surfactant film on the mass transfer of the solution species was not very sensitive to the charges carried by the solution species.
Conclusions CV measurements in a Langmuir trough using the method of
horizontal touching of a spread monolayer film yielded data showing that instead of distributing homogeneously on the water surface as in a gaseous state, the spread surfactant molecules a t low (submonolayer) surface concentrations tend to form larger aggregates. Through a comparison of the CV results obtained in the VD experiment with those of the H T experiment, the compressed surfactant molecules deposited on the electrode surface at a relatively high pressure were shown to undergo a relaxation process toward the limiting molecular area of the surfactant's head group when the monolayer-coated electrode was immersed in an electrolyte solution. The relaxation of the compressed layer re- sulted in a decrease in the surface coverage of the surfactant molecules on the electrode, which was likely responsible for the

J . Am. Chem. SOC. 1989, 1 1 1 , 8105-8111 8105
observed incompleteness in the electrochemical recovery of the deposited molecules. Cyclic voltammetry done with multilayer- covered electrodes in the HT experiments suggests that the electron transfer from the additional R ~ ( b p y ) , ~ + head-group layers to the electrode surface across a single hydrocarbon chain may be possible but becomes slower as the number of the deposited layers are increased. The CV results obtained, however, did not exclude the possibility that the electron transfer from the R~(bpy),(bpy-C,g)~+ head-group layer to the electrode and between the separated redox layers occurs via the mediation of molecular packing defects. The cyclic voltammetry performed in-trough by the H T method was
also shown useful in diagnosing the physical and chemical changes of the spread surfactant molecules that occurred while they were being manipulated on trough. The monolayer coatings of Ru- (bpy)2(bpy-C,9)2+ at the electrode were found to have a partial blocking effect on the mass transfer of the solution species. The blocking was more significant at higher scan rates and with thicker surfactant layers and it was not very sensitive to the charges carried by the solution species.
Acknowledgment. The support of this research by the Robert A. Welch Foundation (F-079) is gratefully acknowledged.
A Theoretical Study of Models for X2Y2 Zintl Ions
Robert J. Cave,+ Ernest R . Davidson,*Vt Philippe Sautet,$ Enric Canadell,$ and Odile Eisenstein*,*
Contribution from the Department of Chemistry, Indiana Uniuersity, Bloomington, Indiana 47405, and the Laboratoire de Chimie Thtorique,g Britiment 490, Centre de Paris-Sud, 91405 Orsay, France. Received February 23, 1989
Abstract: Ab initio and extended Hiickel calculations have been used to discuss the bonding scheme in X2Y2 neutral and ionic main group clusters. A qualitative analysis suggests that two different electron counts, 20 and 22, are possible for the butterfly structures of these systems. This results from two orbital crossings in the correlation diagram for the tetrahedral ( Td) - butterfly (C2J - square-planar (D2h) transformation. Detailed ab initio computations substantiate this analysis and show that the 20-electron butterfly structure becomes increasingly favored over the tetrahedral one in X2Y2 clusters when the 2 atoms have increasing electronegativity difference. These results are in agreement with the known structures for the Pb2Sb22- and Sb2Bi2- clusters (tetrahedral-like) and the T12Te22- one (butterfly-like).
I . Introduction There has been continuous interest in understanding the ge-
ometry of clusters. Electron-counting rules known as the skeletal electron pair rules (SEP rules), introduced by Wade’ and Mingos,2 have been a major tool in that field, since they relate, in a simple fashion, the number of electrons in the cluster to its geometry. Originally designed to account for the structures of boranes, carboranes, and metal carbonyl clusters, where the rules have met almost total success, numerous extensions to other clusters, where the chemical nature of the vertices is different, have been possible. Extensions of the rules have also dealt with fused cluster^.^ This wide success finds its support in the isolobal a n a l ~ g y , ~ according to which specific organic and organometallic groups may be found indifferently as vertices of isostructural clusters. However, with the increasing number of synthesized clusters, exceptions have also appeared, and while these exceptions cast no doubt on the importance of the SEP rules, they clearly indicate that a range of limited validity should be considered. We have thus undertaken a theoretical study of isoelectronic clusters that either agree or disagree with predictions of the SEP rules in order to pin down the reasons for the possible breakdown of these rules in four vertex clusters.
Zintl anions5 provide an excellent target for such a study since some small main group clusters are amenable to high-level cal- culations as well as to qualitative bonding analysis. Our choice went to the tetratomic Zintl anions X2Y,2- with a total number of 20 electrons. The SEP rules suggest that a tetranuclear cluster with a total number of 20 electrons should be tetrahedral (P4 for instance). This is a nido cluster according to the terminology of
*Authors to whom correspondence should be addressed. ‘Indiana University. ‘Laboratoire de Chimie Thtorique. *Associated with the CNRS (UA 506) and is a member of the Institut de
Chimie Moltculaire d’Orsay and Institute de Physico-Chimie Moltculaire.
Wade and Mingos. This is in fact the case for6*’ Pb2Sb22- and Sn2Bi22- but not for8 TI2Te2”, which takes a butterfly shape with Te at the wing tip, TI at the back bone, and a large angle between the two wings.g
The present calculations were undertaken to obtain qualitative and semiquantitative information regarding these ions. A series of neutral and anionic model compounds of the form X2Y2 have been examined to assess whether any underlying trends can be observed in the structures or energetics of these molecules, based on the results of ab initio and extended Hiickel calculations. Other theoretical studies have appeared for the “Zintl” ions and systems similar to and the relationship of the electronegativity difference between the atoms in the molecule and the molecular geometry has also been explored with relativistic extended Hiickel
(1) Wade, K. J . Chem. Soc., Chem. Commun. 1971,792. Wade, K. Ado. Inorg. Chem. Radiochem. 1976, 18, 1.
(2) Mingos, D. M. P. Nature 1972, 236, 99. Mingos, D. M. P. Ace. Chem. Res. 1984, 17, 3 1 1 . Mingos, D. M. P.; Johnston, R. L. Strucf. Bonding (Berlin) 1987, 68, 29.
(3 ) Mingos, D. M. P. J . Chem. Soc., Chem. Commun. 1983, 706. (4) Hoffmann, R. Angew. Chem., Int. Ed. Engl. 1982, 21, 71 1. (5) Schafer, H.; Eisenmann, B.; Muller, V. Angew. Chem., Int. Ed. Engl.
( 6 ) Critchlow, S. C.; Corbett, J. D. Inorg. Chem. 1985, 24, 979. (7) Critchlow, S. C.; Corbett, J. D. Inorg. Chem. 1982, 21, 3286. (8) Burns, R. C.; Corbett, J . D. J . Am. Chem. SOC. 1981, 103, 2627. (9) For a complete survey, see: Corbett, J. D. Chem. Reo. 1985, 85, 383. (10) Rothman, M. J.; Bartell, L. S.; Ewig, C. S.; Van Wazer, J. R. J .
(11 ) Rothman, M. J.; Bartell, L. S.; Lohr, L. L., Jr. J . Am. Chem. SOC.
(12) Lohr, L. L., Jr. Inorg. Chem. 1981, 20, 4229. ( 1 3 ) Savin, A,; Vogel, K.; Preuss, H.; Stoll, H.; Nesper, R. von Schnering,
(14) Axe, F. U.; Marynick, D. S. Inorg. Chem. 1988, 27, 1426. (15) Lohr, L. L., Jr. Inr . J . Quantum Chem. 1984, 25, 211.
1973, 12, 694.
Compuf. Chem. 1980, I , 64.
1981, 103, 2482.
H.-G. J . Am. Chem. Soc. 1988, 110, 373.
0002-7863/89/1511-8105$01.50/0 0 1989 American Chemical Society