Embed Size (px)
Citation preview

1
ABET Preparation Handout #3
Yale Method for Program Assessment of Student Outcomes Achievement
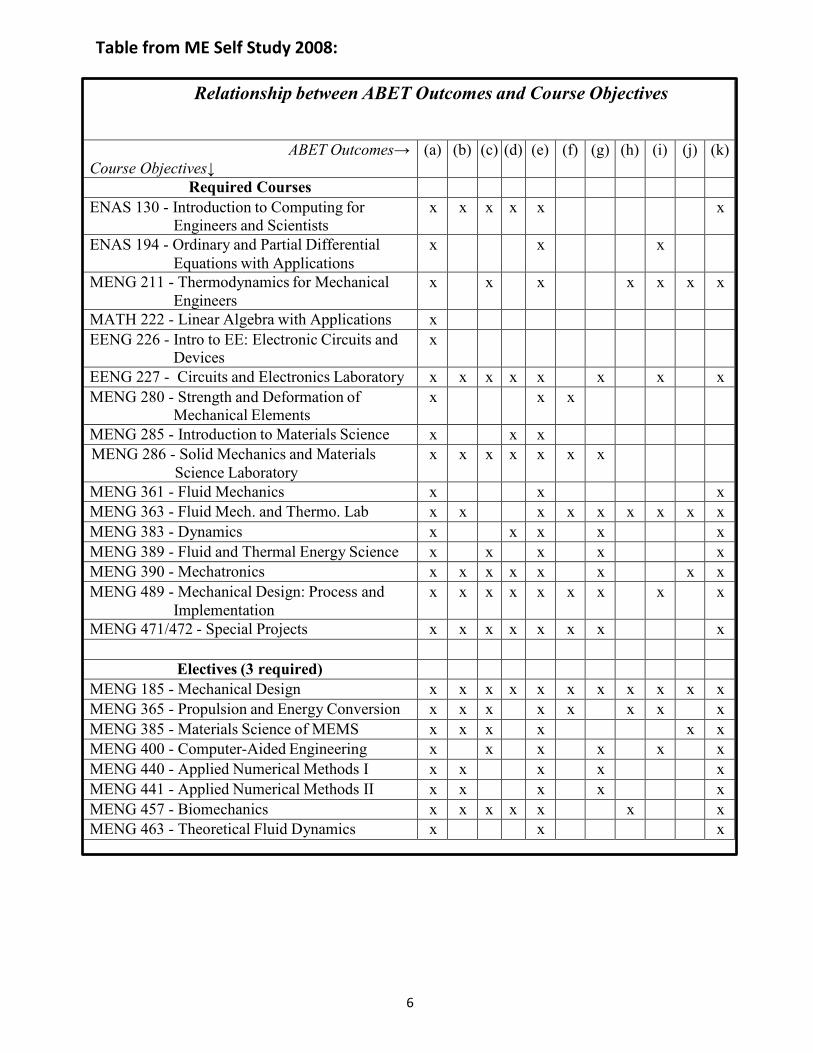
1. Establish which courses contribute to specific outcomes. See table from ME Self-Study 2008 on page 6 of this handout as an example.
2. Assign relevant graded activities (HW, projects, exams) in each course to each outcome.
3. Establish contribution of that course to each outcome.*
4. Quantify the levels of performance in a specific course for each outcome: (Unsatisfactory/Acceptable/Exemplary). *
5. Calculate the “Total Course Credits” in the major for each outcome (summation of item 3 above for all courses listed in item 1).**
* These calculations are automatically determined using the “STUDENT OUTCOMES ASSESSMENT SPREADSHEET” ** The 2019/2020 Self Study will use the new Outcomes (labeled 1-7) in the assessment
This guide is provided to the DUS to explain the comprehensive method to assess how the Student Outcomes are achieved within a SEAS program.
“STU
DEN
T O
UTC
OM
ES
ASSE
SSM
ENT
SPRE
ADSH
EET”
FO
R EA
CH C
OU
RSE
2
6. Calculate the overall levels of performance (Unsatisfactory/Acceptable/Exemplary) for each outcome for the entire program (average of item 4 for all courses listed in item 1).
7. As a Program, review the results of steps 5 and 6 to make needed improvements documenting your changes in the Self-Study.
8. Document changes to the program courses and assignments/projects/exams (perhaps using any previously established performance criteria detailed in previous Self-Studies).
Outcome “1”
Course ABC (and embedded
assessment methods)
Course ABC Improvements
Student Outcome
Assessments results
x % Unsatisfactory
y % Acceptable
z % Exemplary
3
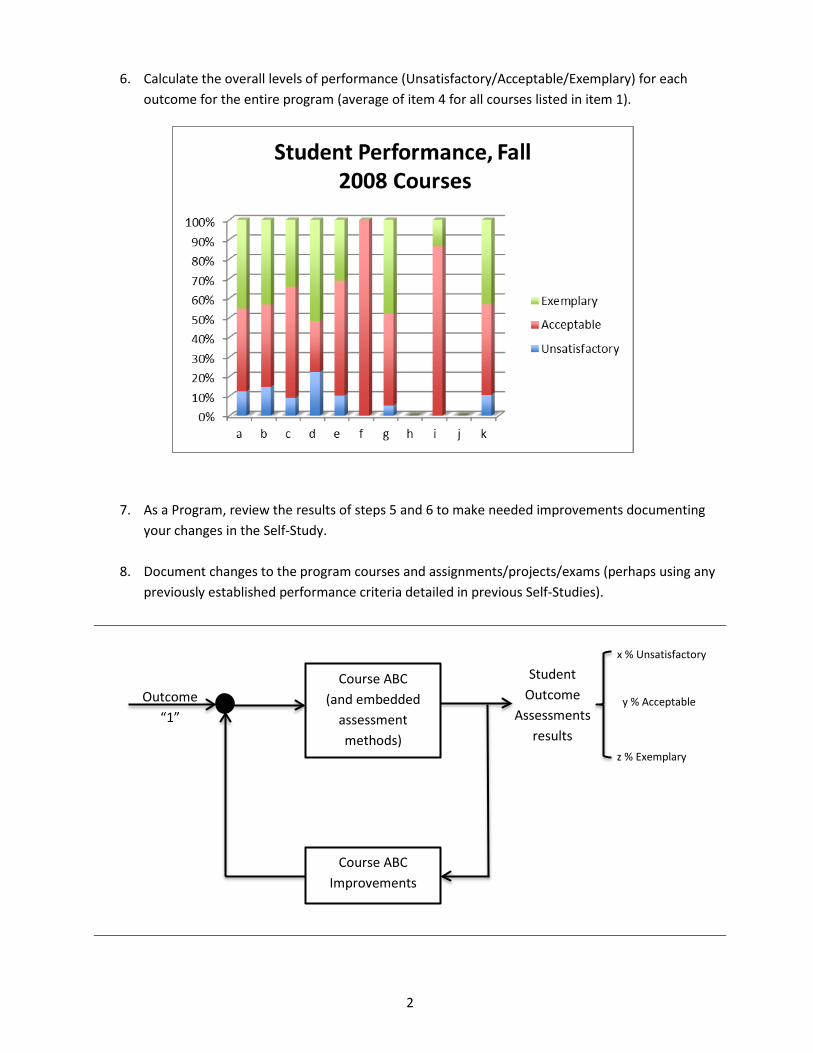
PROGRAM OUTCOMES ASSESSMENT SPREADSHEET ANALYSIS
The spreadsheet details the relationship between assignments associated with outcomes and
determines the level of achievement of outcomes for a single course in a program.
1. Use your normal grading system for the class with the Student Outcomes Assessment Spreadsheet.
2. Assign a fractional component of the outcomes associated with this particular course to each relevant
graded exercise.
3. These fractional components determine the percentage of the course devoted to each outcome.
Example: The percentage of outcome 1 (assessed) in this course =
(𝐻𝐻𝐻𝐻1 𝑓𝑓𝑓𝑓𝑓𝑓𝑓𝑓𝑓𝑓𝑓𝑓)(𝑤𝑤𝑓𝑓.𝑓𝑓𝑓𝑓𝑓𝑓𝑓𝑓𝑓𝑓𝑓𝑓 𝐻𝐻𝐻𝐻1)+(𝐻𝐻𝐻𝐻7 𝑓𝑓𝑓𝑓𝑓𝑓𝑓𝑓𝑓𝑓𝑓𝑓)(𝑤𝑤𝑓𝑓.𝑓𝑓𝑓𝑓𝑓𝑓𝑓𝑓𝑓𝑓𝑓𝑓 𝐻𝐻𝐻𝐻7)+(𝐻𝐻𝐻𝐻11 𝑓𝑓𝑓𝑓𝑓𝑓𝑓𝑓𝑓𝑓𝑓𝑓)(𝑤𝑤𝑓𝑓.𝑓𝑓𝑓𝑓𝑓𝑓𝑓𝑓𝑓𝑓𝑓𝑓 𝐻𝐻𝐻𝐻11)𝑇𝑇𝑓𝑓𝑓𝑓𝑓𝑓𝑇𝑇 𝑓𝑓𝑓𝑓 𝑤𝑤𝑓𝑓.𝑓𝑓𝑓𝑓𝑓𝑓𝑓𝑓𝑓𝑓𝑓𝑓𝑓𝑓
= (0.5)(1)+(0.5)(1)+(0.5)(1)14.5
= 10.3%

4
4. Establish numerical threshold for Unsatisfactory/ Acceptable/ Exemplary performance in this course.
5. The number of students in each performance category is calculated by the spreadsheet for each graded assignment/exam.
6. A summary of the class performance in each relevant outcome is calculated by the spreadsheet based on scores in the relevant assignments as:
Overall Result - Unsatisfactory Performance for Outcome 1 =
∑(#𝑢𝑢𝑢𝑢𝑢𝑢𝑢𝑢𝑢𝑢 𝑢𝑢𝑢𝑢𝑢𝑢𝑠𝑠𝑠𝑠𝑢𝑢𝑢𝑢𝑢𝑢 𝑖𝑖𝑢𝑢 𝑠𝑠𝑢𝑢. 𝑟𝑟𝑠𝑠𝑟𝑟𝑠𝑠𝑟𝑟𝑢𝑢𝑢𝑢𝑢𝑢 𝑢𝑢𝑢𝑢𝑢𝑢𝑖𝑖𝑎𝑎)(𝑓𝑓𝑟𝑟𝑢𝑢𝑐𝑐𝑢𝑢. 𝑐𝑐𝑐𝑐𝑐𝑐𝑐𝑐𝑐𝑐𝑢𝑢𝑠𝑠𝑢𝑢𝑢𝑢 𝑐𝑐𝑓𝑓 𝑢𝑢ℎ𝑖𝑖𝑢𝑢 𝑢𝑢𝑢𝑢𝑢𝑢𝑖𝑖𝑎𝑎. 𝑐𝑐𝑓𝑓 𝑢𝑢ℎ𝑖𝑖𝑢𝑢 𝑐𝑐𝑢𝑢𝑢𝑢𝑐𝑐𝑐𝑐𝑐𝑐𝑠𝑠)(𝑤𝑤𝑢𝑢 𝑓𝑓𝑢𝑢𝑐𝑐𝑢𝑢𝑐𝑐𝑟𝑟 𝑐𝑐𝑓𝑓 𝑢𝑢ℎ𝑠𝑠 𝑟𝑟𝑠𝑠𝑟𝑟𝑠𝑠𝑟𝑟𝑢𝑢𝑢𝑢𝑢𝑢 𝑢𝑢𝑢𝑢𝑢𝑢𝑖𝑖𝑎𝑎)
(𝑢𝑢𝑐𝑐𝑢𝑢𝑢𝑢𝑟𝑟 # 𝑢𝑢𝑢𝑢𝑢𝑢𝑠𝑠𝑠𝑠𝑢𝑢𝑢𝑢𝑢𝑢)(% 𝑐𝑐𝑓𝑓 𝑐𝑐𝑢𝑢𝑢𝑢𝑐𝑐𝑐𝑐𝑐𝑐𝑠𝑠 𝑖𝑖𝑢𝑢 𝑢𝑢ℎ𝑠𝑠 𝑐𝑐𝑐𝑐𝑢𝑢𝑟𝑟𝑢𝑢𝑠𝑠)(𝑢𝑢𝑐𝑐𝑢𝑢𝑢𝑢𝑟𝑟 𝑤𝑤𝑠𝑠𝑖𝑖𝑎𝑎ℎ𝑖𝑖𝑢𝑢𝑎𝑎 𝑓𝑓𝑢𝑢𝑐𝑐𝑢𝑢𝑐𝑐𝑟𝑟)
= (4)(0.5)(1)+(2)(0.5)(1)+(1)(0.5)(1)(12)(0.103)(14.5)
= 19%
7. The spreadsheet quantifies the levels of performance for each outcome in the course:
Cutoff Percentages80 Unsatisfactory95 Exemplary
Descriptive Title of HW [100]
Descriptive Title of HW [100]
Descriptive Title of HW [100]
Descriptive Title of HW [100]
Descriptive Title of HW [100]
Descriptive Title of HW [100]
Descriptive Title of HW [100]
Descriptive Title of HW [150]
Descriptive Title of HW [100]
Descriptive Title of HW [100]
Descriptive Title of HW [100]
FINAL EXAM [300]
0 0 0 0 4 0 2 1 0 2 1 07 8 6 8 6 8 9 10 9 6 6 95 4 6 4 2 4 1 1 3 4 5 3
UnsatisfactoryAcceptableExemplary
Breakdown of Student Performance by Assignment
*Each column should add up to the number of students in the course.
Please enter performance cutoff percentages below. These are the numbers that determine the cutoff between Unsatisfactory, Acceptable, and Exemplary.
5
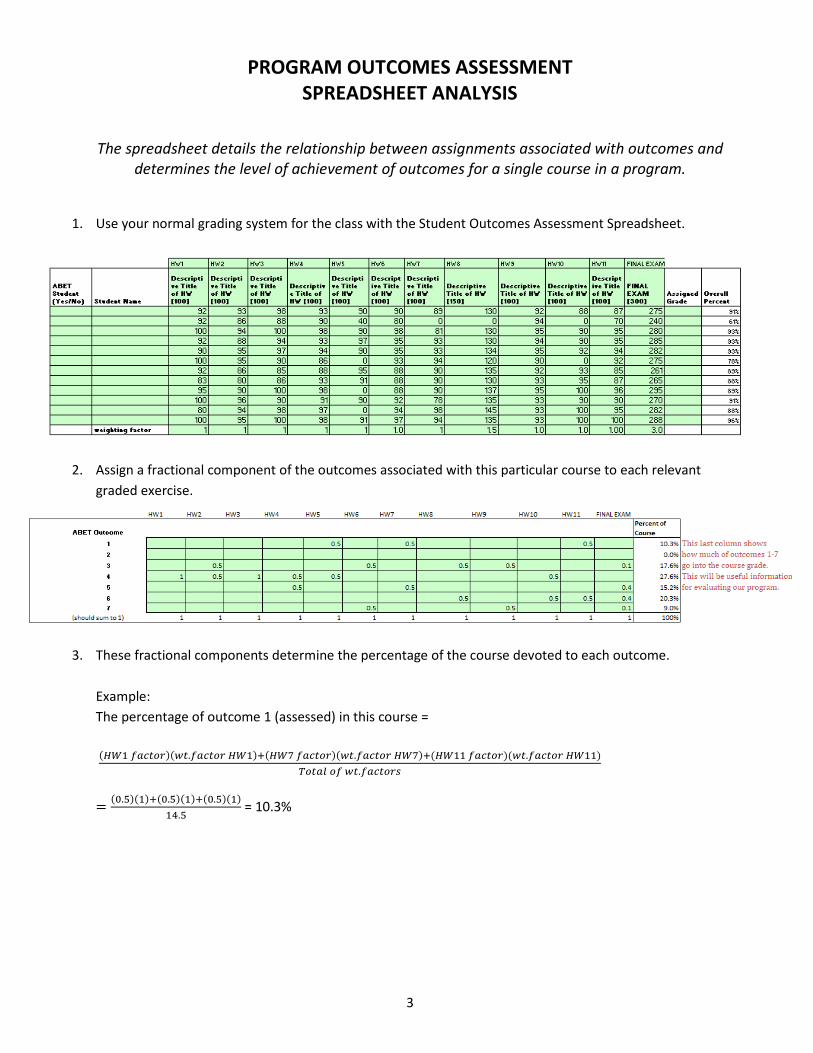
Other Student Outcome Assessment tools:
1. Performance Criteria & Rubrics can serve as (established for previous ABET Reviews) a detailed explanation of evaluation and potential improvements.
2. Student Outcomes questions in the Online Course Evaluation can also be included. 3. Feedback from external visitors on specific outcomes in Capstone Projects.
“ME 2008 Response (partial) to ABET Draft Statement”
6
Relationship between ABET Outcomes and Course Objectives
ABET Outcomes→ Course Objectives↓
(a) (b) (c) (d) (e) (f) (g) (h) (i) (j) (k)
Required Courses ENAS 130 - Introduction to Computing for
Engineers and Scientists x x x x x x
ENAS 194 - Ordinary and Partial Differential Equations with Applications
x x x
MENG 211 - Thermodynamics for Mechanical Engineers
x x x x x x x
MATH 222 - Linear Algebra with Applications x EENG 226 - Intro to EE: Electronic Circuits and
Devices x
EENG 227 - Circuits and Electronics Laboratory x x x x x x x x MENG 280 - Strength and Deformation of
Mechanical Elements x x x
MENG 285 - Introduction to Materials Science x x x MENG 286 - Solid Mechanics and Materials
Science Laboratory x x x x x x x
MENG 361 - Fluid Mechanics x x x MENG 363 - Fluid Mech. and Thermo. Lab x x x x x x x x x MENG 383 - Dynamics x x x x x MENG 389 - Fluid and Thermal Energy Science x x x x x MENG 390 - Mechatronics x x x x x x x x MENG 489 - Mechanical Design: Process and
Implementation x x x x x x x x x
MENG 471/472 - Special Projects x x x x x x x x
Electives (3 required) MENG 185 - Mechanical Design x x x x x x x x x x x MENG 365 - Propulsion and Energy Conversion x x x x x x x x MENG 385 - Materials Science of MEMS x x x x x x MENG 400 - Computer-Aided Engineering x x x x x x MENG 440 - Applied Numerical Methods I x x x x x MENG 441 - Applied Numerical Methods II x x x x x MENG 457 - Biomechanics x x x x x x x MENG 463 - Theoretical Fluid Dynamics x x x
Table from ME Self Study 2008:
7
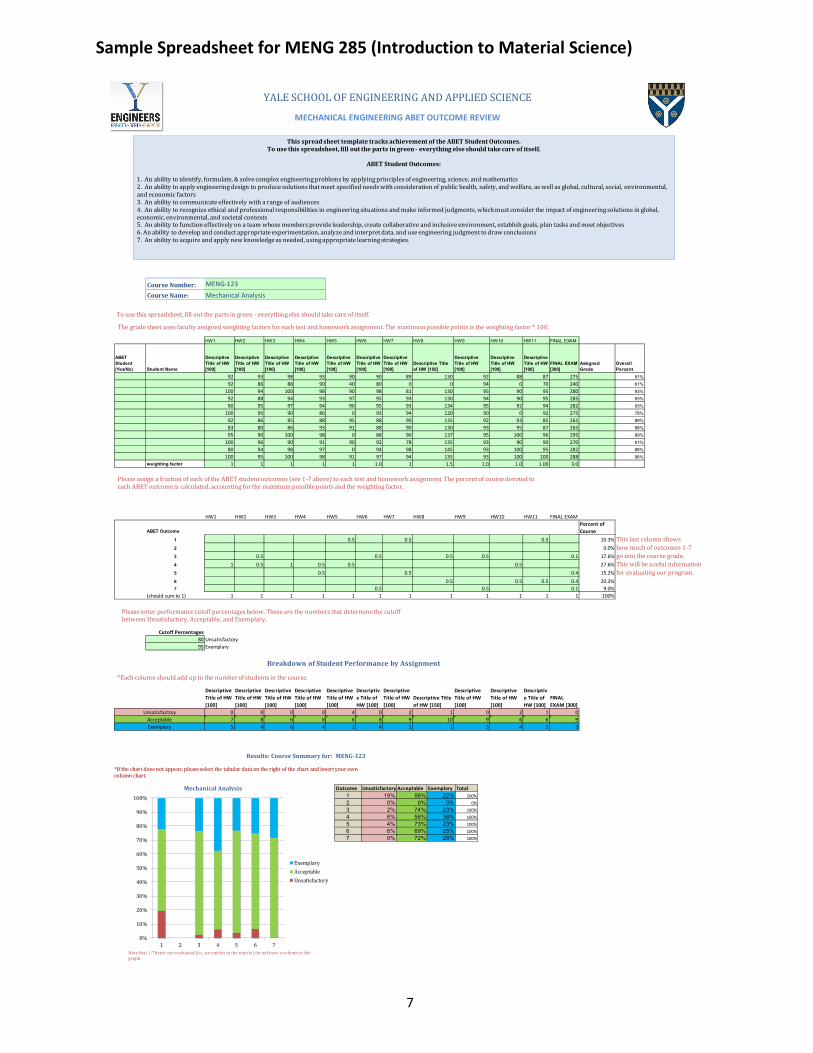
Sample Spreadsheet for MENG 285 (Introduction to Material Science)
YALE SCHOOL OF ENGINEERING AND APPLIED SCIENCE
MECHANICAL ENGINEERING ABET OUTCOME REVIEW
Course Number:Course Name:
HW1 HW2 HW3 HW4 HW5 HW6 HW7 HW8 HW9 HW10 HW11 FINAL EXAM
ABET Student (Yes/No) Student Name
Descriptive Title of HW [100]
Descriptive Title of HW [100]
Descriptive Title of HW [100]
Descriptive Title of HW [100]
Descriptive Title of HW [100]
Descriptive Title of HW [100]
Descriptive Title of HW [100]
Descriptive Title of HW [150]
Descriptive Title of HW [100]
Descriptive Title of HW [100]
Descriptive Title of HW [100]
FINAL EXAM [300]
Assigned Grade
Overall Percent
92 93 98 93 90 90 89 130 92 88 87 275 91%92 86 88 90 40 80 0 0 94 0 70 240 61%
100 94 100 98 90 98 81 130 95 90 95 280 93%92 88 94 93 97 95 93 130 94 90 95 285 93%90 95 97 94 90 95 93 134 95 92 94 282 93%
100 95 90 86 0 93 94 120 90 0 92 275 78%92 86 85 88 95 88 90 135 92 93 85 261 89%83 80 86 93 91 88 90 130 93 95 87 265 88%95 90 100 98 0 88 90 137 95 100 96 295 89%
100 96 90 91 90 92 78 135 93 90 90 270 91%80 94 98 97 0 94 98 145 93 100 95 282 88%
100 95 100 98 91 97 94 135 93 100 100 288 96%weighting factor 1 1 1 1 1 1.0 1 1.5 1.0 1.0 1.00 3.0
HW1 HW2 HW3 HW4 HW5 HW6 HW7 HW8 HW9 HW10 HW11 FINAL EXAM
ABET Outcome Percent of Course
1 0.5 0.5 0.5 10.3% This last column shows 2 0.0% how much of outcomes 1-7 3 0.5 0.5 0.5 0.5 0.1 17.6% go into the course grade.4 1 0.5 1 0.5 0.5 0.5 27.6% This will be useful information5 0.5 0.5 0.4 15.2% for evaluating our program.6 0.5 0.5 0.5 0.4 20.3%7 0.5 0.5 0.1 9.0%
(should sum to 1) 1 1 1 1 1 1 1 1 1 1 1 1 100%
Cutoff Percentages80 Unsatisfactory95 Exemplary
Descriptive Title of HW [100]
Descriptive Title of HW [100]
Descriptive Title of HW [100]
Descriptive Title of HW [100]
Descriptive Title of HW [100]
Descriptive Title of HW [100]
Descriptive Title of HW [100]
Descriptive Title of HW [150]
Descriptive Title of HW [100]
Descriptive Title of HW [100]
Descriptive Title of HW [100]
FINAL EXAM [300]
0 0 0 0 4 0 2 1 0 2 1 07 8 6 8 6 8 9 10 9 6 6 95 4 6 4 2 4 1 1 3 4 5 3
UnsatisfactoryAcceptableExemplary
MENG-123Mechanical Analysis
The grade sheet uses faculty assigned weighting factors for each test and homework assignment. The maximum possible points is the weighting factor * 100.
Please assign a fraction of each of the ABET student outcomes (see 1-7 above) to each test and homework assignment. The percent of course devoted to each ABET outcome is calculated, accounting for the maximum possible points and the weighting factor.
Breakdown of Student Performance by Assignment
*Each column should add up to the number of students in the course.
Please enter performance cutoff percentages below. These are the numbers that determine the cutoff between Unsatisfactory, Acceptable, and Exemplary.
To use this spreadsheet, fill out the parts in green - everything else should take care of itself.
This spread sheet template tracks achievement of the ABET Student Outcomes. To use this spreadsheet, fill out the parts in green - everything else should take care of itself.
ABET Student Outcomes:
1. An ability to identify, formulate, & solve complex engineering problems by applying principles of engineering, science, and mathematics 2. An ability to apply engineering design to produce solutions that meet specified needs with consideration of public health, safety, and welfare, as well as global, cultural, social, environmental, and economic factors 3. An ability to communicate effectively with a range of audiences4. An ability to recognize ethical and professional responsibilities in engineering situations and make informed judgments, which must consider the impact of engineering solutions in global, economic, environmental, and societal contexts 5. An ability to function effectively on a team whose members provide leadership, create collaborative and inclusive environment, establish goals, plan tasks and meet objectives6. An ability to develop and conduct appropriate experimentation, analyze and interpret data, and use engineering judgment to draw conclusions7. An ability to acquire and apply new knowledge as needed, using appropriate learning strategies.
Results: Course Summary for: MENG-123
Mechanical Analysis Outcome Unsatisfactory Acceptable Exemplary Total 1 19% 58% 22% 100%2 0% 0% 0% 0%3 2% 74% 23% 100%4 6% 56% 38% 100%5 4% 73% 23% 100%6 6% 69% 25% 100%7 0% 72% 28% 100%
0%
10%
20%
30%
40%
50%
60%
70%
80%
90%
100%
1 2 3 4 5 6 7
ExemplaryAcceptableUnsatisfactory
*If the chart does not appear, please select the tabular data on the right of the chart and insert your own column chart. *If the chart does not appear, please select the tabular data on the right of the chart and insert your own column chart.
Note that 1-7items not evaluated (i.e., no entries in the matrix) do not have a column in the graph.

8
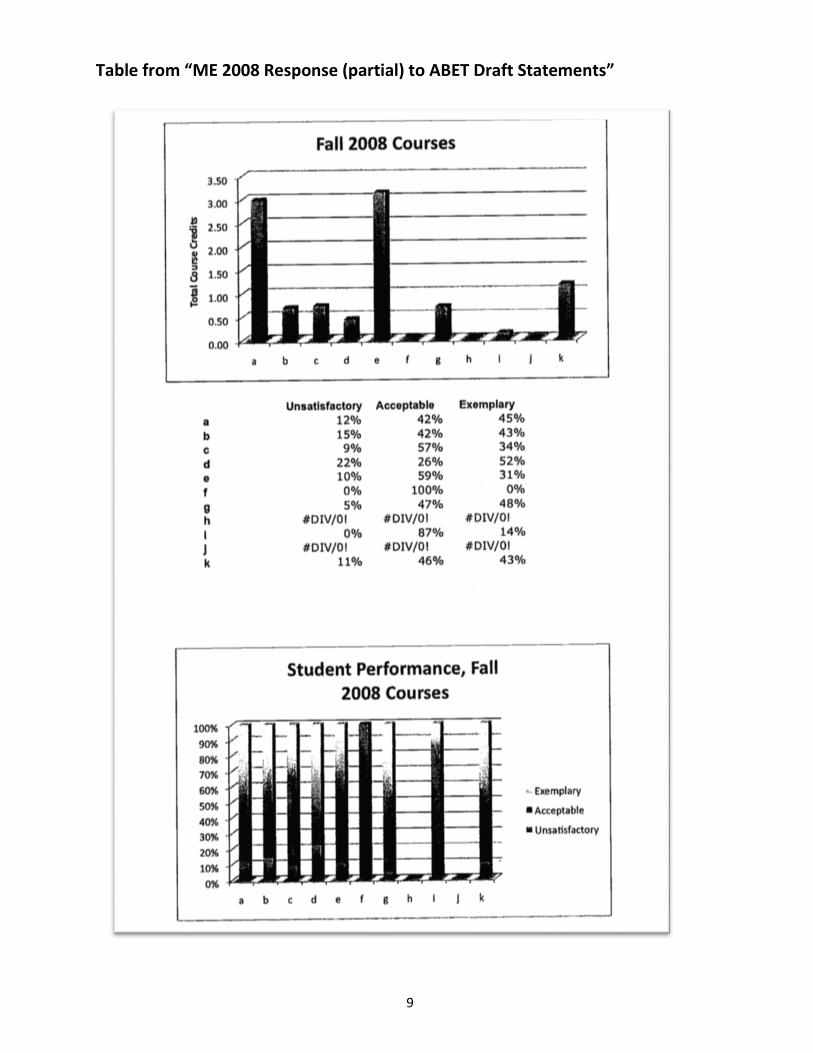
Table from “ME 2008 Response (partial) to ABET Draft Statements”
9
Table from “ME 2008 Response (partial) to ABET Draft Statements”