Embed Size (px)
Citation preview

Yale School of Management
Sharpening Sharpe Ratios
Will Goetzmann
Jonathan Ingersoll
Matthew Spiegel
Ivo Welch

Yale School of Management
Background
Sharpe Ratio Performance evaluation in practice. Asset pricing research.
Limitations Misleading when shape of distribution changes. Problematic in presence of derivatives.

Yale School of Management
Example
Perfect foresight timer btw. US. Stocks and U.S. bonds.
Sharpe 1926-2003 = 1Throwing all returns over 30%/year away
Sharpe 1926-2003 = 1.06Smoothing works even better.

Yale School of Management
Our Approach
What strategy maximizes Sharpe ratio? How much can it matter? Implications for risk-control.Dynamic strategies.Are there any measures that cannot be
manipulated?

Yale School of Management
Optimal Sharpe Ratio Distribution
Left-skewed.Fat-tailed.Very sensitive to small-sample.Hard to distinguish luck vs. skill.

Yale School of Management
Manipulation-Free Statistic
Exists only under specification of utility.Provides a method to test the efficacy of the
Sharpe ratio.Sharpe ratio does well under “normal”
conditions.New measure is useful under non-normal
conditions.
Yale School of Management
Hedge Fund Applications
Hedge funds unconstrained from dynamic and derivative strategies.
Hedge funds often evaluated by Sharpe Ratio. Absolute return benchmark: Libor or T-bills
Hedge funds seem prone to occasional, spectacular disasters.

Yale School of Management
Hedge Fund Strategies
Fung and Hsieh (1997) Brown and Goetzmann (1997)Agarawal and Naik (2001) Contract-related non-linearity
Yale School of Management

Yale School of Management
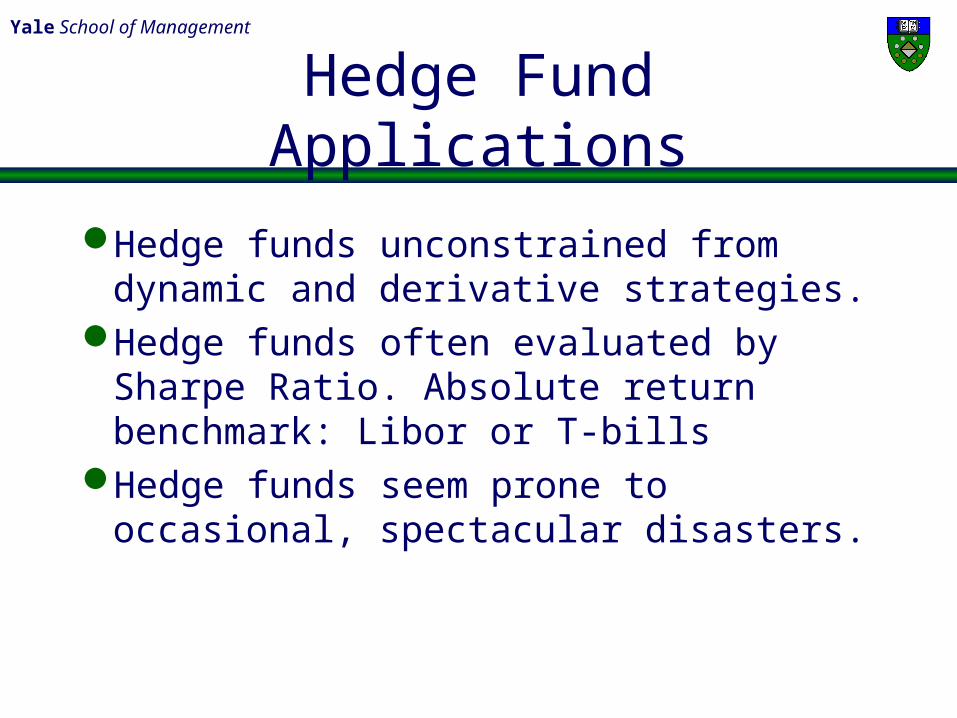
Art Institute vs. Integral
Integral boasted “The highest Sharpe Ratio in the business.”
Options-based strategy. Performance-based contract.Guaranteed 1% to 2% in flat or rising
markets.Losses possible only if stocks dropped
more than 30% (which they did).

Yale School of Management
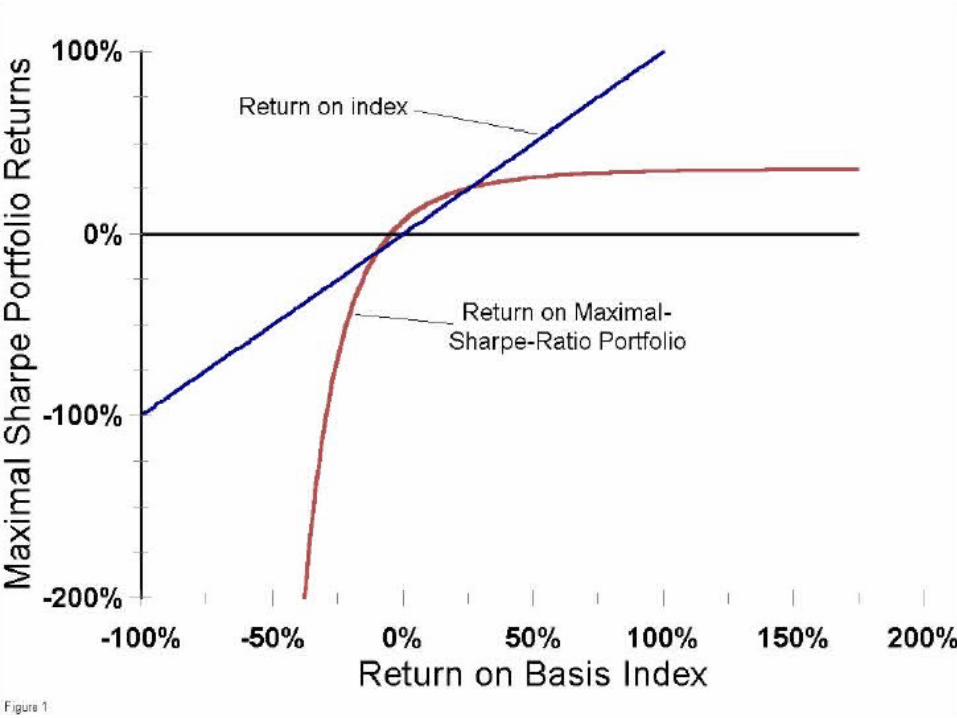
Maximal Sharpe Ratio in a Complete Market
MSR is linear in the likelihood ratio of the state price per unit probability.
Sell high-priced, low probability payoffs.Leverage does not change shape. Possible to nearly match it with a limited
liability portfolio. Any basis asset is possible.
Yale School of Management

Yale School of Management
Yale School of Management
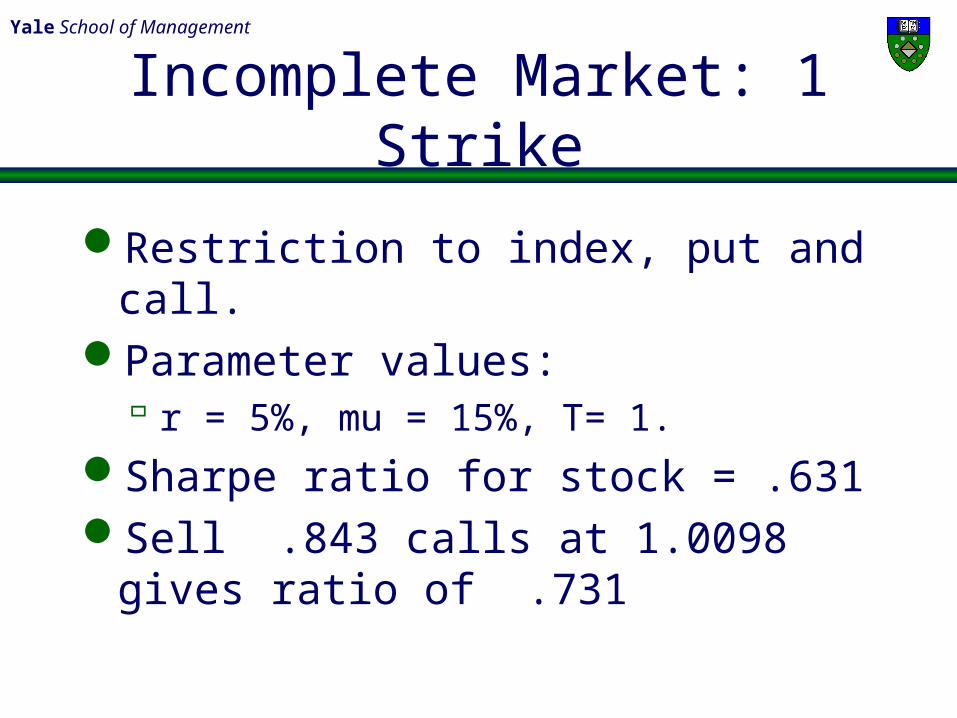
Incomplete Market: 1 Strike
Restriction to index, put and call.Parameter values:
r = 5%, mu = 15%, T= 1.
Sharpe ratio for stock = .631Sell .843 calls at 1.0098 gives ratio
of .731
Yale School of Management
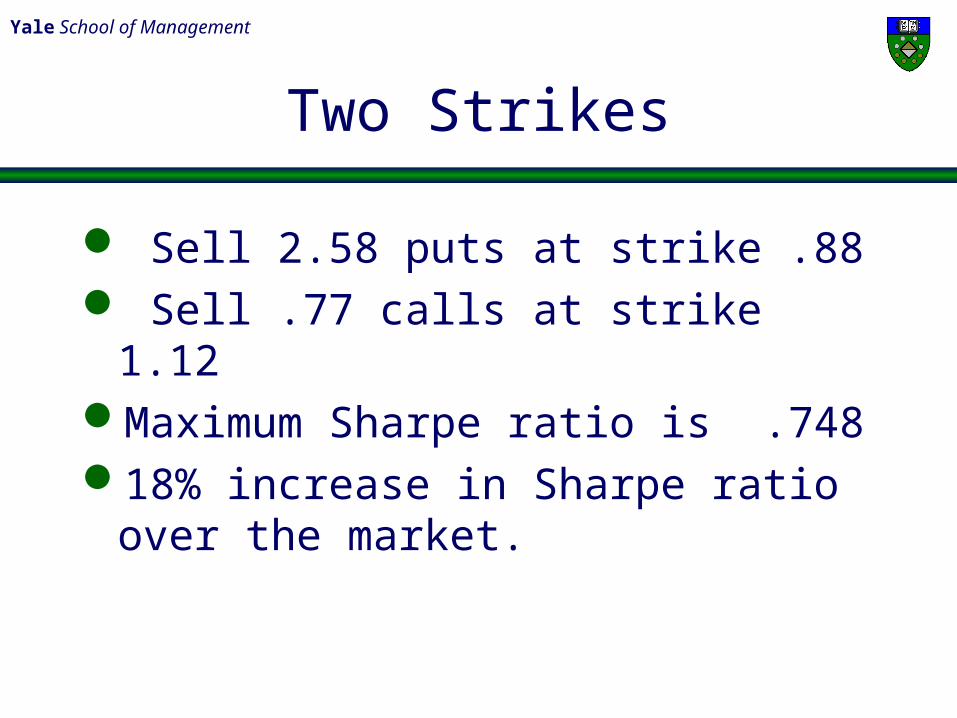
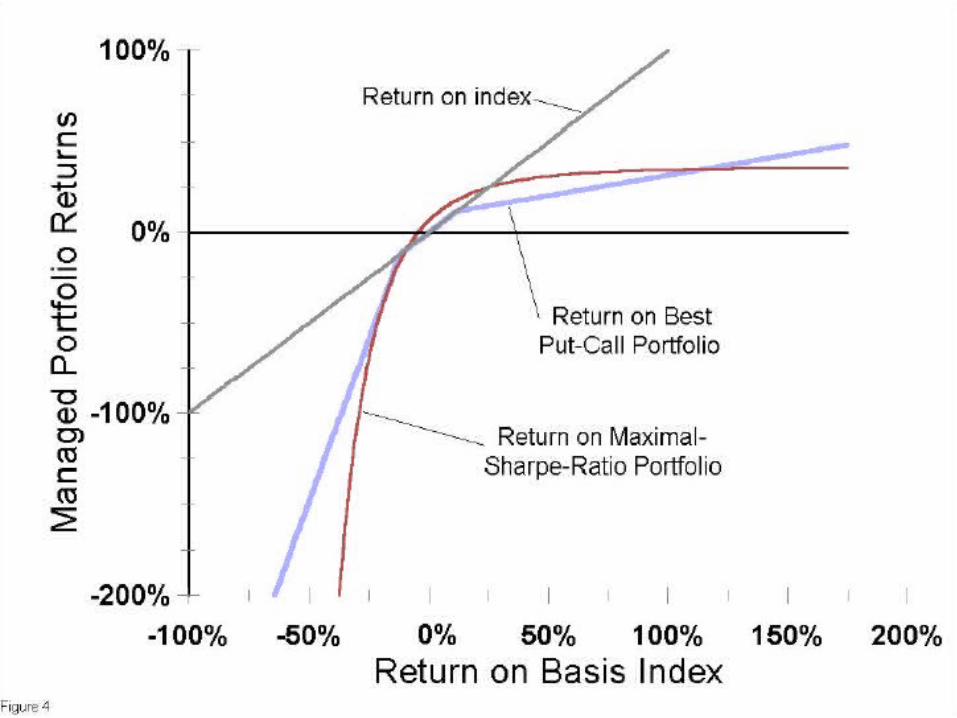
Two Strikes
Sell 2.58 puts at strike .88 Sell .77 calls at strike 1.12Maximum Sharpe ratio is .74818% increase in Sharpe ratio over the
market.
Yale School of Management

Yale School of Management
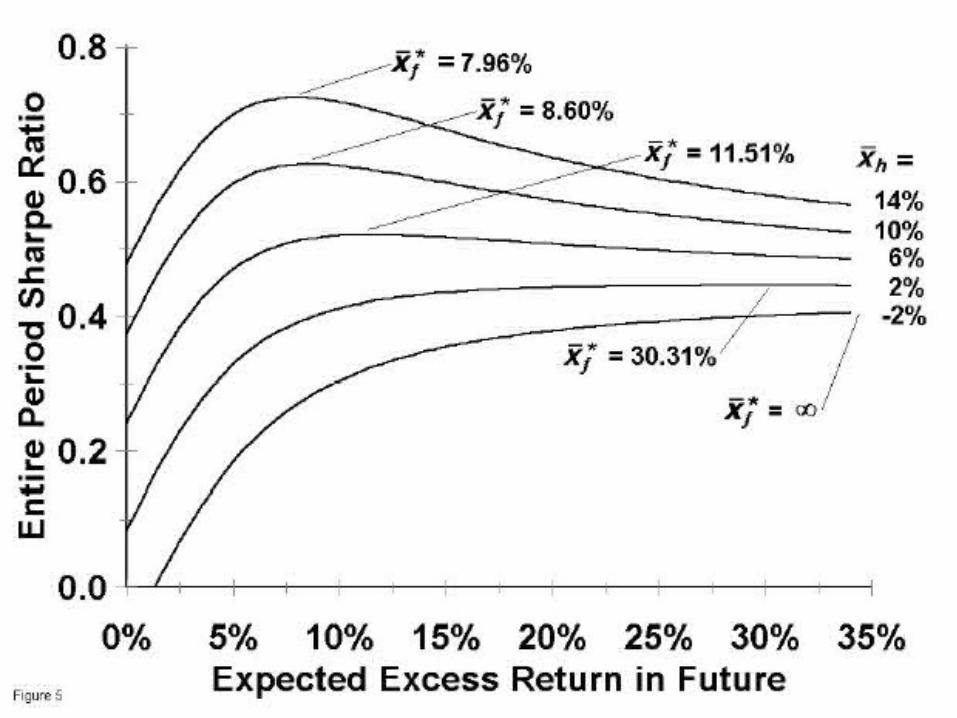
Dynamic Strategies
Conditioning on past performance. Brown, Harlow and Starks, Chevalier and
Ellison, Brown, Goetzmann and Park, Carpenter and others.
Result: poor performance implies increasing leverage.
Good performance, implies decreasing expected return towards market.

Yale School of Management
Intuition
Conditional return in the first period, you can minimized expected variance over the whole period by choosing an expected return equal to it.
Dynamic strategy is like static option strategy in that it moves state payoffs from one period to another to improve Sharpe ratio.
Yale School of Management
Yale School of Management
Yale School of Management
Manipulation-Free
Manipulation = rebalancing of the portfolio away from the benchmark even when there exists no informational reason to do so.

Yale School of Management
Requirements
Should provide a unique ranking of funds for a meaningful set of investors.
Should be “memoryless” – no dynamic strategy should allow improvement.
Implies time-separable, concave utility.Wealth-independent – power utility.Uninformed investor should hold market.
Implies a single risk aversion parameter.
Yale School of Management
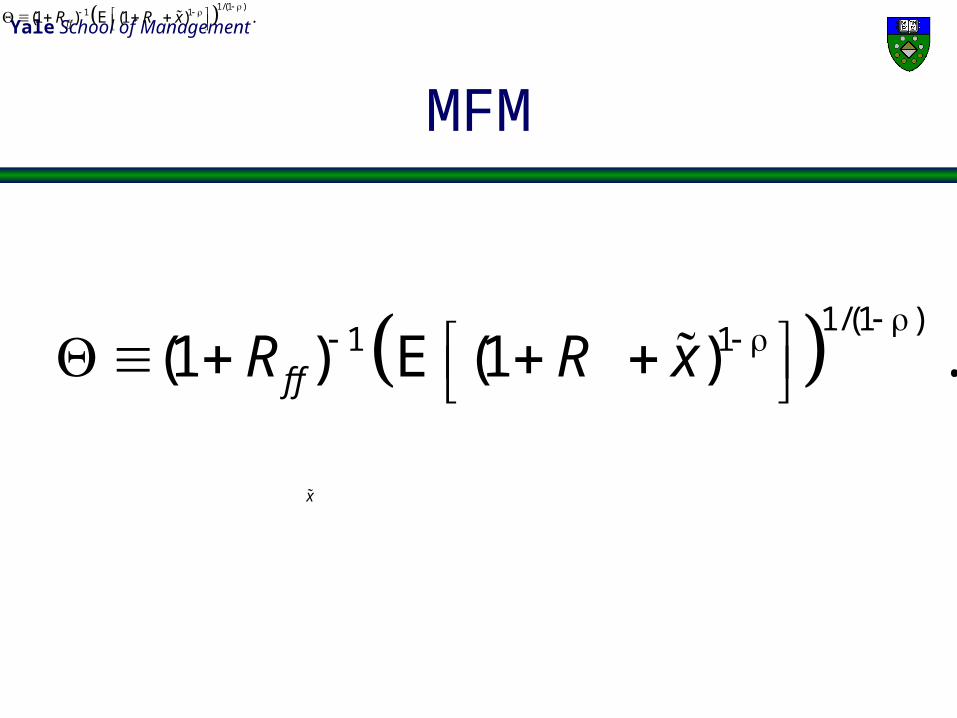
MFM
1/(1 )1 1(1 ) (1 ) .f fR R x
E
1/(1 )1 1(1 ) (1 ) .f fR R x
E
x

Yale School of Management
Risk-Aversion Parameter
Representative investor holds mkt:
= 0: Rank on Arithmetic Average = 1: Rank on Geometric Mean >2: Higher Risk Aversion
2( ) /m mr

Yale School of Management
Empirical Tests
A test of the Sharpe ratio.Equity mutual fund returns 1993 – 2003.Hedge fund returns 1992 – 2002.Examine rank correlations of Sharpe and
MFM.Does skewness affect ranking differences?Parameter and time-period sensitivity.
Yale School of Management
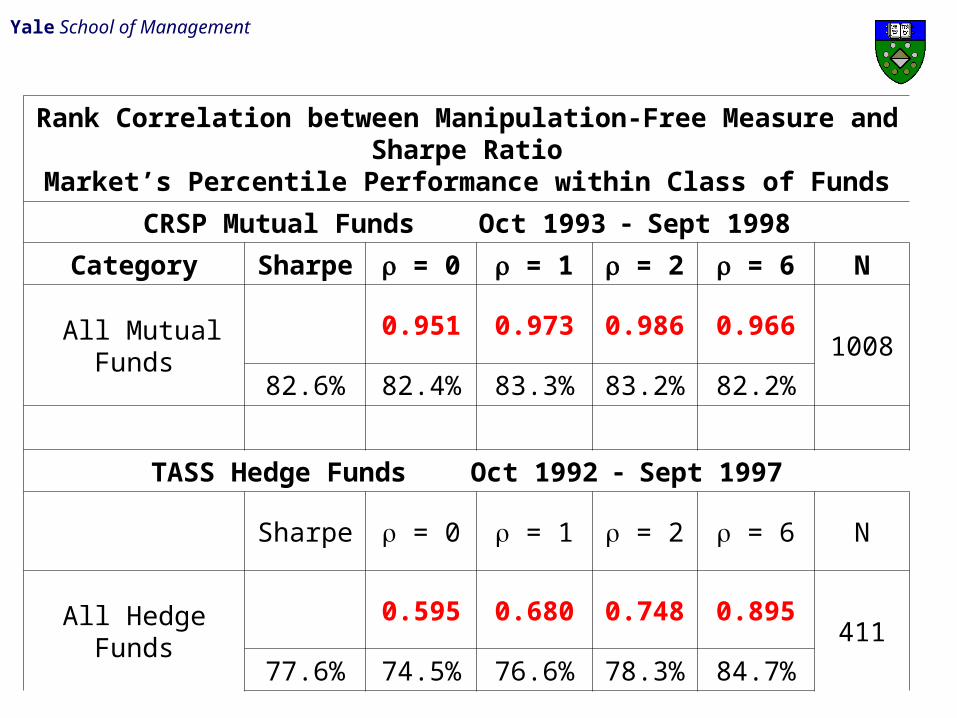
Rank Correlation between Manipulation-Free Measure and Sharpe RatioMarket’s Percentile Performance within Class of Funds
CRSP Mutual Funds Oct 1993 Sept 1998
Category Sharpe = 0 = 1 = 2 = 6 N
All Mutual Funds0.951 0.973 0.986 0.966
1008
82.6% 82.4% 83.3% 83.2% 82.2%
TASS Hedge Funds Oct 1992 Sept 1997
Sharpe = 0 = 1 = 2 = 6 N
All Hedge Funds0.595 0.680 0.748 0.895
411
77.6% 74.5% 76.6% 78.3% 84.7%

Yale School of Management
Rank Correlation between Manipulation-Free Measure and Sharpe RatioMarket’s Percentile Performance within Class of Funds
CRSP Mutual Funds Oct 1998 Sept 2003
Category Sharpe = 0 = 1 = 2 = 6 N
All Mutual Funds0.981 0.962 0.886 0.552
3248
42.7% 42.5% 45.8% 49.5% 55.7%
TASS Hedge Funds Oct 1997 Sept 2002
Sharpe = 0 = 1 = 2 = 6 N
All Hedge Funds0.765 0.848 0.881 0.856
799
9.3% 8.8% 10.5% 13.5% 18.4%
Yale School of Management
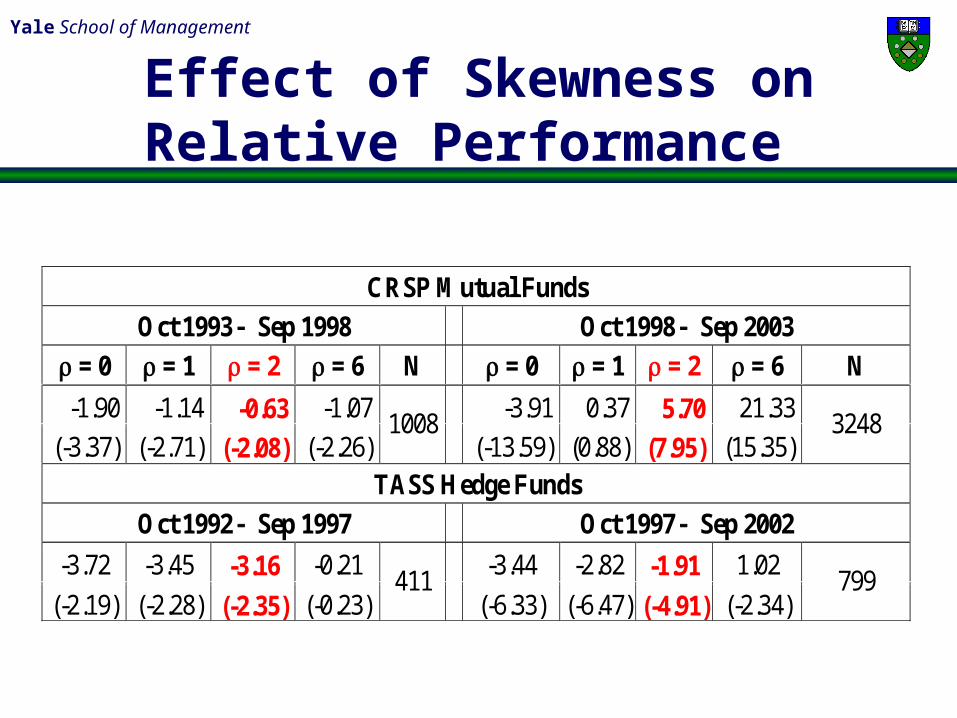
CRSP Mutual Funds
Oct 1993 Sep 1998 Oct 1998 Sep 2003
= 0 = 1 = 2 = 6 N = 0 = 1 = 2 = 6 N
-1.90 -1.14 -0.63 -1.07 -3.91 0.37 5.70 21.33
(-3.37) (-2.71) (-2.08) (-2.26) 1008
(-13.59) (0.88) (7.95) (15.35) 3248
TASS Hedge Funds
Oct 1992 Sep 1997 Oct 1997 Sep 2002
-3.72 -3.45 -3.16 -0.21 -3.44 -2.82 -1.91 1.02
(-2.19) (-2.28) (-2.35) (-0.23) 411
(-6.33) (-6.47) (-4.91) (-2.34) 799
Effect of Skewness on Relative Performance
Yale School of Management
Conclusions
Maximal Sharpe Ratio is a mirrored log-normal.Optimal strategies sell out of money option in
asymmetric proportion.Dynamic strategies also possible.Manipulation free measure proposed.Sharpe ratio tested, and works well normally.Negative skewness in hedge funds associated with
Sharpe ratio rank improvement.