Embed Size (px)
Citation preview

Share Data
Bloomberg Symbol YACCO AB
Reuters Symbol 3020.SE
Market Cap (SR) 9,078,750,000
Number of Shares 135,000,000
Free Float 78%
Price to 2010 Earnings 13.81
Price to 2010 Book Value 2.49
Share Performance
Source: Reuters
10.7% 1 Month Return 8.0% 3 Month Return 33.2% 6 Month Return 28.1% 12 Month Return 44.10 – 67.25 52 Week Range
Source: Reuters
Initiating with an Accumulate Recommendation and a Fair Value of SR 74 per share based on the channels of analysis below
Earnings growth outlook suggests stock is undervalued We value Yamama at SR 74 per share using a discounted cash flow model with a 12.7% discount rate and a 2,5% terminal growth rate. An Accumulate recommendation is issued taking into consideration the earnings’ growth outlook. This is further supported when considering that Yamama is undervalued relative to peers since it trades at a much lower P/E of 13, compared to 15.1 for other Saudi companies.
Performance and Forecasts
Year 2010 2011e 2012f 2013f 2014f 2015f
Revenues (SR M) 1,272 1,467 1,680 1,869 2,003 2,114
Net Income (SR M) 657 762 869 954 1,023 1,073
EPS (SR) 4.87 5.64 6.43 7.07 7.58 7.95
BVPS (SR) 27.1 27.0 27.4 27.8 28.0 28.2
ROA (%) 17.9 20.9 23.7 25.6 27.2 28.3
ROE (%) 21.1 24.1 27.9 31.2 33.4 34.9
Source: Blominvest, Yamama Cement
Contact information Equity Analyst: Cathy Hobeika [email protected] Head of Research: Marwan Mikhael [email protected]
67.25 Share Price (SR):Equity Research – Initiation of Coverage 74.00 Fair Value (SR):Basic Materials & Industrial Products Sector: 10% Upside:Saudi Arabia Country: ACCUMULATERecommendation: December 17, 2011 Date: Medium-to-Low Risk:
Yamama Saudi Cement BLOMINVEST SAUDI ARABIA
Subject to Disclaimer on Last Page
High demand in Saudi Arabia offsets limited exports The boom in construction activity in Saudi Arabia is set to drive the demand for cement upward through the medium term, led by government efforts to improve the socio-economic environment, with currently $100 billion in infrastructure project pipeline and $80 billion worth of housing projects. Increased public spending on construction projects is also part of the Kingdom’s strategy to create an attractive business environment for global investors in the different sectors of the economy. The construction sector shelters Saudi cement producers from the risks of overcapacity in medium term. This risk became further critical with the export restrictions enacted since mid-2008.
Large capacity at Yamama enables capitalization on growing demand With the largest capacity of 6.3 mtpa among the central region’s cement producers and the robust clinker inventory buildup, Yamama holds a first-mover’s advantage to capitalize on a sudden hike in the demand for cement in its operating market. Furthermore, the location of its facilities in proximity to the Saudi capital Riyadh, gives it easy access to a large cement consumer hub. As a result, revenues are expected to increase at a CAGR of 10.7% between 2010 and 2015, rising by 15.4% y-o-y in 2011 to SR 1,467M.
Cost efficiency and limited leverage drive Yamama’s competitive lead Yamama has distinguished itself among Saudi peers with superior margins due to the cogeneration of its power supply. The integrated production process and government energy subsidies also contributed to the company’s superior profitability, with the gross profit margin standing at 56%, compared with the average of 49% for Saudi peers. Much lower leverage than the country’s average supported a senior net profit margin of 52% compared to the 40% average at Saudi peers. The superior operating efficiencies at Yamama are expected to lead a net profit growth of 15% in 2011, higher than that of revenues, to SR 755M.

2
Yamama Saudi Cement
FINANCIALS & VALUATION
Year 2010 2011e 2012f 2013f 2014f 2015f
Profit & Loss Summary
Revenue (SR M)
1,272 1,467 1,680 1,869 2,003 2,114 Revenue Growth (%)
9.4 14.3 15.4 14.5 11.3 7.1
Gross Profit (SR M)
712 819 932 1,030 1,101 1,157
Gross Margin (%)
56.0 55.8 55.5 55.1 55.0 54.7
Net Profit (SR M)
657 762 869 954 1,023 1,073
Profit Margin (%)
51.7 51.9 51.7 51.0 51.1 50.7
Net Profit Growth (%)
16.9 16.0 14.0 9.8 7.3 4.9
Earnings Per Share (SR)
4.87 5.64 6.43 7.07 7.58 7.95
Price-to-Earnings (Forward P/E)
15.19 13.11 11.50 10.47 9.76 9.31
Balance Sheet Summary (SR M)
Fixed Assets
2,106 2,001 1,901 1,806 1,715 1,630 Cash & Cash Equivalents
700 763 840 935 1,021 1,099
Trades Receivable
242 293 338 378 401 429 Inventory
132 103 114 123 128 131
Other Assets 473 482 503 510 512 515 Total Assets
3,653 3,642 3,696 3,752 3,777 3,805
Total Liabilities
495 479 640 696 713 720
Book Value Per Share (SR)
27.1 27.0 27.4 27.8 28.0 28.2
Profitability
ROA (%)
17.9 20.9 23.7 25.6 27.2 28.3 ROE (%)
21.1 24.1 27.9 31.2 33.4 34.9
Liquidity
Cash / Current Liabilities
2.8 2.8 2.3 2.2 2.3 2.4 Current Assets / Current Liabilities
4.5 4.3 3.6 3.5 3.5 3.7
Net Working Capital / Current Assets
0.8 0.8 0.7 0.7 0.7 0.7
Comparables
Valuation Margin Analysis (%) Profitability (%) P/E P/Rev P/BV
Gross Oper. Net ROE ROA
Yamama
11.5 6.4 2.6
56.0 52.4 51.7 21.1 17.9 Average of Peers 19.4 5.8 2.0
40.7 31.5 30.8 13.4 10.4
Valuation 2011e 2012f 2013f 2014f 2015f Term.
Val. Net Income (SR million) 762 869 954 1,023 1,073 Free Cash Flow to Firm (SR million) 898 830 932 1,047 1,121 11,260 Discounted Cash-flows (SR million) 898 737 734 731 695 6,193 Yamama Cement Value (SR million) 9,988 Number of shares (in millions)
135
Share Value (SR) 74.00

3
Yamama Saudi Cement
Table of Contents INVESTMENT SUMMARY ............................................................................................................................. 4
ECONOMIC OVERVIEW ................................................................................................................................ 6
COMPANY PROFILE ...................................................................................................................................... 9
Ownership ............................................................................................................................................. 9 Subsidiaries ........................................................................................................................................... 9 Board of Directors ................................................................................................................................ 9 Management ....................................................................................................................................... 10
BUSINESS MODEL ....................................................................................................................................... 11
RISKS .............................................................................................................................................................. 13
FINANCIAL ANALYSIS ................................................................................................................................. 14
Revenues ............................................................................................................................................. 14 Gross Margins ..................................................................................................................................... 14 Earnings ............................................................................................................................................... 15 Liquidity ................................................................................................................................................ 15 Leverage .............................................................................................................................................. 16 Dividends ............................................................................................................................................. 16 Profitability ........................................................................................................................................... 17
COMPARABLE ANALYSIS ........................................................................................................................... 18
Relative Valuation ............................................................................................................................... 18 Profitability Comparison .................................................................................................................... 19 Management Efficiency ..................................................................................................................... 19 Liquidity comparison .......................................................................................................................... 20
VALUATION ................................................................................................................................................... 21
Assumptions in valuation .................................................................................................................. 21 Revenue Growth ................................................................................................................................. 21 Production and operating costs ....................................................................................................... 22 Determining free cash flow and share value.................................................................................. 22 Sensitivity Analysis ............................................................................................................................. 22
PROJECTED INCOME STATEMENT .......................................................................................................... 23
PROJECTED BALANCE SHEET .................................................................................................................. 24
APPENDIX ...................................................................................................................................................... 25
I - Saudi Arabia Map ........................................................................................................................... 25 II - List of Comparable Peers............................................................................................................. 26
4
Yamama Saudi Cement
INVESTMENT SUMMARY
We issue an ACCUMULATE recommendation on Yamama Saudi Cement Company after carefully analyzing the following:
Economic Overview
The main drivers of the Saudi economy during the past few years have been government spending and foreign direct investment. Government plans to develop infrastructure and provide
housing for the growing population with the Kingdom currently having $100 billion in
infrastructure project pipeline and $80 billion worth of housing projects. Foreign direct investment
has surged since 2004 from $1.9 billion to $38 billion in 2008 and settled above $28 billion during
the past two years. This was the result of government’s efforts to build an attractive business environment for global investors.
The cement industry in Saudi Arabia is characterized by a regional segmentation with few leading
players within each nearly independent region. This is mainly due to the high transportation cost
of cement, to the drivers of demand which vary across the Kingdom’s five regions, and to the concentration of oil reserves in certain areas, arising disparity in terms of production costs
between local cement producers. During the first three quarters of the year, the Saudi cement market size has increased by 15% y-o-y to 37 million tons and production at Yamama’s facilities rose by 9% y-o-y to 4.5 million tons to
take advantage of the 7.4% increase in cement prices locally and which averaged SR 246 per ton
during the first half of 2011. Business Model
Yamama is a Saudi-based grey cement producer with an annual production capacity of 6.3 million
tons, the highest of the Central region’s players and ranking third among the Kingdom’s largest
cement producers. This position gives Yamama a first-mover’s advantage in case of any sudden hike in the demand for cement in its operating market. In 2010, sales volume at the company
reached 5.2 million tons, growing at a CAGR of 10.4% from 2006 to 2010.
Yamama is one the most profitable cement producers in the MENA region with an average gross
margin of 58% over the past four years, supported mainly by the government’s substantial energy
subsidies. Moreover, Yamama uses an integrated production process based on the in-house production of clinker and the cogeneration of power supply in the production method through the
use of both electricity and heat.
The Saudi cement producer has established facilities in the Central region, in proximity to Saudi
Arabia’s vibrant capital Riyadh. The location advantage gave Yamama access to a lucrative market with strong construction activity and abundant limestone and enables the company to take
advantage of the 40% y-o-y expected jump in the demand for cement in the central region for
2011, following the housing reforms adopted by King Abdullah.
Growth
Revenues at Yamama are expected to grow by 15.4% y-o-y, reaching SR 1,467 billion in 2011,
supported by increased demand amidst flourishing construction activity in the Central region, but
also by higher cement prices as Yamama is able to charge a premium without jeopardizing its sales on the back of savings in transportation costs for clients located in Riyadh. We expect the
top line to increase at a CAGR of 9.6% between 2011 and 2015 as a result of the robust
development in residential units following the government’s housing reforms announced earlier
during the year. We estimate Yamama’s net income to jump by 16% y-o-y to SR 762 million in 2011, led mostly by
the increasing revenues, and the bottom line to grow at a CAGR of 8.9% going forward through
2015.
5
Yamama Saudi Cement
Profitability
Following the anticipated increase in net income through the medium term, the ROA and ROE
ratios at Yamama will substantially improve, rising in 2011 to 20.9% and 24.1% respectively, up
from 17.9% and 21.1% the year before. Yamama’s relative high gross margin is expected to slightly decline to 55.8% in 2011, down from
56% in 2010 and average 55.2% over our five-year outlook due to an anticipated minor increase in
production costs. The net profit margin trend will maintain its 2010 levels of 52% for the year,
before following the trend of the gross margin and slightly decrease to average around 51% through 2015.
Financial Position
Over the past few years, Yamama has consistently maintained very high levels of liquidity, backed mostly by large balances of cash which constituted up to 65% of current assets over the past two
years. We expect liquidity ratios to slightly decline over the coming few years underpinned by
minor investments capacity increase, before settling near the 2009 levels.
With abundant excess of cash balances, Yamama relies very little on borrowings to finance
expansion of its operations and investments in fixed assets. Hence, the company’s debt-to-equity ratio stood at 8% last year. We expect the ratio to average 11% through 2015, as the company
plans to replace its old production lines with a new one, and slightly increases capacity to meet
the anticipated rise in demand over the medium term.
Valuation
We valued Yamama at SR 74 per share using the DCF method with a discount rate of 12.70% and
a terminal growth rate of 2.5%. We assumed capacity to expand at a CAGR of 4% through 2015 and the annual utilization rate to average 98%, while we anticipate a 4.4% annual cement price
increase over our five-year forecast.
Yamama appears to be significantly undervalued when comparing its price-to-earnings ratio of 13
against both its Saudi and regional peers which hold a P/E of 15.1 and 19.1, respectively. This is further confirmed through a lower price to revenue compared to Saudi cement producers and by
our 2011 forecasts, as revenues and earnings are both expected to increase by around 16% this
year, further lowering our valuation ratios compared to peers.
Considering Yamama’s relative location advantage and high capacity and inventory levels which will allow Yamama to meet an unexpected upsurge in demand, we believe that an upward
adjustment in the company’s stock price is highly likely in order to bring the company’s valuation
metrics near the average.
Risks Investing in Yamama entails three major risks which apply to all Saudi cement companies. Firstly,
a slowdown in construction activity in the Kingdom in the long term after the government housing
reforms projects come to an end would result in high inventory levels at Yamama, a situation that
is further aggravated were the cement export restrictions to remain valid in the long term. The excess capacity would end up in obsolete inventory and the cement producers would be forced
to significantly cut their prices to SR 195 per ton, the price ceiling if they wished to export the
excess output, drastically cutting their margins away. In addition, the long distance between
Saudi Arabia’s main cities would burden Saudi producers through high transportation costs if the government fails to ease cement export restrictions in the long term, further pressuring margins
as producers are forced to supply counterparts instead of exiting their output to nearer export
markets. Finally, energy subsidies are a key profitability factor to the Kingdom’s cement players. A
cut or a lift of governmental support for energy will certainly hurt production efficiency.
6
Yamama Saudi Cement
ECONOMIC OVERVIEW
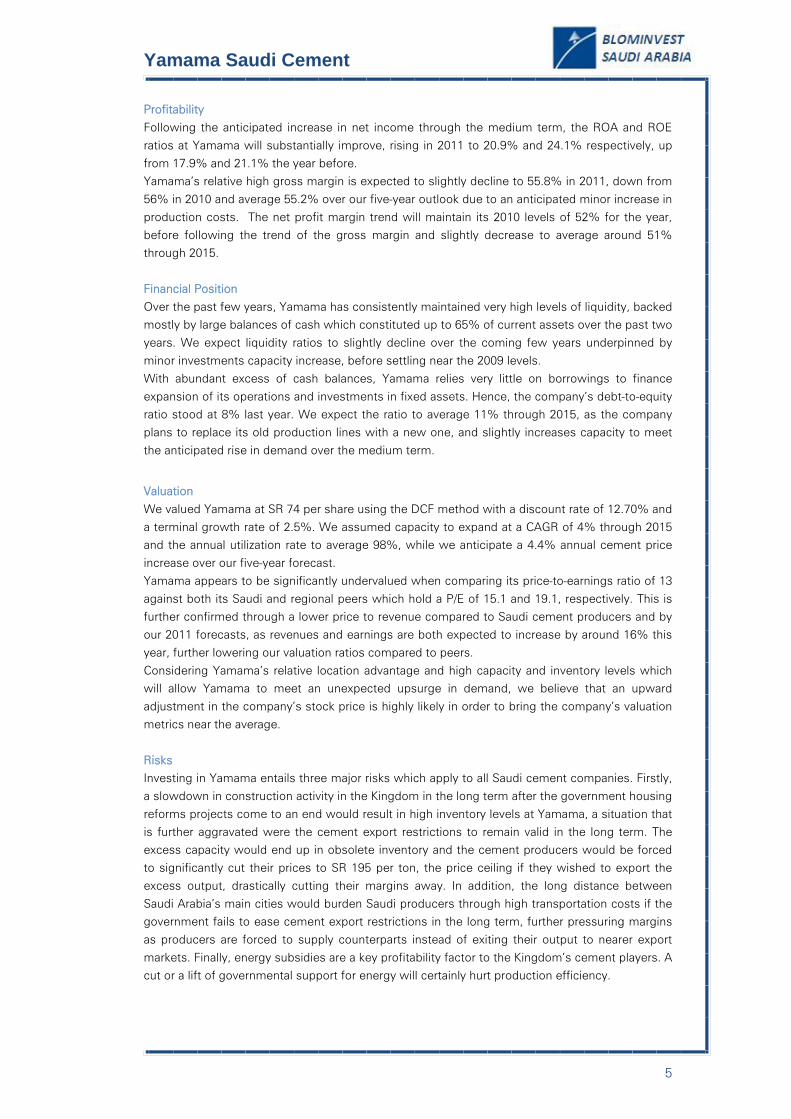
Non-oil sectors and Foreign Direct Investment are the main drivers of economic growth Saudi Arabia’s economy has quickly diversified over the past few years, with at least 50% of its
Gross Domestic Product (GDP) growth stemming from non-oil sectors after it had been almost-
fully reliant on oil revenues prior to 2008.
During 2010, the Kingdom’s economy showed signs of recovery from the global recession with GDP expanding at the annualized rate of 3.8% up from a frail 0.6% in 2009, an expansion that is
expected to sustain its upward trend in the longer term with GDP forecasted to double by 2025.
According to the International Monetary Fund, Saudi Arabia’s GDP is projected to jump by 7.5% y-
o-y in 2011 bolstered by increased government spending and the country’s real non-oil GDP growth expected to reach 7% following the government’s long-term development strategy
adopted in 2005 to bring improvements in the citizens’ quality of life.
Source: IMF, Saudi Arabia Monetary Agency (SAMA), Blominvest
Besides the major contribution of public spending, the government has built an attractive
investment environment for global investors in the different sectors of the economy. These
include a favorable tax rate for businesses and the absence of capital controls on remittances and repatriation of revenues out of the country, according to the Saudi Arabia Monetary Agency. As a
result, foreign direct investment (FDI) has been a catalyst of the Saudi economy’s expansion since
2005. Investment inflows to the Kingdom have grown at a CAGR of 56% between 2004 and 2009,
peaking at $38 billion in 2008, and settled above $28 billion during the past two years, pressured
by the global recession in 2009. In 2010, the United Nations Conference on Trade and Development (UNCTAD) ranked Saudi Arabia at the eighth position among top recipients of FDI
globally and at the 17th place in terms of performance rewards.
Source: World Bank, Blominvest
7
Yamama Saudi Cement
Government spending plan on real estate supports medium term positive construction outlook
Saudi Arabia suffers from severe unemployment and a large shortage of supply of housing units
as the slow development on these two fronts has been lagging behind the pace of demographic growth. The local residential property market is in need of 1.65 million of housing units by 2015 to
meet the demand of the growing Saudi population which stood at 25.4 million in 2009, fourfold its
level in the early 1970s. Consequently, King Abdullah announced the allocation of $130 billion in
the budget to build 500,000 houses by 2015 for low and middle income Saudis, and another $67 billion in expenditures on unemployment, social welfare and housing benefits which are most
likely to translate into increased demand on housing. Currently, the kingdom has $100 billion in
infrastructure project pipeline and $80 billion worth of housing projects. The Saudi real estate
sector is expected to further grow, boosted by the upcoming enactment of the mortgage law expected in 2012 which will facilitate and enhance the market’s sophistication and widen funding
options for middle and low-middle income groups further driving the demand for housing upward.
Demand for cement will also be boosted by the government plan to develop infrastructure as it
declared in December 2008 its intention to spend around $400 billion on infrastructure projects as
part of its Ninth Development Plan between 2010 and 2014, following a previous plan covering investments over the period 2005-2009.
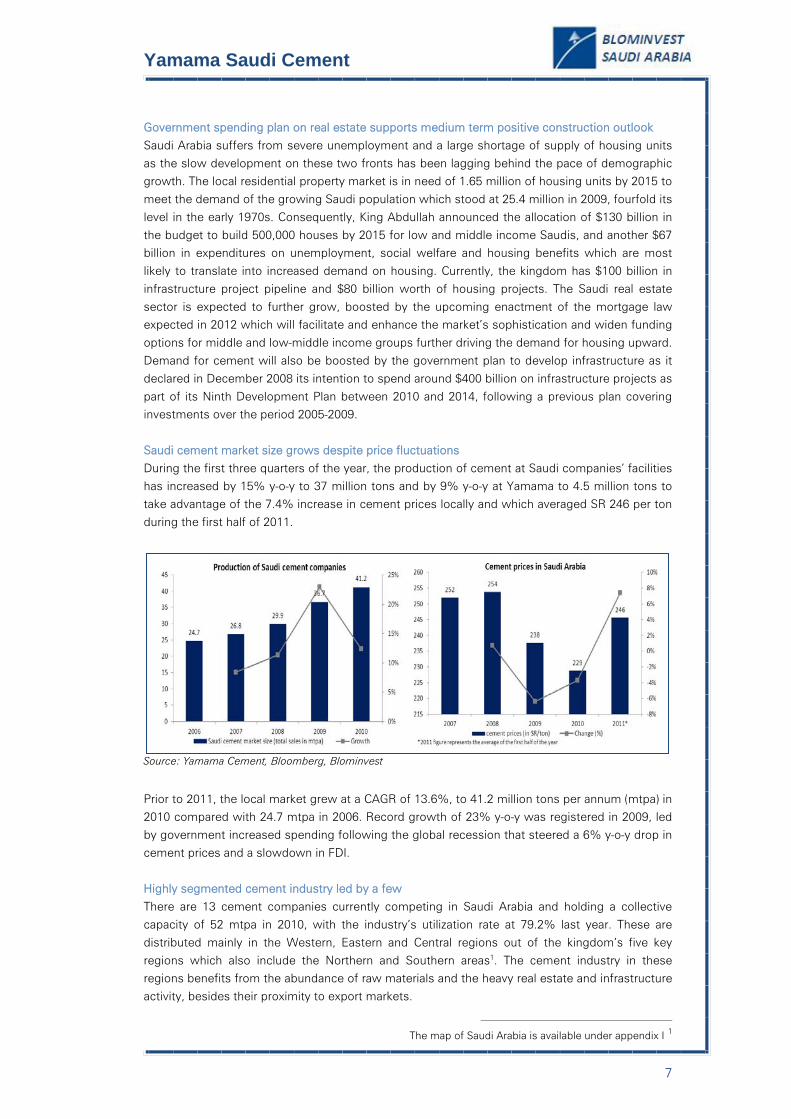
Saudi cement market size grows despite price fluctuations
During the first three quarters of the year, the production of cement at Saudi companies’ facilities has increased by 15% y-o-y to 37 million tons and by 9% y-o-y at Yamama to 4.5 million tons to
take advantage of the 7.4% increase in cement prices locally and which averaged SR 246 per ton
during the first half of 2011.
Source: Yamama Cement, Bloomberg, Blominvest
Prior to 2011, the local market grew at a CAGR of 13.6%, to 41.2 million tons per annum (mtpa) in 2010 compared with 24.7 mtpa in 2006. Record growth of 23% y-o-y was registered in 2009, led
by government increased spending following the global recession that steered a 6% y-o-y drop in
cement prices and a slowdown in FDI.
Highly segmented cement industry led by a few
There are 13 cement companies currently competing in Saudi Arabia and holding a collective
capacity of 52 mtpa in 2010, with the industry’s utilization rate at 79.2% last year. These are
distributed mainly in the Western, Eastern and Central regions out of the kingdom’s five key
regions which also include the Northern and Southern areas1. The cement industry in these regions benefits from the abundance of raw materials and the heavy real estate and infrastructure
activity, besides their proximity to export markets.
1 The map of Saudi Arabia is available under appendix I

8
Yamama Saudi Cement
Region Main cities Advantage
Western Jeddah, Mekka, Al Madina,
King Abdullah Economic City
Very strong construction activity Abundant limestone
Proximity to export markets through Red sea
Abundant natural gas Eastern Dammam, Khobar, Proximity to GCC countries
Central Jubail, Hofuf
Riyadh, Qasim
Abundant limestone Strong construction activity
Abundant limestone Source: Cement MENA Report & Outlook 2010 - Blominvest
The cement industry in Saudi Arabia is highly segmented led by a few companies within each nearly independent region. The dynamics of the industry vary across these regions driven by the
demand for cement in each, the concentration of oil reserves in certain areas, and long distances
between the major cities. These factors lead to different production and transportation costs
among local cement producers and limit the industry’s consolidation efforts among regions.
Source: Yamama Cement, Blominvest
Saudi Cement Company, the kingdom’s largest cement producer leads the Eastern region with a
capacity of 11 mtpa, while Southern Province Cement tops the Southern region with a capacity of 6.2 mtpa, Yamama Cement dominates the Central market with a capacity of 6.3 mtpa and Yanbu
Cement holds a capacity of 4.5 mtpa. These four companies hold almost half of the total Saudi
cement market share, topped by Saudi Cement which grasps 17% by itself, while Yamama
Cement has been losing market share over the past few years to 13.3% in 2010 from a high of 16% back in 2007 on new comers which have been gaining momentum since entering the market
in 2008.
9
Yamama Saudi Cement
COMPANY PROFILE Yamama Cement Company is the second largest cement producer in Saudi Arabia in terms of market share, with an annual capacity of 6 million tons of clinker and 6.3 million tons of cement.
The company was incorporated in 1961 and has production facilities located in Riyadh. It is
engaged in the manufacturing and distribution of cement and related products, including clinker,
finishing cement, moderate sulfate-resistant cement, ordinary cement and sulfate-resistant cement, in addition to paper bags used for cement packaging.
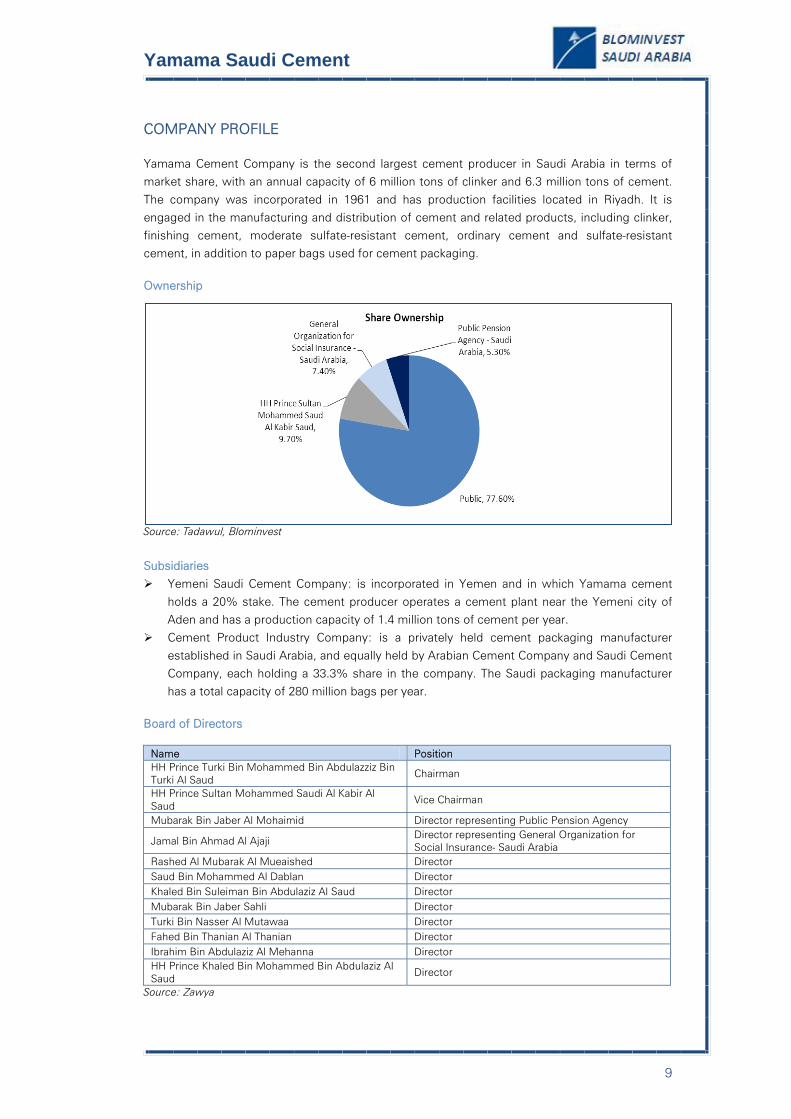
Ownership
Source: Tadawul, Blominvest
Subsidiaries
Yemeni Saudi Cement Company: is incorporated in Yemen and in which Yamama cement
holds a 20% stake. The cement producer operates a cement plant near the Yemeni city of Aden and has a production capacity of 1.4 million tons of cement per year.
Cement Product Industry Company: is a privately held cement packaging manufacturer
established in Saudi Arabia, and equally held by Arabian Cement Company and Saudi Cement
Company, each holding a 33.3% share in the company. The Saudi packaging manufacturer has a total capacity of 280 million bags per year.
Board of Directors
Name Position HH Prince Turki Bin Mohammed Bin Abdulazziz Bin Turki Al Saud
Chairman
HH Prince Sultan Mohammed Saudi Al Kabir Al Saud
Vice Chairman
Mubarak Bin Jaber Al Mohaimid Director representing Public Pension Agency
Jamal Bin Ahmad Al Ajaji Director representing General Organization for Social Insurance- Saudi Arabia
Rashed Al Mubarak Al Mueaished Director Saud Bin Mohammed Al Dablan Director Khaled Bin Suleiman Bin Abdulaziz Al Saud Director Mubarak Bin Jaber Sahli Director Turki Bin Nasser Al Mutawaa Director Fahed Bin Thanian Al Thanian Director Ibrahim Bin Abdulaziz Al Mehanna Director HH Prince Khaled Bin Mohammed Bin Abdulaziz Al Saud
Director
Source: Zawya
10
Yamama Saudi Cement
Management
Name Position HH Prince Sultan Mohammed Saudi Al Kabir Al Saud
Managing Director
Jihad Abdulaziz Al Rasheed General Manager Mounir Fahad Al Sahali Finance and Information Technology Director Abdullah Ibrahim Al Suwailem Factory Manager Walid Suleiman Al Badaa Production Manager Abdullah Mohammed Al Noweiser Materials Manager Suleiman Mohammed Nasser Al Theeb Maintenance Manager Mohammed Nowaf Al Ali Security and Services Manager
Abdulhakeem Bin Salah Al Arafy Safety, Health and Environment Technology Manager
Fahad Abdulmohen Al Fadley Commercial Manager Manhy Mohsen Al Haydal Marketing Manager Mahdi Abdullah Al Ghamdi Sales Manager Ali Bin Mohammed Al Garny Personnel Affairs Manager Ibrahim Ramian Al Ramian Administration and Human Resources Manager Othman Bin Ali Al Hamad Human Resources Development Manager Ibrahim Bin Dhefallah Al Mattrafy Information Technology Manager
Source: Zawya
11
Yamama Saudi Cement
BUSINESS MODEL
Revenues at Yamama are generated from sales of grey cement, the production of which is mostly reliant on the capacity of clinker produced at the company’s facilities. The integrated production
process coupled with the energy subsidies granted by the Saudi government and the premium
central location of the company’s facilities have enabled Yamama to maintain high levels of
profitability. Revenue growth relies on capacity expansion and stock levels
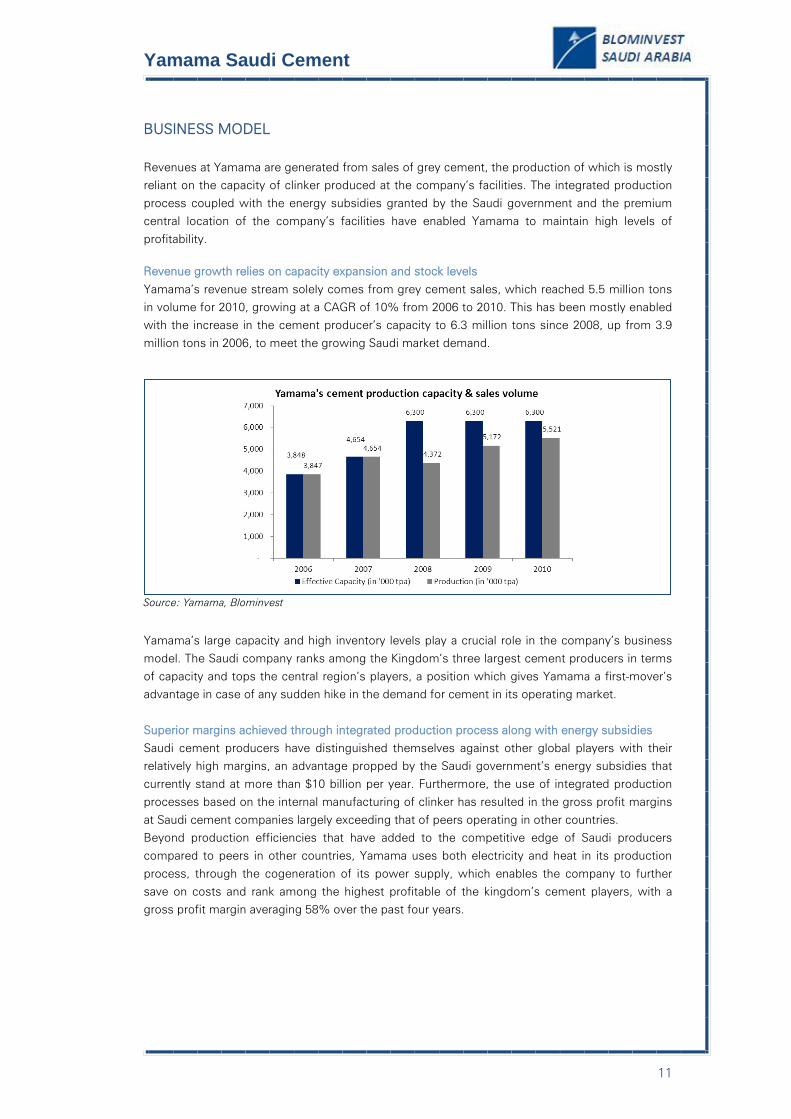
Yamama’s revenue stream solely comes from grey cement sales, which reached 5.5 million tons
in volume for 2010, growing at a CAGR of 10% from 2006 to 2010. This has been mostly enabled with the increase in the cement producer’s capacity to 6.3 million tons since 2008, up from 3.9
million tons in 2006, to meet the growing Saudi market demand.
Source: Yamama, Blominvest
Yamama’s large capacity and high inventory levels play a crucial role in the company’s business
model. The Saudi company ranks among the Kingdom’s three largest cement producers in terms
of capacity and tops the central region’s players, a position which gives Yamama a first-mover’s advantage in case of any sudden hike in the demand for cement in its operating market.
Superior margins achieved through integrated production process along with energy subsidies
Saudi cement producers have distinguished themselves against other global players with their relatively high margins, an advantage propped by the Saudi government’s energy subsidies that
currently stand at more than $10 billion per year. Furthermore, the use of integrated production
processes based on the internal manufacturing of clinker has resulted in the gross profit margins
at Saudi cement companies largely exceeding that of peers operating in other countries. Beyond production efficiencies that have added to the competitive edge of Saudi producers
compared to peers in other countries, Yamama uses both electricity and heat in its production
process, through the cogeneration of its power supply, which enables the company to further
save on costs and rank among the highest profitable of the kingdom’s cement players, with a gross profit margin averaging 58% over the past four years.

12
Yamama Saudi Cement
Strategic location offsets forgone export sales
Having established its facilities in the Central region, in proximity to Saudi Arabia’s vibrant capital
Riyadh, Yamama has gained access to a lucrative market with strong construction activity and
abundant limestone. This location advantage has enabled Yamama to shield its operations following the export
restrictions on Saudi cement producers enacted by the government since June 2008 and which
contributed to the 5.4% y-o-y decline in the company’s sales volume during that year.
Source: Yamama, Blominvest
In addition, Yamama is well-placed to take advantage of the jump in the demand for cement in the central region for 2011, and the construction boom which will further sustain over the medium
term, following the housing reforms adopted by King Abdullah earlier this year.

13
Yamama Saudi Cement
RISKS A slowdown in local construction with government maintaining the export restriction on cement Amidst concerns that the country would suffer from a shortage in the supply of cement for the
flourishing local construction projects, Saudi Arabia’s government issued a ban on the product’s
exports to all countries except Bahrain in mid-2008, and limited the weekly outflow of cement to
the neighboring state to 25,000 tons, down from 50,000 tons previously. The mandate however, allowed cement exports under the strict conditions that Saudi producers sell a bag of cement at
SR195 per ton, a price that would be highly unprofitable to these companies. However, the
exports restriction seems to have had limited effect on the profitability of the Saudi producers so
far due to the high domestic demand exhausting the total national output.
Although it is most likely that the demand will uphold at high levels over the medium term, led by the government’s intentions to further boost the construction sector with the development of
housing units, the higher demand would certainly fade over the longer term, were government’s
spending on construction projects to ease in all Saudi regions and the export constraints to
remain valid. In this highly unlikely scenario, coerced to exporting cement at the SR 195 price per ton would eat into the margins of Saudi producers, forcing many to shut operations down.
Long distances and high transportation costs restrict geographical diversification
Saudi Arabia’s cement industry is highly segmented between the Kingdom’s five regions, each of which is driven by particular dynamics mainly due to a variation in demand across the regions and
the geographical distribution of the kingdom’s main cities.
The long distances between the major cities are associated with high transportations costs,
constraining a company in one region from taking advantage of a sudden hike in another region’s demand which cannot be satisfied by the excess capacity of its local producers. This scenario
becomes further critical with export restrictions still in effect and forces producers to ship cement
to other regions to eliminate excess capacity, despite burdening transportation costs.
Energy price hike beyond expectations The profitability of cement makers is highly sensitive to energy costs being the most critical
charges in the production of cement. Currently, Saudi producers benefit from ample government
subventions which significantly lower the manufacturing costs of the end product, and those
companies rely heavily on the continuous flow of these subsidies. Thus, a cut or a lift of governmental support for energy will certainly hurt the margins of Saudi companies.
14
Yamama Saudi Cement
FINANCIAL ANALYSIS
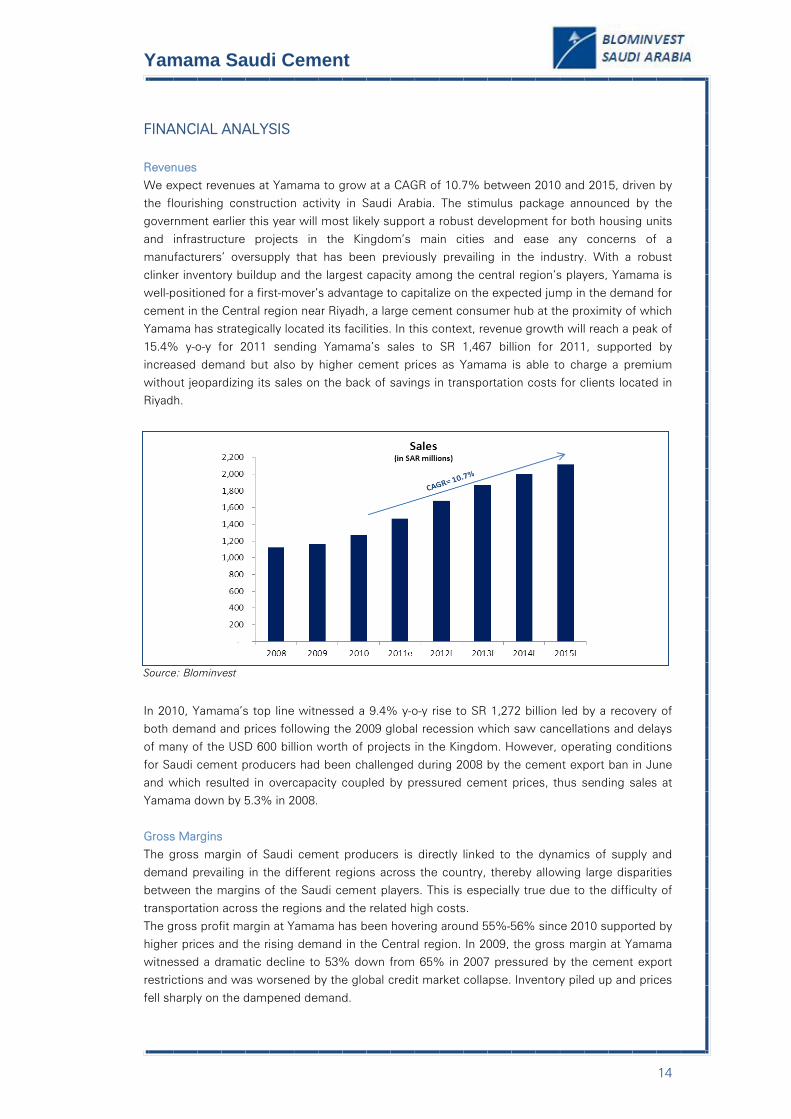
Revenues We expect revenues at Yamama to grow at a CAGR of 10.7% between 2010 and 2015, driven by
the flourishing construction activity in Saudi Arabia. The stimulus package announced by the
government earlier this year will most likely support a robust development for both housing units
and infrastructure projects in the Kingdom’s main cities and ease any concerns of a manufacturers’ oversupply that has been previously prevailing in the industry. With a robust
clinker inventory buildup and the largest capacity among the central region’s players, Yamama is
well-positioned for a first-mover’s advantage to capitalize on the expected jump in the demand for
cement in the Central region near Riyadh, a large cement consumer hub at the proximity of which Yamama has strategically located its facilities. In this context, revenue growth will reach a peak of
15.4% y-o-y for 2011 sending Yamama’s sales to SR 1,467 billion for 2011, supported by
increased demand but also by higher cement prices as Yamama is able to charge a premium
without jeopardizing its sales on the back of savings in transportation costs for clients located in Riyadh.
Source: Blominvest
In 2010, Yamama’s top line witnessed a 9.4% y-o-y rise to SR 1,272 billion led by a recovery of both demand and prices following the 2009 global recession which saw cancellations and delays
of many of the USD 600 billion worth of projects in the Kingdom. However, operating conditions
for Saudi cement producers had been challenged during 2008 by the cement export ban in June
and which resulted in overcapacity coupled by pressured cement prices, thus sending sales at Yamama down by 5.3% in 2008.
Gross Margins
The gross margin of Saudi cement producers is directly linked to the dynamics of supply and
demand prevailing in the different regions across the country, thereby allowing large disparities between the margins of the Saudi cement players. This is especially true due to the difficulty of
transportation across the regions and the related high costs.
The gross profit margin at Yamama has been hovering around 55%-56% since 2010 supported by
higher prices and the rising demand in the Central region. In 2009, the gross margin at Yamama witnessed a dramatic decline to 53% down from 65% in 2007 pressured by the cement export
restrictions and was worsened by the global credit market collapse. Inventory piled up and prices
fell sharply on the dampened demand.

15
Yamama Saudi Cement
However, the integration of its production of clinker and cement as well as the cogeneration of its
power supply enabling the use of both electricity and heat in cement manufacturing have enabled
Yamama to consistently hold an advantage over its Saudi peers in terms of its production
efficiencies despite pressures on prices.
Source: Blominvest
Going forward, we expect the gross profit at Yamama to grow at a slower pace, rising by 15% y-o-y in 2011 to SR 819 million, compared with 15.6% the year before, and the gross margin to
slightly decline to 55.8% for the year, down from 56% in 2010 and average 55.2% over our five-
year outlook due to an anticipated minor increase in production costs.
Earnings
We estimate Yamama’s net income to grow at a CAGR of 10.3% between 2010 and 2015, with a
16% y-o-y jump in 2011 to SR 762 million, led mostly by increasing revenues. The net profit
margin at the Saudi cement producer will most likely be near 52%, the level recorded in 2010. Going forward, the company’s net profit margin will follow the trend of the gross margin and
slightly decline through 2015 to average around 51%.
Source: Blominvest
Liquidity Over the past few years, Yamama has consistently maintained very high levels of liquidity with
current assets averaging 3.7 times as much as current liabilities, backed mostly by large balances
of cash which constituted up to 65% of current assets over the past two years, down from 72%
in 2008. Hence, the company maintained a positive net working capital ratio over the considered period.

16
Yamama Saudi Cement
We expect liquidity ratios to slightly decline over the coming few years compared to their 2010
levels, underpinned by minor investments capacity increase, before settling near the 2009 levels.
Current Ratio = Current Assets / Current Liabilities Cash Ratio = Cash / Current Liabilities Net Working Capital Ratio = (Current Assets – Current Liabilities) / Current Assets
Source: Blominvest
Leverage
Despite competing in a capital-intensive industry, Yamama has been able to rely mostly on its
excess cash balances to finance expansion of its operations and investments in fixed assets, with
little reliance on borrowing. Hence, the company’s debt-to-equity ratio fell from a mere 20% in 2008 to as little as 8% in 2010 and averaged 14% for the period.
Earlier in the year, Yamama has been studying the replacement of five old production lines with a
new one. This, coupled with an expected increase in capacity to meet the anticipated rise in
demand, will most likely push the leverage of the cement producer upward to an average of 11%
through 2015, up from 8% in 2010.
Source: Blominvest
Dividends Yamama has consistently distributed dividends twice per annum over the past few years with a
payout ratio of 80%-90%. Historically, the company paid SR 4 per share, representing a 7.8%
yield over the 2010 closing stock price of SR 51.5 and SR 3 per share representing a 6.4%
dividend yield over the 2009 closing price of SR 47.2.
With a strong anticipated performance outlook, we expect Yamama to maintain its dividend distribution policy.
17
Yamama Saudi Cement
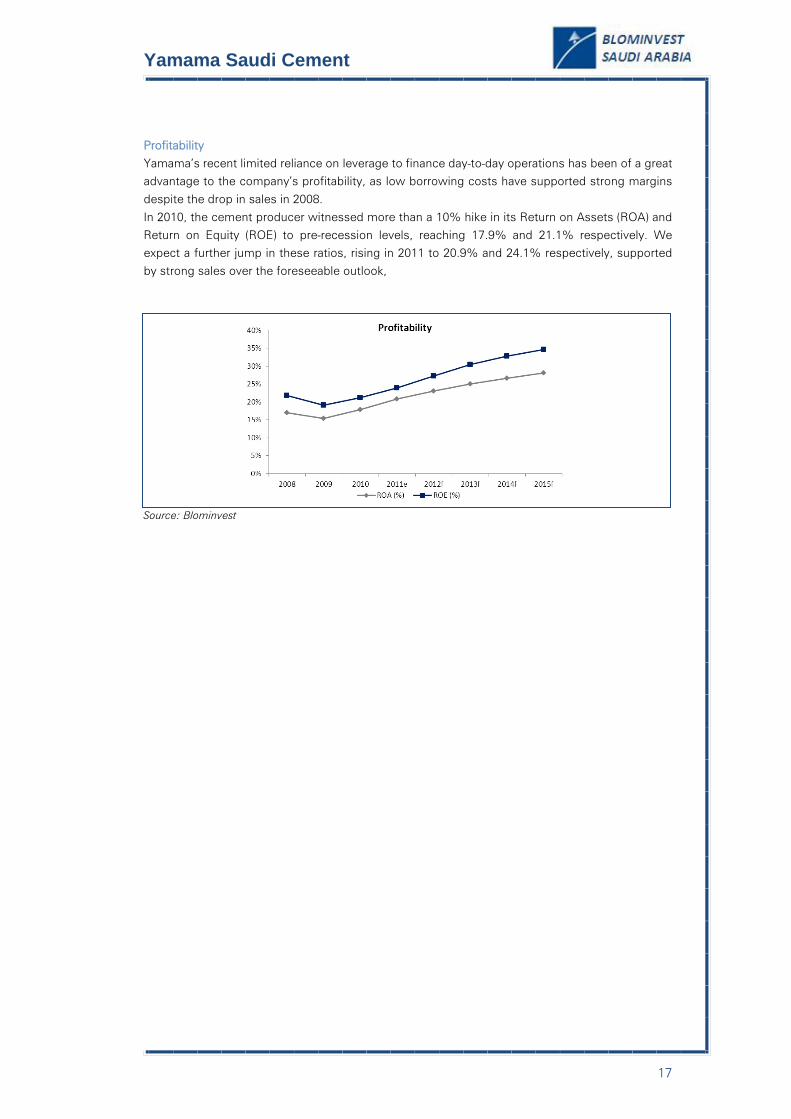
Profitability
Yamama’s recent limited reliance on leverage to finance day-to-day operations has been of a great advantage to the company’s profitability, as low borrowing costs have supported strong margins
despite the drop in sales in 2008.
In 2010, the cement producer witnessed more than a 10% hike in its Return on Assets (ROA) and
Return on Equity (ROE) to pre-recession levels, reaching 17.9% and 21.1% respectively. We expect a further jump in these ratios, rising in 2011 to 20.9% and 24.1% respectively, supported
by strong sales over the foreseeable outlook,
Source: Blominvest
18
Yamama Saudi Cement
COMPARABLE ANALYSIS In order to assess the performance of Yamama in comparison to peers, we compare it on four different fronts:
1. Relative Valuation: Demonstrates if the company is overvalued, fairly valued or
undervalued compared to its peers.
2. Profitability: Presents the company’s Gross, Operating and Net Profit Margins with regard to the average company in the industry and region.
3. Management Effectiveness: Provides insight into how well management is at utilizing
assets and equity to generate earnings.
4. Liquidity and Efficiency: Offers a glance at the company’s liquidity position in
comparison to peers and its inventory turnover compared to the global cables industry.
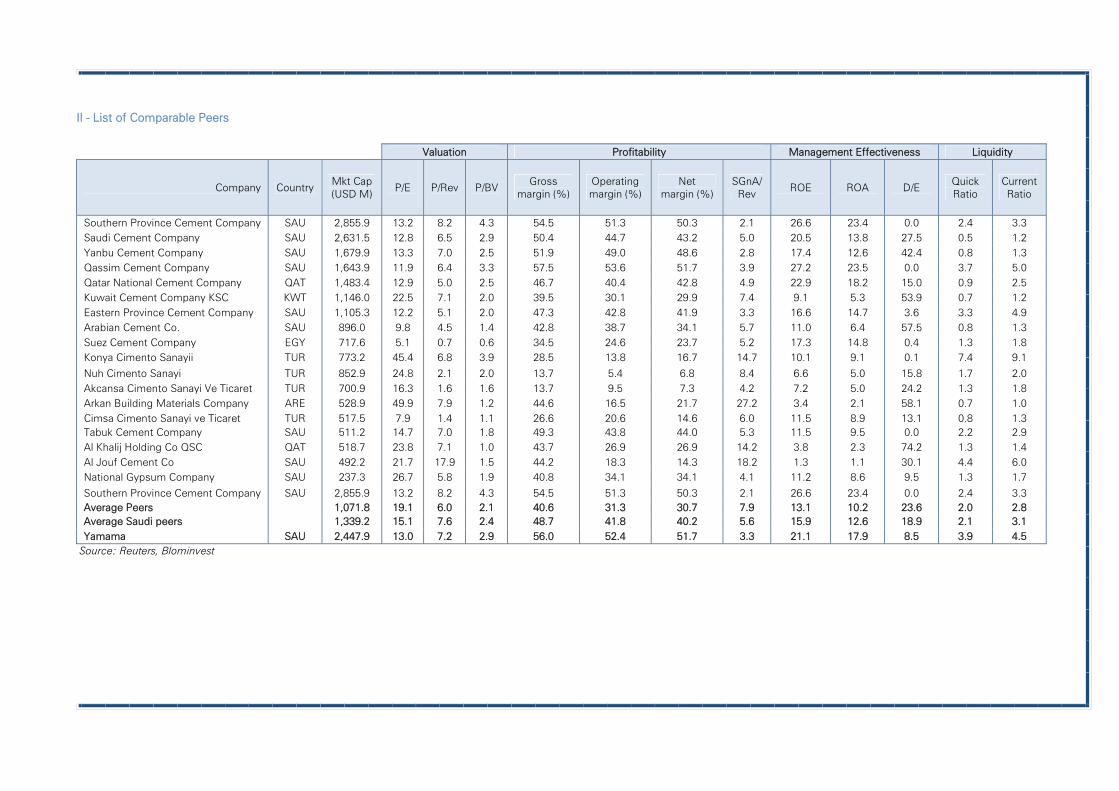
Comparable Firms
We selected a list of 18 cement producers operating in the Middle East and Africa and that are
most comparable to Yamama with regards to operations2. We drew our sample from companies with a market capitalization that ranges between $500 million and $3 billion with an average of
$1.1 billion, versus $2.5 billion for Yamama. We also included all 9 listed Saudi cement companies
to serve as a separate benchmark. These have an average market cap of $1.3 billion, ranging from
$237 million for National Gypsum Company up to $2.9 billion for Southern Province Cement.
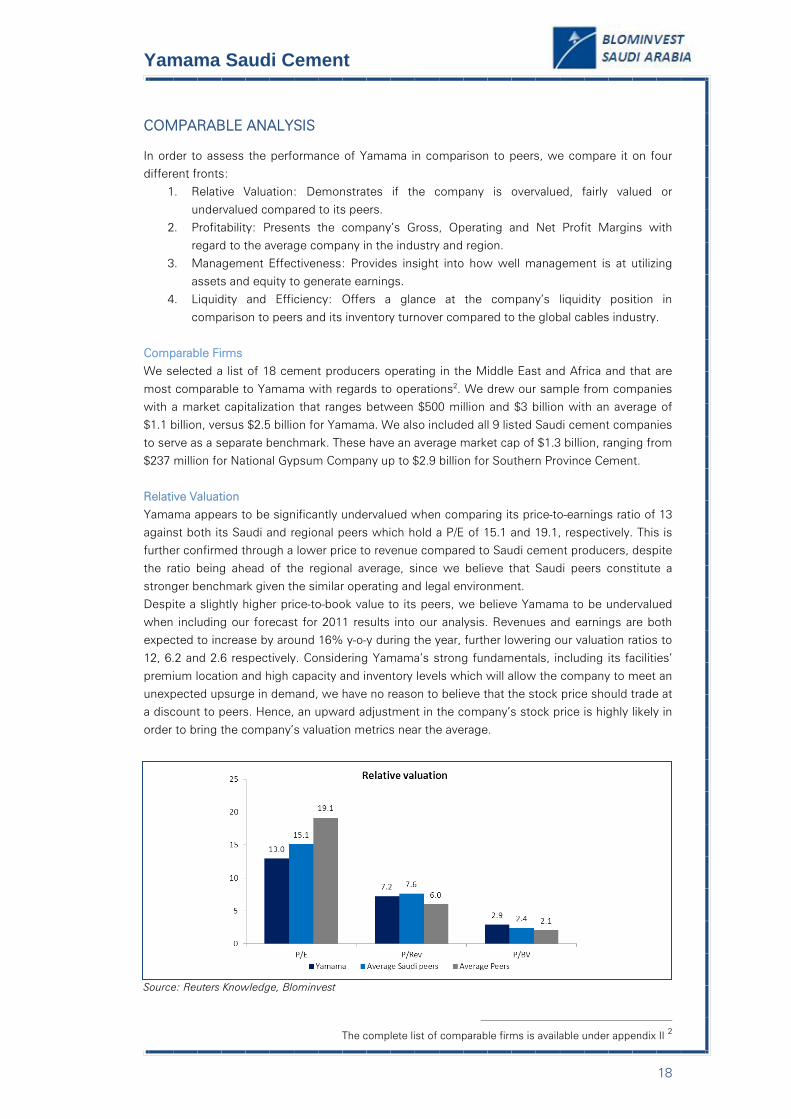
Relative Valuation
Yamama appears to be significantly undervalued when comparing its price-to-earnings ratio of 13
against both its Saudi and regional peers which hold a P/E of 15.1 and 19.1, respectively. This is further confirmed through a lower price to revenue compared to Saudi cement producers, despite
the ratio being ahead of the regional average, since we believe that Saudi peers constitute a
stronger benchmark given the similar operating and legal environment.
Despite a slightly higher price-to-book value to its peers, we believe Yamama to be undervalued
when including our forecast for 2011 results into our analysis. Revenues and earnings are both expected to increase by around 16% y-o-y during the year, further lowering our valuation ratios to
12, 6.2 and 2.6 respectively. Considering Yamama’s strong fundamentals, including its facilities’
premium location and high capacity and inventory levels which will allow the company to meet an
unexpected upsurge in demand, we have no reason to believe that the stock price should trade at a discount to peers. Hence, an upward adjustment in the company’s stock price is highly likely in
order to bring the company’s valuation metrics near the average.
Source: Reuters Knowledge, Blominvest
2 The complete list of comparable firms is available under appendix II
19
Yamama Saudi Cement
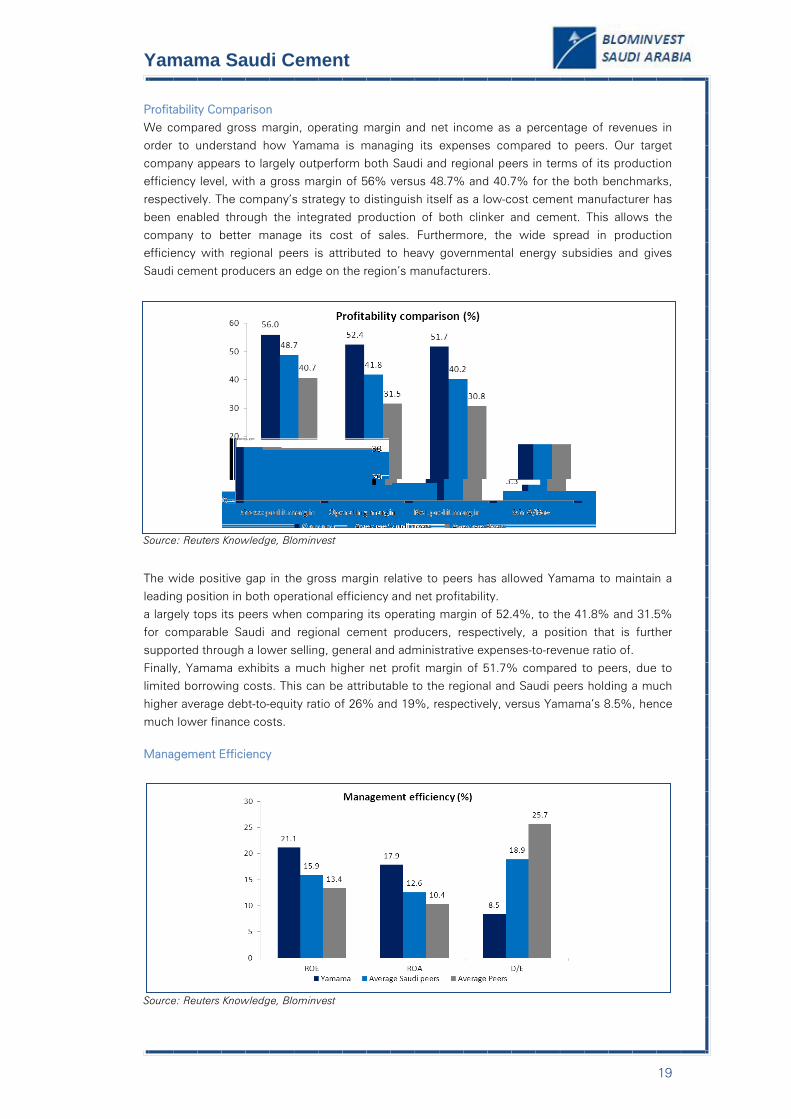
Profitability Comparison
We compared gross margin, operating margin and net income as a percentage of revenues in
order to understand how Yamama is managing its expenses compared to peers. Our target
company appears to largely outperform both Saudi and regional peers in terms of its production efficiency level, with a gross margin of 56% versus 48.7% and 40.7% for the both benchmarks,
respectively. The company’s strategy to distinguish itself as a low-cost cement manufacturer has
been enabled through the integrated production of both clinker and cement. This allows the
company to better manage its cost of sales. Furthermore, the wide spread in production efficiency with regional peers is attributed to heavy governmental energy subsidies and gives
Saudi cement producers an edge on the region’s manufacturers.
Source: Reuters Knowledge, Blominvest
The wide positive gap in the gross margin relative to peers has allowed Yamama to maintain a
leading position in both operational efficiency and net profitability. a largely tops its peers when comparing its operating margin of 52.4%, to the 41.8% and 31.5%
for comparable Saudi and regional cement producers, respectively, a position that is further
supported through a lower selling, general and administrative expenses-to-revenue ratio of.
Finally, Yamama exhibits a much higher net profit margin of 51.7% compared to peers, due to limited borrowing costs. This can be attributable to the regional and Saudi peers holding a much
higher average debt-to-equity ratio of 26% and 19%, respectively, versus Yamama’s 8.5%, hence
much lower finance costs.
Management Efficiency
Source: Reuters Knowledge, Blominvest

20
Yamama Saudi Cement
Yamama’s ROE and ROA ratios which stand at 21.1% and 17.9% respectively, confirm that the
company outperforms its peers in managing its assets and equity. The significant spread is
mainly the result of extremely low finance costs relative to regional peers resulting from large loan
settlements since 2008 and a slowdown in borrowings as no major expansionary projects were undertaken at the company since 2007. It is worth noting that capital expenditures over the past
few years have been limited to maintenance projects.
Liquidity comparison Taking a look at the quick and current ratios, Yamama appears to be much more liquid than the
average in the market with ratios of 3.9 and 4.5. We believe this is mostly due to the decline in
capital investments at the company since 2007, which has allowed the company to maintain large
cash balances.
Source: Reuters Knowledge, Blominvest

21
Yamama Saudi Cement
VALUATION We value Yamama at SR 74 per share, representing a 10% premium over the current stock price
of SR 67.25. In this context, we issue an ACCUMULATE recommendation on the back of the stock’s upside potential. Our overweight rating is further supported by Yamama’s location
advantage and high capacity and inventory levels which gives it the ability to charge a premium on
cement prices and be a first mover in case of a sudden increase in demand in the central region.
Assumptions in valuation
Discount Rate We used a WACC of 12.70% for the purpose of valuing Yamama’s equity derived as follows:
WACC = (Weight of Equity * Cost of Equity) + (Weight of Debt * Cost of Debt) * (1 – Tax Rate) = (0.94 * 13.42%) + (0.06 * 1.95%) * (1 – 3.5%) = 12.71%, rounded down to 12.70%
Yamama’s Cost of Equity = Risk-Free Rate + (Beta * Market Risk Premium)
= 1.80% + (0.88 * 13.20%) = 13.42%
We used a Risk-Free Rate of 1.80% represented by the five year US Treasury bill.
Yamama’s beta over the past 3 years is estimated at 0.88. This is a measure of the share
volatility against the TASI Index that represents Saudi Stock exchange.
A market risk premium of 13.20% is the result of the difference between the expected return of the TASI estimated at 15.00% and the Risk-Free Rate of 1.80%. This represents the
premium investors expect to gain for realizing the additional risk of investing in securities.
Terminal Growth Rate We selected a terminal growth rate of 2.5% for Yamama beyond 2015.
Revenue Growth
Below are the underlying assumptions of our five-year revenue model, supporting a sales growth at a CAGR of 9.6% for the period:
We expect capacity at Yamama to expand at a CAGR of 4.0% over our five-year outlook, to
near 7.4 million tons per annum (mtpa) in 2015 from 6.3 mtpa currently. We assume the first
addition to take effect in 2012, following an anticipated jump in demand in the central region, on the back of flourishing construction activity and the implementation of the residential
construction plan enacted earlier this year by the Saudi government.
We forecast capacity utilization rates to hover between 95% and 99% during the medium
term as the company accelerates production to meet the rising demand. Also, production
volumes will account for 100% of the production according to historical company records. We assume a reasonable 4.4% annual growth rate for cement prices, given the current and
expected market fundamentals.
2011e 2012f 2013f 2014f 2015f
Effective Capacity (in '000 tpa) 6,300 6,521 6,977 7,186 7,366 Production (in '000 tpa) 6,011 6,461 6,881 7,122 7,336 Utilization 95.4% 99.1% 98.6% 99.1% 99.6% Demand satisfied by Yamama ( in '000 tpa) 6,011 6,461 6,881 7,122 7,336 Average price per ton (in SR per ton) 244 260 272 281 288 Price growth
6.5% 4.5% 3.5% 2.5%
Expected Revenue (in SRm) 1,467 1,680 1,869 2,003 2,114
Source: Blominvest
22
Yamama Saudi Cement
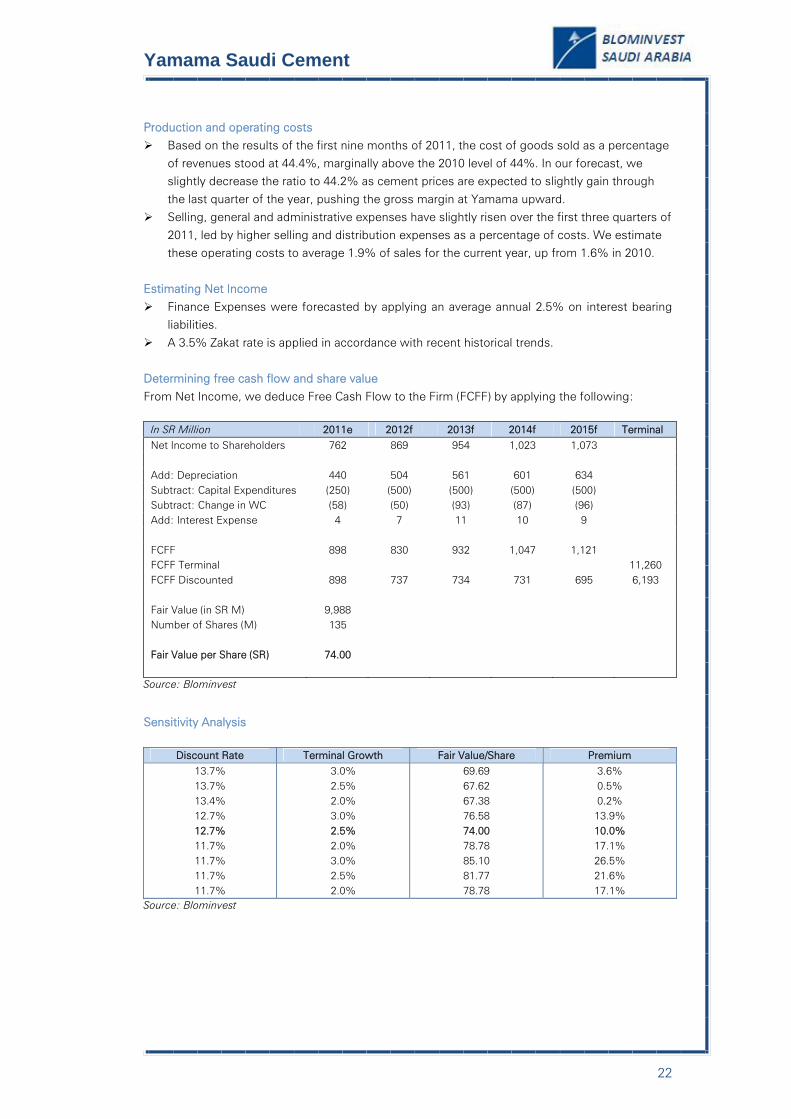
Production and operating costs
Based on the results of the first nine months of 2011, the cost of goods sold as a percentage
of revenues stood at 44.4%, marginally above the 2010 level of 44%. In our forecast, we slightly decrease the ratio to 44.2% as cement prices are expected to slightly gain through
the last quarter of the year, pushing the gross margin at Yamama upward.
Selling, general and administrative expenses have slightly risen over the first three quarters of
2011, led by higher selling and distribution expenses as a percentage of costs. We estimate these operating costs to average 1.9% of sales for the current year, up from 1.6% in 2010.
Estimating Net Income
Finance Expenses were forecasted by applying an average annual 2.5% on interest bearing liabilities.
A 3.5% Zakat rate is applied in accordance with recent historical trends.
Determining free cash flow and share value
From Net Income, we deduce Free Cash Flow to the Firm (FCFF) by applying the following:
In SR Million 2011e 2012f 2013f 2014f 2015f Terminal Net Income to Shareholders 762 869 954 1,023 1,073
Add: Depreciation 440 504 561 601 634
Subtract: Capital Expenditures (250) (500) (500) (500) (500)
Subtract: Change in WC (58) (50) (93) (87) (96)
Add: Interest Expense 4 7 11 10 9
FCFF 898 830 932 1,047 1,121
FCFF Terminal
11,260
FCFF Discounted 898 737 734 731 695 6,193
Fair Value (in SR M) 9,988
Number of Shares (M) 135
Fair Value per Share (SR) 74.00
Source: Blominvest
Sensitivity Analysis
Discount Rate Terminal Growth Fair Value/Share Premium
13.7% 3.0% 69.69 3.6% 13.7% 2.5% 67.62 0.5% 13.4% 2.0% 67.38 0.2% 12.7% 3.0% 76.58 13.9% 12.7% 2.5% 74.00 10.0% 11.7% 2.0% 78.78 17.1% 11.7% 3.0% 85.10 26.5% 11.7% 2.5% 81.77 21.6% 11.7% 2.0% 78.78 17.1%
Source: Blominvest
23
Yamama Saudi Cement
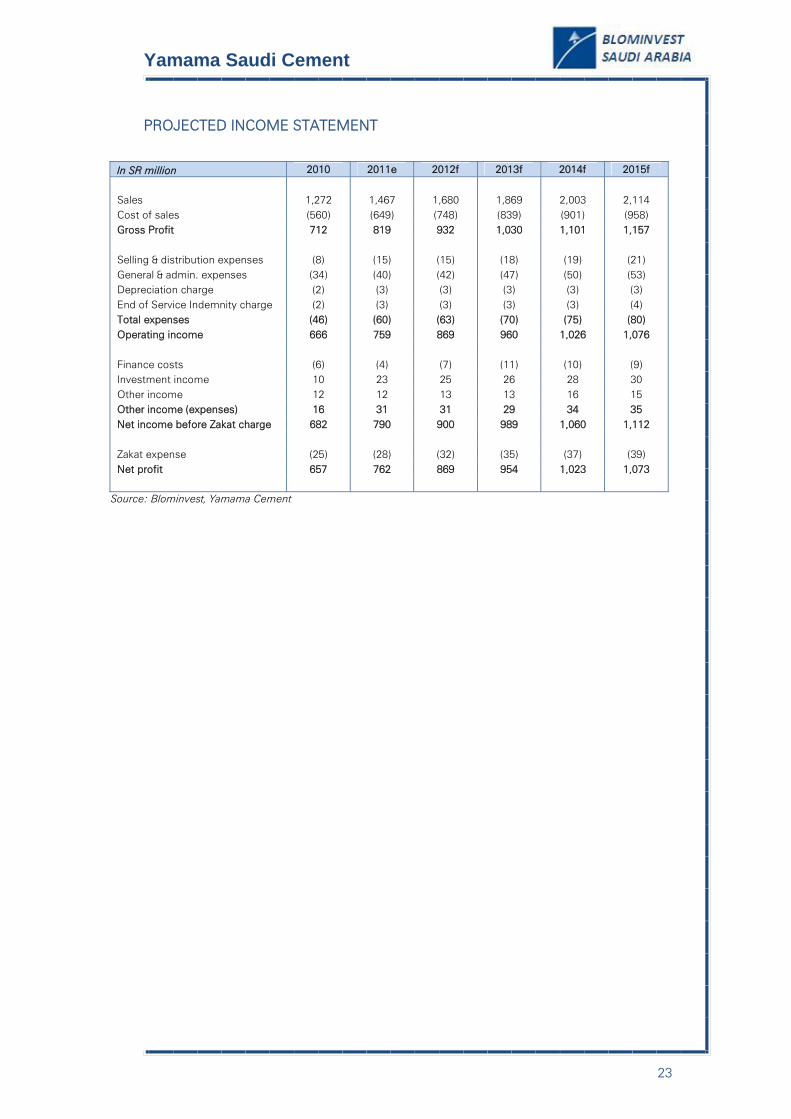
PROJECTED INCOME STATEMENT
In SR million 2010 2011e 2012f 2013f 2014f 2015f
Sales 1,272 1,467 1,680 1,869 2,003 2,114 Cost of sales (560) (649) (748) (839) (901) (958) Gross Profit 712 819 932 1,030 1,101 1,157
Selling & distribution expenses (8) (15) (15) (18) (19) (21) General & admin. expenses (34) (40) (42) (47) (50) (53) Depreciation charge (2) (3) (3) (3) (3) (3) End of Service Indemnity charge (2) (3) (3) (3) (3) (4) Total expenses (46) (60) (63) (70) (75) (80) Operating income 666 759 869 960 1,026 1,076
Finance costs (6) (4) (7) (11) (10) (9) Investment income 10 23 25 26 28 30 Other income 12 12 13 13 16 15 Other income (expenses) 16 31 31 29 34 35 Net income before Zakat charge 682 790 900 989 1,060 1,112
Zakat expense (25) (28) (32) (35) (37) (39) Net profit 657 762 869 954 1,023 1,073
Source: Blominvest, Yamama Cement
24
Yamama Saudi Cement
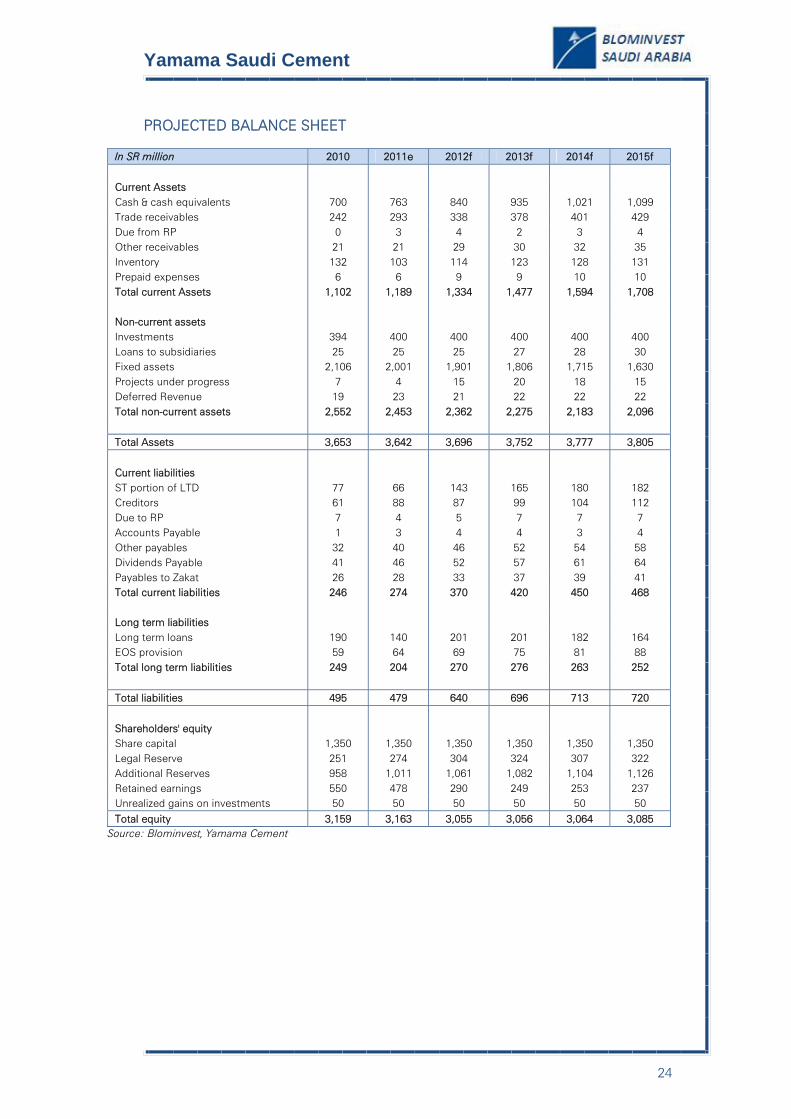
PROJECTED BALANCE SHEET
In SR million 2010 2011e 2012f 2013f 2014f 2015f
Current Assets Cash & cash equivalents 700 763 840 935 1,021 1,099 Trade receivables 242 293 338 378 401 429 Due from RP 0 3 4 2 3 4 Other receivables 21 21 29 30 32 35 Inventory 132 103 114 123 128 131 Prepaid expenses 6 6 9 9 10 10 Total current Assets 1,102 1,189 1,334 1,477 1,594 1,708
Non-current assets
Investments 394 400 400 400 400 400 Loans to subsidiaries 25 25 25 27 28 30 Fixed assets 2,106 2,001 1,901 1,806 1,715 1,630 Projects under progress 7 4 15 20 18 15 Deferred Revenue 19 23 21 22 22 22 Total non-current assets 2,552 2,453 2,362 2,275 2,183 2,096
Total Assets 3,653 3,642 3,696 3,752 3,777 3,805
Current liabilities
ST portion of LTD 77 66 143 165 180 182 Creditors 61 88 87 99 104 112 Due to RP 7 4 5 7 7 7 Accounts Payable 1 3 4 4 3 4 Other payables 32 40 46 52 54 58 Dividends Payable 41 46 52 57 61 64 Payables to Zakat 26 28 33 37 39 41 Total current liabilities 246 274 370 420 450 468
Long term liabilities
Long term loans 190 140 201 201 182 164 EOS provision 59 64 69 75 81 88 Total long term liabilities 249 204 270 276 263 252
Total liabilities 495 479 640 696 713 720
Shareholders' equity Share capital 1,350 1,350 1,350 1,350 1,350 1,350 Legal Reserve 251 274 304 324 307 322 Additional Reserves 958 1,011 1,061 1,082 1,104 1,126 Retained earnings 550 478 290 249 253 237 Unrealized gains on investments 50 50 50 50 50 50 Total equity 3,159 3,163 3,055 3,056 3,064 3,085
Source: Blominvest, Yamama Cement

25
Yamama Saudi Cement
APPENDIX
I - Saudi Arabia Map
II - List of Comparable Peers
Valuation Profitability Management Effectiveness Liquidity
Company Country Mkt Cap (USD M)
P/E P/Rev P/BV Gross
margin (%) Operating margin (%)
Net margin (%)
SGnA/Rev
ROE ROA D/E Quick Ratio
Current Ratio
Southern Province Cement Company SAU 2,855.9 13.2 8.2 4.3 54.5 51.3 50.3 2.1 26.6 23.4 0.0 2.4 3.3 Saudi Cement Company SAU 2,631.5 12.8 6.5 2.9 50.4 44.7 43.2 5.0 20.5 13.8 27.5 0.5 1.2 Yanbu Cement Company SAU 1,679.9 13.3 7.0 2.5 51.9 49.0 48.6 2.8 17.4 12.6 42.4 0.8 1.3 Qassim Cement Company SAU 1,643.9 11.9 6.4 3.3 57.5 53.6 51.7 3.9 27.2 23.5 0.0 3.7 5.0 Qatar National Cement Company QAT 1,483.4 12.9 5.0 2.5 46.7 40.4 42.8 4.9 22.9 18.2 15.0 0.9 2.5 Kuwait Cement Company KSC KWT 1,146.0 22.5 7.1 2.0 39.5 30.1 29.9 7.4 9.1 5.3 53.9 0.7 1.2 Eastern Province Cement Company SAU 1,105.3 12.2 5.1 2.0 47.3 42.8 41.9 3.3 16.6 14.7 3.6 3.3 4.9 Arabian Cement Co. SAU 896.0 9.8 4.5 1.4 42.8 38.7 34.1 5.7 11.0 6.4 57.5 0.8 1.3 Suez Cement Company EGY 717.6 5.1 0.7 0.6 34.5 24.6 23.7 5.2 17.3 14.8 0.4 1.3 1.8 Konya Cimento Sanayii TUR 773.2 45.4 6.8 3.9 28.5 13.8 16.7 14.7 10.1 9.1 0.1 7.4 9.1
Nuh Cimento Sanayi TUR 852.9 24.8 2.1 2.0 13.7 5.4 6.8 8.4 6.6 5.0 15.8 1.7 2.0 Akcansa Cimento Sanayi Ve Ticaret TUR 700.9 16.3 1.6 1.6 13.7 9.5 7.3 4.2 7.2 5.0 24.2 1.3 1.8 Arkan Building Materials Company ARE 528.9 49.9 7.9 1.2 44.6 16.5 21.7 27.2 3.4 2.1 58.1 0.7 1.0 Cimsa Cimento Sanayi ve Ticaret TUR 517.5 7.9 1.4 1.1 26.6 20.6 14.6 6.0 11.5 8.9 13.1 0.8 1.3 Tabuk Cement Company SAU 511.2 14.7 7.0 1.8 49.3 43.8 44.0 5.3 11.5 9.5 0.0 2.2 2.9 Al Khalij Holding Co QSC QAT 518.7 23.8 7.1 1.0 43.7 26.9 26.9 14.2 3.8 2.3 74.2 1.3 1.4 Al Jouf Cement Co SAU 492.2 21.7 17.9 1.5 44.2 18.3 14.3 18.2 1.3 1.1 30.1 4.4 6.0 National Gypsum Company SAU 237.3 26.7 5.8 1.9 40.8 34.1 34.1 4.1 11.2 8.6 9.5 1.3 1.7
Southern Province Cement Company SAU 2,855.9 13.2 8.2 4.3 54.5 51.3 50.3 2.1 26.6 23.4 0.0 2.4 3.3 Average Peers 1,071.8 19.1 6.0 2.1 40.6 31.3 30.7 7.9 13.1 10.2 23.6 2.0 2.8 Average Saudi peers
1,339.2 15.1 7.6 2.4 48.7 41.8 40.2 5.6 15.9 12.6 18.9 2.1 3.1
Yamama SAU 2,447.9 13.0 7.2 2.9 56.0 52.4 51.7 3.3 21.1 17.9 8.5 3.9 4.5 Source: Reuters, Blominvest
Yamama Saudi Cement
BLOMINVEST BANK s.a.l. Research Department
Verdun, Rashid Karameh Str.
POBOX 11-1540 Riad El Soloh
Beirut 1107 2080 Lebanon
Tel: +961 1 991 784
Fax: +961 1 991 732
For your Queries:
Marwan Mikhael, Head of Research [email protected]
+961 1 991 784 Ext: 360
Cathy Hobeika, Equity Analyst
[email protected] +961 1 991 784 Ext: 362
IMPORTANT DISCLAIMER
This research is based on current public information that we consider reliable, but we do not represent it is accurate or complete, and it should not be relied on as such. Blom Bank SAL or BlomInvest SAL can have investment banking and other
business relationships with the companies covered by our research. We may seek investment banking or other business from
the covered companies referred to in this research. Our salespeople, traders, and other professionals may provide oral or written market commentary or trading strategies to our clients and our proprietary trading desks that reflect opinions that are
contrary to the opinions expressed in this research. Our asset management area, our trading desks and investing businesses
may make investment decisions that are inconsistent with the recommendations or views expressed in this research. We and
our affiliates, officers, directors, and employees, excluding equity analysts, will from time to time have long or short positions in, act as principal in, and buy or sell, the securities or derivatives (including options and warrants) thereof of covered
companies referred to in this research. This research is not an offer to sell or the solicitation of an offer to buy any security in
any jurisdiction where such an offer or solicitation would be illegal. It does not constitute a personal recommendation or take
into account the particular investment objectives, financial situations, or needs of individual clients. Clients should consider
whether any advice or recommendation in this research is suitable for their particular circumstances and, if appropriate, seek professional advice. The price and value of the investments referred to in this research and the income from them may
fluctuate. Past performance is not a guide to future performance, future returns are not guaranteed, and a loss of original
capital may occur. Certain transactions, including those involving futures, options, and other derivatives, give rise to
substantial risk and are not suitable for all investors. Fluctuations in exchange rates could have adverse effects on the value or
price of, or income derived from, certain investments. Copyright 2011 BlomInvest SAL.
No part of this material may be copied, photocopied or duplicated in any form by any means or redistributed without the prior
written consent of BlomInvest SAL.
Equity Rating Key Recommendations are based on the upside (downside)
between our 12-month Fair Value estimate and the current
Market Price.
Buy: Fair Value higher than Market Price by at least 20%
Accumulate: Fair Value higher than Market Price by 10%
to 20%
Hold: Fair Value ranges between -5% to +10% in relation to Market Price
Reduce: Fair Value lower than Market Price by 5% to 15%
Sell: Fair Value lower than Market Price by at least 15%
Risks are based on share price volatility along with
qualitative factors such as the nature of the business, the
country risk and sensitivity to a single event, single
product or single buyer. We’ve arranged the risk factor into 5 trenches:
High Risk
Medium-to-High Risk
Medium Risk (similar to Market Risk) Medium-to-Low Risk
Low Risk