Embed Size (px)
Citation preview
Siddharth Rajeev, B.Tech, MBA, CFA
Anthony de Ruijter, BA. Econ
May 7, 2018
2018 Fundamental Research Corp. “15+Years of Bringing Undiscovered Investment Opportunities to the Forefront” www.researchfrc.com
PLEASE READ THE IMPORTANT DISCLOSURES AT THE BACK OF THIS REPORT
YDreams Global Interactive Technologies Inc. (TSXV: YD) – FY2017 Financials, New VR Projects and
Arkave Progress Update
Sector/Industry: Technology www.ydreams.com
Market Data (as of May 7, 2018)
Current Price $0.15
Fair Value $0.40
Rating* BUY
Risk* 4
52 Week Range $0.13-$0.29
Shares O/S 79,303,119
Market Cap $11.90 M
Current Yield N/A
P/E (forward) N/A
P/B N/A
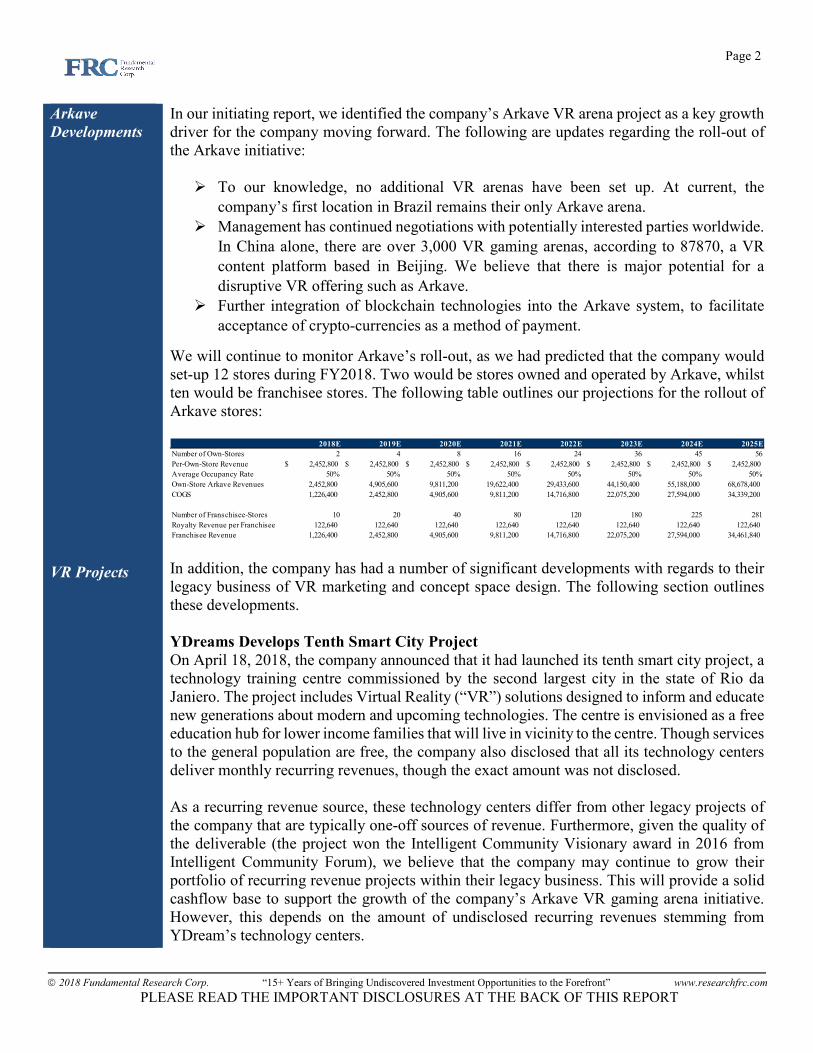
YoY Return -30.43%
YoY TSXV -1.01% *see back of report for rating and risk definitions
Investment Highlights
YDreams Global Interactive Technologies Inc. (“YDreams”, “company”) released end of year financials for FY2017 on April 30, 2018.
The company reported revenues of $1.71 million and a net loss of -$4.58 million, reflecting an EPS of -$0.08 per share.
Revenue declined 67.34% YoY. The sharp decline in revenue was attributed to a shift in corporate strategy focus to new markets and worsened economic conditions in the company’s main market Brazil.
The company has signed a number of notable VR projects in FY2018 and continues to develop and roll-out its Arkave VR arena initiative.
We are maintaining our fair value estimate on the
company’s shares at $0.40 per share, with a BUY rating.
Key Financial Data (FYE - Dec 31)
(C$) 2016 2017 2018E
Revenue 5,234,746$ 1,709,544$ 3,650,527$
Net Income -3,768,077 $ -4,575,750 $ -1,926,873 $
EPS -0.15 $ -0.08 $ -0.02 $
Working Capital 656,791$ -1,205,226 $ -59,910 $
Debt 221,481$ 898,163$ 898,163$
Total Assets 2,037,483$ 514,296$ 2,262,581$
Shareholders' Equity 177,029$ -2,093,799 $ -153,101 $
Page 2
2018 Fundamental Research Corp. “15+ Years of Bringing Undiscovered Investment Opportunities to the Forefront” www.researchfrc.com
PLEASE READ THE IMPORTANT DISCLOSURES AT THE BACK OF THIS REPORT
Arkave
Developments
VR Projects
In our initiating report, we identified the company’s Arkave VR arena project as a key growth driver for the company moving forward. The following are updates regarding the roll-out of the Arkave initiative:
To our knowledge, no additional VR arenas have been set up. At current, the
company’s first location in Brazil remains their only Arkave arena.
Management has continued negotiations with potentially interested parties worldwide.
In China alone, there are over 3,000 VR gaming arenas, according to 87870, a VR
content platform based in Beijing. We believe that there is major potential for a
disruptive VR offering such as Arkave.
Further integration of blockchain technologies into the Arkave system, to facilitate
acceptance of crypto-currencies as a method of payment.
We will continue to monitor Arkave’s roll-out, as we had predicted that the company would set-up 12 stores during FY2018. Two would be stores owned and operated by Arkave, whilst ten would be franchisee stores. The following table outlines our projections for the rollout of Arkave stores:
In addition, the company has had a number of significant developments with regards to their legacy business of VR marketing and concept space design. The following section outlines these developments. YDreams Develops Tenth Smart City Project
On April 18, 2018, the company announced that it had launched its tenth smart city project, a technology training centre commissioned by the second largest city in the state of Rio da Janiero. The project includes Virtual Reality (“VR”) solutions designed to inform and educate new generations about modern and upcoming technologies. The centre is envisioned as a free education hub for lower income families that will live in vicinity to the centre. Though services to the general population are free, the company also disclosed that all its technology centers deliver monthly recurring revenues, though the exact amount was not disclosed. As a recurring revenue source, these technology centers differ from other legacy projects of the company that are typically one-off sources of revenue. Furthermore, given the quality of the deliverable (the project won the Intelligent Community Visionary award in 2016 from Intelligent Community Forum), we believe that the company may continue to grow their portfolio of recurring revenue projects within their legacy business. This will provide a solid cashflow base to support the growth of the company’s Arkave VR gaming arena initiative. However, this depends on the amount of undisclosed recurring revenues stemming from YDream’s technology centers.
2018E 2019E 2020E 2021E 2022E 2023E 2024E 2025E
Number of Own-Stores 2 4 8 16 24 36 45 56
Per-Own-Store Revenue 2,452,800$ 2,452,800$ 2,452,800$ 2,452,800$ 2,452,800$ 2,452,800$ 2,452,800$ 2,452,800$
Average Occupancy Rate 50% 50% 50% 50% 50% 50% 50% 50%
Own-Store Arkave Revenues 2,452,800 4,905,600 9,811,200 19,622,400 29,433,600 44,150,400 55,188,000 68,678,400
COGS 1,226,400 2,452,800 4,905,600 9,811,200 14,716,800 22,075,200 27,594,000 34,339,200
Number of Franschisee-Stores 10 20 40 80 120 180 225 281
Royalty Revenue per Franchisee 122,640 122,640 122,640 122,640 122,640 122,640 122,640 122,640
Franchisee Revenue 1,226,400 2,452,800 4,905,600 9,811,200 14,716,800 22,075,200 27,594,000 34,461,840
Page 3
2018 Fundamental Research Corp. “15+ Years of Bringing Undiscovered Investment Opportunities to the Forefront” www.researchfrc.com
PLEASE READ THE IMPORTANT DISCLOSURES AT THE BACK OF THIS REPORT
YDreams Signs Agreement to Develop a VR Project with an Undisclosed Global Energy
Company
On April 4, 2018, the company announced that it had signed an agreement with an undisclosed major energy company to develop an educational game incorporating virtual reality (“VR”). The game is aimed towards children and young adults and will focus upon energy conservation and sustainability. The game will be brought to schools, community associations, and similar events as part of a larger community outreach by the undisclosed energy company. Though YDreams did not disclose the identity of the company, they did disclose that energy company operates in 35 countries, maintains 2.2 million kilometers of grid network across five continents, and a net installed capacity of approximately 85 giga-watts. Based on the description, we believe the company to be Enel Group (BIT: ENEL), a multi-national Italian electricity and gas company. Though details are scarce, and the agreement appears to be in early stages, we see the development as another positive step for company’s legacy operations. Until their Arkave initiative rolls out further, the project-based revenue streams of the company will continue to be key to their earnings. YDreams Rolls Out VR Exhibition, High Visitor Traffic Expected
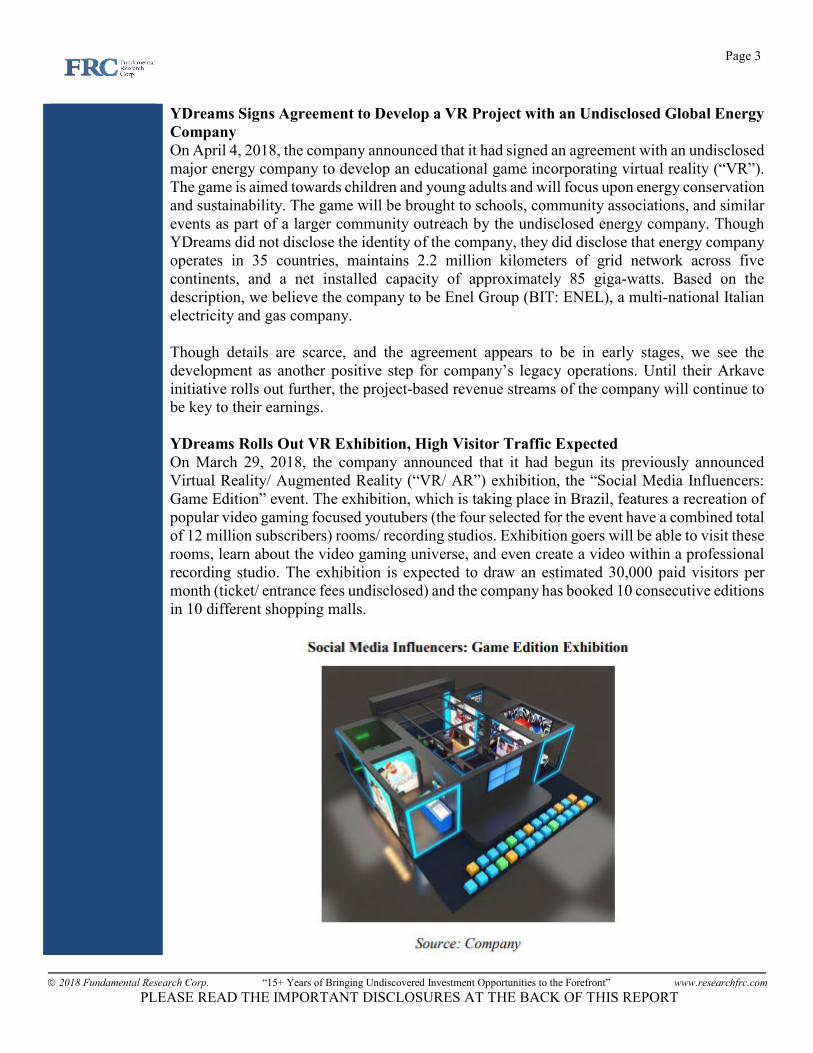
On March 29, 2018, the company announced that it had begun its previously announced Virtual Reality/ Augmented Reality (“VR/ AR”) exhibition, the “Social Media Influencers: Game Edition” event. The exhibition, which is taking place in Brazil, features a recreation of popular video gaming focused youtubers (the four selected for the event have a combined total of 12 million subscribers) rooms/ recording studios. Exhibition goers will be able to visit these rooms, learn about the video gaming universe, and even create a video within a professional recording studio. The exhibition is expected to draw an estimated 30,000 paid visitors per month (ticket/ entrance fees undisclosed) and the company has booked 10 consecutive editions in 10 different shopping malls.
Page 4
2018 Fundamental Research Corp. “15+ Years of Bringing Undiscovered Investment Opportunities to the Forefront” www.researchfrc.com
PLEASE READ THE IMPORTANT DISCLOSURES AT THE BACK OF THIS REPORT
The company also announced that it had secured LG Electronics Inc. (KRX: 066570) as a major sponsor of the event. LG Electronics will feature their new gaming monitor at the event. Other sponsors include Gameloft, Razer (HKG: 1337), DXRacer and the sports portal EI. The main sponsor of the event is Sonae Sierra Brasil (BVMF: SSBR3). According to the company, the event format is becoming successful in terms of revenue generation, with management expecting to replicate the exhibition internationally. The company reports that they are in negations to set up similar exhibitions covering various scopes in North America. We see this as a positive development for the company, as we had expected revenues from the legacy portion of their business to remain relatively static. However, this exhibition format, whilst unlikely to be a major growth catalyst (in our opinion), may provide significant legacy operations revenue growth all the same. YDreams Joins Dreams2B and BC Tech Association’s THE CUBE to Create Start-up
Acceleration Program
On March 12, 2018, YDreams announced that the company had entered into a partnership with Dreams2B and THE CUBE, with the goal of selecting and training VR/ AR start-up companies from Brazil that intend to develop and explore the Canadian VR/ AR market. Dreams2B is an international venture builder that specializes in accelerating Brazilian start-ups in the Canadian Market, and THE CUBE is a co-working space with over 6,000 square-feet that is tailored towards VR/ AR development. The program is currently being referred to as the XR Canada International Acceleration Program and is the first program tailored to providing Brazilian technology start-ups access to the Canadian markets. As part of the program, up to eight start-ups will be selected to participate in workshops and mentorships. B2B meetings and investor meetings will also be set-up to facilitate the development of the selected start-ups. The program is anticipated to last four weeks and will take place in Vancouver, British Columbia. Costs of the program will be covered by a private fund. Selected start-ups will also be invited to attend the BC Tech Summit. By co-leading this partnership, YDreams not only cultivates the next generation of Brazilian human capital and key talent, but also positions itself to be the first to benefit from potential strategic acquisitions. With the initiation of their Arkave venture, YDreams stands to benefit from the technology of selected VR/ AR start-ups, which can improve YDream’s existing VR/ AR offerings whilst also potentially opening new verticals.
Page 5
2018 Fundamental Research Corp. “15+ Years of Bringing Undiscovered Investment Opportunities to the Forefront” www.researchfrc.com
PLEASE READ THE IMPORTANT DISCLOSURES AT THE BACK OF THIS REPORT
Financials
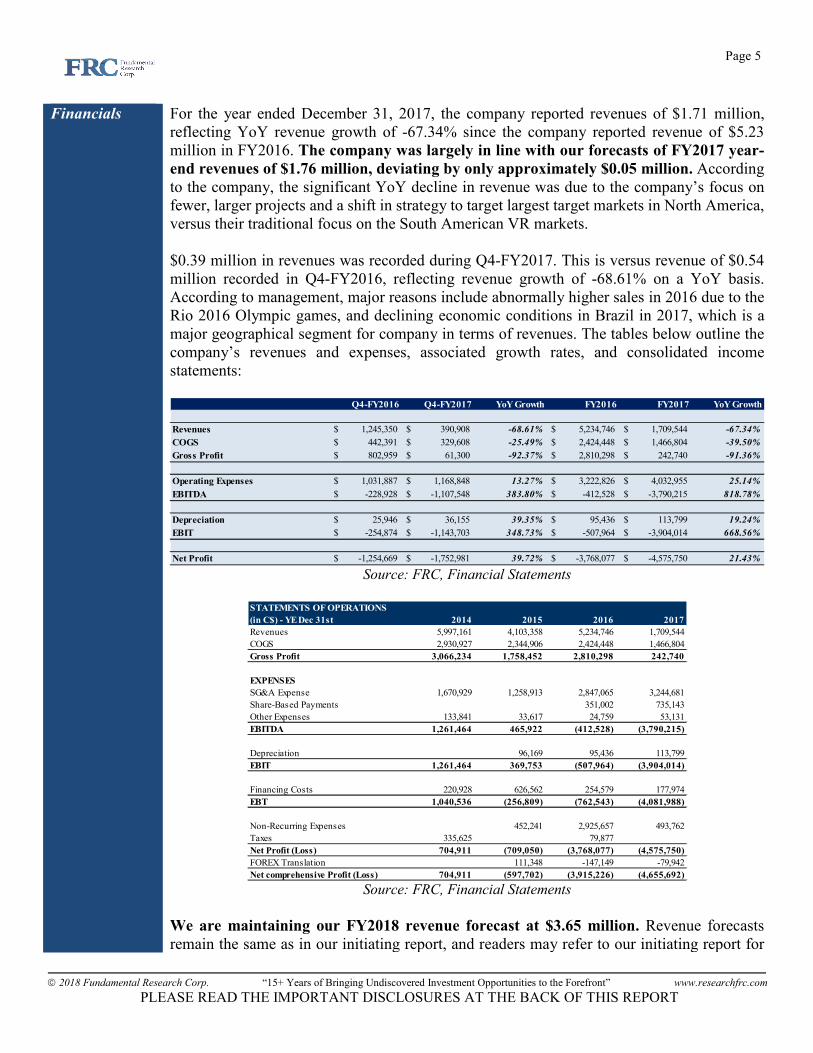
For the year ended December 31, 2017, the company reported revenues of $1.71 million, reflecting YoY revenue growth of -67.34% since the company reported revenue of $5.23 million in FY2016. The company was largely in line with our forecasts of FY2017 year-
end revenues of $1.76 million, deviating by only approximately $0.05 million. According to the company, the significant YoY decline in revenue was due to the company’s focus on fewer, larger projects and a shift in strategy to target largest target markets in North America, versus their traditional focus on the South American VR markets. $0.39 million in revenues was recorded during Q4-FY2017. This is versus revenue of $0.54 million recorded in Q4-FY2016, reflecting revenue growth of -68.61% on a YoY basis. According to management, major reasons include abnormally higher sales in 2016 due to the Rio 2016 Olympic games, and declining economic conditions in Brazil in 2017, which is a major geographical segment for company in terms of revenues. The tables below outline the company’s revenues and expenses, associated growth rates, and consolidated income statements:
Source: FRC, Financial Statements
Source: FRC, Financial Statements
We are maintaining our FY2018 revenue forecast at $3.65 million. Revenue forecasts remain the same as in our initiating report, and readers may refer to our initiating report for
Q4-FY2016 Q4-FY2017 YoY Growth FY2016 FY2017 YoY Growth
Revenues 1,245,350$ 390,908$ -68.61% 5,234,746$ 1,709,544$ -67.34%
COGS 442,391$ 329,608$ -25.49% 2,424,448$ 1,466,804$ -39.50%
Gross Profit 802,959$ 61,300$ -92.37% 2,810,298$ 242,740$ -91.36%
Operating Expenses 1,031,887$ 1,168,848$ 13.27% 3,222,826$ 4,032,955$ 25.14%
EBITDA -228,928 $ -1,107,548 $ 383.80% -412,528 $ -3,790,215 $ 818.78%
Depreciation 25,946$ 36,155$ 39.35% 95,436$ 113,799$ 19.24%
EBIT -254,874 $ -1,143,703 $ 348.73% -507,964 $ -3,904,014 $ 668.56%
Net Profit -1,254,669 $ -1,752,981 $ 39.72% -3,768,077 $ -4,575,750 $ 21.43%
STATEMENTS OF OPERATIONS
(in C$) - YE Dec 31st 2014 2015 2016 2017
Revenues 5,997,161 4,103,358 5,234,746 1,709,544
COGS 2,930,927 2,344,906 2,424,448 1,466,804
Gross Profit 3,066,234 1,758,452 2,810,298 242,740
EXPENSES
SG&A Expense 1,670,929 1,258,913 2,847,065 3,244,681
Share-Based Payments 351,002 735,143
Other Expenses 133,841 33,617 24,759 53,131
EBITDA 1,261,464 465,922 (412,528) (3,790,215)
Depreciation 96,169 95,436 113,799
EBIT 1,261,464 369,753 (507,964) (3,904,014)
Financing Costs 220,928 626,562 254,579 177,974
EBT 1,040,536 (256,809) (762,543) (4,081,988)
Non-Recurring Expenses 452,241 2,925,657 493,762
Taxes 335,625 79,877
Net Profit (Loss) 704,911 (709,050) (3,768,077) (4,575,750)
FOREX Translation 111,348 -147,149 -79,942
Net comprehensive Profit (Loss) 704,911 (597,702) (3,915,226) (4,655,692)
Page 6
2018 Fundamental Research Corp. “15+ Years of Bringing Undiscovered Investment Opportunities to the Forefront” www.researchfrc.com
PLEASE READ THE IMPORTANT DISCLOSURES AT THE BACK OF THIS REPORT
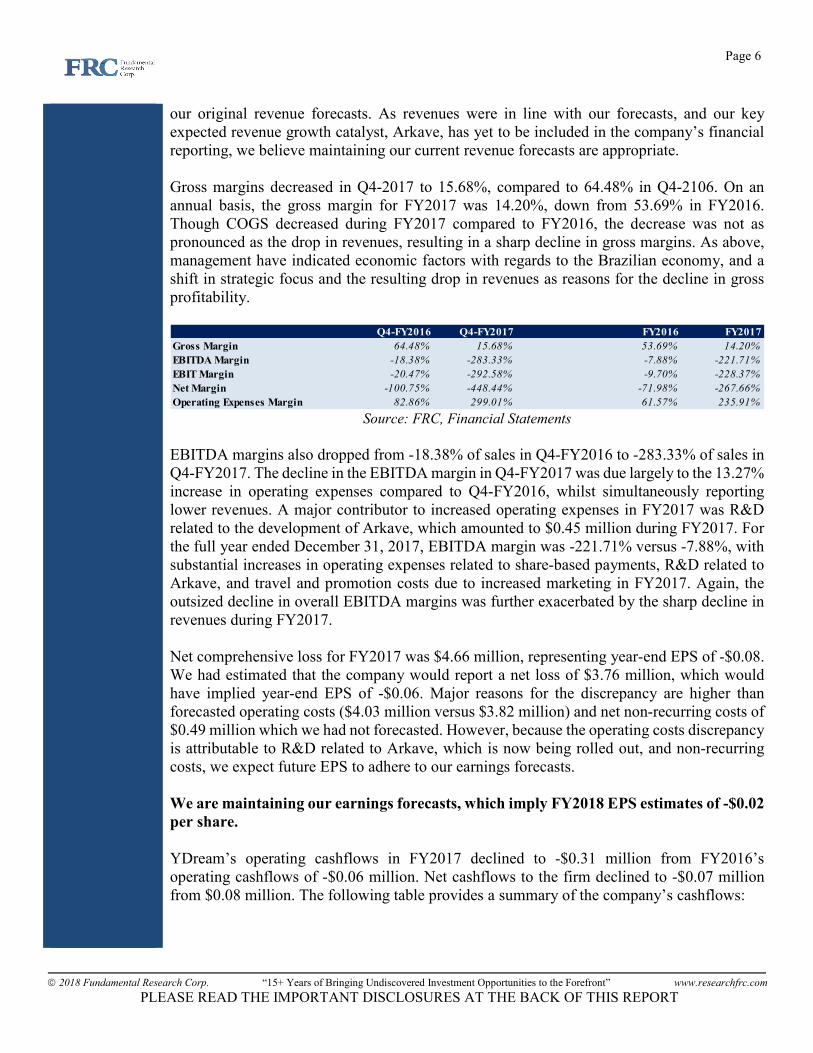
our original revenue forecasts. As revenues were in line with our forecasts, and our key expected revenue growth catalyst, Arkave, has yet to be included in the company’s financial reporting, we believe maintaining our current revenue forecasts are appropriate. Gross margins decreased in Q4-2017 to 15.68%, compared to 64.48% in Q4-2106. On an annual basis, the gross margin for FY2017 was 14.20%, down from 53.69% in FY2016. Though COGS decreased during FY2017 compared to FY2016, the decrease was not as pronounced as the drop in revenues, resulting in a sharp decline in gross margins. As above, management have indicated economic factors with regards to the Brazilian economy, and a shift in strategic focus and the resulting drop in revenues as reasons for the decline in gross profitability.
Source: FRC, Financial Statements
EBITDA margins also dropped from -18.38% of sales in Q4-FY2016 to -283.33% of sales in Q4-FY2017. The decline in the EBITDA margin in Q4-FY2017 was due largely to the 13.27% increase in operating expenses compared to Q4-FY2016, whilst simultaneously reporting lower revenues. A major contributor to increased operating expenses in FY2017 was R&D related to the development of Arkave, which amounted to $0.45 million during FY2017. For the full year ended December 31, 2017, EBITDA margin was -221.71% versus -7.88%, with substantial increases in operating expenses related to share-based payments, R&D related to Arkave, and travel and promotion costs due to increased marketing in FY2017. Again, the outsized decline in overall EBITDA margins was further exacerbated by the sharp decline in revenues during FY2017. Net comprehensive loss for FY2017 was $4.66 million, representing year-end EPS of -$0.08. We had estimated that the company would report a net loss of $3.76 million, which would have implied year-end EPS of -$0.06. Major reasons for the discrepancy are higher than forecasted operating costs ($4.03 million versus $3.82 million) and net non-recurring costs of $0.49 million which we had not forecasted. However, because the operating costs discrepancy is attributable to R&D related to Arkave, which is now being rolled out, and non-recurring costs, we expect future EPS to adhere to our earnings forecasts. We are maintaining our earnings forecasts, which imply FY2018 EPS estimates of -$0.02
per share.
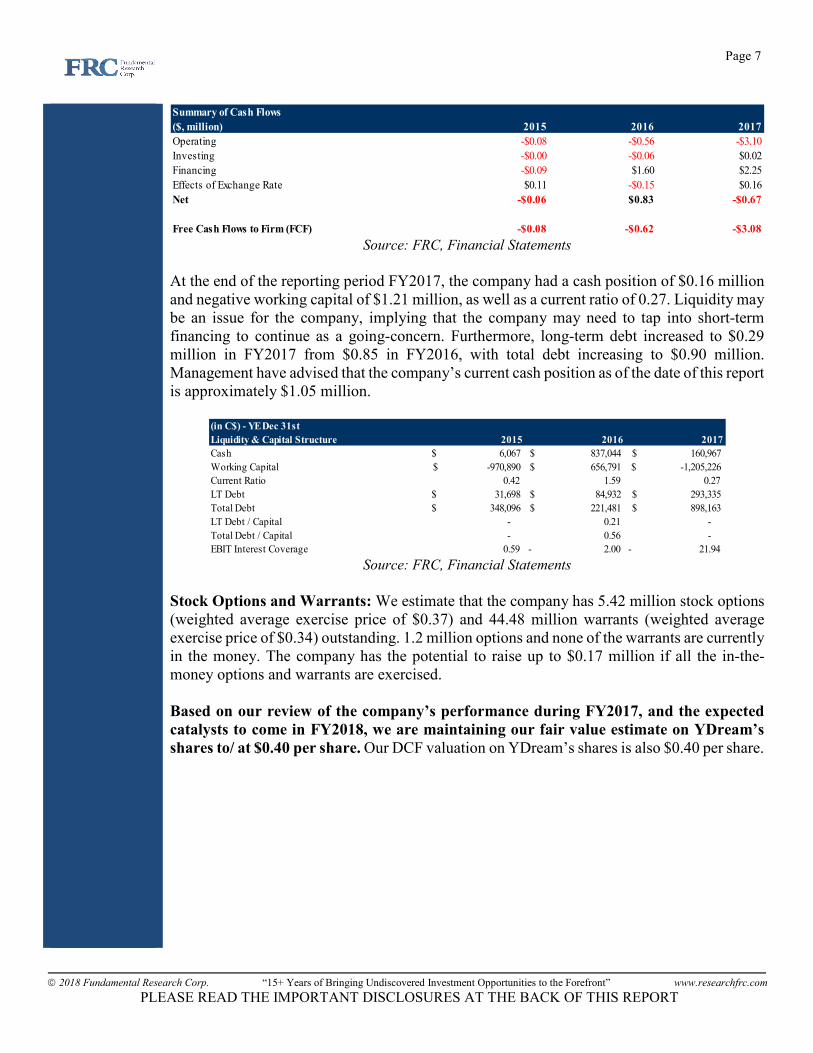
YDream’s operating cashflows in FY2017 declined to -$0.31 million from FY2016’s operating cashflows of -$0.06 million. Net cashflows to the firm declined to -$0.07 million from $0.08 million. The following table provides a summary of the company’s cashflows:
Q4-FY2016 Q4-FY2017 YoY Growth FY2016 FY2017
Gross Margin 64.48% 15.68% 53.69% 14.20%
EBITDA Margin -18.38% -283.33% -7.88% -221.71%
EBIT Margin -20.47% -292.58% -9.70% -228.37%
Net Margin -100.75% -448.44% -71.98% -267.66%
Operating Expenses Margin 82.86% 299.01% 61.57% 235.91%
Page 7
2018 Fundamental Research Corp. “15+ Years of Bringing Undiscovered Investment Opportunities to the Forefront” www.researchfrc.com
PLEASE READ THE IMPORTANT DISCLOSURES AT THE BACK OF THIS REPORT
Source: FRC, Financial Statements
At the end of the reporting period FY2017, the company had a cash position of $0.16 million and negative working capital of $1.21 million, as well as a current ratio of 0.27. Liquidity may be an issue for the company, implying that the company may need to tap into short-term financing to continue as a going-concern. Furthermore, long-term debt increased to $0.29 million in FY2017 from $0.85 in FY2016, with total debt increasing to $0.90 million. Management have advised that the company’s current cash position as of the date of this report is approximately $1.05 million.
Source: FRC, Financial Statements
Stock Options and Warrants: We estimate that the company has 5.42 million stock options (weighted average exercise price of $0.37) and 44.48 million warrants (weighted average exercise price of $0.34) outstanding. 1.2 million options and none of the warrants are currently in the money. The company has the potential to raise up to $0.17 million if all the in-the-money options and warrants are exercised.
Based on our review of the company’s performance during FY2017, and the expected
catalysts to come in FY2018, we are maintaining our fair value estimate on YDream’s
shares to/ at $0.40 per share. Our DCF valuation on YDream’s shares is also $0.40 per share.
Summary of Cash Flows
($, million) 2015 2016 2017
Operating -$0.08 -$0.56 -$3.10
Investing -$0.00 -$0.06 $0.02
Financing -$0.09 $1.60 $2.25
Effects of Exchange Rate $0.11 -$0.15 $0.16
Net -$0.06 $0.83 -$0.67
Free Cash Flows to Firm (FCF) -$0.08 -$0.62 -$3.08
(in C$) - YE Dec 31st
Liquidity & Capital Structure 2015 2016 2017
Cash 6,067$ 837,044$ 160,967$
Working Capital -970,890 $ 656,791$ -1,205,226 $
Current Ratio 0.42 1.59 0.27
LT Debt 31,698$ 84,932$ 293,335$
Total Debt 348,096$ 221,481$ 898,163$
LT Debt / Capital - 0.21 -
Total Debt / Capital - 0.56 -
EBIT Interest Coverage 0.59 2.00- 21.94-
Page 8
2018 Fundamental Research Corp. “15+ Years of Bringing Undiscovered Investment Opportunities to the Forefront” www.researchfrc.com
PLEASE READ THE IMPORTANT DISCLOSURES AT THE BACK OF THIS REPORT
Risks
We believe the company is exposed to the following risks (list is non-exhaustive):
The company’s valuation is dependent on success of their Arkave franchise, which has yet to generate significant revenues.
The company operates in an industry that is in its early stages. Therefore, it is difficult to determine long-term industry growth rates
The company lacks a track record of profitability. Liquidity risk. Solvency risk. Volatility in revenue and earnings. Exchange rate risk. Access to capital and share dilution.
We are initiating coverage with a risk rating of 4 (Speculative).
Page 9
2018 Fundamental Research Corp. “15+ Years of Bringing Undiscovered Investment Opportunities to the Forefront” www.researchfrc.com
PLEASE READ THE IMPORTANT DISCLOSURES AT THE BACK OF THIS REPORT
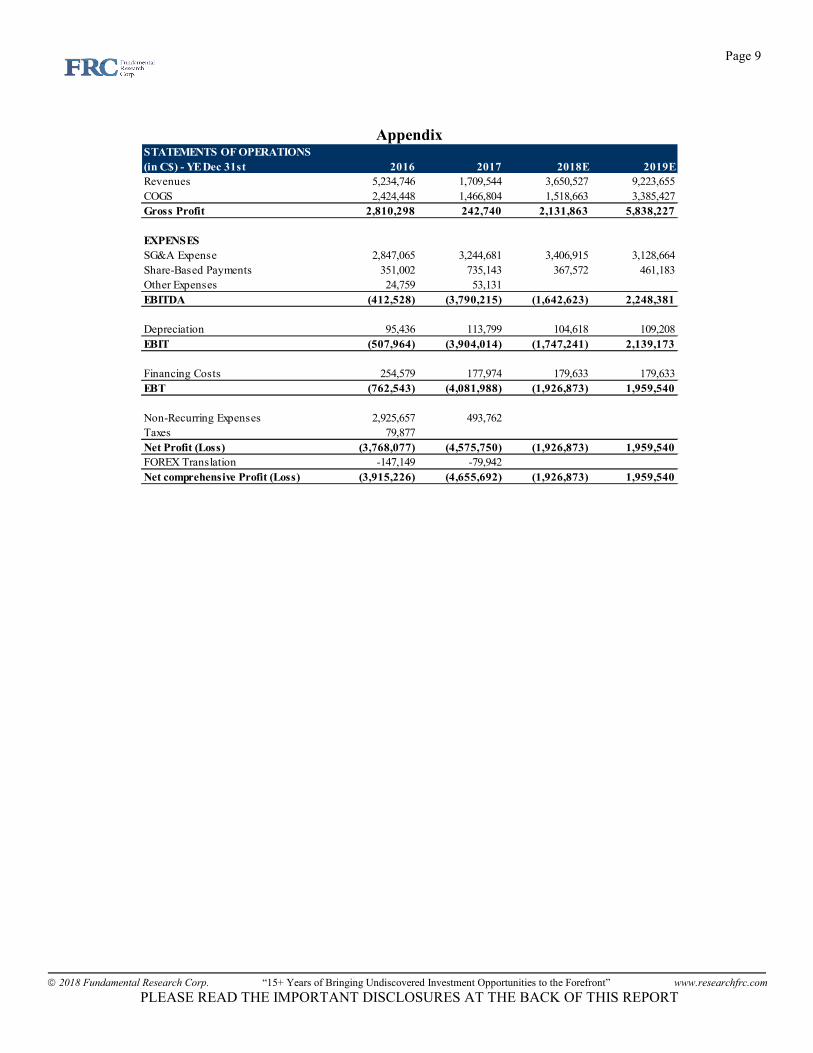
Appendix
STATEMENTS OF OPERATIONS
(in C$) - YE Dec 31st 2016 2017 2018E 2019E
Revenues 5,234,746 1,709,544 3,650,527 9,223,655
COGS 2,424,448 1,466,804 1,518,663 3,385,427
Gross Profit 2,810,298 242,740 2,131,863 5,838,227
EXPENSES
SG&A Expense 2,847,065 3,244,681 3,406,915 3,128,664
Share-Based Payments 351,002 735,143 367,572 461,183
Other Expenses 24,759 53,131
EBITDA (412,528) (3,790,215) (1,642,623) 2,248,381
Depreciation 95,436 113,799 104,618 109,208
EBIT (507,964) (3,904,014) (1,747,241) 2,139,173
Financing Costs 254,579 177,974 179,633 179,633
EBT (762,543) (4,081,988) (1,926,873) 1,959,540
Non-Recurring Expenses 2,925,657 493,762
Taxes 79,877
Net Profit (Loss) (3,768,077) (4,575,750) (1,926,873) 1,959,540
FOREX Translation -147,149 -79,942
Net comprehensive Profit (Loss) (3,915,226) (4,655,692) (1,926,873) 1,959,540
Page 10
2018 Fundamental Research Corp. “15+ Years of Bringing Undiscovered Investment Opportunities to the Forefront” www.researchfrc.com
PLEASE READ THE IMPORTANT DISCLOSURES AT THE BACK OF THIS REPORT
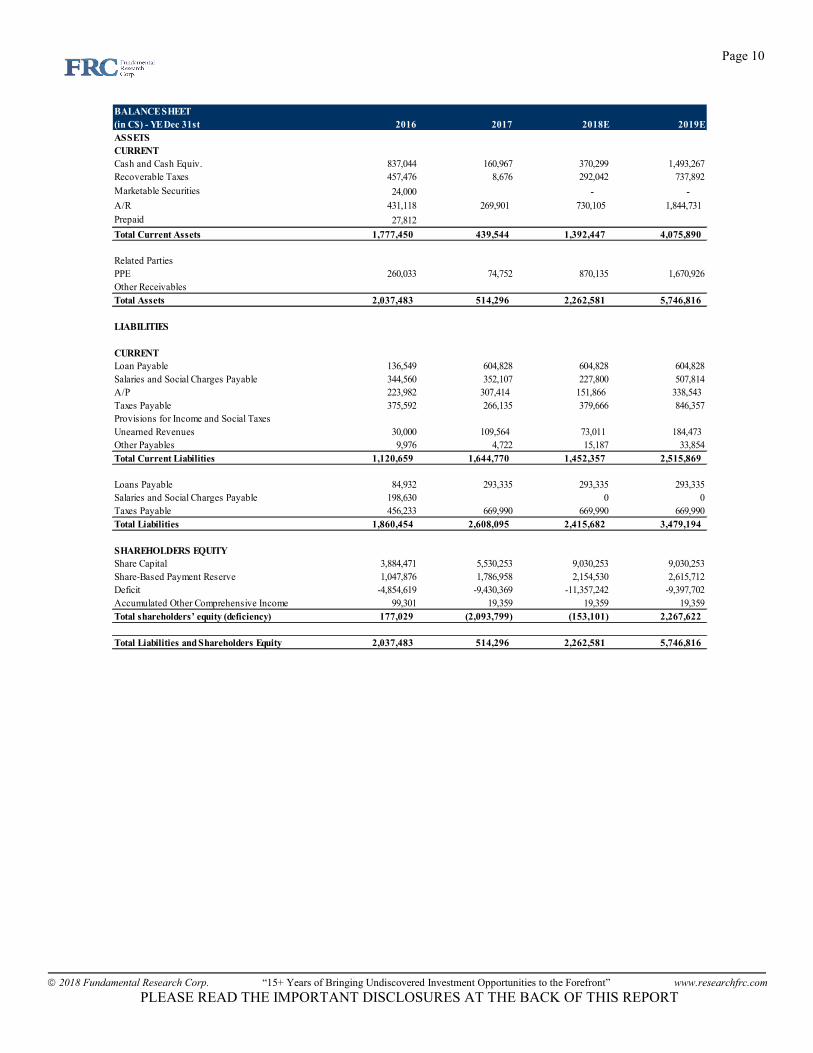
BALANCE SHEET
(in C$) - YE Dec 31st 2016 2017 2018E 2019E
ASSETS
CURRENT
Cash and Cash Equiv. 837,044 160,967 370,299 1,493,267
Recoverable Taxes 457,476 8,676 292,042 737,892
Marketable Securities 24,000 - -
A/R 431,118 269,901 730,105 1,844,731
Prepaid 27,812
Total Current Assets 1,777,450 439,544 1,392,447 4,075,890
Related Parties
PPE 260,033 74,752 870,135 1,670,926
Other Receivables
Total Assets 2,037,483 514,296 2,262,581 5,746,816
LIABILITIES
CURRENT
Loan Payable 136,549 604,828 604,828 604,828
Salaries and Social Charges Payable 344,560 352,107 227,800 507,814
A/P 223,982 307,414 151,866 338,543
Taxes Payable 375,592 266,135 379,666 846,357
Provisions for Income and Social Taxes
Unearned Revenues 30,000 109,564 73,011 184,473
Other Payables 9,976 4,722 15,187 33,854
Total Current Liabilities 1,120,659 1,644,770 1,452,357 2,515,869
Loans Payable 84,932 293,335 293,335 293,335
Salaries and Social Charges Payable 198,630 0 0
Taxes Payable 456,233 669,990 669,990 669,990
Total Liabilities 1,860,454 2,608,095 2,415,682 3,479,194
SHAREHOLDERS EQUITY
Share Capital 3,884,471 5,530,253 9,030,253 9,030,253
Share-Based Payment Reserve 1,047,876 1,786,958 2,154,530 2,615,712
Deficit -4,854,619 -9,430,369 -11,357,242 -9,397,702
Accumulated Other Comprehensive Income 99,301 19,359 19,359 19,359
Total shareholders’ equity (deficiency) 177,029 (2,093,799) (153,101) 2,267,622
Total Liabilities and Shareholders Equity 2,037,483 514,296 2,262,581 5,746,816
Page 11
2018 Fundamental Research Corp. “15+ Years of Bringing Undiscovered Investment Opportunities to the Forefront” www.researchfrc.com
PLEASE READ THE IMPORTANT DISCLOSURES AT THE BACK OF THIS REPORT
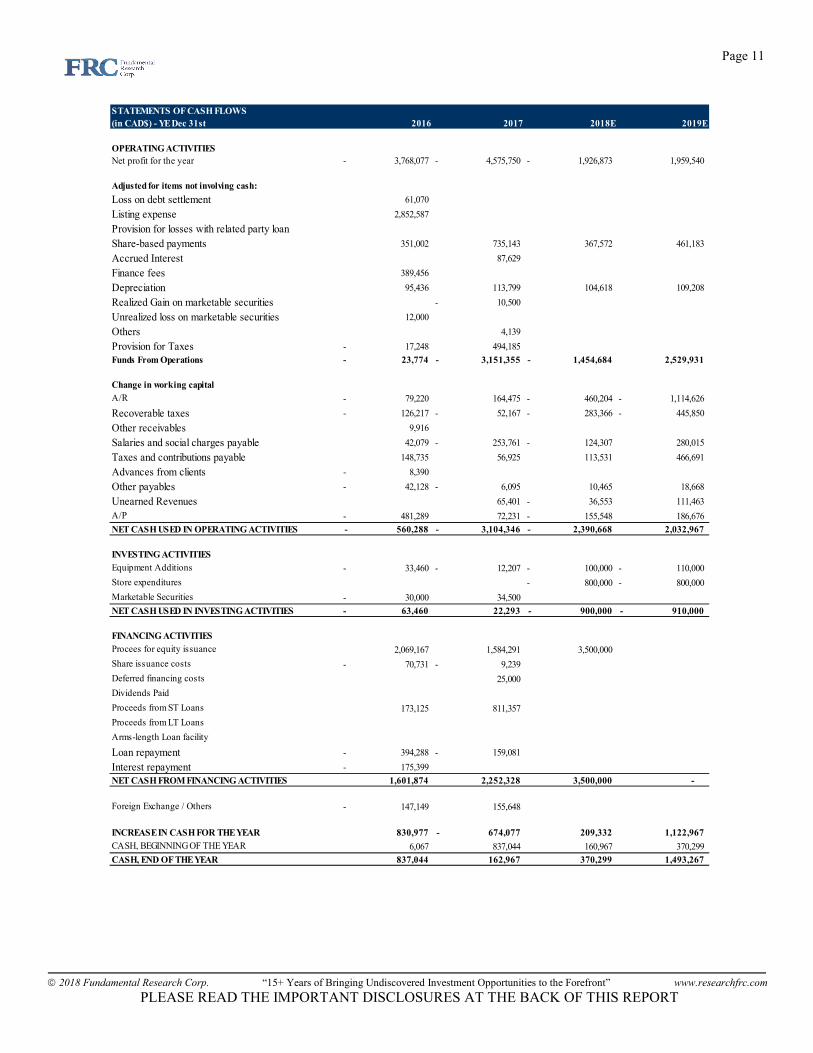
STATEMENTS OF CASH FLOWS
(in CAD$) - YE Dec 31st 2016 2017 2018E 2019E
OPERATING ACTIVITIES
Net profit for the year 3,768,077- 4,575,750- 1,926,873- 1,959,540
Adjusted for items not involving cash:
Loss on debt settlement 61,070
Listing expense 2,852,587
Provision for losses with related party loan
Share-based payments 351,002 735,143 367,572 461,183
Accrued Interest 87,629
Finance fees 389,456
Depreciation 95,436 113,799 104,618 109,208
Realized Gain on marketable securities 10,500-
Unrealized loss on marketable securities 12,000
Others 4,139
Provision for Taxes 17,248- 494,185
Funds From Operations 23,774- 3,151,355- 1,454,684- 2,529,931
Change in working capital
A/R 79,220- 164,475 460,204- 1,114,626-
Recoverable taxes 126,217- 52,167- 283,366- 445,850-
Other receivables 9,916
Salaries and social charges payable 42,079 253,761- 124,307- 280,015
Taxes and contributions payable 148,735 56,925 113,531 466,691
Advances from clients 8,390-
Other payables 42,128- 6,095- 10,465 18,668
Unearned Revenues 65,401 36,553- 111,463
A/P 481,289- 72,231 155,548- 186,676
NET CASH USED IN OPERATING ACTIVITIES 560,288- 3,104,346- 2,390,668- 2,032,967
INVESTING ACTIVITIES
Equipment Additions 33,460- 12,207- 100,000- 110,000-
Store expenditures 800,000- 800,000-
Marketable Securities 30,000- 34,500
NET CASH USED IN INVESTING ACTIVITIES 63,460- 22,293 900,000- 910,000-
FINANCING ACTIVITIES
Procees for equity issuance 2,069,167 1,584,291 3,500,000
Share issuance costs 70,731- 9,239-
Deferred financing costs 25,000
Dividends Paid
Proceeds from ST Loans 173,125 811,357
Proceeds from LT Loans
Arms-length Loan facility
Loan repayment 394,288- 159,081-
Interest repayment 175,399-
NET CASH FROM FINANCING ACTIVITIES 1,601,874 2,252,328 3,500,000 -
Foreign Exchange / Others 147,149- 155,648
INCREASE IN CASH FOR THE YEAR 830,977 674,077- 209,332 1,122,967
CASH, BEGINNING OF THE YEAR 6,067 837,044 160,967 370,299
CASH, END OF THE YEAR 837,044 162,967 370,299 1,493,267
Page 12
2018 Fundamental Research Corp. “15+ Years of Bringing Undiscovered Investment Opportunities to the Forefront” www.researchfrc.com
PLEASE READ THE IMPORTANT DISCLOSURES AT THE BACK OF THIS REPORT
Fundamental Research Corp. Equity Rating Scale:
Buy – Annual expected rate of return exceeds 12% or the expected return is commensurate with risk Hold – Annual expected rate of return is between 5% and 12% Sell – Annual expected rate of return is below 5% or the expected return is not commensurate with risk Suspended or Rating N/A— Coverage and ratings suspended until more information can be obtained from the company regarding recent events. Fundamental Research Corp. Risk Rating Scale:
1 (Low Risk) - The company operates in an industry where it has a strong position (for example a monopoly, high market share etc.) or operates in a regulated industry. The future outlook is stable or positive for the industry. The company generates positive free cash flow and has a history of profitability. The capital structure is conservative with little or no debt. 2 (Below Average Risk) - The company operates in an industry where the fundamentals and outlook are positive. The industry and company are relatively less sensitive to systematic risk than companies with a Risk Rating of 3. The company has a history of profitability and has demonstrated its ability to generate positive free cash flows (though current free cash flow may be negative due to capital investment). The company’s capital structure is conservative with little to modest use of debt. 3 (Average Risk) - The company operates in an industry that has average sensitivity to systematic risk. The industry may be cyclical. Profits and cash flow are sensitive to economic factors although the company has demonstrated its ability to generate positive earnings and cash flow. Debt use is in line with industry averages, and coverage ratios are sufficient. 4 (Speculative) - The company has little or no history of generating earnings or cash flow. Debt use is higher. These companies may be in start-up mode or in a turnaround situation. These companies should be considered speculative. 5 (Highly Speculative) - The company has no history of generating earnings or cash flow. They may operate in a new industry with new, and unproven products. Products may be at the development stage, testing, or seeking regulatory approval. These companies may run into liquidity issues, and may rely on external funding. These stocks are considered highly speculative.
Disclaimers and Disclosure
The opinions expressed in this report are the true opinions of the analyst about this company and industry. Any “forward looking statements” are our best estimates and opinions based upon information that is publicly available and that we believe to be correct, but we have not independently verified with respect to truth or correctness. There is no guarantee that our forecasts will materialize. Actual results will likely vary. The Analyst and FRC do not own shares of the subject company. Fees were paid by YD to FRC. The purpose of the fee is to subsidize the high costs of research and monitoring. FRC takes steps to ensure independence including setting fees in advance and utilizing analysts who must abide by CFA Institute Code of Ethics and Standards of Professional Conduct. Additionally, analysts may not trade in any security under coverage. Our full editorial control of all research, timing of release of the reports, and release of liability for negative reports are protected contractually. To further ensure independence, SNN has agreed to a minimum coverage term including an initial report and three updates. Coverage cannot be unilaterally terminated. Distribution procedure: our reports are distributed first to our web-based subscribers on the date shown on this report then made available to delayed access users through various other channels for a limited time. The distribution of FRC’s ratings are as follows: BUY (72%), HOLD (7%), SELL / SUSPEND (21%). To subscribe for real-time access to research, visit http://www.researchfrc.com/subscribe.php for subscription options. This report contains "forward looking" statements. Forward-looking statements regarding the Company and/or stock’s performance inherently involve risks and uncertainties that could cause actual results to differ from such forward-looking statements. Factors that would cause or contribute to such differences include, but are not limited to, continued acceptance of the Company's products/services in the marketplace; acceptance in the marketplace of the Company's new product lines/services; competitive factors; new product/service introductions by others; technological changes; dependence on suppliers; systematic market risks and other risks discussed in the Company's periodic report filings, including interim reports, annual reports, and annual information forms filed with the various securities regulators. By making these forward looking statements, Fundamental Research Corp. and the analyst/author of this report undertakes no obligation to update these statements for revisions or changes after the date of this report. A report initiating coverage will most often be updated quarterly while a report issuing a rating may have no further or less frequent updates because the subject company is likely to be in earlier stages where nothing material may occur quarter to quarter. Fundamental Research Corp DOES NOT MAKE ANY WARRANTIES, EXPRESSED OR IMPLIED, AS TO RESULTS TO BE OBTAINED FROM USING THIS INFORMATION AND MAKES NO EXPRESS OR IMPLIED WARRANTIES OR FITNESS FOR A PARTICULAR USE. ANYONE USING THIS REPORT ASSUMES FULL RESPONSIBILITY FOR WHATEVER RESULTS THEY OBTAIN FROM WHATEVER USE THE INFORMATION WAS PUT TO. ALWAYS TALK TO YOUR FINANCIAL ADVISOR BEFORE YOU INVEST. WHETHER A STOCK SHOULD BE INCLUDED IN A PORTFOLIO DEPENDS ON ONE’S RISK TOLERANCE, OBJECTIVES, SITUATION, RETURN ON OTHER ASSETS, ETC. ONLY YOUR INVESTMENT ADVISOR WHO KNOWS YOUR UNIQUE CIRCUMSTANCES CAN MAKE A PROPER RECOMMENDATION AS TO THE MERIT OF ANY PARTICULAR SECURITY FOR INCLUSION IN YOUR PORTFOLIO. This REPORT is solely for informative purposes and is not a solicitation or an offer to buy or sell any security. It is not intended as being a complete description of the company, industry, securities or developments referred to in the material. Any forecasts contained in this report were independently prepared unless otherwise stated, and HAVE NOT BEEN endorsed by the Management of the company which is the subject of this report. Additional information is available upon request. THIS REPORT IS COPYRIGHT. YOU MAY NOT REDISTRIBUTE THIS REPORT WITHOUT OUR PERMISSION. Please give proper credit, including citing Fundamental Research Corp and/or the analyst, when quoting information from this report. The information contained in this report is intended to be viewed only in jurisdictions where it may be legally viewed and is not intended for use by any person or entity in any jurisdiction where such use would be contrary to local regulations or which would require any registration requirement within such jurisdiction