Embed Size (px)
Citation preview
1
YEAR 10: HUMAN WELLBEING IN CHINA
SPATIAL VARIATIONS WITHIN CHINA
Dr. Susan Bliss
Did you know?
Gender Inequality Index (G11) ranks Hong
Kong 15th compared to China 87th
China’s east-west divide-coastal provinces are
relatively wealthy and the country gets poorer
the further west it goes.
Highest male to female ratios in the world
Problem of ageing population
Possibly emerge as a major global healthcare
and pharmaceuticals hub
Economic reforms and regional
development are underway
Largest number of megacities in any
country
Free Trade Zones remain vital for
economic expansion
Growth in middle class changes
consumption patterns-more
international in tastes and habits.
Aim to reduce the environmental
footprint with a focus on renewable
sources of energy
2
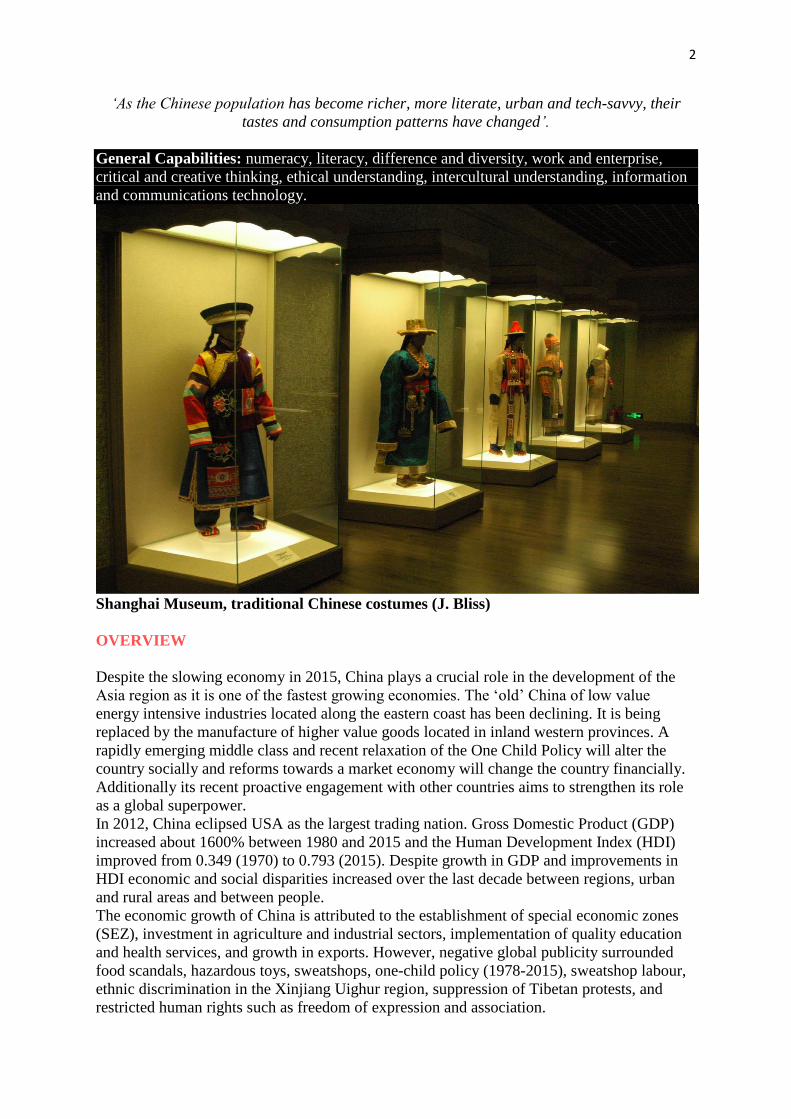
‘As the Chinese population has become richer, more literate, urban and tech-savvy, their
tastes and consumption patterns have changed’.
General Capabilities: numeracy, literacy, difference and diversity, work and enterprise,
critical and creative thinking, ethical understanding, intercultural understanding, information
and communications technology.
Shanghai Museum, traditional Chinese costumes (J. Bliss)
OVERVIEW
Despite the slowing economy in 2015, China plays a crucial role in the development of the
Asia region as it is one of the fastest growing economies. The ‘old’ China of low value
energy intensive industries located along the eastern coast has been declining. It is being
replaced by the manufacture of higher value goods located in inland western provinces. A
rapidly emerging middle class and recent relaxation of the One Child Policy will alter the
country socially and reforms towards a market economy will change the country financially.
Additionally its recent proactive engagement with other countries aims to strengthen its role
as a global superpower.
In 2012, China eclipsed USA as the largest trading nation. Gross Domestic Product (GDP)
increased about 1600% between 1980 and 2015 and the Human Development Index (HDI)
improved from 0.349 (1970) to 0.793 (2015). Despite growth in GDP and improvements in
HDI economic and social disparities increased over the last decade between regions, urban
and rural areas and between people.
The economic growth of China is attributed to the establishment of special economic zones
(SEZ), investment in agriculture and industrial sectors, implementation of quality education
and health services, and growth in exports. However, negative global publicity surrounded
food scandals, hazardous toys, sweatshops, one-child policy (1978-2015), sweatshop labour,
ethnic discrimination in the Xinjiang Uighur region, suppression of Tibetan protests, and
restricted human rights such as freedom of expression and association.
3
PART A: CHINA’S GLOBAL DEVELOPMENT
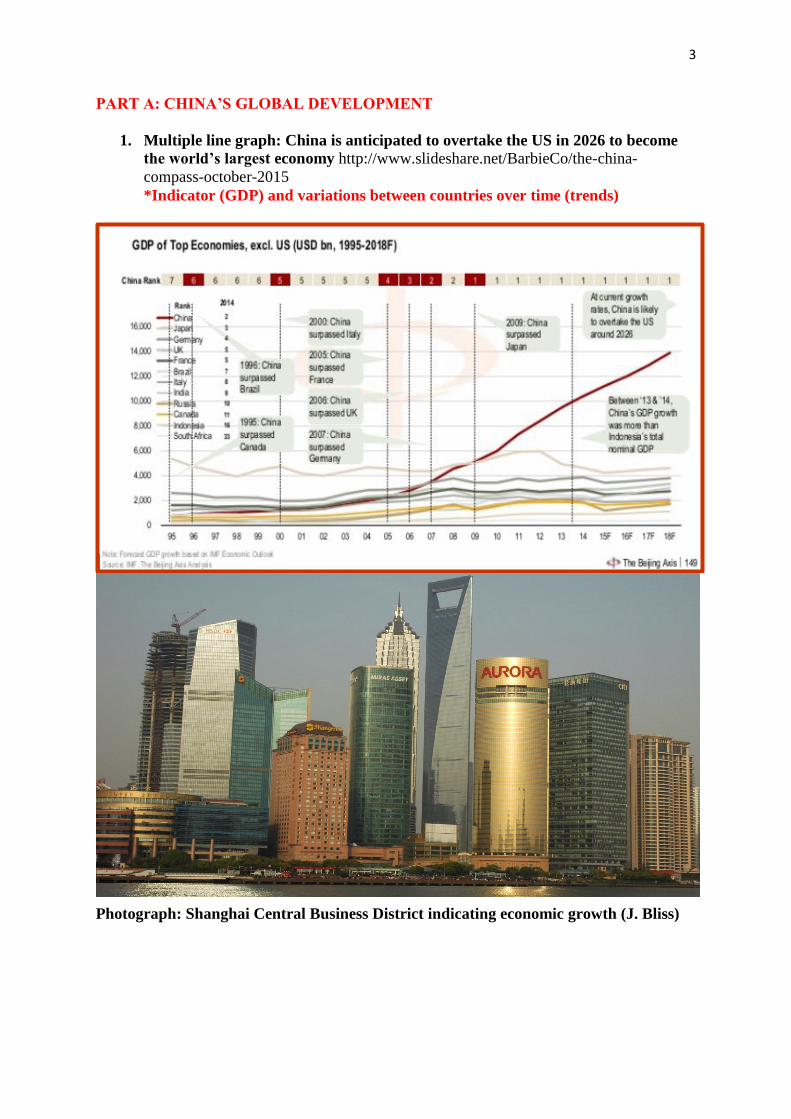
1. Multiple line graph: China is anticipated to overtake the US in 2026 to become
the world’s largest economy http://www.slideshare.net/BarbieCo/the-china-
compass-october-2015
*Indicator (GDP) and variations between countries over time (trends)
Photograph: Shanghai Central Business District indicating economic growth (J. Bliss)
4
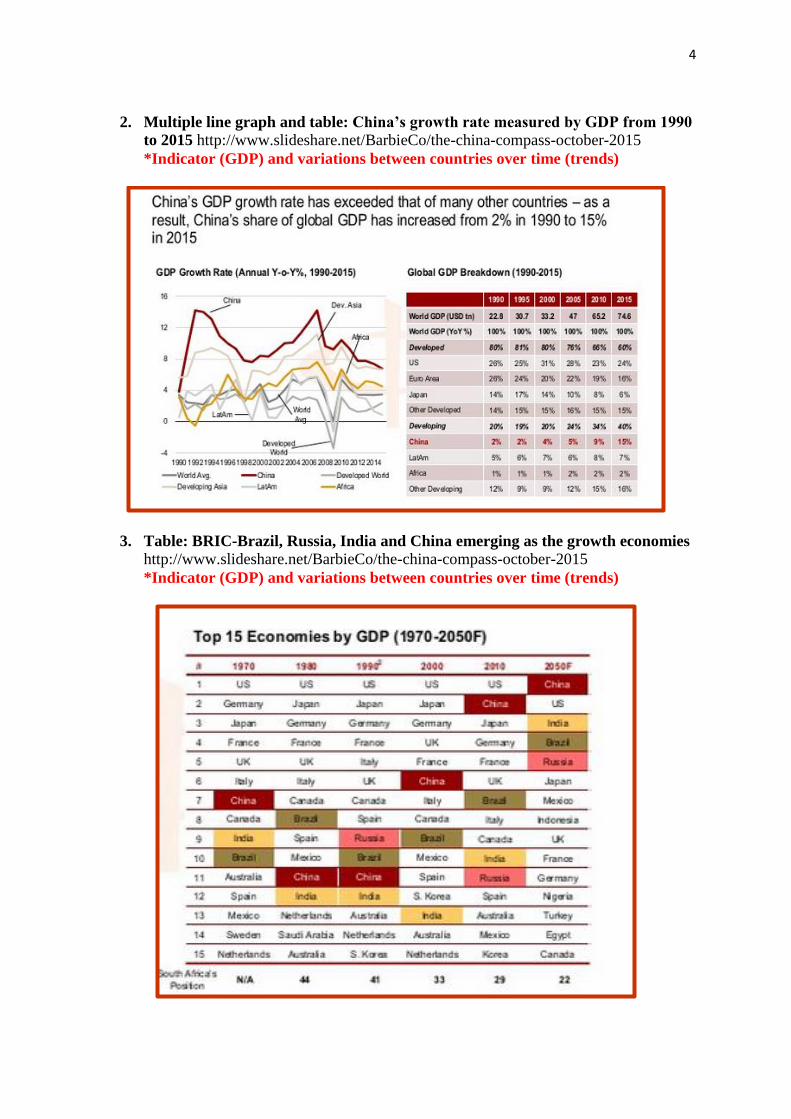
2. Multiple line graph and table: China’s growth rate measured by GDP from 1990
to 2015 http://www.slideshare.net/BarbieCo/the-china-compass-october-2015
*Indicator (GDP) and variations between countries over time (trends)
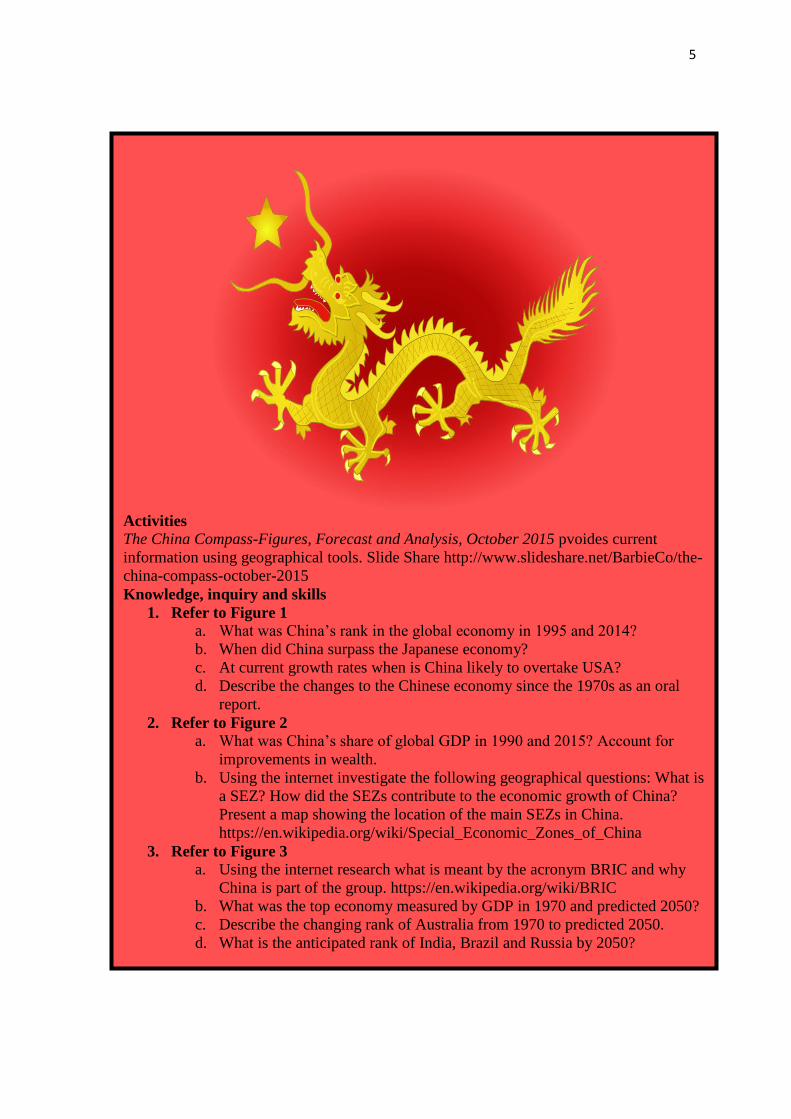
3. Table: BRIC-Brazil, Russia, India and China emerging as the growth economies
http://www.slideshare.net/BarbieCo/the-china-compass-october-2015
*Indicator (GDP) and variations between countries over time (trends)
5
Activities
The China Compass-Figures, Forecast and Analysis, October 2015 pvoides current
information using geographical tools. Slide Share http://www.slideshare.net/BarbieCo/the-
china-compass-october-2015
Knowledge, inquiry and skills
1. Refer to Figure 1
a. What was China’s rank in the global economy in 1995 and 2014?
b. When did China surpass the Japanese economy?
c. At current growth rates when is China likely to overtake USA?
d. Describe the changes to the Chinese economy since the 1970s as an oral
report.
2. Refer to Figure 2
a. What was China’s share of global GDP in 1990 and 2015? Account for
improvements in wealth.
b. Using the internet investigate the following geographical questions: What is
a SEZ? How did the SEZs contribute to the economic growth of China?
Present a map showing the location of the main SEZs in China.
https://en.wikipedia.org/wiki/Special_Economic_Zones_of_China
3. Refer to Figure 3
a. Using the internet research what is meant by the acronym BRIC and why
China is part of the group. https://en.wikipedia.org/wiki/BRIC
b. What was the top economy measured by GDP in 1970 and predicted 2050?
c. Describe the changing rank of Australia from 1970 to predicted 2050.
d. What is the anticipated rank of India, Brazil and Russia by 2050?
6
PART B: SPATIAL VARIATIONS ACROSS CHINA
Despite China’s economic growth over the last decade, not every person in the country
experienced an increase in wellbeing. In fact the *Gini Coefficient that measures inequality,
increased between regions, rural-urban locations and people.
For example:
rich versus poor people: approximately 6% of Chinese still live in multidimensional
poverty. This contrasts with corporate tycoons such as Wang Jianlin worth US$29.5
billion. The poorest people tend to be: ethnic minorities, small scale farmers, rural-urban
migrants, and people living in fragile environments experiencing land degradation,
floods, droughts and natural disasters.
coastal urban versus inland rural areas: coastal areas have higher per capita income than
inland western areas. Urbanisation and expansion of industry along coastal areas
promoted economic growth. Over the last 35 years China’ urban population quadrupled.
Wealth dominates cities such as Shanghai, Beijing, Guangzhou and Shenzhen attracting
poor rural migrants in the hope of improved wellbeing.
rural versus urban: Tibetans, especially living in rural areas face deprivation, while
urban elites in Shanghai enjoy high levels of consumption.
urban inequality: there is a division between rich and poor people living in cities. Rural
migrants without a hukou (residence permit) lack access to free education and health
services.
In 2015, China’s president Xi Jinping stated he aimed to reduce the inequality gap.
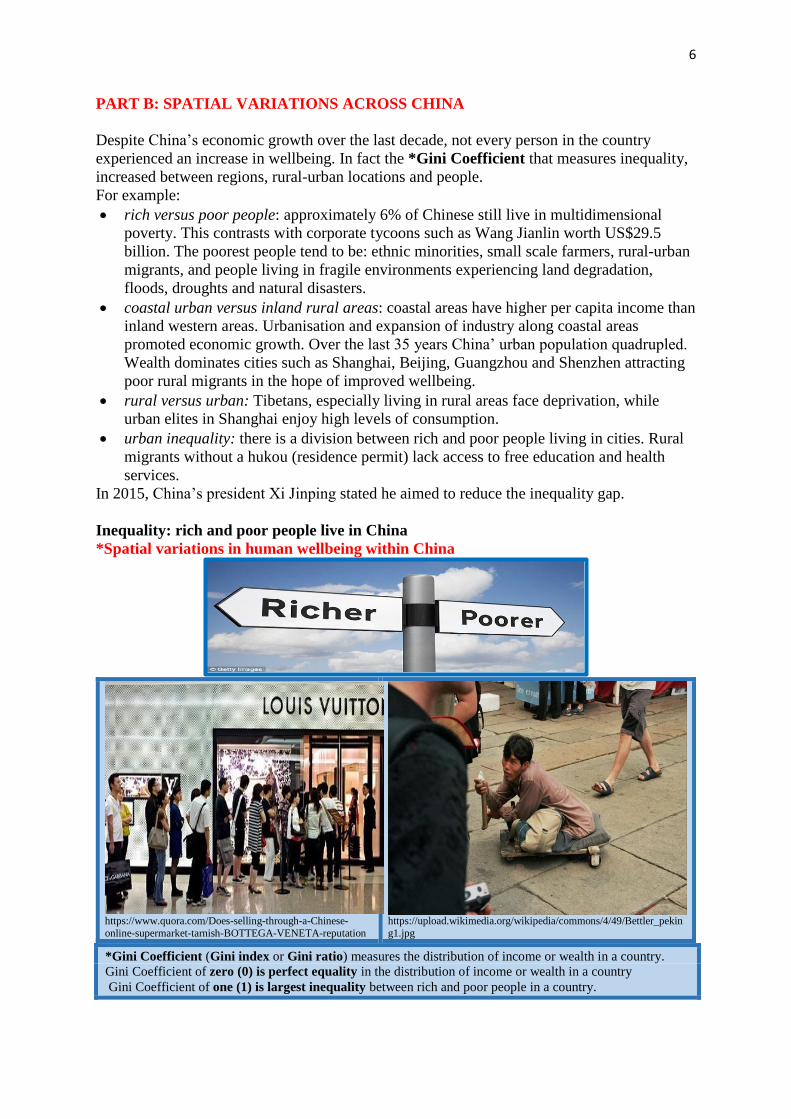
Inequality: rich and poor people live in China
*Spatial variations in human wellbeing within China
https://www.quora.com/Does-selling-through-a-Chinese-
online-supermarket-tarnish-BOTTEGA-VENETA-reputation
https://upload.wikimedia.org/wikipedia/commons/4/49/Bettler_pekin
g1.jpg
*Gini Coefficient (Gini index or Gini ratio) measures the distribution of income or wealth in a country.
Gini Coefficient of zero (0) is perfect equality in the distribution of income or wealth in a country
Gini Coefficient of one (1) is largest inequality between rich and poor people in a country.
7
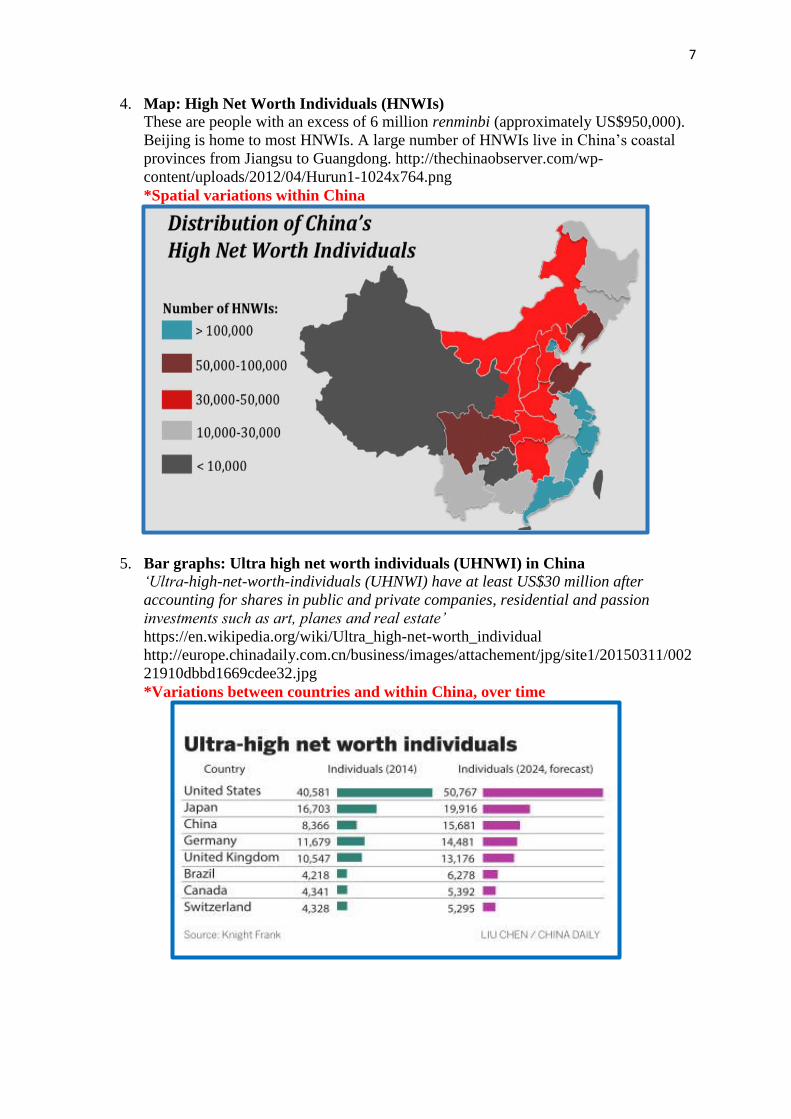
4. Map: High Net Worth Individuals (HNWIs) These are people with an excess of 6 million renminbi (approximately US$950,000).
Beijing is home to most HNWIs. A large number of HNWIs live in China’s coastal
provinces from Jiangsu to Guangdong. http://thechinaobserver.com/wp-
content/uploads/2012/04/Hurun1-1024x764.png
*Spatial variations within China
5. Bar graphs: Ultra high net worth individuals (UHNWI) in China ‘Ultra-high-net-worth-individuals (UHNWI) have at least US$30 million after
accounting for shares in public and private companies, residential and passion
investments such as art, planes and real estate’
https://en.wikipedia.org/wiki/Ultra_high-net-worth_individual
http://europe.chinadaily.com.cn/business/images/attachement/jpg/site1/20150311/002
21910dbbd1669cdee32.jpg
*Variations between countries and within China, over time
8
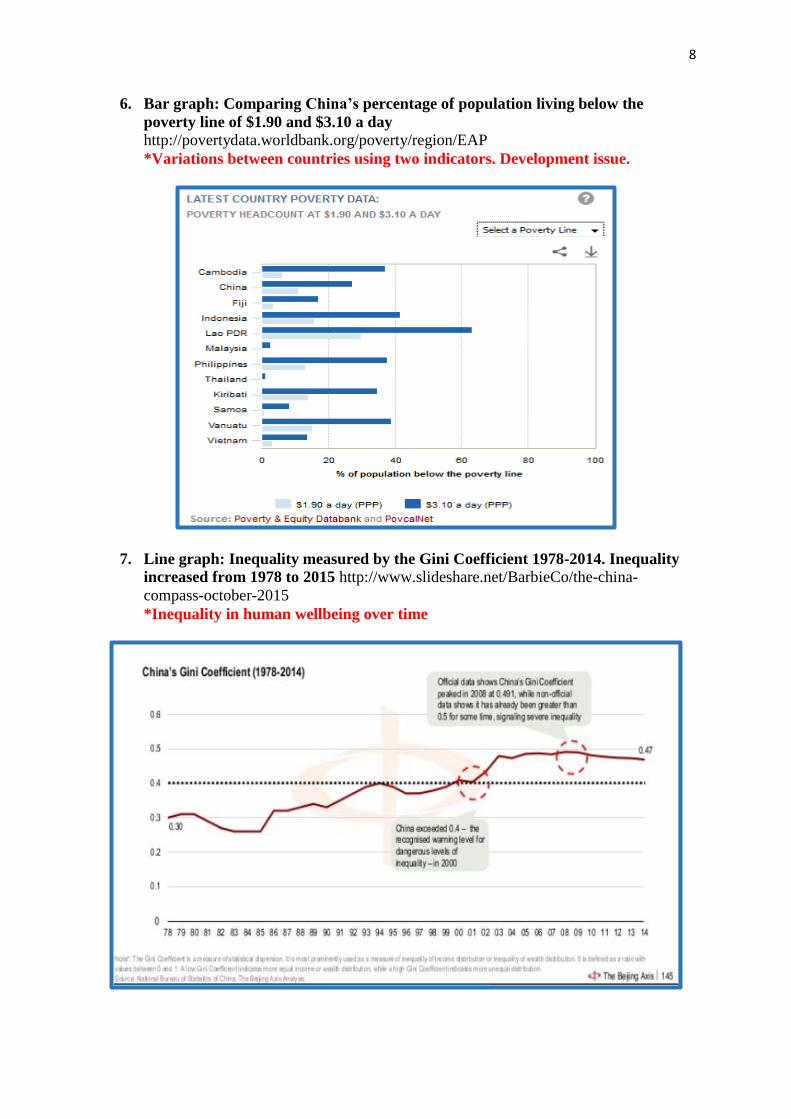
6. Bar graph: Comparing China’s percentage of population living below the
poverty line of $1.90 and $3.10 a day
http://povertydata.worldbank.org/poverty/region/EAP
*Variations between countries using two indicators. Development issue.
7. Line graph: Inequality measured by the Gini Coefficient 1978-2014. Inequality
increased from 1978 to 2015 http://www.slideshare.net/BarbieCo/the-china-
compass-october-2015
*Inequality in human wellbeing over time
9
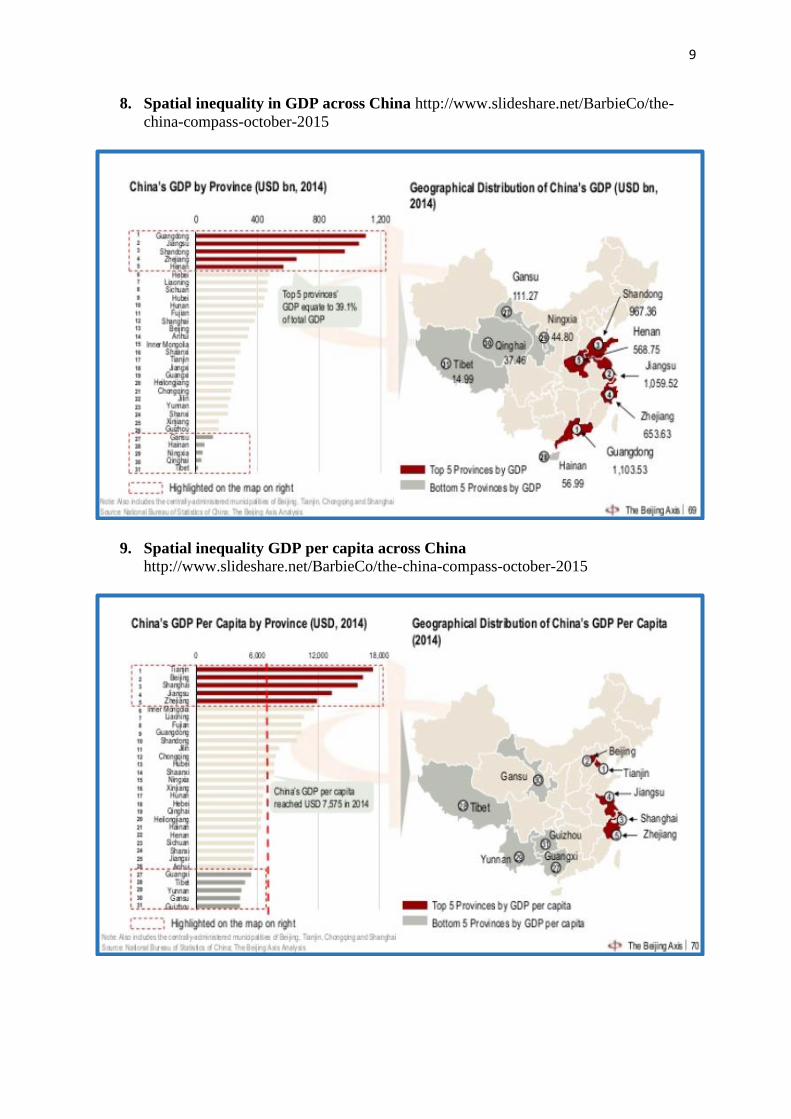
8. Spatial inequality in GDP across China http://www.slideshare.net/BarbieCo/the-
china-compass-october-2015
9. Spatial inequality GDP per capita across China
http://www.slideshare.net/BarbieCo/the-china-compass-october-2015
10
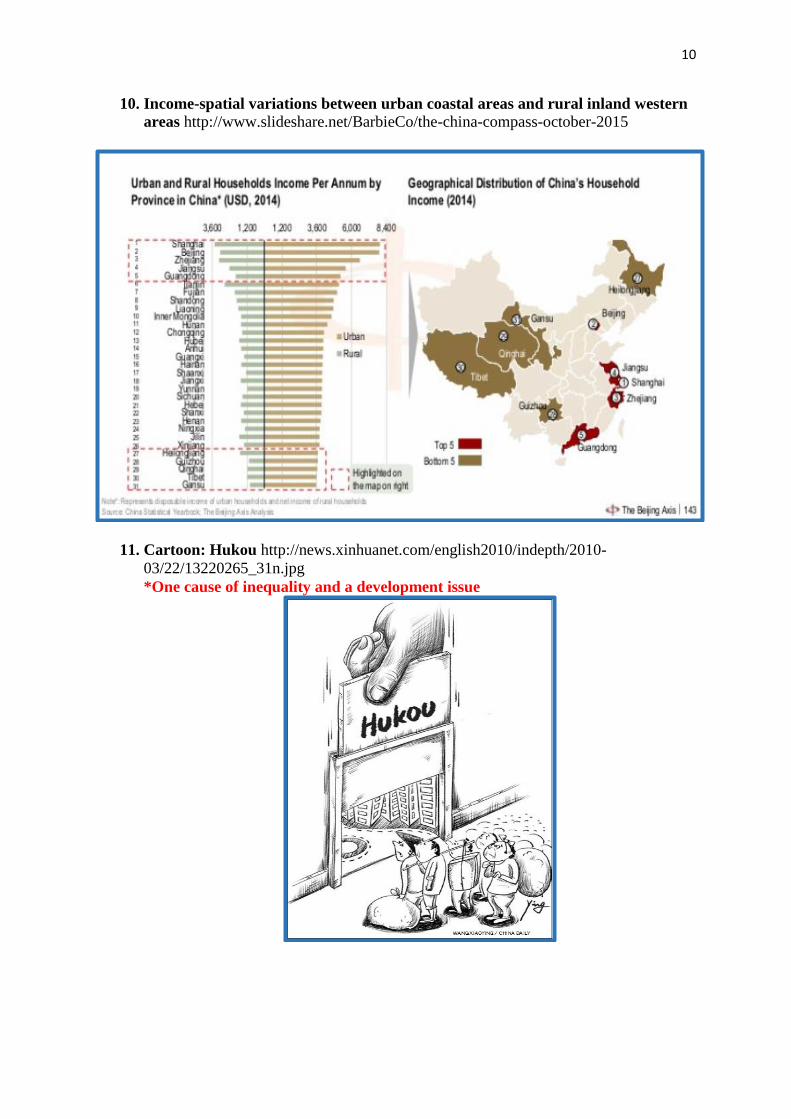
10. Income-spatial variations between urban coastal areas and rural inland western
areas http://www.slideshare.net/BarbieCo/the-china-compass-october-2015
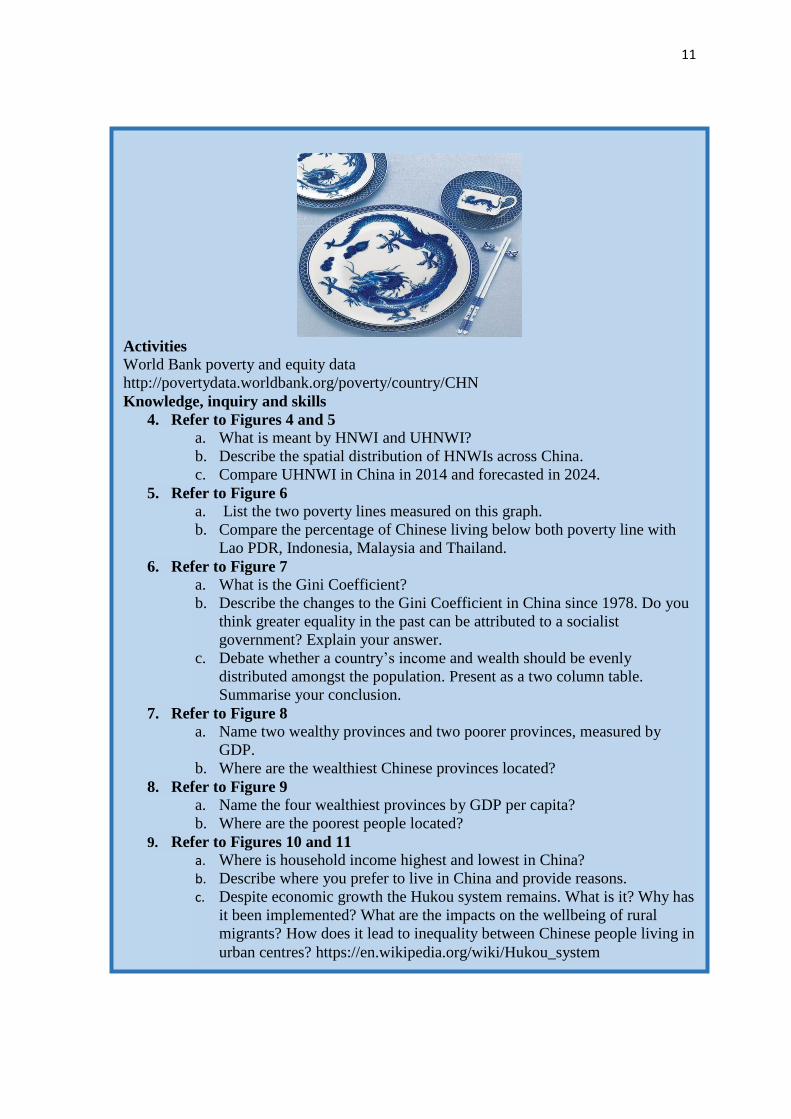
11. Cartoon: Hukou http://news.xinhuanet.com/english2010/indepth/2010-
03/22/13220265_31n.jpg
*One cause of inequality and a development issue
11
Activities
World Bank poverty and equity data
http://povertydata.worldbank.org/poverty/country/CHN
Knowledge, inquiry and skills
4. Refer to Figures 4 and 5
a. What is meant by HNWI and UHNWI?
b. Describe the spatial distribution of HNWIs across China.
c. Compare UHNWI in China in 2014 and forecasted in 2024.
5. Refer to Figure 6
a. List the two poverty lines measured on this graph.
b. Compare the percentage of Chinese living below both poverty line with
Lao PDR, Indonesia, Malaysia and Thailand.
6. Refer to Figure 7
a. What is the Gini Coefficient?
b. Describe the changes to the Gini Coefficient in China since 1978. Do you
think greater equality in the past can be attributed to a socialist
government? Explain your answer.
c. Debate whether a country’s income and wealth should be evenly
distributed amongst the population. Present as a two column table.
Summarise your conclusion.
7. Refer to Figure 8
a. Name two wealthy provinces and two poorer provinces, measured by
GDP.
b. Where are the wealthiest Chinese provinces located?
8. Refer to Figure 9
a. Name the four wealthiest provinces by GDP per capita?
b. Where are the poorest people located?
9. Refer to Figures 10 and 11
a. Where is household income highest and lowest in China?
b. Describe where you prefer to live in China and provide reasons. c. Despite economic growth the Hukou system remains. What is it? Why has
it been implemented? What are the impacts on the wellbeing of rural
migrants? How does it lead to inequality between Chinese people living in
urban centres? https://en.wikipedia.org/wiki/Hukou_system
12
PART C: SPATIAL VARIATIONS IN HUMAN DEVELOPMENT INDEX
Human wellbeing in China, measured by the Human Development Index (HDI), improved as
the country grew economically. In 2015, China was ranked 91 out of 187 countries on the
HDI, with life expectancy of 75 years, income/GDP per capita $11,500 per person and years
of schooling 7.5 years. However HDI varies across China with higher HDI in cities and
eastern provinces.
As urban centres are engines of growth and employment, more than 500 million people have
moved to Chinese cities over the last 35 years. This has placed stress on urban housing,
water, electricity, transport, hospital and schools, as well as resulting in air pollution.
Rapid economic growth has led to greater affluence but a more unequal society. The gap is
between:
rural and urban areas
rich and poor people living in urban areas
rural areas (e.g. access or lack of access to fertile land, irrigation, transport
infrastructure)
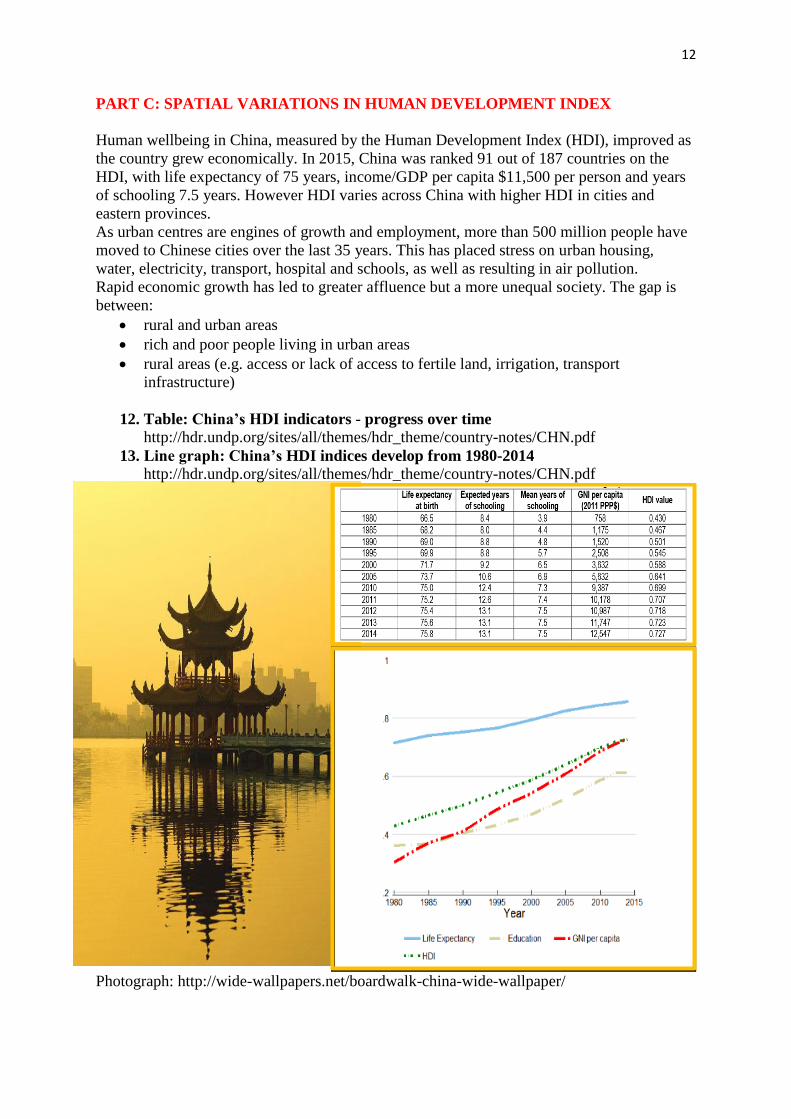
12. Table: China’s HDI indicators - progress over time
http://hdr.undp.org/sites/all/themes/hdr_theme/country-notes/CHN.pdf
13. Line graph: China’s HDI indices develop from 1980-2014
http://hdr.undp.org/sites/all/themes/hdr_theme/country-notes/CHN.pdf
Photograph: http://wide-wallpapers.net/boardwalk-china-wide-wallpaper/
13
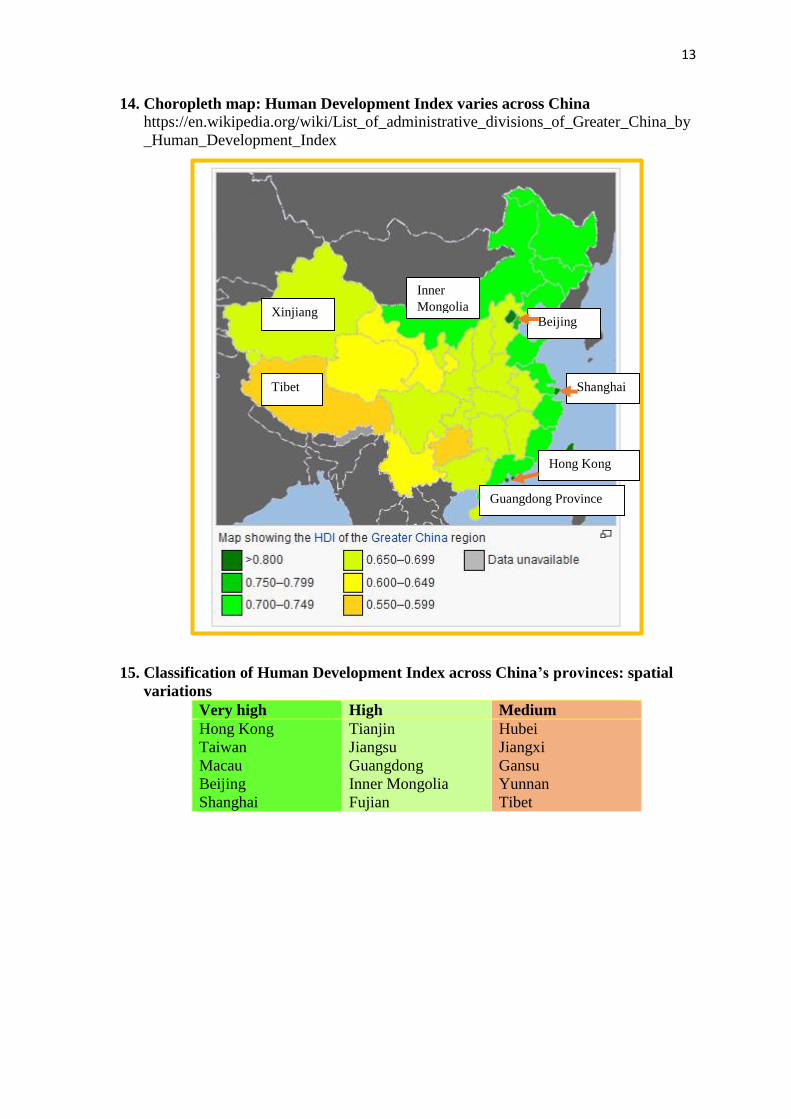
14. Choropleth map: Human Development Index varies across China
https://en.wikipedia.org/wiki/List_of_administrative_divisions_of_Greater_China_by
_Human_Development_Index
15. Classification of Human Development Index across China’s provinces: spatial
variations
Very high High Medium
Hong Kong
Taiwan
Macau
Beijing
Shanghai
Tianjin
Jiangsu
Guangdong
Inner Mongolia
Fujian
Hubei
Jiangxi
Gansu
Yunnan
Tibet
Tibet
Xinjiang
Inner
Mongolia
Shanghai
Beijing
Guangdong Province
Hong Kong
14
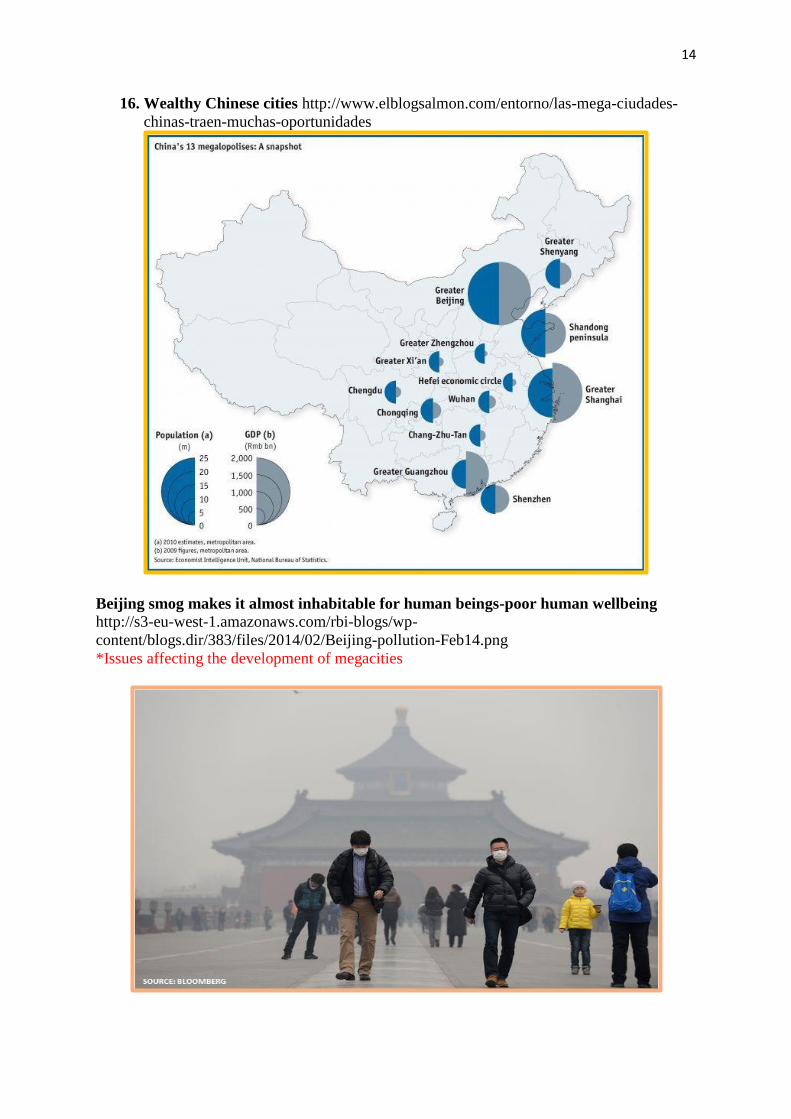
16. Wealthy Chinese cities http://www.elblogsalmon.com/entorno/las-mega-ciudades-
chinas-traen-muchas-oportunidades
Beijing smog makes it almost inhabitable for human beings-poor human wellbeing
http://s3-eu-west-1.amazonaws.com/rbi-blogs/wp-
content/blogs.dir/383/files/2014/02/Beijing-pollution-Feb14.png
*Issues affecting the development of megacities
15
Activities
GAPMINDER is an excellent website with interactive maps and graphs on China’s
Human Wellbeing. http://www.gapminder.org/
a. Wealth and Health of nations (e.g. China) from 1980 until today-interactive graph
and map
b. 200 years change the world. View the changes to China over time (life
expectancy and GDP per person)
c. Asia’s rise - how and when?
Knowledge, inquiry and skills
10. Refer to Figures 12 and 13:
a. List three main measurements in the HDI.
b. Calculate the improvements in China’s HDI from 1980-2015.
c. Explain the reasons for these improvements.
11. Refer to Figure 15
a. Compare HDI in Beijing, Inner Mongolia and Tibet.
b. Where is HDI higher-east or west China?
c. Explain the reasons for spatial variations in HDI.
12. Refer to Figure 16
a. List three cities with the largest population.
b. Name three cities with the biggest GDP.
c. Compare population and GDP of Chongqing, Greater Shanghai, Greater
Guangzhou and Wuhan
d. Research one large city and investigate the wellbeing of the population
and why variations in HDI occur. Present research using Web 2.0 tools.
13. Draw a mind map of the causes of spatial inequality in China
14. Research the digital divide between the Chinese IT ‘haves and have nots’ in rural
versus urban areas. Discuss its impact on economic development and human
wellbeing. https://en.wikipedia.org/wiki/Digital_divide_in_China
16
PART D: CHINA’S EAST-WEST DIVIDE
China’s plans over the last few decades emphasised economic development and urbanisation.
This led to an economic gap between China’s east and west provinces. Geographical location
contributed to development, as coastal provinces are located closer to world markets by sea-
based trade compared to distant western provinces where transport is more challenging.
As a result, east coast cities such as Hong Kong, Beijing and Shanghai grew economically
and the urbanites experienced a high HDI, compared to inland western cities. However,
recent investment in western provinces has seen the growth of inland cities has as Chongqing
and Chengdu with GDP growth around 16% a year. Since 2007 inland areas are growing
faster than coastal provinces.
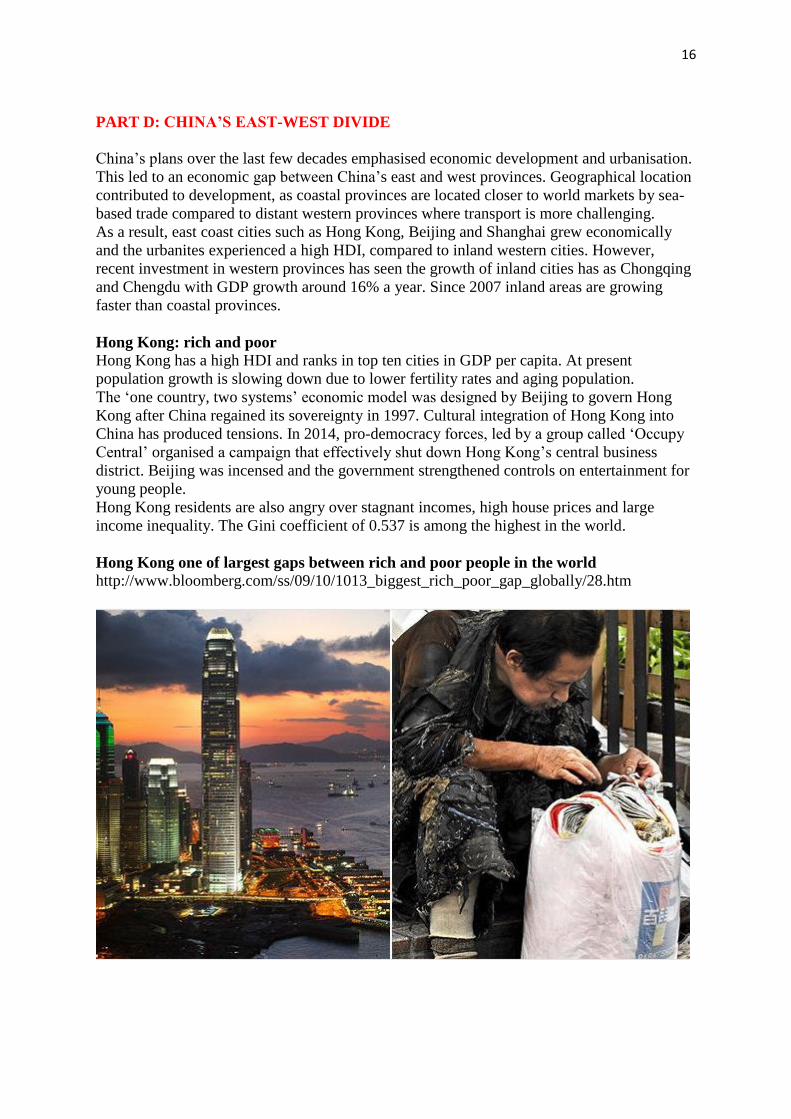
Hong Kong: rich and poor
Hong Kong has a high HDI and ranks in top ten cities in GDP per capita. At present
population growth is slowing down due to lower fertility rates and aging population.
The ‘one country, two systems’ economic model was designed by Beijing to govern Hong
Kong after China regained its sovereignty in 1997. Cultural integration of Hong Kong into
China has produced tensions. In 2014, pro-democracy forces, led by a group called ‘Occupy
Central’ organised a campaign that effectively shut down Hong Kong’s central business
district. Beijing was incensed and the government strengthened controls on entertainment for
young people.
Hong Kong residents are also angry over stagnant incomes, high house prices and large
income inequality. The Gini coefficient of 0.537 is among the highest in the world.
Hong Kong one of largest gaps between rich and poor people in the world
http://www.bloomberg.com/ss/09/10/1013_biggest_rich_poor_gap_globally/28.htm
17
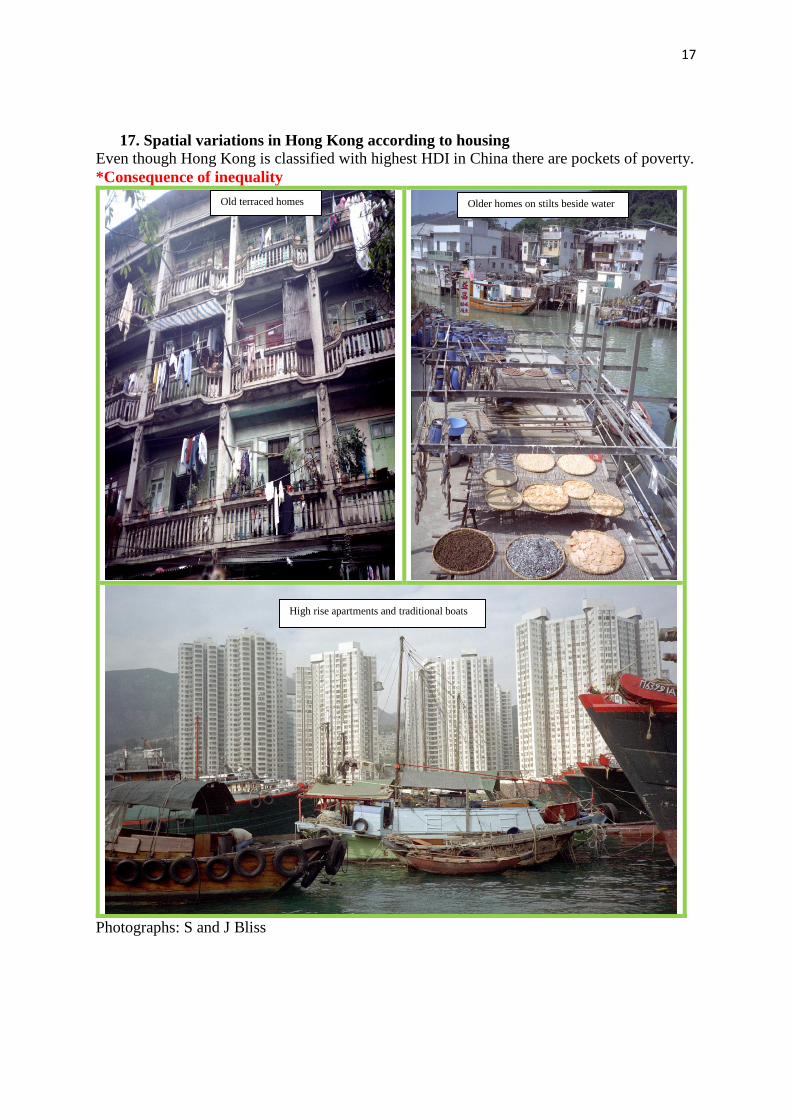
17. Spatial variations in Hong Kong according to housing
Even though Hong Kong is classified with highest HDI in China there are pockets of poverty.
*Consequence of inequality
Photographs: S and J Bliss
Old terraced homes Older homes on stilts beside water
High rise apartments and traditional boats
18
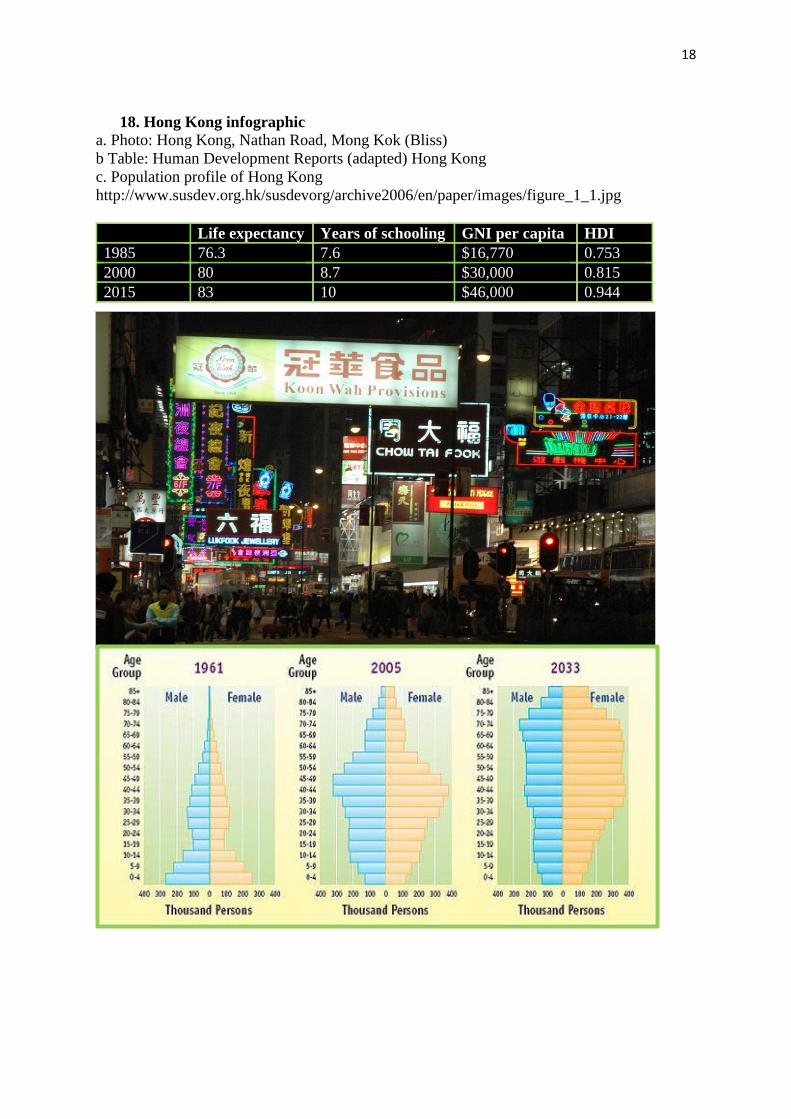
18. Hong Kong infographic
a. Photo: Hong Kong, Nathan Road, Mong Kok (Bliss)
b Table: Human Development Reports (adapted) Hong Kong
c. Population profile of Hong Kong
http://www.susdev.org.hk/susdevorg/archive2006/en/paper/images/figure_1_1.jpg
Life expectancy Years of schooling GNI per capita HDI
1985 76.3 7.6 $16,770 0.753
2000 80 8.7 $30,000 0.815
2015 83 10 $46,000 0.944
19
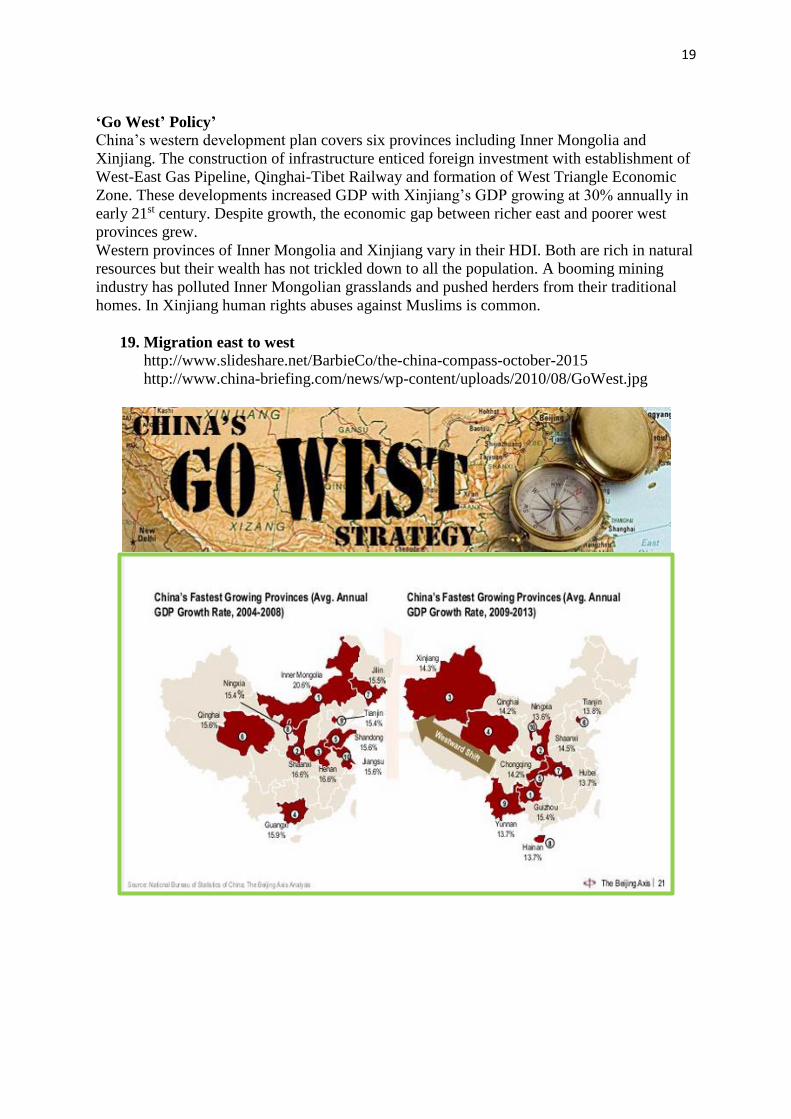
‘Go West’ Policy’
China’s western development plan covers six provinces including Inner Mongolia and
Xinjiang. The construction of infrastructure enticed foreign investment with establishment of
West-East Gas Pipeline, Qinghai-Tibet Railway and formation of West Triangle Economic
Zone. These developments increased GDP with Xinjiang’s GDP growing at 30% annually in
early 21st century. Despite growth, the economic gap between richer east and poorer west
provinces grew.
Western provinces of Inner Mongolia and Xinjiang vary in their HDI. Both are rich in natural
resources but their wealth has not trickled down to all the population. A booming mining
industry has polluted Inner Mongolian grasslands and pushed herders from their traditional
homes. In Xinjiang human rights abuses against Muslims is common.
19. Migration east to west
http://www.slideshare.net/BarbieCo/the-china-compass-october-2015
http://www.china-briefing.com/news/wp-content/uploads/2010/08/GoWest.jpg
20
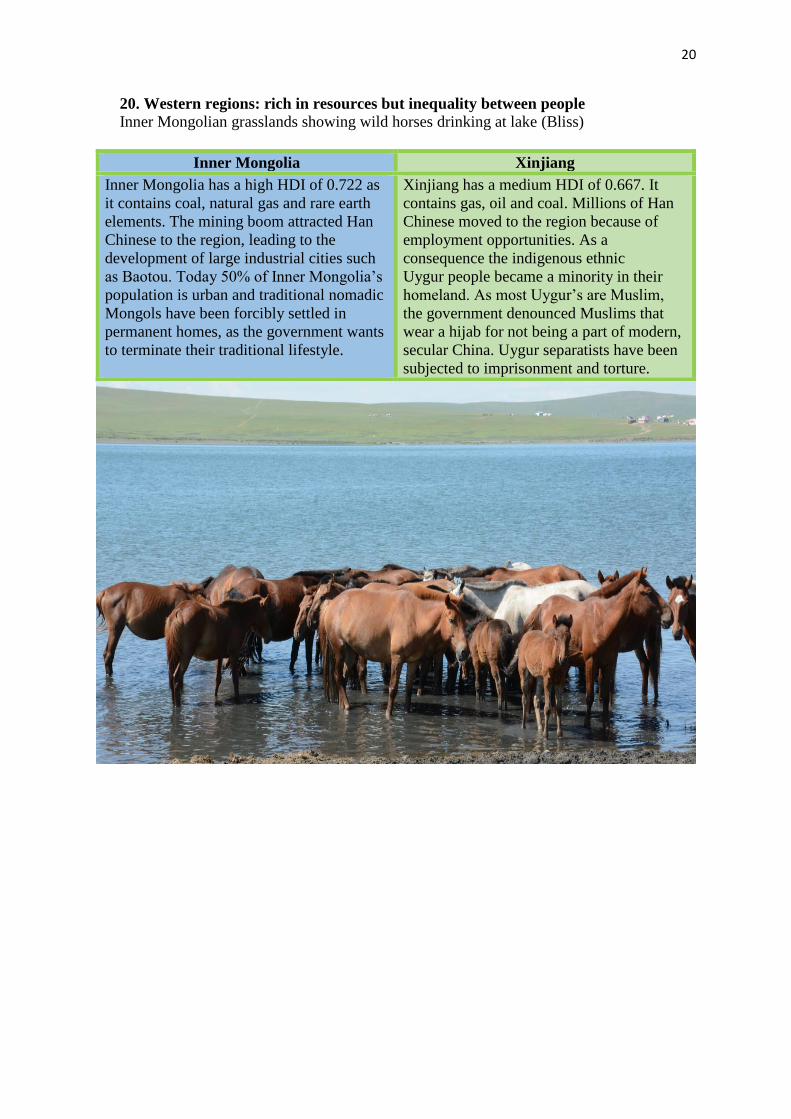
20. Western regions: rich in resources but inequality between people
Inner Mongolian grasslands showing wild horses drinking at lake (Bliss)
Inner Mongolia Xinjiang
Inner Mongolia has a high HDI of 0.722 as
it contains coal, natural gas and rare earth
elements. The mining boom attracted Han
Chinese to the region, leading to the
development of large industrial cities such
as Baotou. Today 50% of Inner Mongolia’s
population is urban and traditional nomadic
Mongols have been forcibly settled in
permanent homes, as the government wants
to terminate their traditional lifestyle.
Xinjiang has a medium HDI of 0.667. It
contains gas, oil and coal. Millions of Han
Chinese moved to the region because of
employment opportunities. As a
consequence the indigenous ethnic
Uygur people became a minority in their
homeland. As most Uygur’s are Muslim,
the government denounced Muslims that
wear a hijab for not being a part of modern,
secular China. Uygur separatists have been
subjected to imprisonment and torture.
21
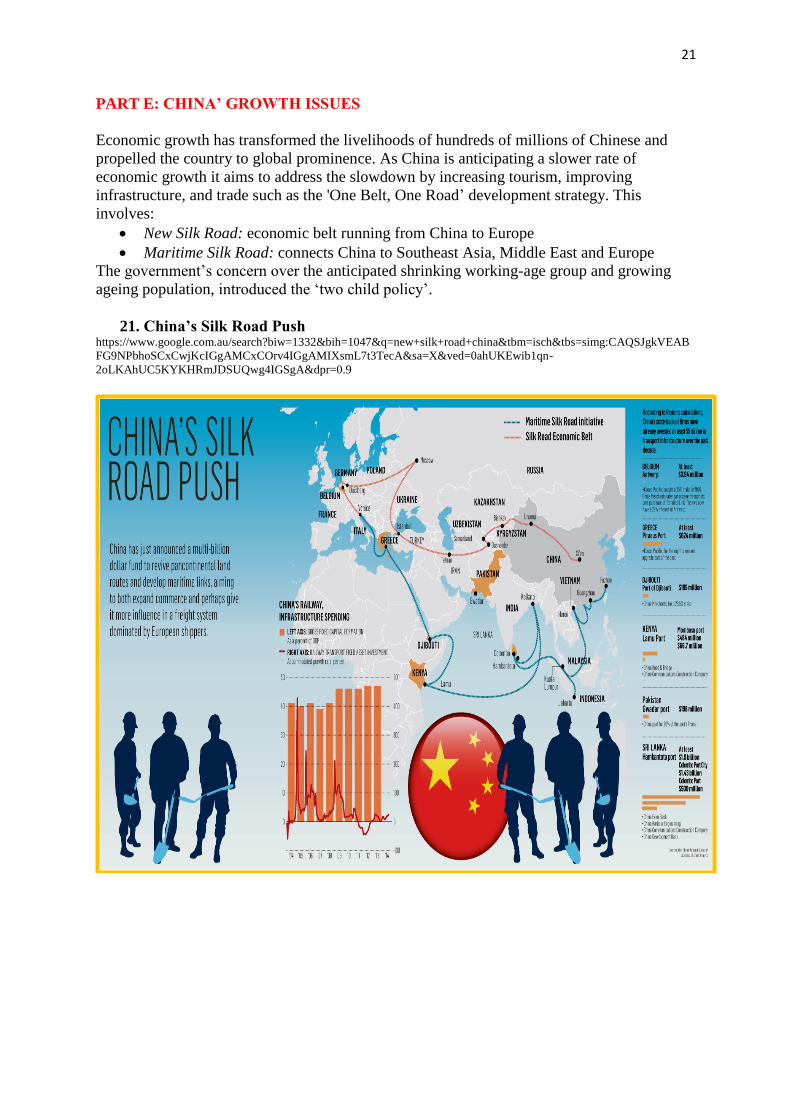
PART E: CHINA’ GROWTH ISSUES
Economic growth has transformed the livelihoods of hundreds of millions of Chinese and
propelled the country to global prominence. As China is anticipating a slower rate of
economic growth it aims to address the slowdown by increasing tourism, improving
infrastructure, and trade such as the 'One Belt, One Road’ development strategy. This
involves:
New Silk Road: economic belt running from China to Europe
Maritime Silk Road: connects China to Southeast Asia, Middle East and Europe
The government’s concern over the anticipated shrinking working-age group and growing
ageing population, introduced the ‘two child policy’.
21. China’s Silk Road Push https://www.google.com.au/search?biw=1332&bih=1047&q=new+silk+road+china&tbm=isch&tbs=simg:CAQSJgkVEAB
FG9NPbhoSCxCwjKcIGgAMCxCOrv4IGgAMIXsmL7t3TecA&sa=X&ved=0ahUKEwib1qn-
2oLKAhUC5KYKHRmJDSUQwg4IGSgA&dpr=0.9
22
Activities
The 2015 HDI report ranks Australia (2), China (91) and India (35). Refer to the UNDP
report and update statistics for the current year. Compare the three HDI indicators, as
well as the IHDI, G11 and MPI. Account for the differences.
http://hdr.undp.org/en/2015-report
18. Refer to Figure 17: Describe spatial variations in Hong Kong.
19. Refer to Figure 18
a. What is the HDI of Hong Kong? How does it compare with the rest of
China
b. Why did HDI improve from 1985-2015?
c. Explain changes to the population profile in Hong Kong between 1961
and anticipated 2033. Include statistics.
20. Refer to Figures 19 and 20
a. Describe the recent growth of China’s western regions.
b. Explain how some of China’s western regions that are rich in resources
has not resulted in a more equal society.
21. Refer to Figure 21
a. What locations will the Maritime Silk Road Initiative pass through?
b. What places are part of the Silk Road Economic Belt?
c. Research the internet and investigate the main purposes of the ‘Belt and
Road Initiative’? http://www.xinhuanet.com/english/special/silkroad/;
http://www.ft.com/cms/s/2/6e098274-587a-11e5-a28b-
50226830d644.html#axzz3vnC3vI5z
22. Discuss spatial variations across China and how the ‘Go West Policy’ aims to
reduce inequality
23. Research the growth of the Western Triangle Economic Zone, including the city
of Chongqing. https://en.wikipedia.org/wiki/West_Triangle_Economic_Zone
24. In groups, investigate one of the following:
a. the ‘Occupy Central’ protest or ‘Umbrella Revolution’, and whether it
was effective
b. the ‘one country two systems’ and whether it is working.
25. China referred to as the factory of the world, relies on migrant workers who make
up the majority of the workforce. Investigate life in a sweatshop and restrictions
on human wellbeing. Present as a photo story.
23
BUILD A SCAFFOLD
Human wellbeing and development
What is human wellbeing?
How is human wellbeing measured?
Why are a range of indicators on
human wellbeing important to reduce
bias?
What organisations collect and
analyse human wellbeing indicators?
How does human wellbeing differ
between China and Australia?
What are the consequences of
China’s economic growth on human
wellbeing?
How do geographical tools contribute
to a better understanding of the topic
(e.g. photographs, statistics, maps,
graphs)?
Spatial variations
How can selected indicators and
maps identify spatial variations in
human wellbeing in China?
What are the causes of variations in
human wellbeing in China?
What are the consequences of spatial
variations in human wellbeing in
China?
What are the contemporary issues
concerning unequal human wellbeing
in China?
Improving wellbeing
How can inequality between rich and
poor provinces, urban-rural areas and
people be reduced in China?
How can the Chinese government
improve human wellbeing?
Follow the geographical process
Ask geographic questions
Acquire geographic resources
(primary and secondary)
Explore geographic information and
data (determine bias, relevancy and
accuracy)
Analyse geographic information
Present information using a variety of
procedures (oral presentation, Web
2.0 tools and group reports) and
geographical tools
Act on geographic knowledge (civics
and citizenship)
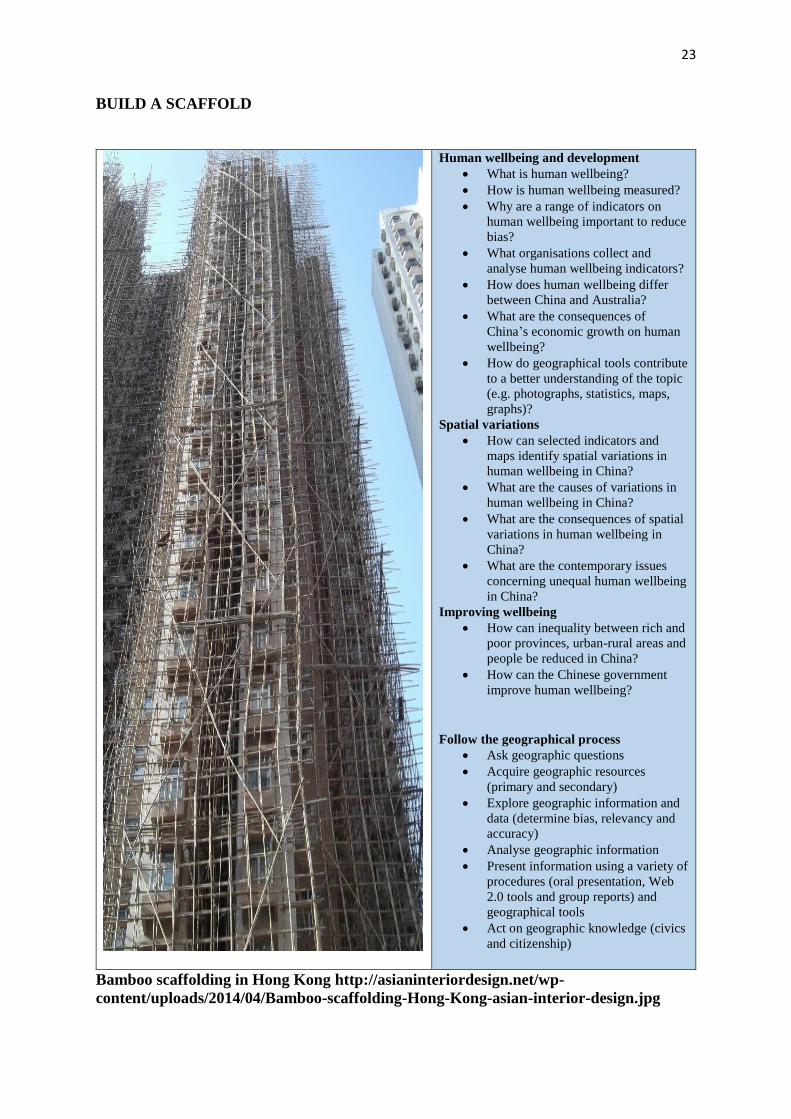
Bamboo scaffolding in Hong Kong http://asianinteriordesign.net/wp-
content/uploads/2014/04/Bamboo-scaffolding-Hong-Kong-asian-interior-design.jpg