Embed Size (px)
Citation preview

Nº 2009 - 25
Year end 2009 results Presentation for investors and analysts
3rd February 2010
2Nº 2009 - 25
Key highlights
Consolidated financial information
Business development
Appendix
Financial supplement
Contacts
3Nº 2009 - 25
Summary
Key highlights
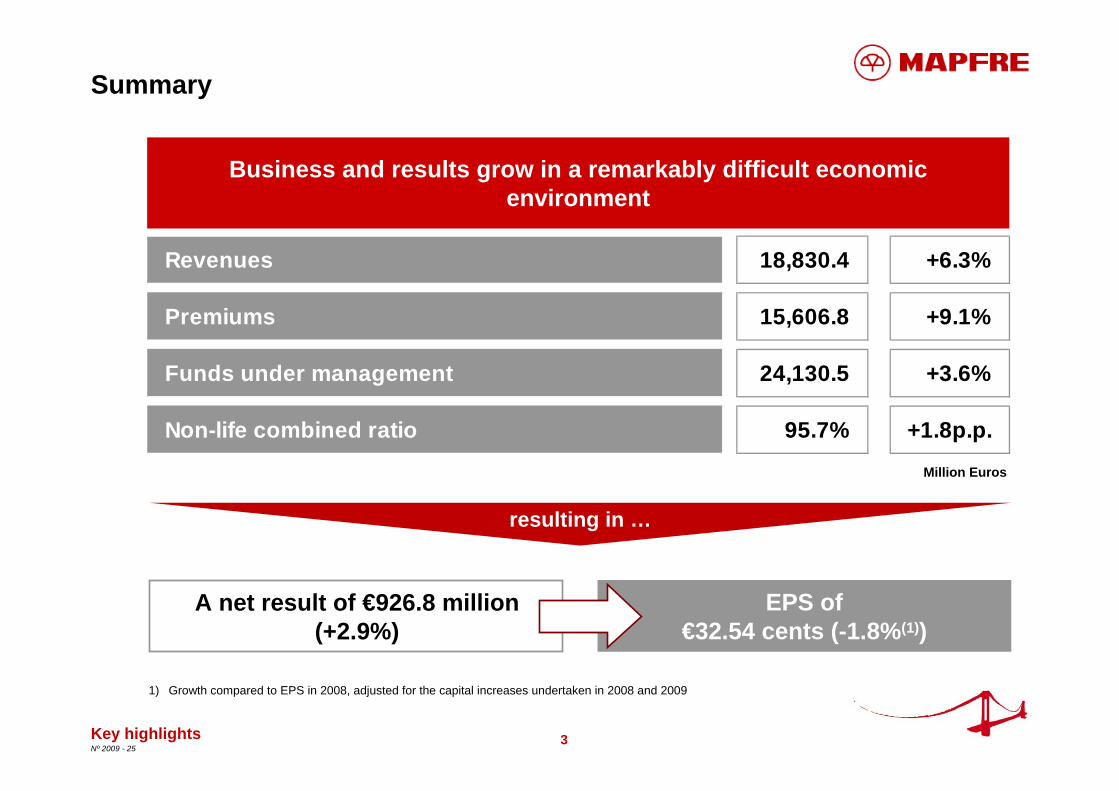
resulting in …
A net result of €926.8 million (+2.9%)
EPS of€32.54 cents (-1.8%(1))
Business and results grow in a remarkably difficult economic environment
Million Euros
1) Growth compared to EPS in 2008, adjusted for the capital increases undertaken in 2008 and 2009
Revenues 18,830.4 +6.3%
Premiums 15,606.8 +9.1%
Funds under management 24,130.5 +3.6%
Non-life combined ratio 95.7% +1.8p.p.
4Nº 2009 - 25
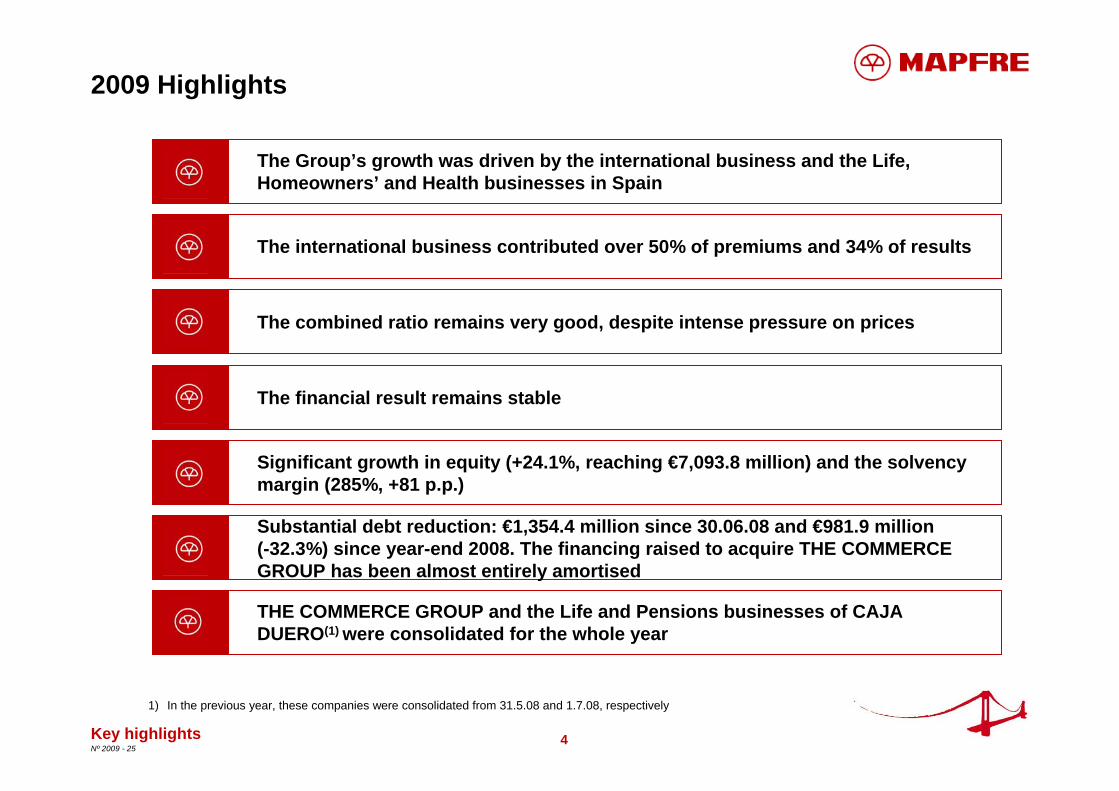
The combined ratio remains very good, despite intense pressure on prices
THE COMMERCE GROUP and the Life and Pensions businesses of CAJA DUERO(1) were consolidated for the whole year
Significant growth in equity (+24.1%, reaching €7,093.8 million) and the solvency margin (285%, +81 p.p.)
The Group’s growth was driven by the international business and the Life, Homeowners’ and Health businesses in Spain
Substantial debt reduction: €1,354.4 million since 30.06.08 and €981.9 million (-32.3%) since year-end 2008. The financing raised to acquire THE COMMERCE GROUP has been almost entirely amortised
The international business contributed over 50% of premiums and 34% of results
The financial result remains stable
2009 Highlights
1) In the previous year, these companies were consolidated from 31.5.08 and 1.7.08, respectively
Key highlights
5Nº 2009 - 25
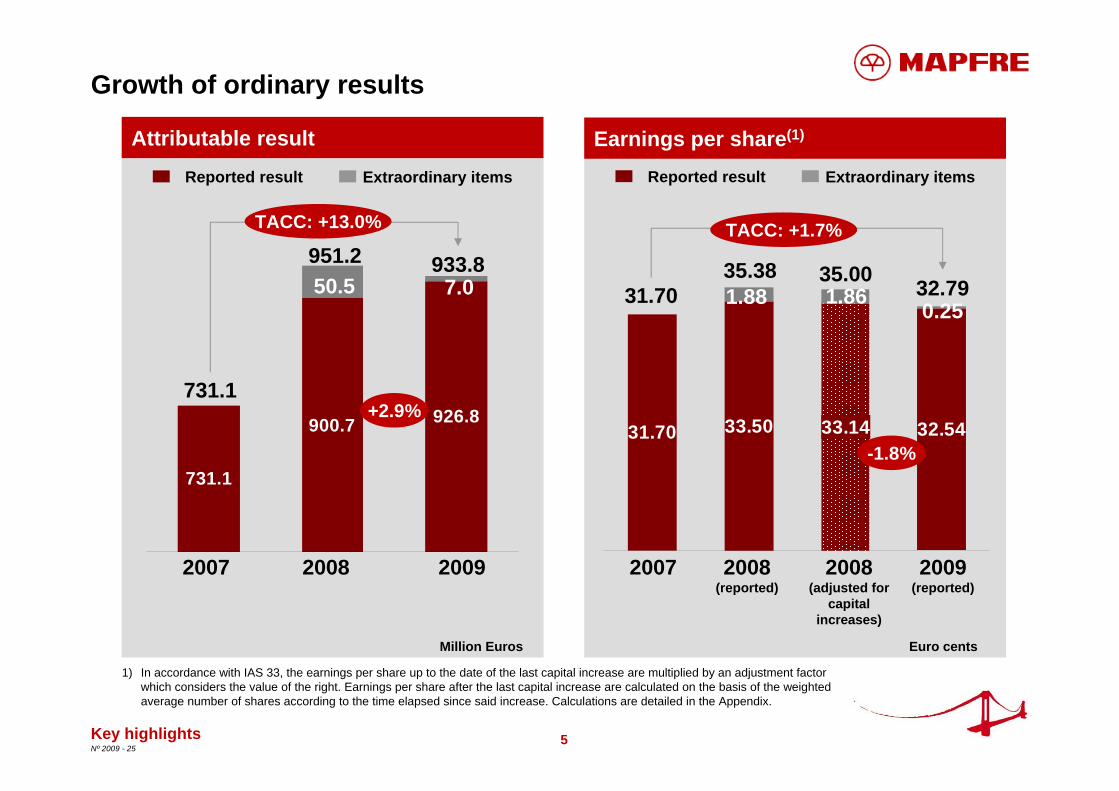
31.70 33.50 33.14 32.54
Growth of ordinary results
731.1
900.7 926.8
Earnings per share(1)
Key highlights
Attributable result
Million Euros Euro cents
1) In accordance with IAS 33, the earnings per share up to the date of the last capital increase are multiplied by an adjustment factor which considers the value of the right. Earnings per share after the last capital increase are calculated on the basis of the weighted average number of shares according to the time elapsed since said increase. Calculations are detailed in the Appendix.
2007 2008(reported)
2008(adjusted for
capital increases)
2009(reported)
2007 2008 2009
TACC: +13.0%
731.1
933.8951.250.5 7.0
+2.9%
35.38 35.00 32.79
TACC: +1.7%
31.700.251.861.88
-1.8%
Extraordinary itemsReported result Extraordinary itemsReported result

6Nº 2009 - 25Key highlights
Development of the adjusted attributable result
Million Euros
933.8
20.621.3
(56.0)
9.849.0
(37.7)
926.8
2009 Attributableresult
Partial buyback ofsubordinated debt
Losses arising fromequity accounted
shareholdings
MAPFREINMUEBLESprovisions
Use of provision foreconomic
environment
Restatement forinflation inVenezuela
Restructuring ofhealthcare centres,nursing homes and
CommercialInsurance
businesses
2009 Adjustedattributable result
7Nº 2009 - 25
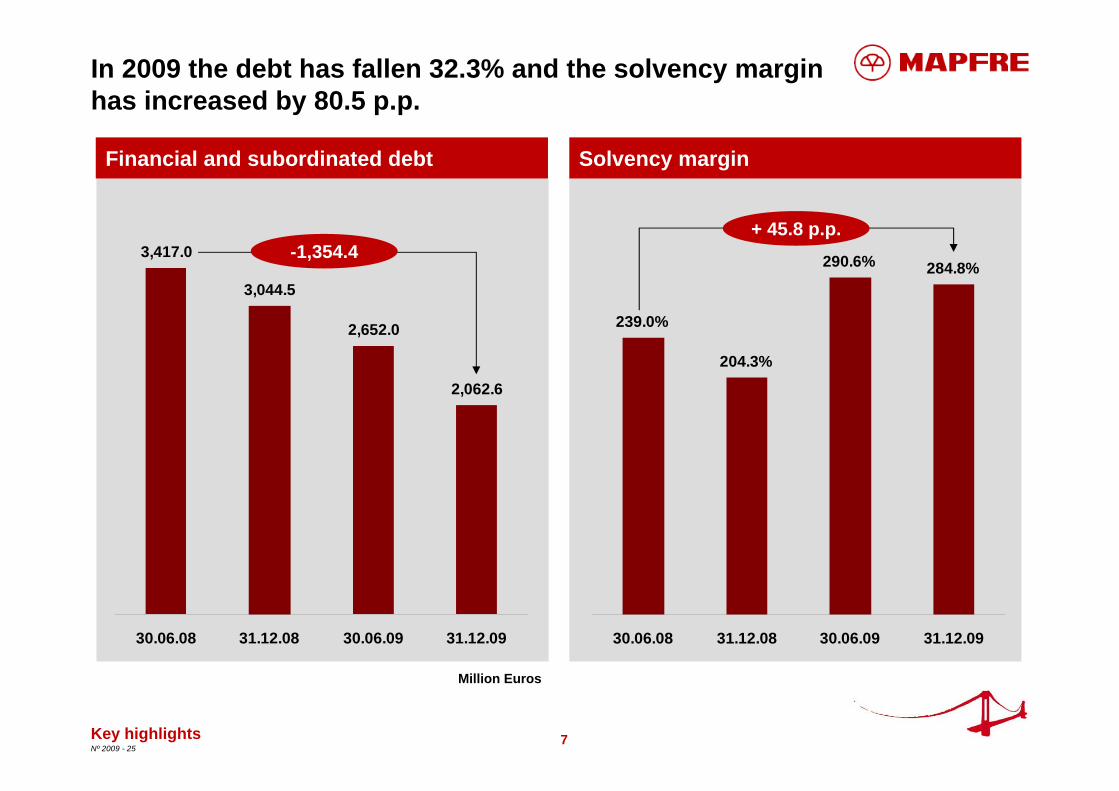
In 2009 the debt has fallen 32.3% and the solvency margin has increased by 80.5 p.p.
3,417.0
3,044.5
2,652.0
2,062.6
30.06.08 31.12.08 30.06.09 31.12.09 Millones de euros
Solvency marginFinancial and subordinated debt
239.0%
204.3%
290.6% 284.8%
30.06.08 31.12.08 30.06.09 31.12.09
-1,354.4
Key highlights
Million Euros
+ 45.8 p.p.

8Nº 2009 - 25
Memorandum of Understanding with BANCO DO BRASIL
MAPFRE and BANCO DO BRASIL have signed a memorandum of understanding to negotiate the establishment of a strategic alliance to develop their Personal, Property and Motor insurance businesses
This agreement will lead to the creation of one of the leading insurance groups in Brazil and will consolidate the joint position of both partners in the sector: the new insurance Group will be the leading company in the Brazilian market for Personal insurance and will become the second largest company in Property and Casualty lines
This alliance will allow MAPFRE to consolidate its leading position in Latin America, becoming the region’s second largest insurer in the overall ranking (Life and Non-Life)
BANCO DO BRASIL is the leading financial company in Brazil and has the most extensive branch network in the country:
– presence in 59% of Brazil’s cities with nearly 5,000 branches – clear leadership in the retail banking market: 34 million customers (30% market share), USD
139,000 million in deposits (23% market share) and 24 million credit cards in issuance
Key highlights
9Nº 2009 - 25
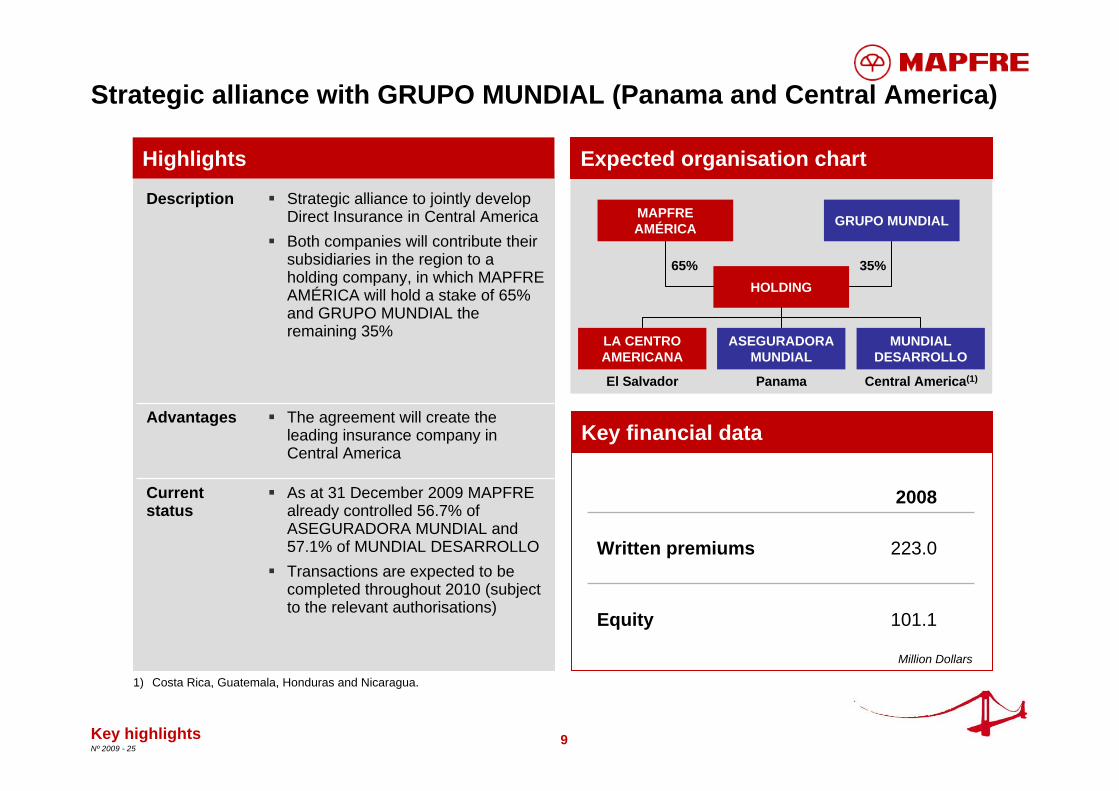
Strategic alliance with GRUPO MUNDIAL (Panama and Central America)
The agreement will create the leading insurance company in Central America
Advantages
As at 31 December 2009 MAPFRE already controlled 56.7% of ASEGURADORA MUNDIAL and 57.1% of MUNDIAL DESARROLLOTransactions are expected to be completed throughout 2010 (subject to the relevant authorisations)
Strategic alliance to jointly develop Direct Insurance in Central AmericaBoth companies will contribute their subsidiaries in the region to a holding company, in which MAPFRE AMÉRICA will hold a stake of 65% and GRUPO MUNDIAL the remaining 35%
Current status
Description
Expected organisation chart
Key financial data
Highlights
Key highlights
MAPFRE AMÉRICA GRUPO MUNDIAL
HOLDING
ASEGURADORAMUNDIAL
MUNDIAL DESARROLLO
LA CENTRO AMERICANA
65% 35%
El Salvador Panama Central America(1)
101.1Equity
223.0Written premiums
2008
Million Dollars
1) Costa Rica, Guatemala, Honduras and Nicaragua.
10Nº 2009 - 25
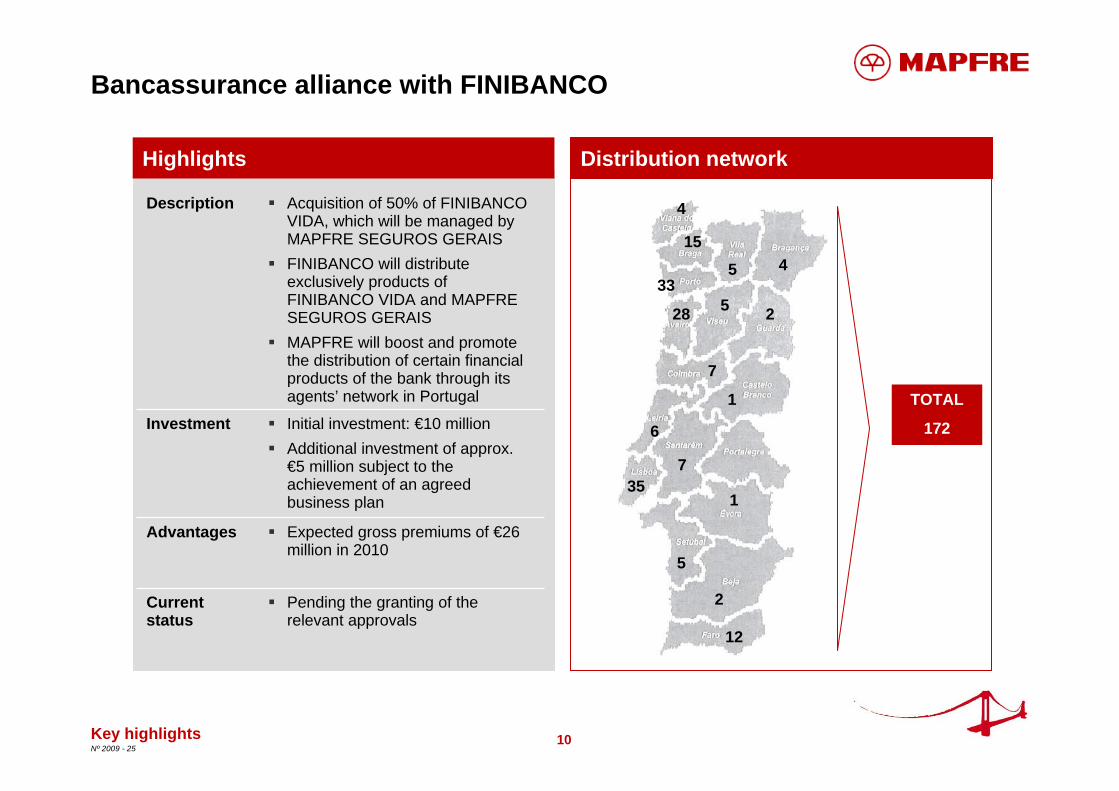
Bancassurance alliance with FINIBANCO
Distribution networkHighlights
Expected gross premiums of €26 million in 2010
Advantages
Initial investment: €10 millionAdditional investment of approx. €5 million subject to the achievement of an agreed business plan
Investment
Pending the granting of the relevant approvals
Acquisition of 50% of FINIBANCO VIDA, which will be managed by MAPFRE SEGUROS GERAISFINIBANCO will distribute exclusively products of FINIBANCO VIDA and MAPFRE SEGUROS GERAISMAPFRE will boost and promote the distribution of certain financial products of the bank through its agents’ network in Portugal
Current status
Description
Key highlights
TOTAL
172
4
2
1
1
2
12
5
35
33
7
6
7
28
15
4
5
5
11Nº 2009 - 25
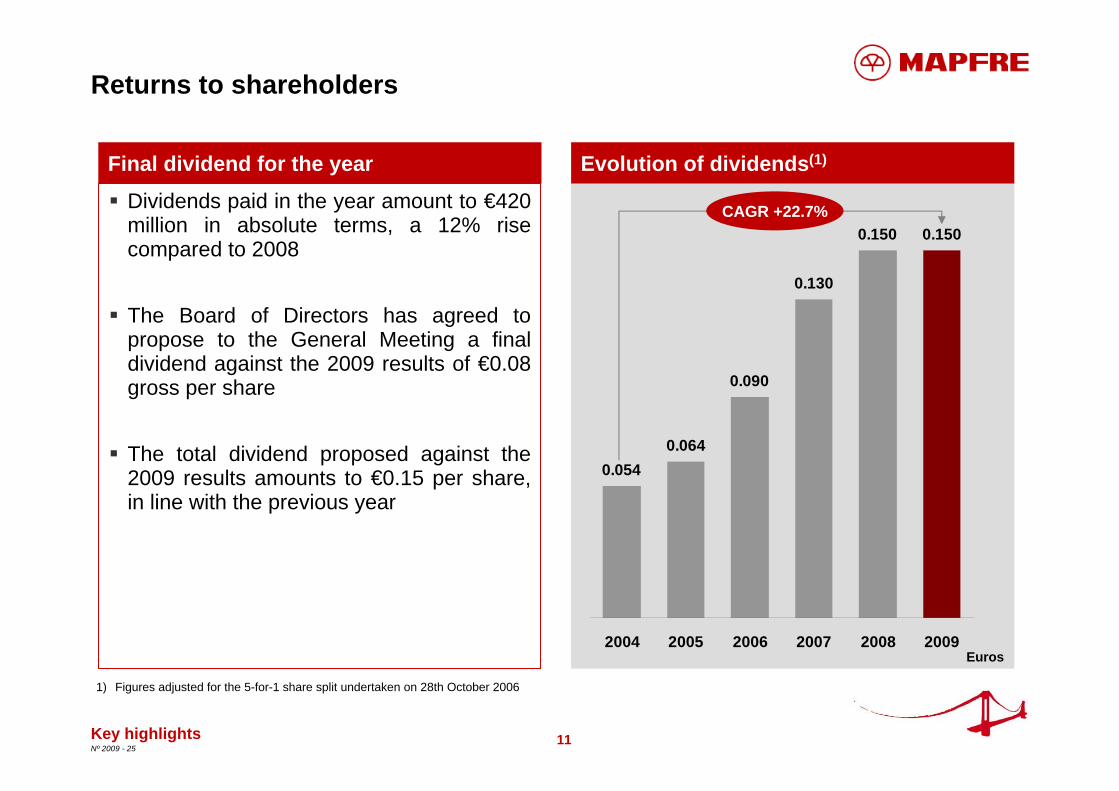
0.0540.064
0.090
0.130
0.150 0.150
2004 2005 2006 2007 2008 2009
Evolution of dividends(1)
Returns to shareholders
Final dividend for the year
CAGR +22.7%
1) Figures adjusted for the 5-for-1 share split undertaken on 28th October 2006
Euros
Dividends paid in the year amount to €420 million in absolute terms, a 12% rise compared to 2008
The Board of Directors has agreed to propose to the General Meeting a final dividend against the 2009 results of €0.08 gross per share
The total dividend proposed against the 2009 results amounts to €0.15 per share, in line with the previous year
Key highlights
12Nº 2009 - 25
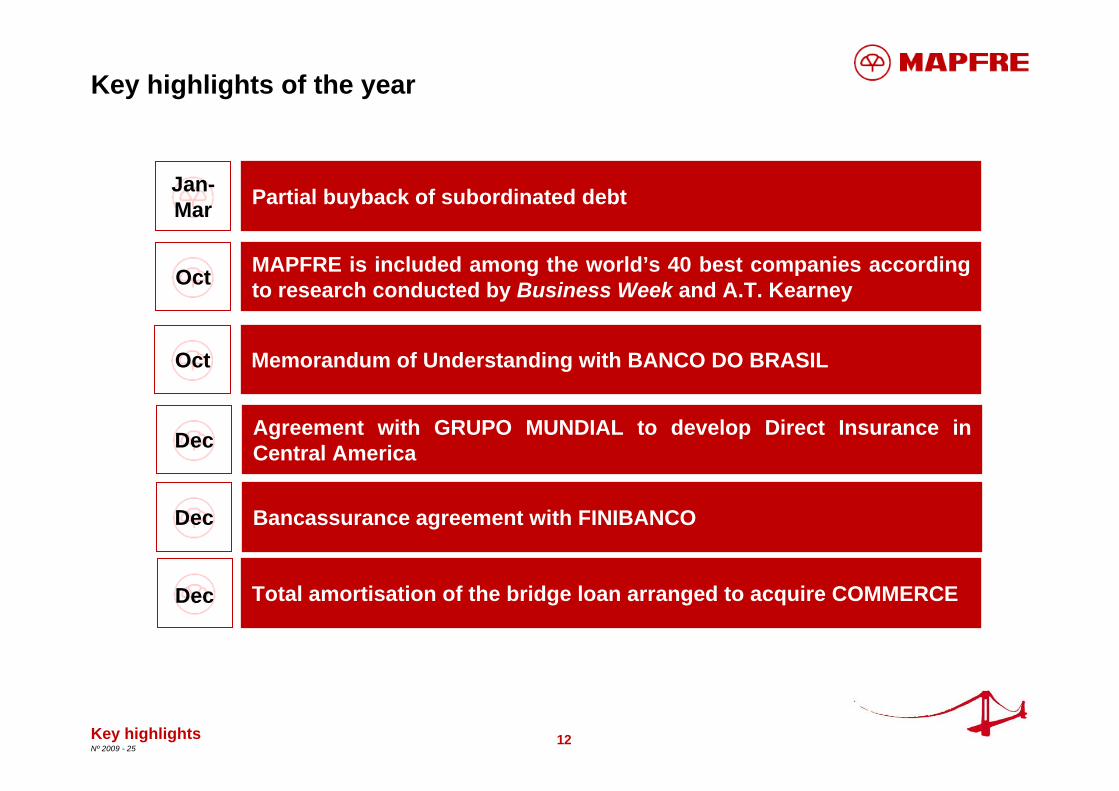
Key highlights of the year
Memorandum of Understanding with BANCO DO BRASILOct
Total amortisation of the bridge loan arranged to acquire COMMERCEDec
Agreement with GRUPO MUNDIAL to develop Direct Insurance in Central AmericaDec
Bancassurance agreement with FINIBANCODec
MAPFRE is included among the world’s 40 best companies according to research conducted by Business Week and A.T. KearneyOct
Partial buyback of subordinated debtJan-Mar
Key highlights

13Nº 2009 - 25
Key figures
Million Euros
Key highlights
1) Includes: Life technical reserves, mutual and pension funds2) Ratios calculated over net premiums earned3) Net operating expenses / average third party funds under management. Figures for MAPFRE VIDA
The number of shares as at 31.12.09 was 2,922,709,779. EPS is calculated using 2,847,864,358 shares, which is the weighted average number of shares after the capital increases undertaken in April and December (IAS 33).
Note:
2009 2008 % 09/08Results
Gross written and accepted premiums 15,606.8 14,304.8 9.1%
- Non-life 11,900.3 10,890.8 9.3% - Life 3,706.5 3,414.0 8.6%
Net result, group share 926.8 900.7 2.9%
Earnings per share (Euro cents) 32.54 33.14 -1.8%
Adjusted earnings per share (Euro cents) 32.79 35.00 -6.3%Balance sheet
Total assets 43,105.8 41,689.4 3.4%
Managed savings(1) 24,130.5 23,293.0 3.6%
Shareholders' equity 6,165.7 4,902.2 25.8%
Financial debt 2,062.6 3,044.5 -32.3%
Solvency ratio 284.8% 204.3%
Ratios
Non-life loss ratio(2) 70.8% 68.8%
Non-life expense ratio(2) 24.9% 25.1%
Non-life combined ratio(2) 95.7% 93.9%
Life assurance expense ratio(3) 1.16% 0.94%
ROE 16.7% 19.5%
Employees 35,225 34,603 1.8%
14Nº 2009 - 25
Key highlights
Consolidated financial information
Business development
Appendix
Financial supplement
Contacts
15Nº 2009 - 25
Contribution to consolidated results (%)
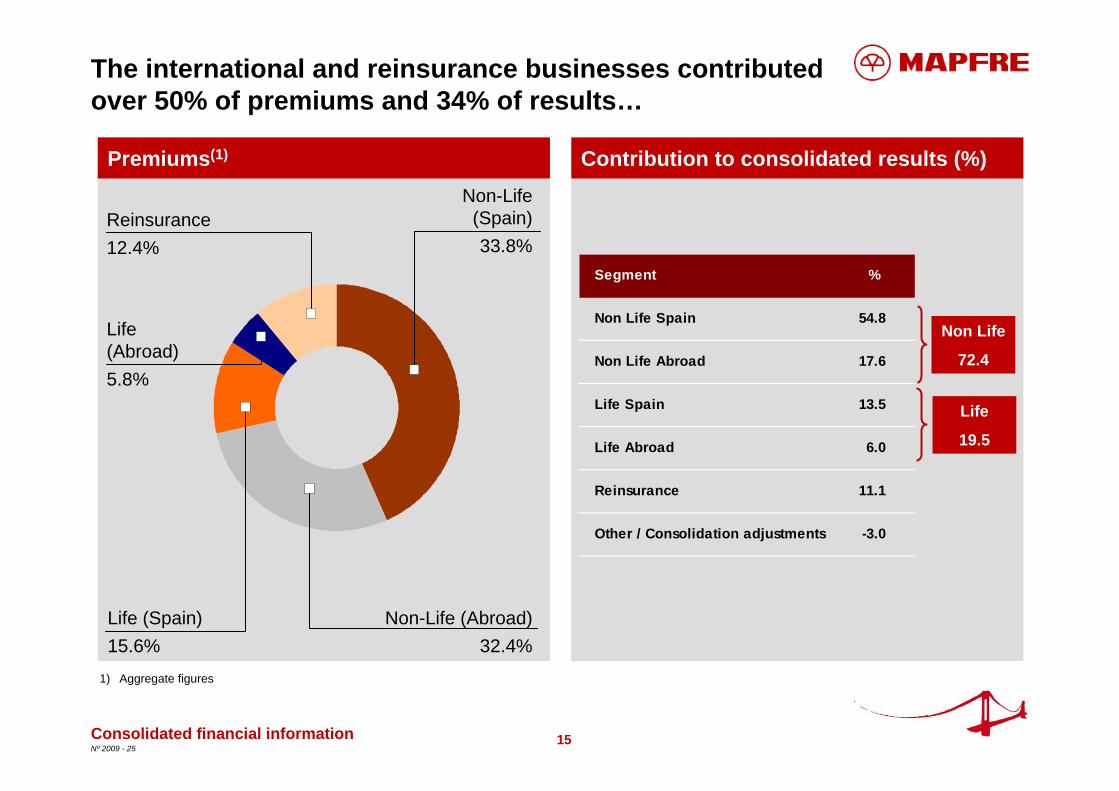
The international and reinsurance businesses contributed over 50% of premiums and 34% of results…
Premiums(1)
Consolidated financial information
1) Aggregate figures
Non Life
72.4
Life
19.5
Life (Abroad) 5.8%
Non-Life (Spain)33.8%
Non-Life (Abroad)32.4%
Life (Spain)15.6%
Reinsurance 12.4%
Segment %
Non Life Spain 54.8
Non Life Abroad 17.6
Life Spain 13.5
Life Abroad 6.0
Reinsurance 11.1
Other / Consolidation adjustments -3.0
16Nº 2009 - 25
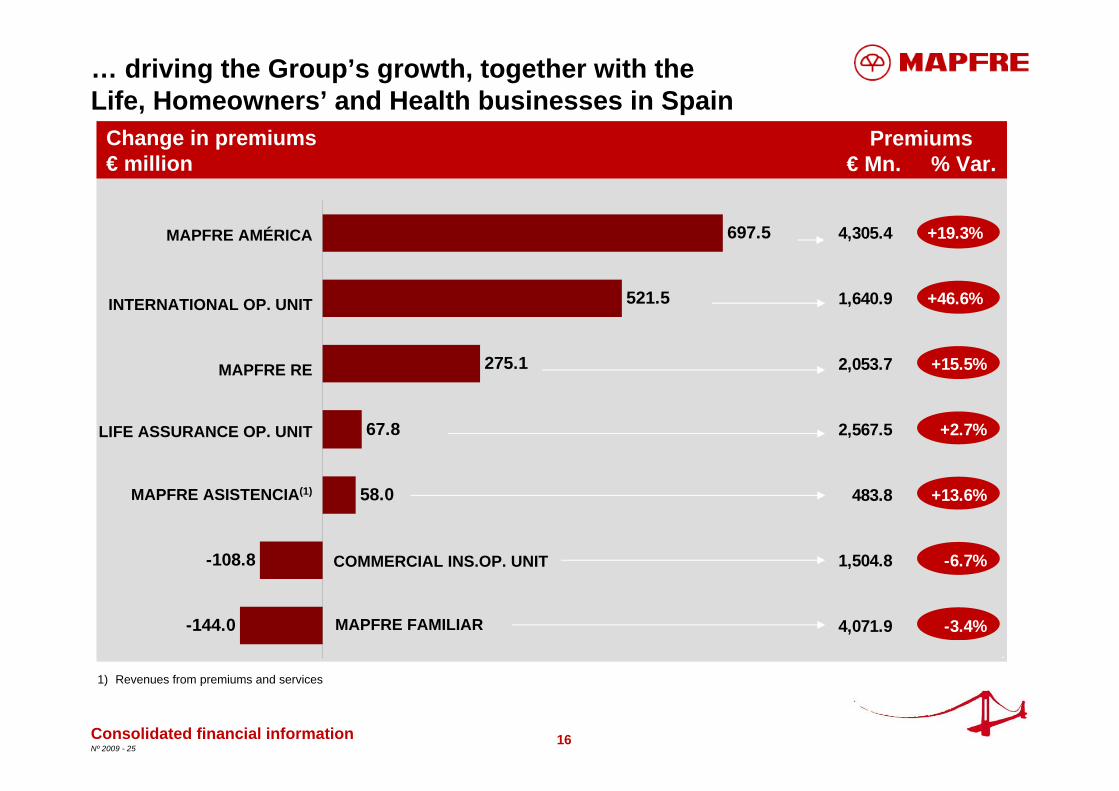
697.5
521.5
275.1
67.8
58.0
-108.8
-144.0
4,305.4 +19.3%
1,640.9 +46.6%
2,053.7 +15.5%
2,567.5 +2.7%
483.8 +13.6%
1,504.8 -6.7%
4,071.9 -3.4%
… driving the Group’s growth, together with the Life, Homeowners’ and Health businesses in Spain
Consolidated financial information
Change in premiums€ million
Premiums€ Mn. % Var.
1) Revenues from premiums and services
INTERNATIONAL OP. UNIT
MAPFRE AMÉRICA
COMMERCIAL INS.OP. UNIT
MAPFRE FAMILIAR
MAPFRE ASISTENCIA(1)
MAPFRE RE
LIFE ASSURANCE OP. UNIT
17Nº 2009 - 25
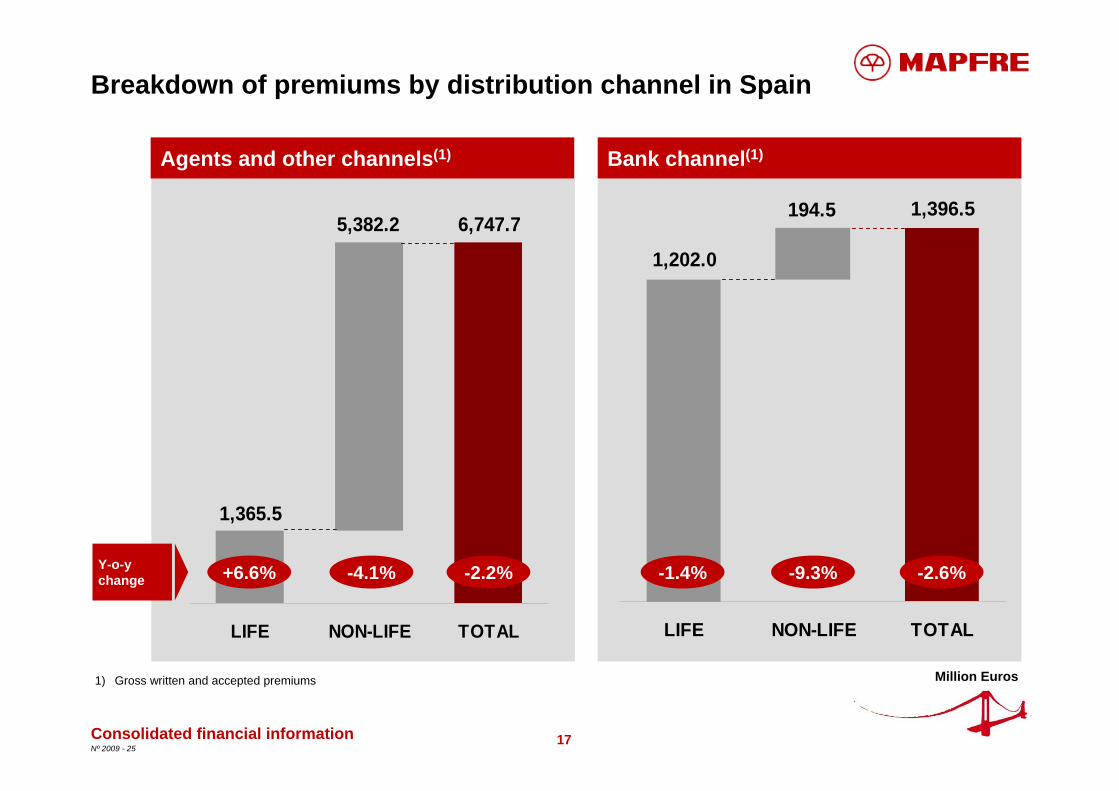
Breakdown of premiums by distribution channel in Spain
Consolidated financial information
Million Euros1) Gross written and accepted premiums
Bank channel(1)Agents and other channels(1)
5,382.2
1,365.5
6,747.7
LIFE NON-LIFE TOTAL
+6.6% -4.1% -2.2%Y-o-ychange
1,396.5
1,202.0
194.5
LIFE NON-LIFE TOTAL
-2.6%-9.3%-1.4%
18Nº 2009 - 25
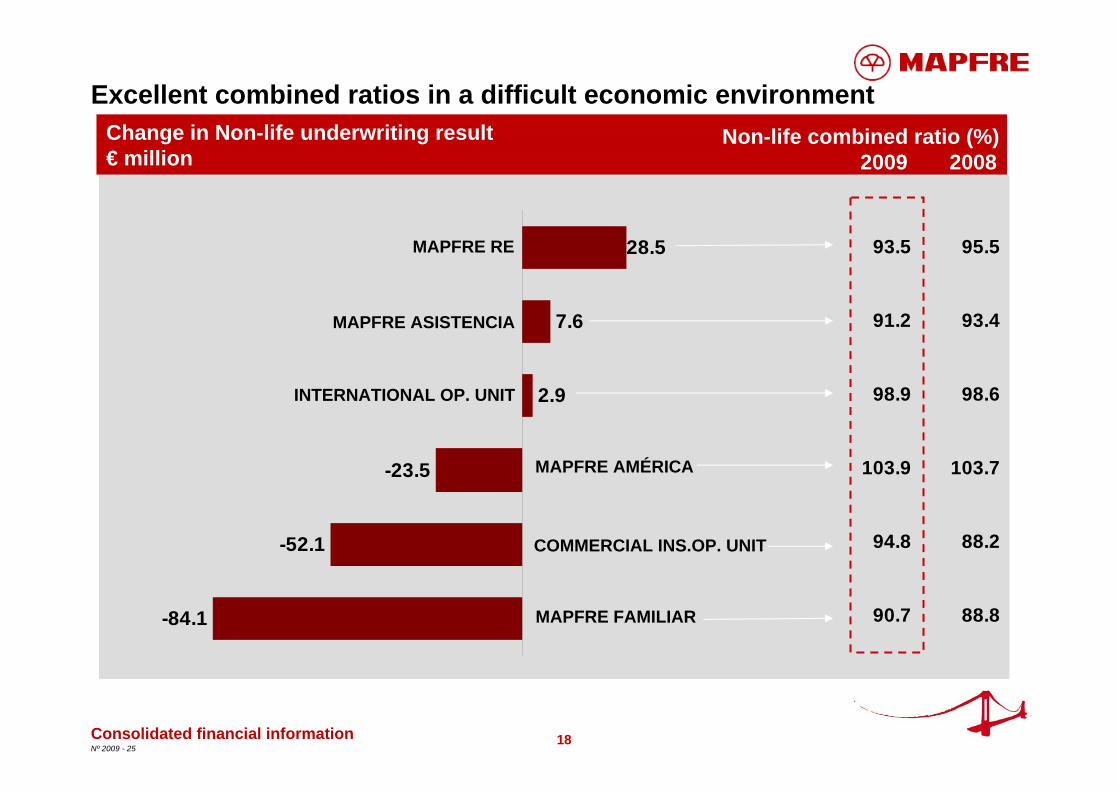
2.9
7.6
28.5
-23.5
-52.1
-84.1
Excellent combined ratios in a difficult economic environment
Consolidated financial information
Change in Non-life underwriting result€ million
Non-life combined ratio (%)2009 2008
MAPFRE RE
MAPFRE FAMILIAR
COMMERCIAL INS.OP. UNIT
MAPFRE AMÉRICA
INTERNATIONAL OP. UNIT
MAPFRE ASISTENCIA
93.5 95.5
91.2 93.4
98.9 98.6
103.9 103.7
94.8 88.2
90.7 88.8
19Nº 2009 - 25
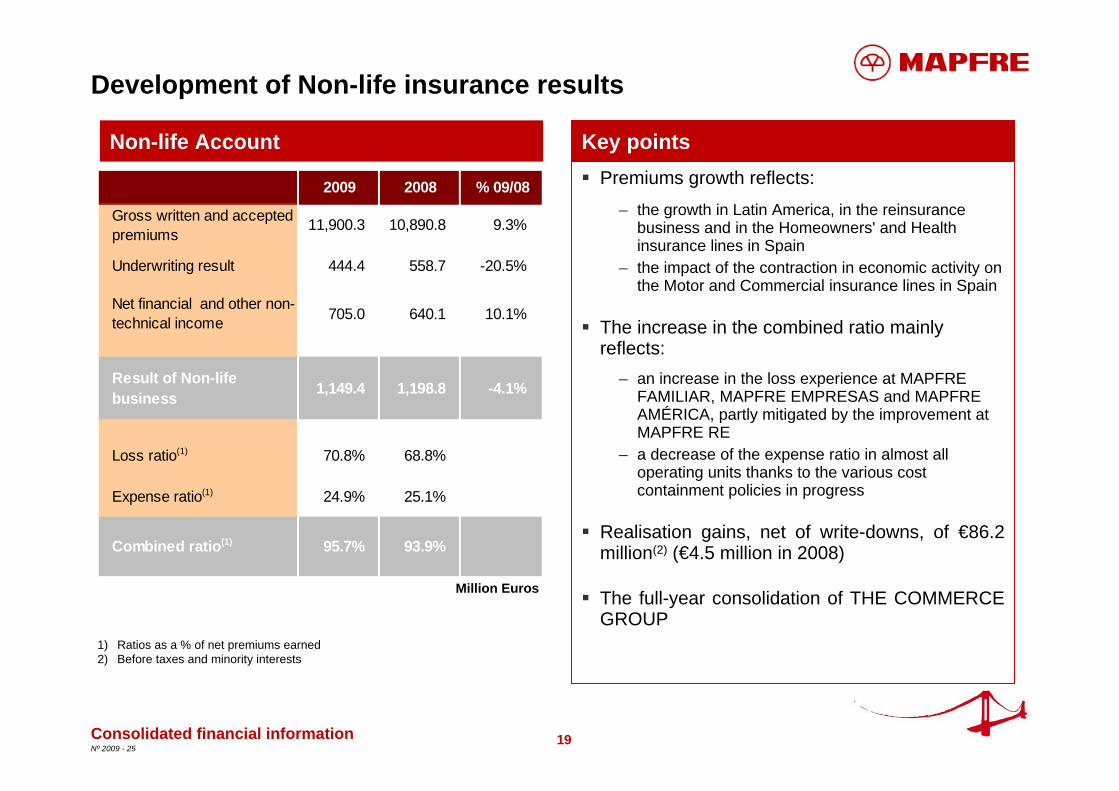
Development of Non-life insurance results
Consolidated financial information
Key pointsNon-life AccountPremiums growth reflects:
– the growth in Latin America, in the reinsurance business and in the Homeowners' and Health insurance lines in Spain
– the impact of the contraction in economic activity on the Motor and Commercial insurance lines in Spain
The increase in the combined ratio mainly reflects:
– an increase in the loss experience at MAPFRE FAMILIAR, MAPFRE EMPRESAS and MAPFRE AMÉRICA, partly mitigated by the improvement at MAPFRE RE
– a decrease of the expense ratio in almost all operating units thanks to the various cost containment policies in progress
Realisation gains, net of write-downs, of €86.2 million(2) (€4.5 million in 2008)
The full-year consolidation of THE COMMERCE GROUP
1) Ratios as a % of net premiums earned2) Before taxes and minority interests
Million Euros
2009 2008 % 09/08
Gross written and accepted premiums 11,900.3 10,890.8 9.3%
Underwriting result 444.4 558.7 -20.5%
Net financial and other non-technical income 705.0 640.1 10.1%
Result of Non-life business 1,149.4 1,198.8 -4.1%
Loss ratio(1) 70.8% 68.8%
Expense ratio(1) 24.9% 25.1%
Combined ratio(1) 95.7% 93.9%
20Nº 2009 - 25
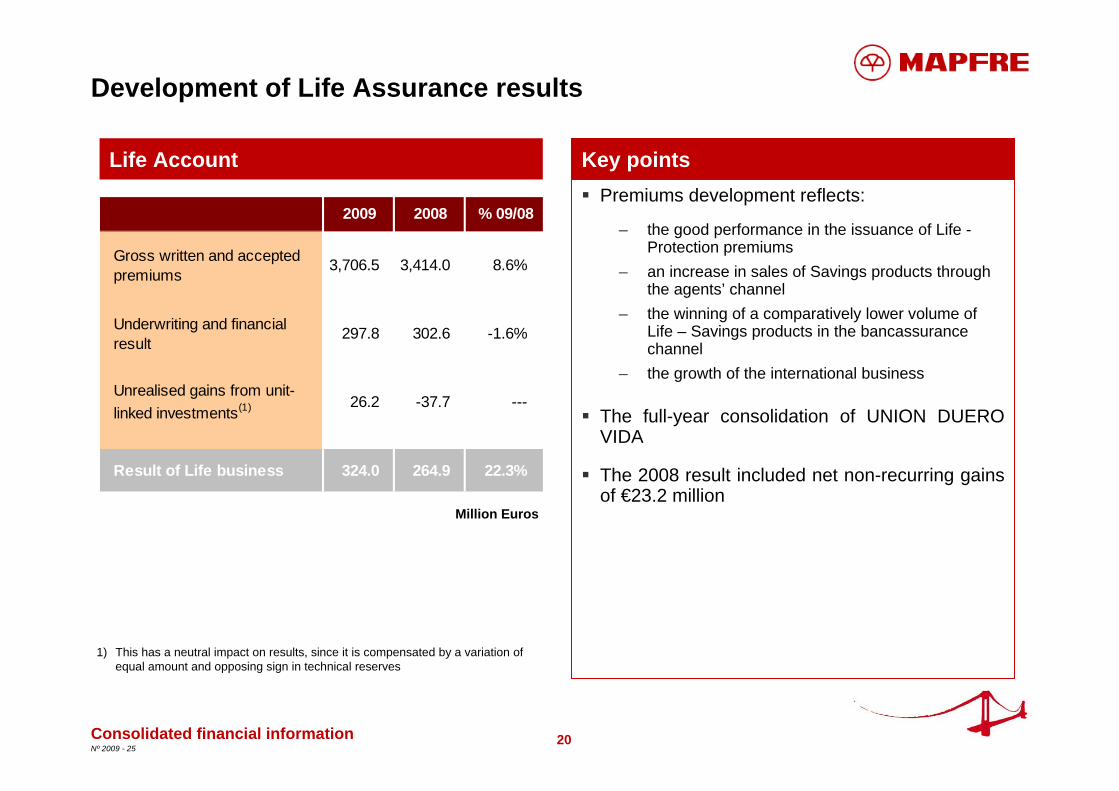
Development of Life Assurance results
Consolidated financial information
Life Account Key pointsPremiums development reflects:
– the good performance in the issuance of Life -Protection premiums
– an increase in sales of Savings products through the agents’ channel
– the winning of a comparatively lower volume of Life – Savings products in the bancassurancechannel
– the growth of the international business
The full-year consolidation of UNION DUERO VIDA
The 2008 result included net non-recurring gains of €23.2 million
Million Euros
1) This has a neutral impact on results, since it is compensated by a variation of equal amount and opposing sign in technical reserves
2009 2008 % 09/08
Gross written and accepted premiums
3,706.5 3,414.0 8.6%
Underwriting and financial result
297.8 302.6 -1.6%
Unrealised gains from unit-linked investments(1) 26.2 -37.7 ---
Result of Life business 324.0 264.9 22.3%

21Nº 2009 - 25
Development of results from Other Business Activities
Consolidated financial information
Other Business Activities(1) Key pointsLarger operating revenues thanks to the growth at MAPFRE QUAVITAE and the non-insurance subsidiaries of MAPFRE FAMILIARAppropriation of €14 million of property stock depreciation provisions at MAPFRE INMUEBLES
Increase in net financial revenues, which reflects:
– a decline in financial expenses due to lower interest rates and the debt reduction
– gains of €53.8 million(2) arising from the buyback of subordinated debt
Negative results from minority interests due to the loss of €49 million at BANCO DE SERVICIOS FINANCIEROS CAJA MADRID-MAPFRE
Million Euros
1) “Other Business Activities” include the Group’s non-insurance activities undertaken by the insurance subsidiaries, as well as by other subsidiaries. It also includes the activities of the holding company MAPFRE S.A.
2) Before taxes and minority interests
2009 2008 % 09/08
Operating revenues 532.5 502.6 5.9%
Operating expenses -488.4 -522.8 -6.6%
Net financial income -3.3 -14.8 -77.7%
Results from minority interests -48.5 0.5 ---
Other net revenues -19.5 -46.0 -57.6%
Results from OtherBusiness Activities -27.2 -80.5
22Nº 2009 - 25
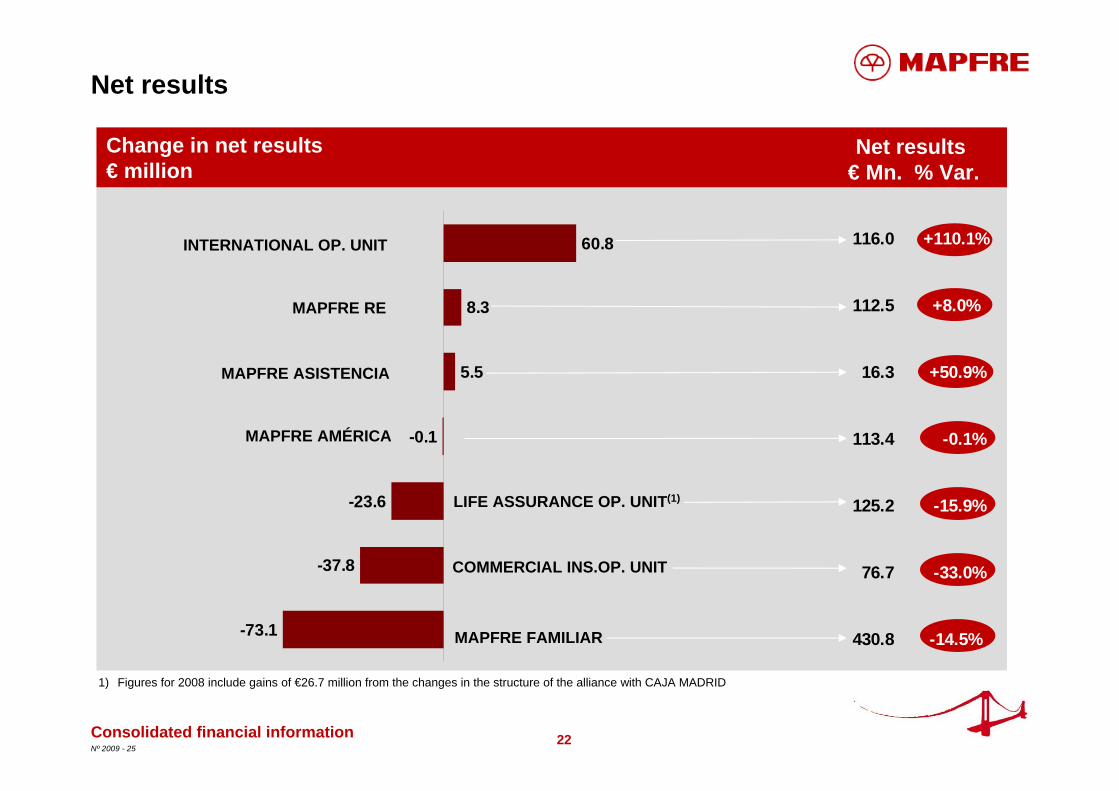
-23.6
-0.1
5.5
8.3
60.8
-73.1
-37.8
Net results
Consolidated financial information
Change in net results€ million
Net results€ Mn. % Var.
1) Figures for 2008 include gains of €26.7 million from the changes in the structure of the alliance with CAJA MADRID
INTERNATIONAL OP. UNIT
MAPFRE AMÉRICA
MAPFRE RE
COMMERCIAL INS.OP. UNIT
LIFE ASSURANCE OP. UNIT(1)
MAPFRE ASISTENCIA
MAPFRE FAMILIAR
116.0 +110.1%
112.5 +8.0%
16.3 +50.9%
113.4 -0.1%
125.2 -15.9%
76.7 -33.0%
430.8 -14.5%
23Nº 2009 - 25
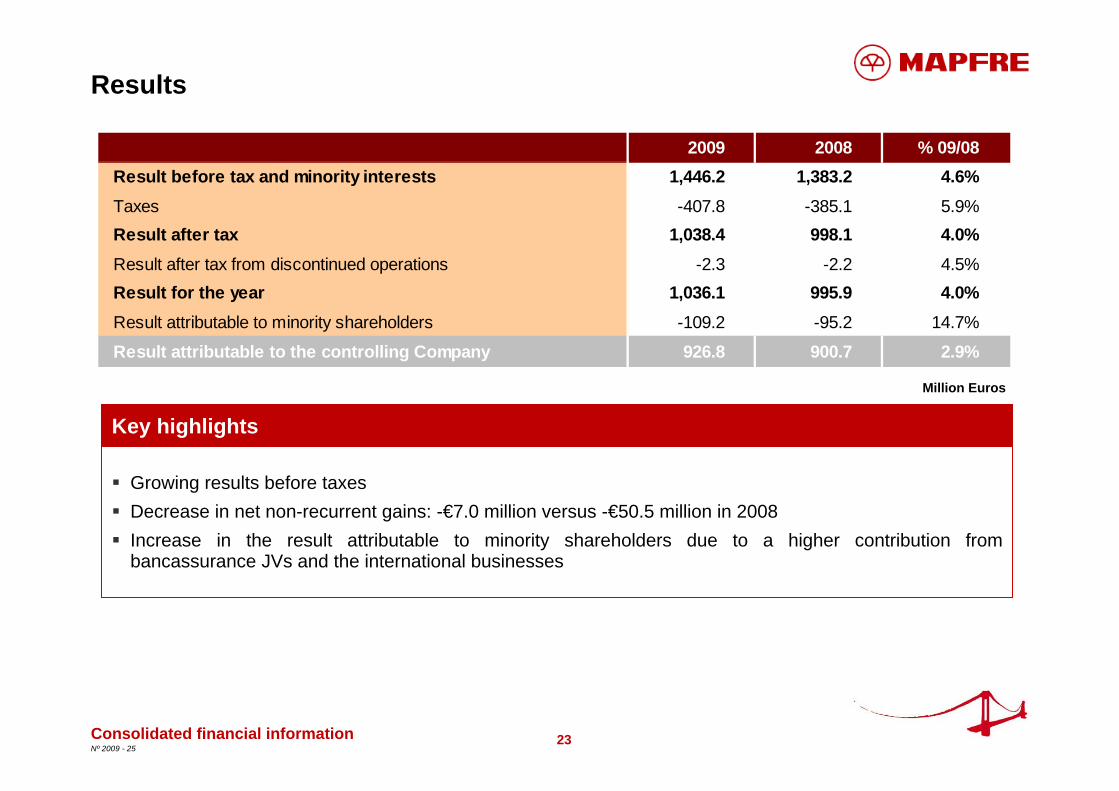
Results
Growing results before taxesDecrease in net non-recurrent gains: -€7.0 million versus -€50.5 million in 2008Increase in the result attributable to minority shareholders due to a higher contribution from bancassurance JVs and the international businesses
Consolidated financial information
Million Euros
Key highlights
2009 2008 % 09/08Result before tax and minority interests 1,446.2 1,383.2 4.6%Taxes -407.8 -385.1 5.9%Result after tax 1,038.4 998.1 4.0%Result after tax from discontinued operations -2.3 -2.2 4.5%Result for the year 1,036.1 995.9 4.0%Result attributable to minority shareholders -109.2 -95.2 14.7%
Result attributable to the controlling Company 926.8 900.7 2.9%
24Nº 2009 - 25
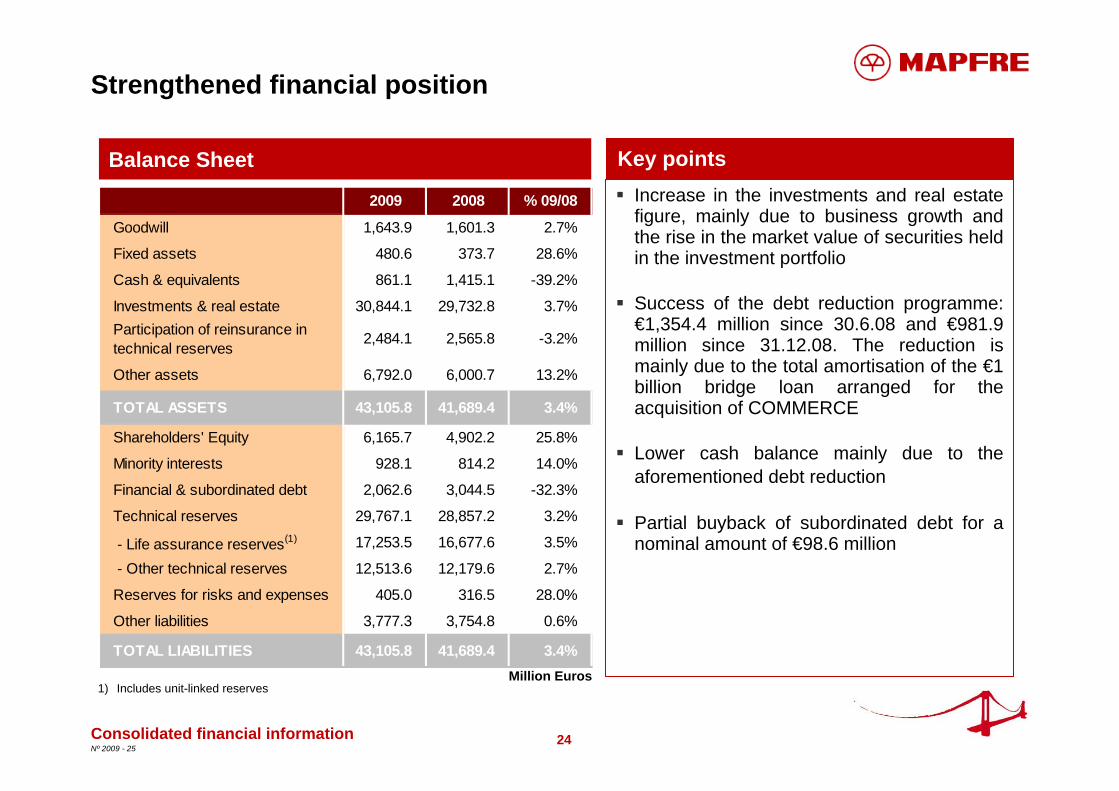
Strengthened financial position
Increase in the investments and real estate figure, mainly due to business growth and the rise in the market value of securities held in the investment portfolio
Success of the debt reduction programme: €1,354.4 million since 30.6.08 and €981.9 million since 31.12.08. The reduction is mainly due to the total amortisation of the €1 billion bridge loan arranged for the acquisition of COMMERCE
Lower cash balance mainly due to the aforementioned debt reduction
Partial buyback of subordinated debt for a nominal amount of €98.6 million
Consolidated financial information
Key pointsBalance Sheet
Million Euros
2009 2008 % 09/08
Goodwill 1,643.9 1,601.3 2.7%
Fixed assets 480.6 373.7 28.6%
Cash & equivalents 861.1 1,415.1 -39.2%
Investments & real estate 30,844.1 29,732.8 3.7%Participation of reinsurance in technical reserves 2,484.1 2,565.8 -3.2%
Other assets 6,792.0 6,000.7 13.2%
TOTAL ASSETS 43,105.8 41,689.4 3.4%
Shareholders' Equity 6,165.7 4,902.2 25.8%
Minority interests 928.1 814.2 14.0%
Financial & subordinated debt 2,062.6 3,044.5 -32.3%
Technical reserves 29,767.1 28,857.2 3.2%
- Life assurance reserves(1) 17,253.5 16,677.6 3.5%
- Other technical reserves 12,513.6 12,179.6 2.7%
Reserves for risks and expenses 405.0 316.5 28.0%
Other liabilities 3,777.3 3,754.8 0.6%
TOTAL LIABILITIES 43,105.8 41,689.4 3.4%
1) Includes unit-linked reserves
25Nº 2009 - 25
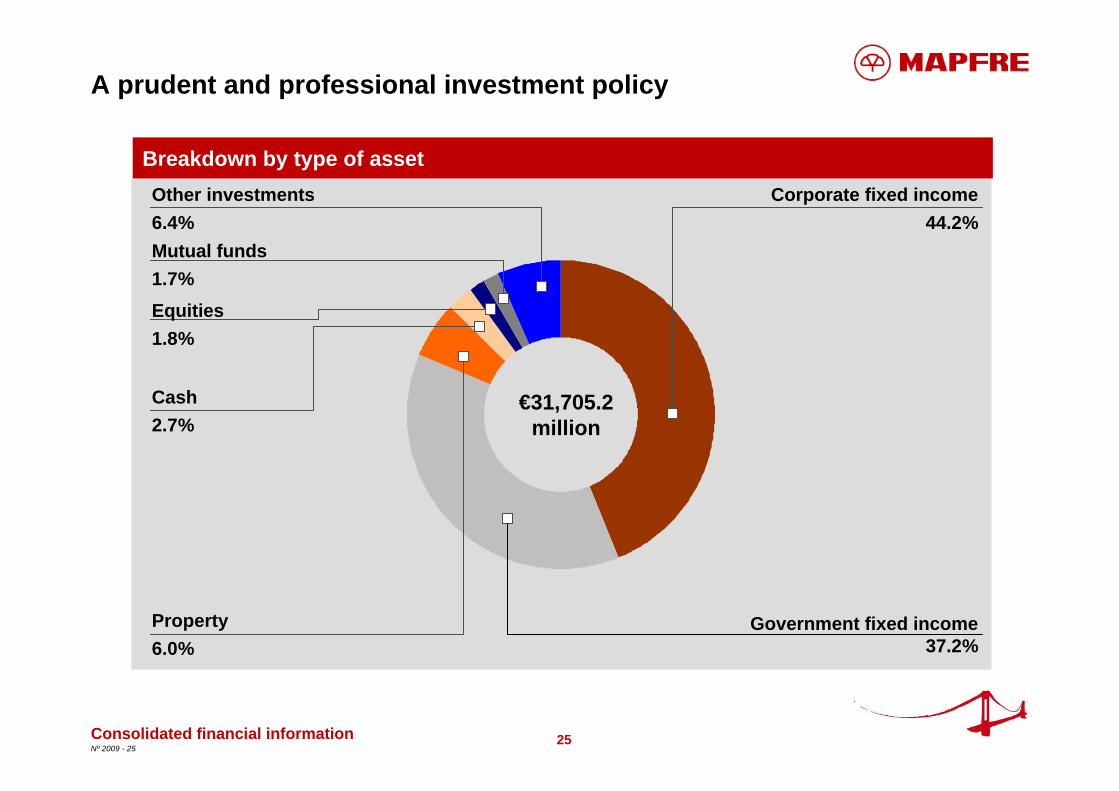
A prudent and professional investment policy
Breakdown by type of asset
Cash 2.7%
Property6.0%
Equities1.8%
Corporate fixed income44.2%
Mutual funds1.7%
Other investments6.4%
Government fixed income 37.2%
€31,705.2million
Consolidated financial information

26Nº 2009 - 25
Diversified fixed income portfolio
By type of guarantee
By S&P ratingsAAA
40.1%
AA28.7%
A24.1%
Unrated1.1%
BB or lower2.8%
BBB3.2%
By issuer
By currencyEuro
79.8%
Real6.0%
Other currencies6.2%
Spanish Government15.4%(1)
Financial institutions38.1%
Other15.9%
US Dollar8.0%
Ordinary74.4%
Hybrid 4.9%
ABS1.4%
Covered bonds11.0%
Other guarantees8.3%
Book value as at 31.12.2009: €25,808.5 million
Consolidated financial information
Other Governments
30.6%
1) 12.2% of portfolio as at 31.12.08.

27Nº 2009 - 25
MAPFRE’s equity has increased by nearly €1.4 billion during 2009
Consolidated financial information
Million Euros
Equity shows an increase of €1,377.4 million since 31.12.2008, which reflects:
– the recovery in the market value of the investment portfolio
– slight gains from translation differences (compared to significant losses in 2008)
– the results for the year– the success of the scrip dividend plan, which
contributed €320.4 million to equity, compared to €150.2 million in 2008(1)
Key pointsStatement of changes in equity
1) Before duties, taxes and expenses
2009 2008BALANCE AS AT PRIOR YEAR END 5,716.4 5,614.4
Additions and deductions accounted for directly in equity
Investments available for sale 461.9 -647.7
Translation adjustments 16.4 -116.4
Shadow accounting -89.5 153.2
TOTAL 388.8 -610.9
Result for the period 1,036.1 995.9
Distribution of previous year's result -237.1 -203.1
Interim dividend for the year -252.2 -219.1
Other items 441.8 139.2
BALANCE AS AT PERIOD END 7,093.8 5,716.4
28Nº 2009 - 25
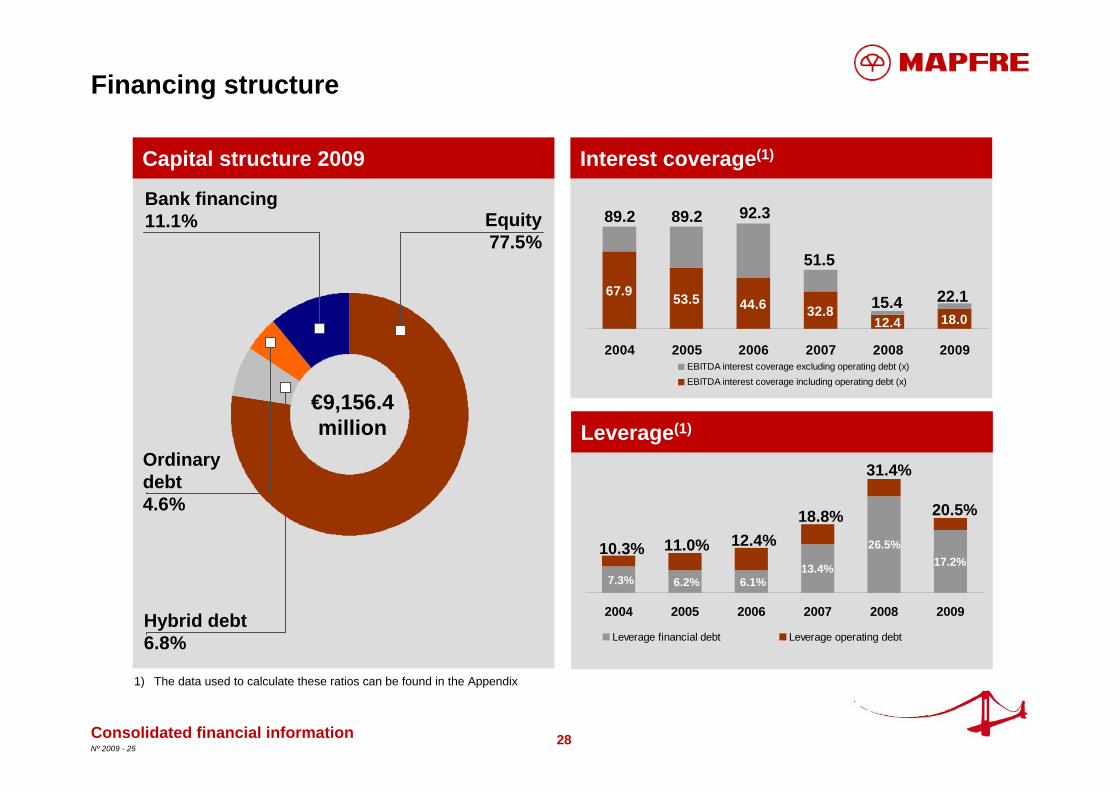
17.2%13.4%6.1%6.2%7.3%
26.5%
2004 2005 2006 2007 2008 2009
Leverage financial debt Leverage operating debt
12.4 18.0
67.9 53.5 44.6 32.8
2004 2005 2006 2007 2008 2009EBITDA interest coverage excluding operating debt (x)EBITDA interest coverage including operating debt (x)
Financing structure
Capital structure 2009 Interest coverage(1)
Leverage(1)
89.2 89.2 92.3
51.5
10.3% 11.0% 12.4%18.8%
Hybrid debt6.8%
Ordinary debt4.6%
€9,156.4million
Equity77.5%
Bank financing11.1%
31.4%
15.4
1) The data used to calculate these ratios can be found in the Appendix
Consolidated financial information
22.1
20.5%
29Nº 2009 - 25
Key highlights
Consolidated financial information
Business development
Appendix
Financial supplement
Contacts
30Nº 2009 - 25
MAPFRE FAMILIAR: Key highlights 2009
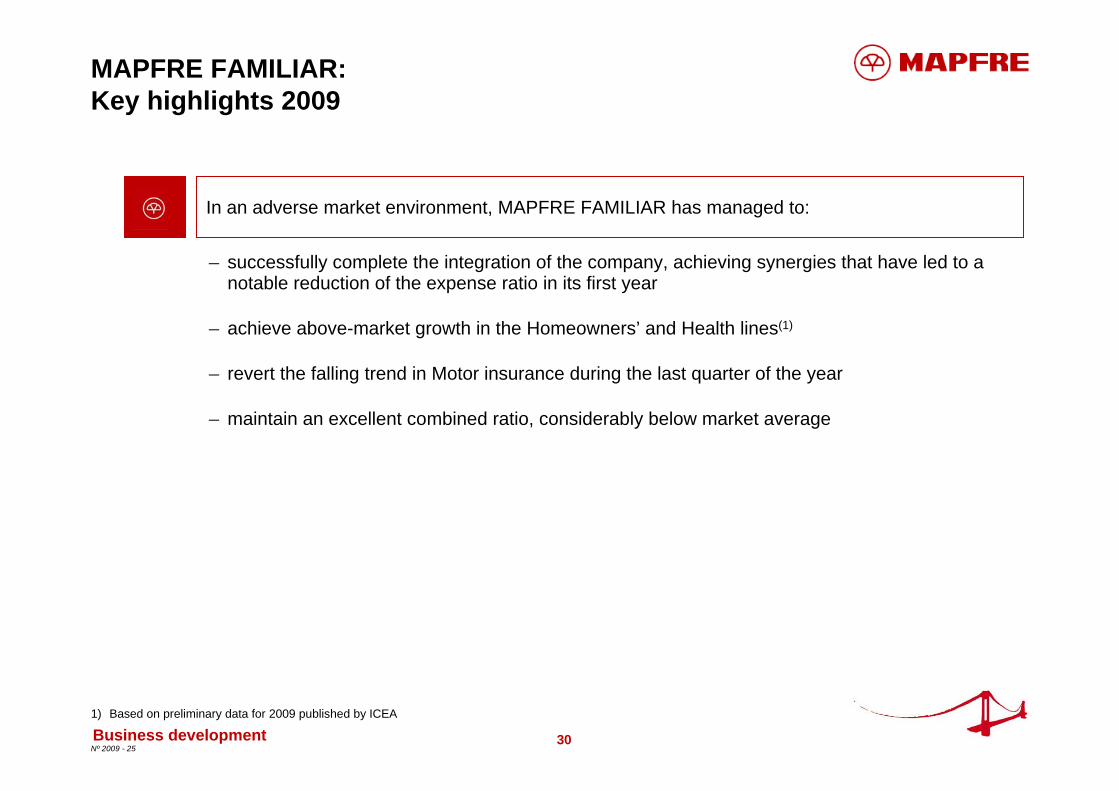
In an adverse market environment, MAPFRE FAMILIAR has managed to:
– successfully complete the integration of the company, achieving synergies that have led to a notable reduction of the expense ratio in its first year
– achieve above-market growth in the Homeowners’ and Health lines(1)
– revert the falling trend in Motor insurance during the last quarter of the year
– maintain an excellent combined ratio, considerably below market average
Business development1) Based on preliminary data for 2009 published by ICEA
31Nº 2009 - 25
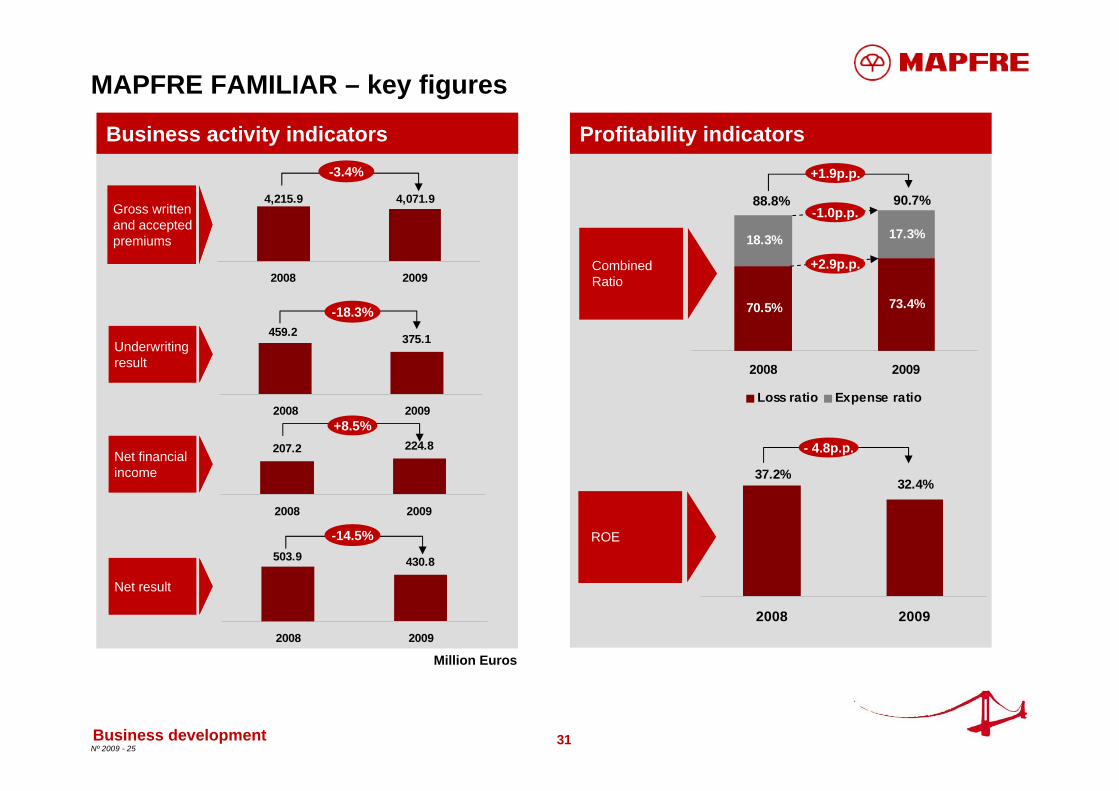
32.4%37.2%
2008 2009
70.5% 73.4%
18.3% 17.3%
2008 2009
Loss ratio Expense ratio
4,215.9 4,071.9
2008 2009
375.1459.2
2008 2009
207.2 224.8
2008 2009
503.9 430.8
2008 2009
MAPFRE FAMILIAR – key figures
Million Euros
Profitability indicatorsBusiness activity indicators
88.8% 90.7%
+1.9p.p.
Underwriting result
Net financial income
Net result
CombinedRatio
+2.9p.p.
-1.0p.p.
Business development
Gross written and accepted premiums
ROE
-18.3%
-3.4%
+8.5%
-14.5%
- 4.8p.p.
32Nº 2009 - 25
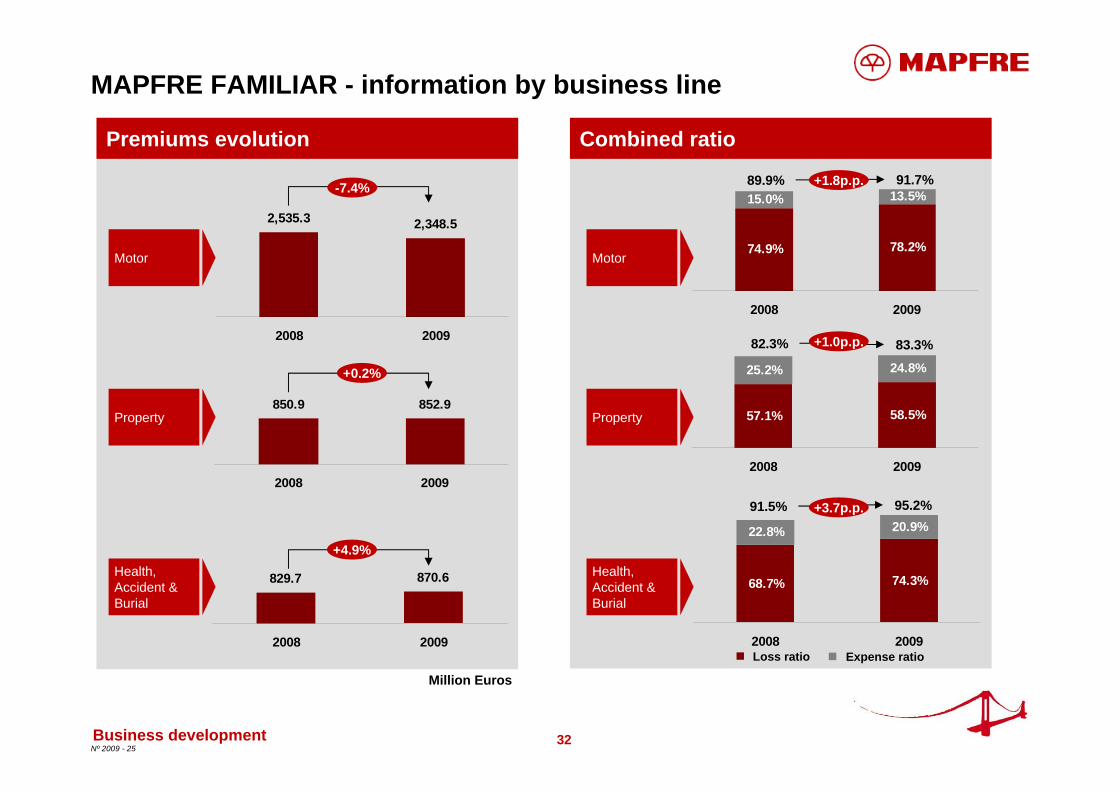
74.9% 78.2%
15.0% 13.5%
2008 2009
57.1% 58.5%
25.2% 24.8%
2008 2009
68.7% 74.3%
22.8% 20.9%
2008 2009
2,535.3 2,348.5
2008 2009
829.7 870.6
2008 2009
850.9 852.9
2008 2009
MAPFRE FAMILIAR - information by business line
Combined ratioPremiums evolution
Property
Motor
Health, Accident & Burial
+1.8p.p.
+3.7p.p.
Property
Motor
Health, Accident &Burial
+1.0p.p.
91.5% 95.2%
82.3% 83.3%
89.9% 91.7%
Business development
Million Euros
Loss ratio Expense ratio
+0.2%
-7.4%
+4.9%
33Nº 2009 - 25
MAPFRE FAMILIAR: Key highlights
Premiums evolution
Variation in combined ratio
Net financial income
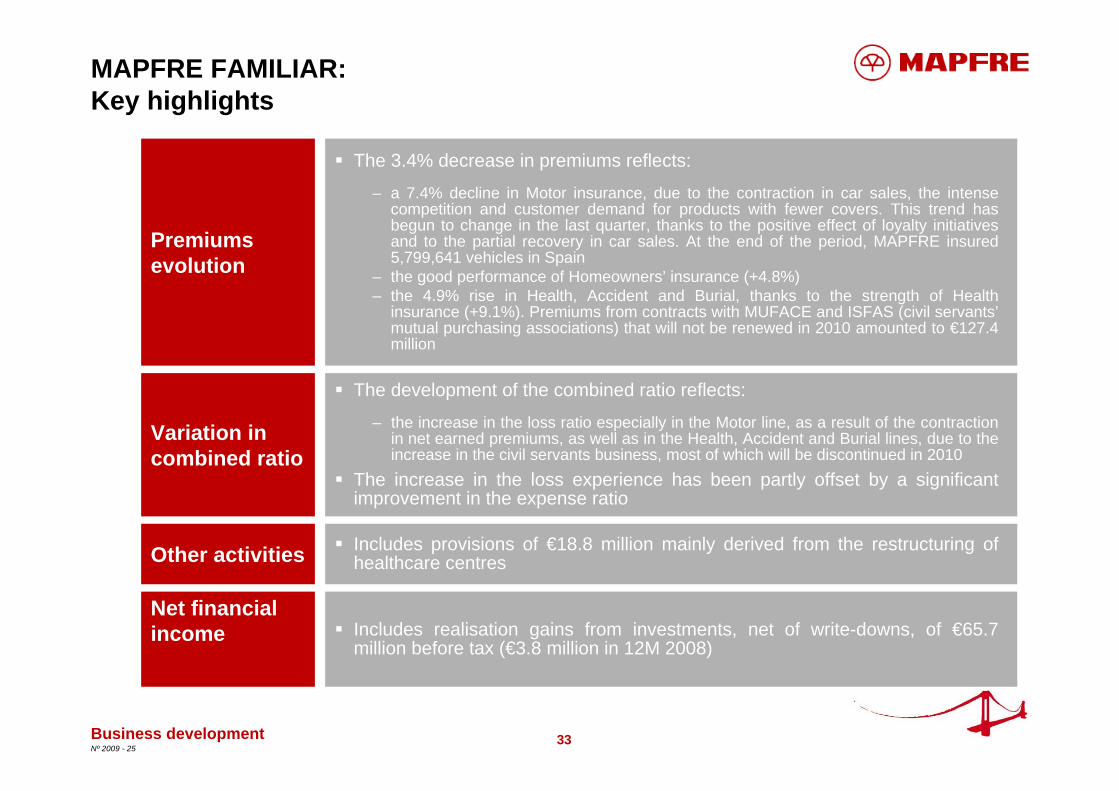
The 3.4% decrease in premiums reflects:
– a 7.4% decline in Motor insurance, due to the contraction in car sales, the intense competition and customer demand for products with fewer covers. This trend has begun to change in the last quarter, thanks to the positive effect of loyalty initiatives and to the partial recovery in car sales. At the end of the period, MAPFRE insured 5,799,641 vehicles in Spain
– the good performance of Homeowners’ insurance (+4.8%) – the 4.9% rise in Health, Accident and Burial, thanks to the strength of Health
insurance (+9.1%). Premiums from contracts with MUFACE and ISFAS (civil servants’mutual purchasing associations) that will not be renewed in 2010 amounted to €127.4 million
The development of the combined ratio reflects:
– the increase in the loss ratio especially in the Motor line, as a result of the contraction in net earned premiums, as well as in the Health, Accident and Burial lines, due to the increase in the civil servants business, most of which will be discontinued in 2010
The increase in the loss experience has been partly offset by a significant improvement in the expense ratio
Includes realisation gains from investments, net of write-downs, of €65.7 million before tax (€3.8 million in 12M 2008)
Other activities Includes provisions of €18.8 million mainly derived from the restructuring of healthcare centres
Business development
34Nº 2009 - 25
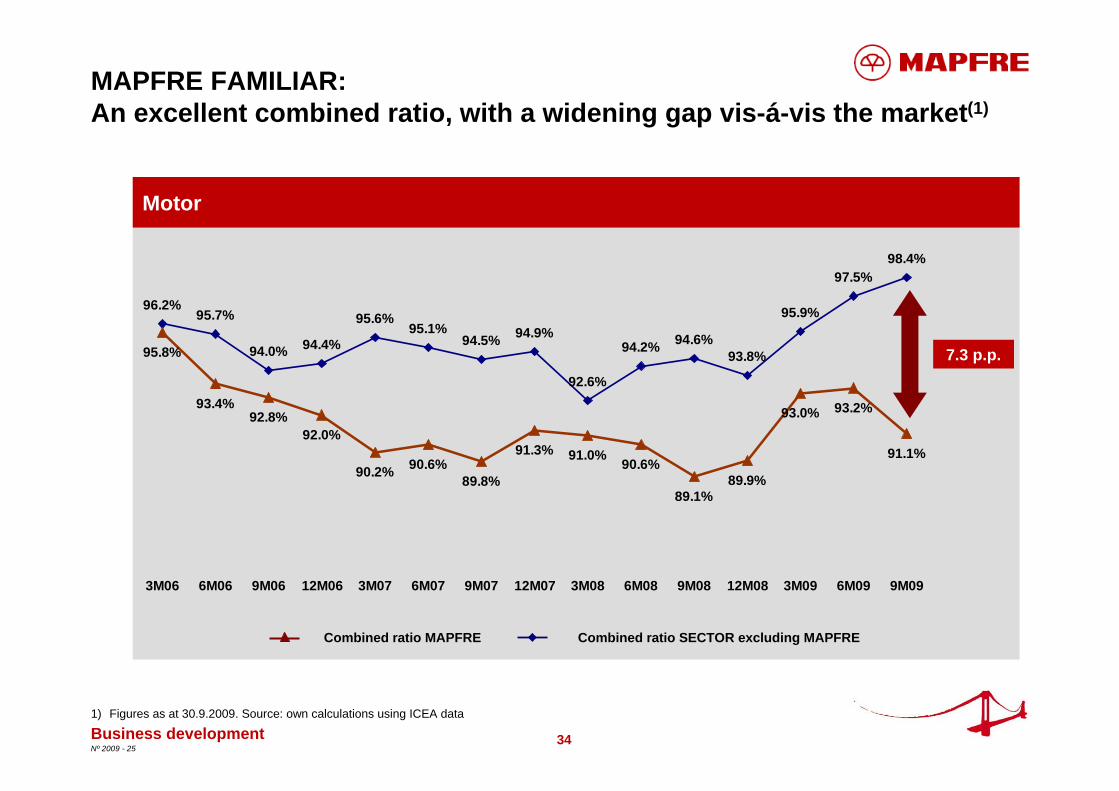
95.6%94.5% 94.9%
94.2% 94.6%93.8%
95.9%
97.5%98.4%
89.1%89.9%
93.0% 93.2%
91.1%
95.1%94.4%94.0%
96.2%95.7%
92.6%
90.6%91.0%91.3%
89.8%90.6%90.2%
92.0%92.8%
93.4%
95.8%
3M06 6M06 9M06 12M06 3M07 6M07 9M07 12M07 3M08 6M08 9M08 12M08 3M09 6M09 9M09
MAPFRE FAMILIAR: An excellent combined ratio, with a widening gap vis-á-vis the market(1)
Motor
Combined ratio MAPFRE Combined ratio SECTOR excluding MAPFRE
Business development1) Figures as at 30.9.2009. Source: own calculations using ICEA data
7.3 p.p.
35Nº 2009 - 25
COMMERCIAL INSURANCE OPERATING UNIT: Reorganisation of the Commercial Insurance Business
Business development
The organisational and operational restructuring process of MAPFRE EMPRESAS has concluded with the granting of all the relevant administrative authorisationsAs from 1st January 2010, business activities will be divided as follows:
– MAPFRE GLOBAL RISKS will underwrite the risks of multinational companies with international programmes, as well as risks from global sectors, such as Aviation & Space, Marine and Power Plants over 250 Mw
– MAPFRE EMPRESAS will underwrite all other corporate risks in the Spanish market
With this division MAPFRE aims to provide highly specialised services to all its corporate clients in Spain and abroad
36Nº 2009 - 25
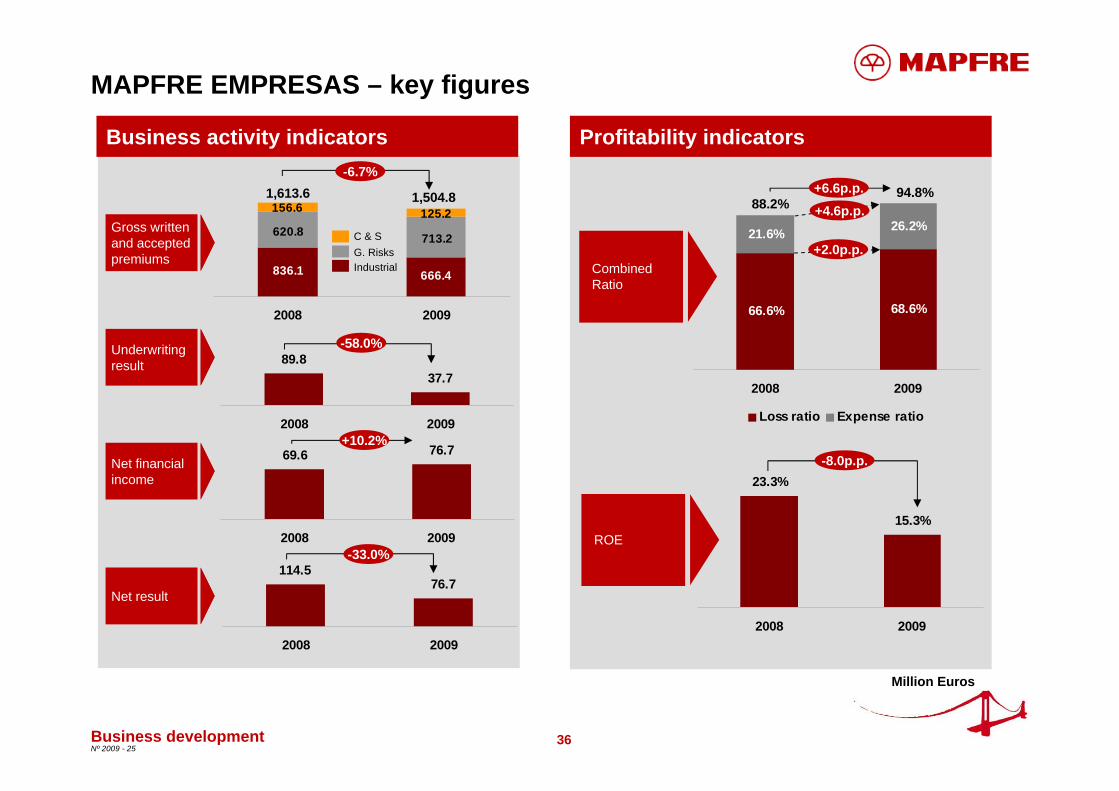
836.1 666.4
620.8 713.2
125.2156.6
2008 2009
69.6 76.7
2008 2009
89.837.7
2008 2009
114.576.7
2008 2009
66.6% 68.6%
21.6% 26.2%
2008 2009
Loss ratio Expense ratio
23.3%
15.3%
2008 2009
MAPFRE EMPRESAS – key figures
Business development
Million Euros
Profitability indicatorsBusiness activity indicators
1,613.6 1,504.8
CombinedRatio
Underwriting result
Gross written and accepted premiums
Net financial income
Net result
ROE
88.2%94.8%
IndustrialG. RisksC & S
-8.0p.p.
-6.7%
-58.0%
+10.2%
-33.0%
+2.0p.p.
+4.6p.p.+6.6p.p.
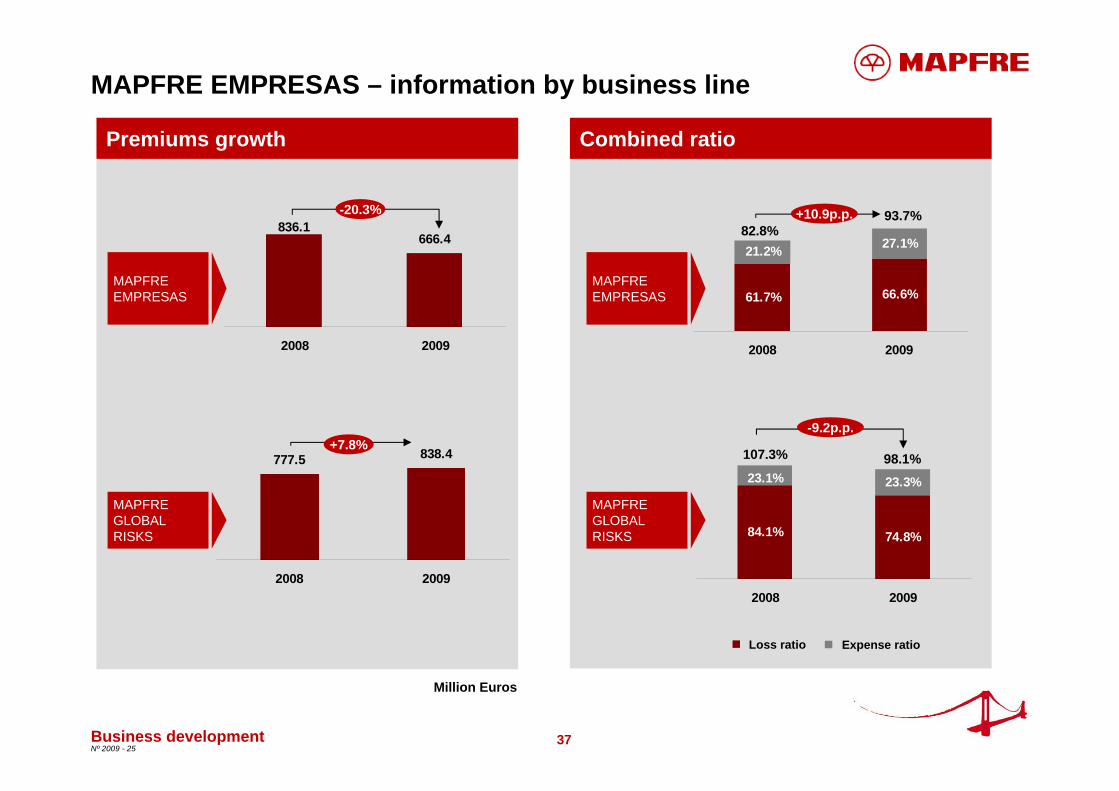
37Nº 2009 - 25
61.7% 66.6%
21.2% 27.1%
2008 2009
84.1% 74.8%
23.1% 23.3%
2008 2009
836.1666.4
2008 2009
777.5 838.4
2008 2009
MAPFRE EMPRESAS – information by business line
Combined ratioPremiums growth
107.3% 98.1%
82.8%93.7%
Loss ratio Expense ratio
Business development
Million Euros
MAPFRE GLOBAL RISKS
MAPFRE EMPRESAS
MAPFRE GLOBAL RISKS
MAPFRE EMPRESAS
-20.3% +10.9p.p.
+7.8%-9.2p.p.
38Nº 2009 - 25
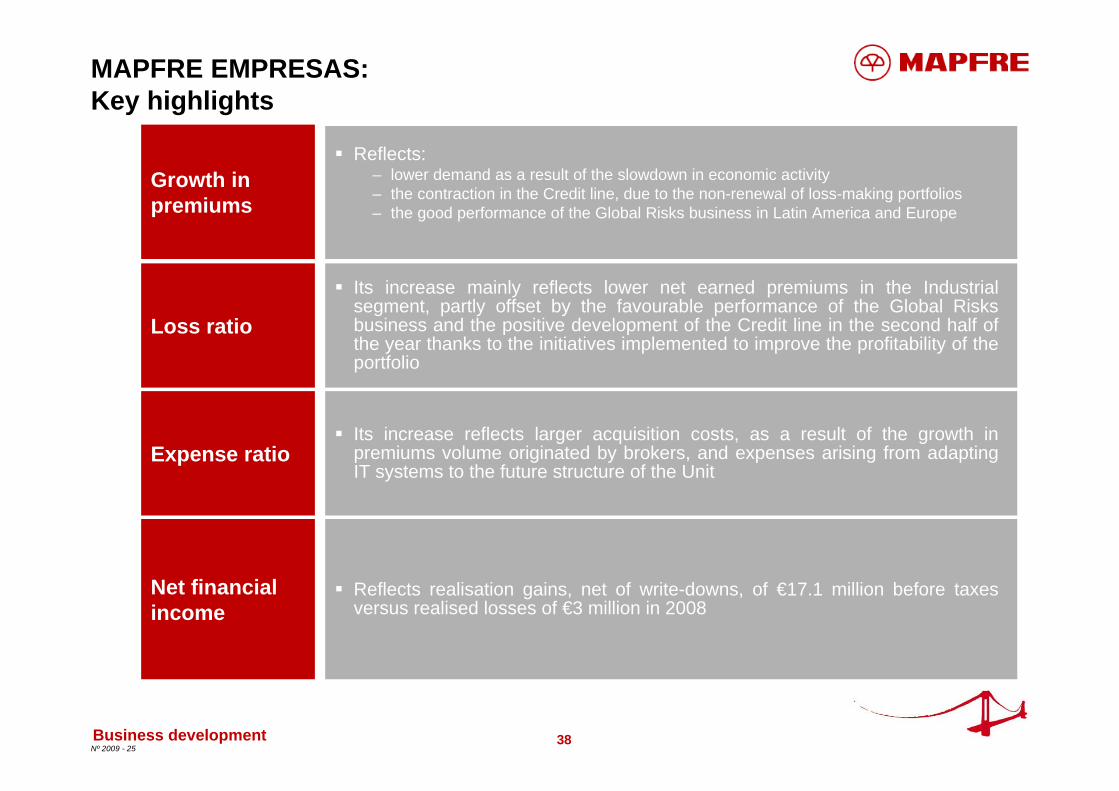
MAPFRE EMPRESAS: Key highlights
Growth in premiums
Loss ratio
Expense ratio
Net financial income
Reflects: – lower demand as a result of the slowdown in economic activity – the contraction in the Credit line, due to the non-renewal of loss-making portfolios– the good performance of the Global Risks business in Latin America and Europe
Its increase mainly reflects lower net earned premiums in the Industrial segment, partly offset by the favourable performance of the Global Risks business and the positive development of the Credit line in the second half of the year thanks to the initiatives implemented to improve the profitability of the portfolio
Its increase reflects larger acquisition costs, as a result of the growth in premiums volume originated by brokers, and expenses arising from adapting IT systems to the future structure of the Unit
Reflects realisation gains, net of write-downs, of €17.1 million before taxes versus realised losses of €3 million in 2008
Business development
39Nº 2009 - 25
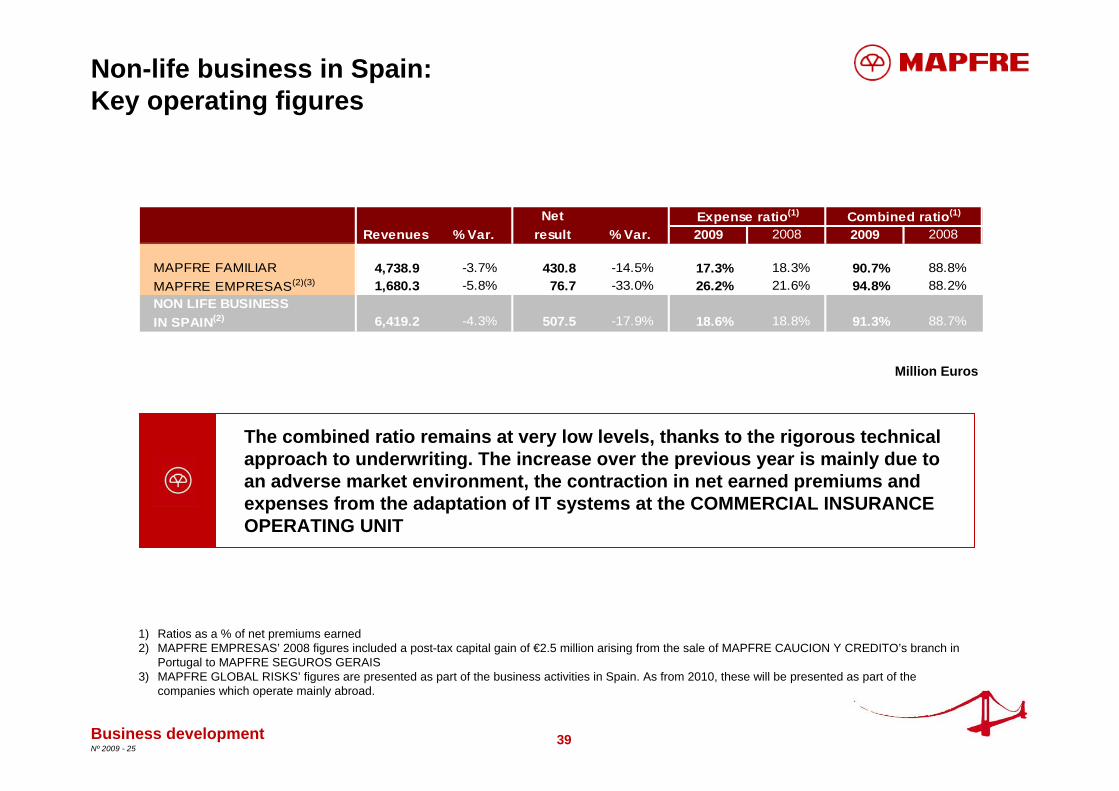
Non-life business in Spain:Key operating figures
Million Euros
Business development
1) Ratios as a % of net premiums earned2) MAPFRE EMPRESAS’ 2008 figures included a post-tax capital gain of €2.5 million arising from the sale of MAPFRE CAUCION Y CREDITO’s branch in
Portugal to MAPFRE SEGUROS GERAIS 3) MAPFRE GLOBAL RISKS’ figures are presented as part of the business activities in Spain. As from 2010, these will be presented as part of the
companies which operate mainly abroad.
(3)
NetRevenues % Var. result % Var. 2009 2008 2009 2008
MAPFRE FAMILIAR 4,738.9 -3.7% 430.8 -14.5% 17.3% 18.3% 90.7% 88.8%MAPFRE EMPRESAS(2)(3) 1,680.3 -5.8% 76.7 -33.0% 26.2% 21.6% 94.8% 88.2%NON LIFE BUSINESSIN SPAIN(2) 6,419.2 -4.3% 507.5 -17.9% 18.6% 18.8% 91.3% 88.7%
Expense ratio(1) Combined ratio(1)
The combined ratio remains at very low levels, thanks to the rigorous technical approach to underwriting. The increase over the previous year is mainly due to an adverse market environment, the contraction in net earned premiums and expenses from the adaptation of IT systems at the COMMERCIAL INSURANCE OPERATING UNIT
40Nº 2009 - 25
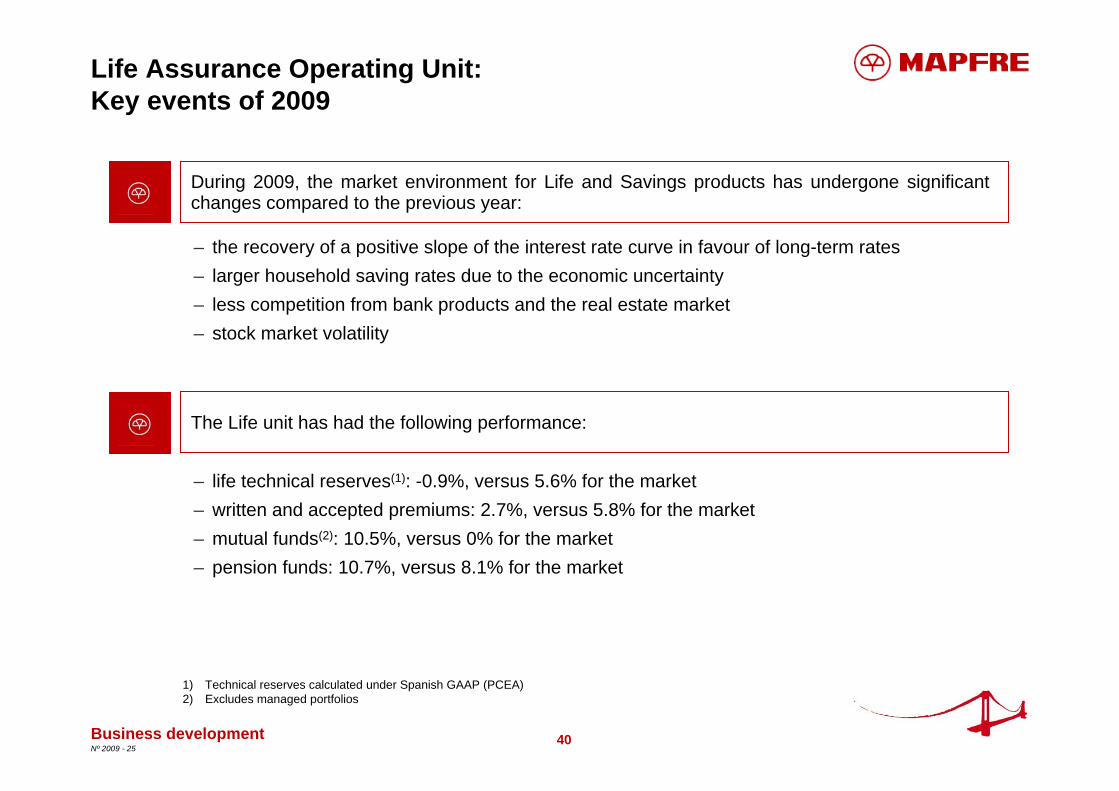
Life Assurance Operating Unit: Key events of 2009
During 2009, the market environment for Life and Savings products has undergone significant changes compared to the previous year:
– the recovery of a positive slope of the interest rate curve in favour of long-term rates– larger household saving rates due to the economic uncertainty– less competition from bank products and the real estate market– stock market volatility
– life technical reserves(1): -0.9%, versus 5.6% for the market– written and accepted premiums: 2.7%, versus 5.8% for the market– mutual funds(2): 10.5%, versus 0% for the market– pension funds: 10.7%, versus 8.1% for the market
The Life unit has had the following performance:
Business development
1) Technical reserves calculated under Spanish GAAP (PCEA)2) Excludes managed portfolios

41Nº 2009 - 25
2,567.52,499.7
2008 2009
32.6
2008 2009
32.6
2008 2009
26.7
2008 2009
0.92%
1.16%
2008 2009
16.9%14.6%
2008 2009
Life Assurance Operating Unit – key figures
Business development
Profitability indicatorsBusiness activity indicators
ROE
Underwriting and financial result
Gross written and accepted premiums
Net result
Million Euros
Expense ratio(1)
Gross result
185.5184.5
237.4
125.2148.8
+10.4%
215.1
122.1
Reorganisation of the alliance with CAJA MADRID
151.9
247.7
+2.7%
+0.5%
+22.1%
-4.2%
-15.9%
+2.5%
-2.3p.p.
+0.24p.p.
1) Net operating expenses / average third party funds under management
42Nº 2009 - 25
Life Assurance Operating Unit: Key highlights
Business development
Growth in results
Development of funds under management
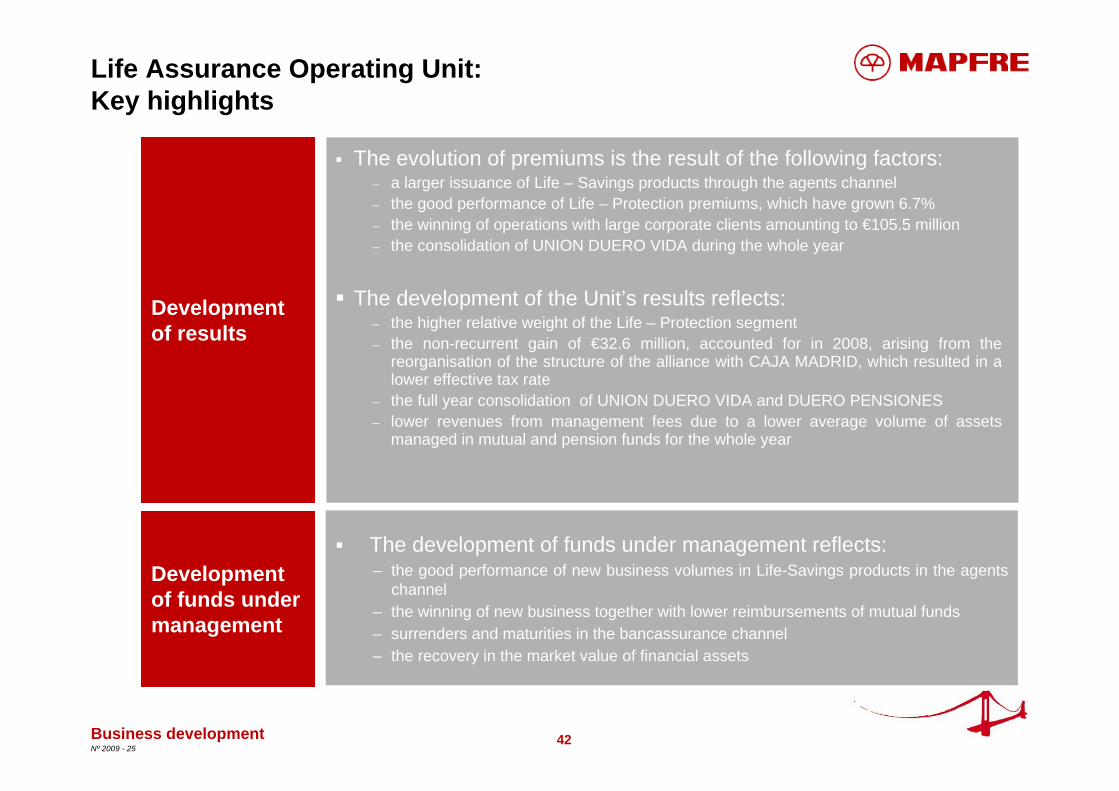
The development of funds under management reflects:– the good performance of new business volumes in Life-Savings products in the agents
channel– the winning of new business together with lower reimbursements of mutual funds– surrenders and maturities in the bancassurance channel – the recovery in the market value of financial assets
Development of results
The evolution of premiums is the result of the following factors:– a larger issuance of Life – Savings products through the agents channel– the good performance of Life – Protection premiums, which have grown 6.7%– the winning of operations with large corporate clients amounting to €105.5 million– the consolidation of UNION DUERO VIDA during the whole year
The development of the Unit’s results reflects:– the higher relative weight of the Life – Protection segment– the non-recurrent gain of €32.6 million, accounted for in 2008, arising from the
reorganisation of the structure of the alliance with CAJA MADRID, which resulted in a lower effective tax rate
– the full year consolidation of UNION DUERO VIDA and DUERO PENSIONES– lower revenues from management fees due to a lower average volume of assets
managed in mutual and pension funds for the whole year
43Nº 2009 - 25
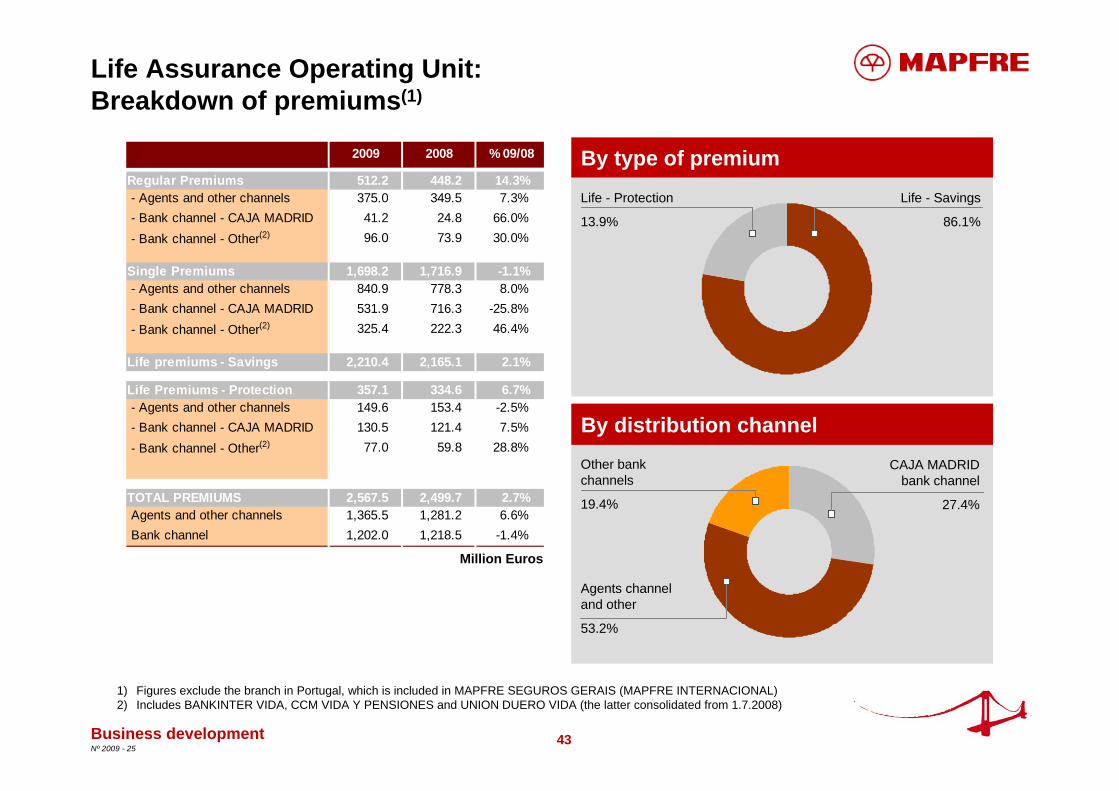
Life Assurance Operating Unit: Breakdown of premiums(1)
2009 2008 % 09/08
Regular Premiums 512.2 448.2 14.3% - Agents and other channels 375.0 349.5 7.3% - Bank channel - CAJA MADRID 41.2 24.8 66.0% - Bank channel - Other(2) 96.0 73.9 30.0%
Single Premiums 1,698.2 1,716.9 -1.1% - Agents and other channels 840.9 778.3 8.0% - Bank channel - CAJA MADRID 531.9 716.3 -25.8% - Bank channel - Other(2) 325.4 222.3 46.4%
Life premiums - Savings 2,210.4 2,165.1 2.1%
Life Premiums - Protection 357.1 334.6 6.7% - Agents and other channels 149.6 153.4 -2.5% - Bank channel - CAJA MADRID 130.5 121.4 7.5% - Bank channel - Other(2) 77.0 59.8 28.8%
TOTAL PREMIUMS 2,567.5 2,499.7 2.7% Agents and other channels 1,365.5 1,281.2 6.6% Bank channel 1,202.0 1,218.5 -1.4%
By type of premium
Business development
1) Figures exclude the branch in Portugal, which is included in MAPFRE SEGUROS GERAIS (MAPFRE INTERNACIONAL)2) Includes BANKINTER VIDA, CCM VIDA Y PENSIONES and UNION DUERO VIDA (the latter consolidated from 1.7.2008)
By distribution channel
Million Euros
Life - Savings
86.1%
Life - Protection
13.9%
CAJA MADRID bank channel
27.4%
Other bank channels
19.4%
Agents channel and other
53.2%
44Nº 2009 - 25
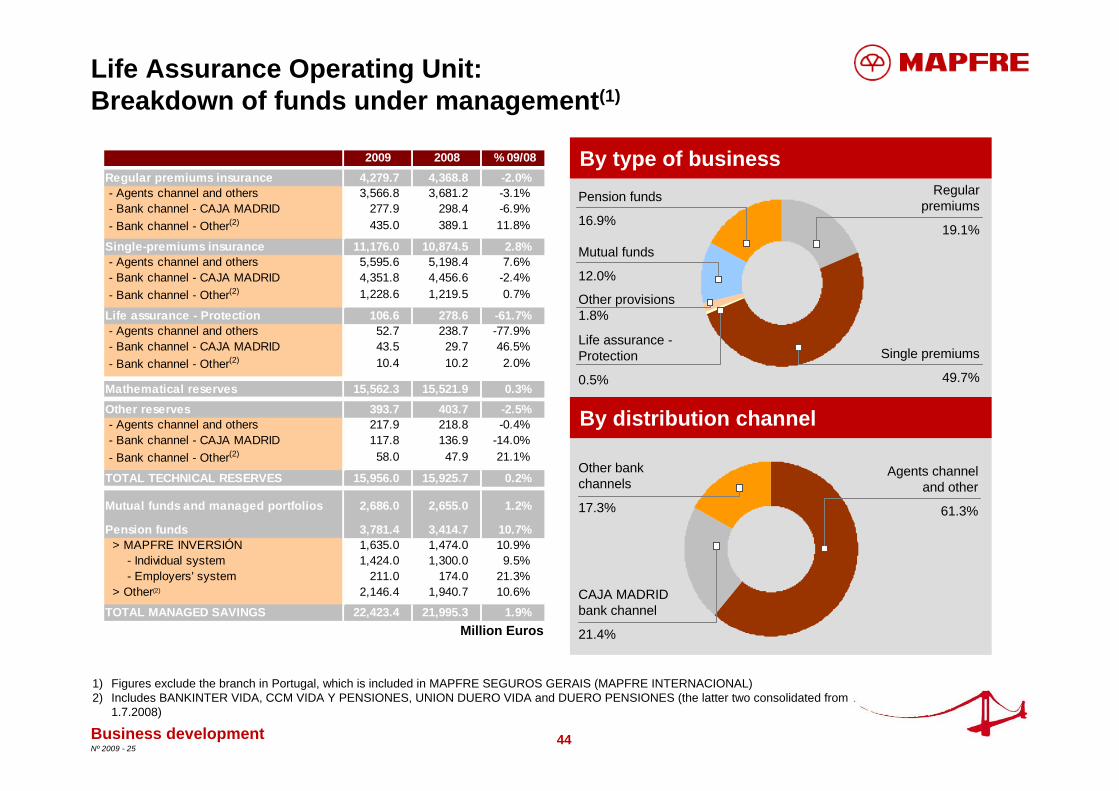
Life Assurance Operating Unit:Breakdown of funds under management(1)
Business development
1) Figures exclude the branch in Portugal, which is included in MAPFRE SEGUROS GERAIS (MAPFRE INTERNACIONAL)2) Includes BANKINTER VIDA, CCM VIDA Y PENSIONES, UNION DUERO VIDA and DUERO PENSIONES (the latter two consolidated from
1.7.2008)
Million Euros
By type of business
By distribution channel
Regular premiums
19.1%
Life assurance -Protection
0.5%
Single premiums
49.7%
Other provisions 1.8%
CAJA MADRID bank channel
21.4%
Other bank channels
17.3%
Agents channel and other
61.3%
Mutual funds
12.0%
Pension funds
16.9%
2009 2008 % 09/08Regular premiums insurance 4,279.7 4,368.8 -2.0% - Agents channel and others 3,566.8 3,681.2 -3.1% - Bank channel - CAJA MADRID 277.9 298.4 -6.9% - Bank channel - Other(2) 435.0 389.1 11.8%
Single-premiums insurance 11,176.0 10,874.5 2.8% - Agents channel and others 5,595.6 5,198.4 7.6% - Bank channel - CAJA MADRID 4,351.8 4,456.6 -2.4% - Bank channel - Other(2) 1,228.6 1,219.5 0.7%
Life assurance - Protection 106.6 278.6 -61.7% - Agents channel and others 52.7 238.7 -77.9% - Bank channel - CAJA MADRID 43.5 29.7 46.5% - Bank channel - Other(2) 10.4 10.2 2.0%
Mathematical reserves 15,562.3 15,521.9 0.3%Other reserves 393.7 403.7 -2.5% - Agents channel and others 217.9 218.8 -0.4% - Bank channel - CAJA MADRID 117.8 136.9 -14.0% - Bank channel - Other(2) 58.0 47.9 21.1%
TOTAL TECHNICAL RESERVES 15,956.0 15,925.7 0.2%
Mutual funds and managed portfolios 2,686.0 2,655.0 1.2%
Pension funds 3,781.4 3,414.7 10.7% > MAPFRE INVERSIÓN 1,635.0 1,474.0 10.9% - Individual system 1,424.0 1,300.0 9.5% - Employers' system 211.0 174.0 21.3% > Other(2) 2,146.4 1,940.7 10.6%
TOTAL MANAGED SAVINGS 22,423.4 21,995.3 1.9%
45Nº 2009 - 25
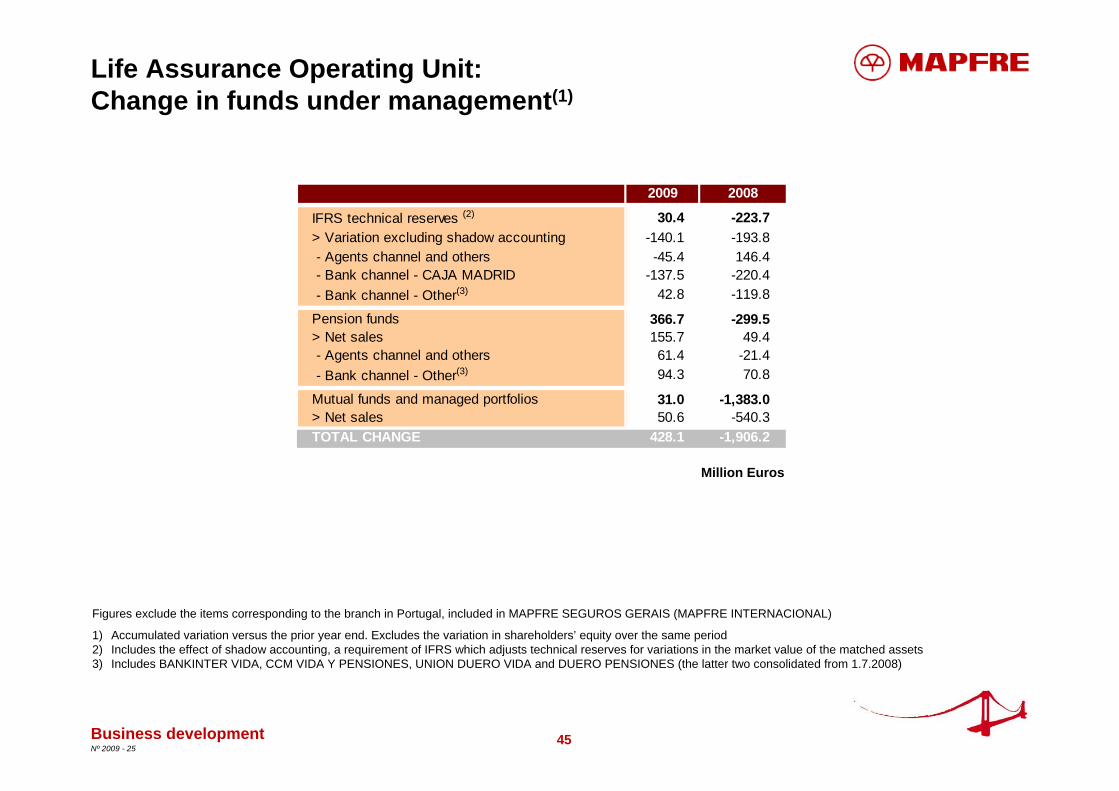
Life Assurance Operating Unit:Change in funds under management(1)
1) Accumulated variation versus the prior year end. Excludes the variation in shareholders’ equity over the same period2) Includes the effect of shadow accounting, a requirement of IFRS which adjusts technical reserves for variations in the market value of the matched assets3) Includes BANKINTER VIDA, CCM VIDA Y PENSIONES, UNION DUERO VIDA and DUERO PENSIONES (the latter two consolidated from 1.7.2008)
Business development
Million Euros
Figures exclude the items corresponding to the branch in Portugal, included in MAPFRE SEGUROS GERAIS (MAPFRE INTERNACIONAL)
2009 2008
IFRS technical reserves (2) 30.4 -223.7> Variation excluding shadow accounting -140.1 -193.8 - Agents channel and others -45.4 146.4 - Bank channel - CAJA MADRID -137.5 -220.4 - Bank channel - Other(3) 42.8 -119.8
Pension funds 366.7 -299.5> Net sales 155.7 49.4 - Agents channel and others 61.4 -21.4 - Bank channel - Other(3) 94.3 70.8
Mutual funds and managed portfolios 31.0 -1,383.0> Net sales 50.6 -540.3TOTAL CHANGE 428.1 -1,906.2
46Nº 2009 - 25
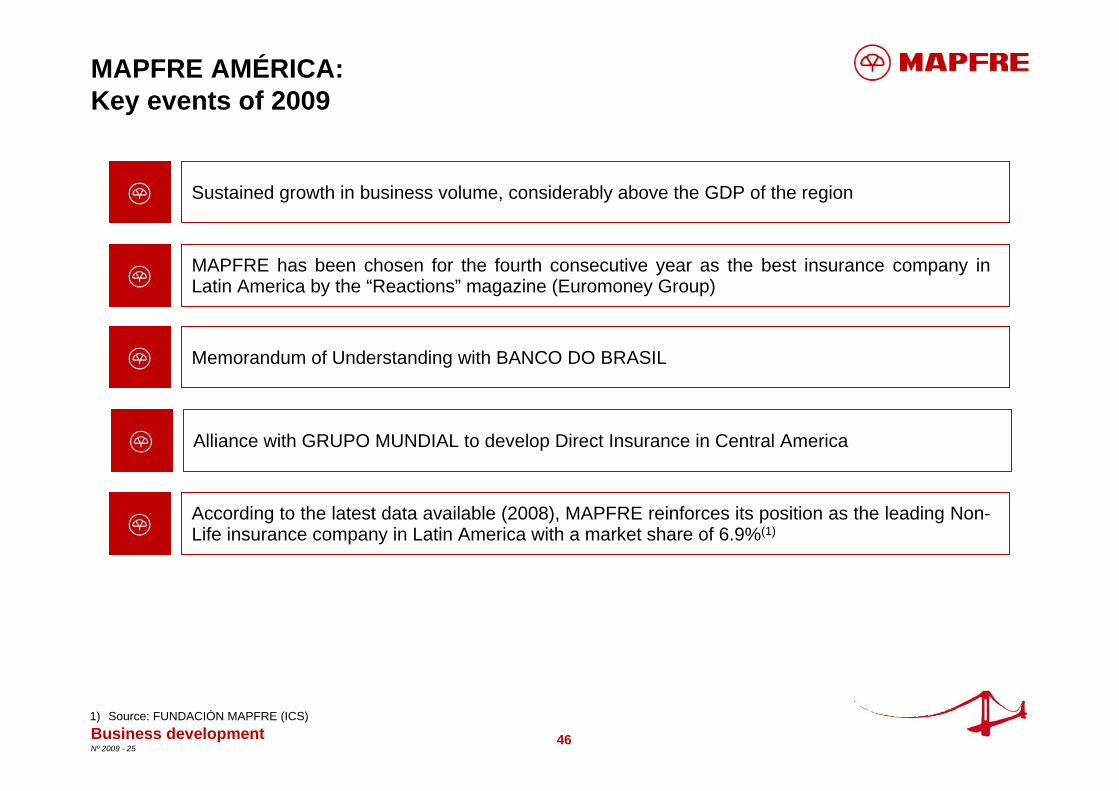
Sustained growth in business volume, considerably above the GDP of the region
MAPFRE has been chosen for the fourth consecutive year as the best insurance company in Latin America by the “Reactions” magazine (Euromoney Group)
Memorandum of Understanding with BANCO DO BRASIL
MAPFRE AMÉRICA:Key events of 2009
1) Source: FUNDACIÓN MAPFRE (ICS)
Alliance with GRUPO MUNDIAL to develop Direct Insurance in Central America
Business development
According to the latest data available (2008), MAPFRE reinforces its position as the leading Non-Life insurance company in Latin America with a market share of 6.9%(1)

47Nº 2009 - 25
67.6% 70.7%
36.1% 33.2%
2008 2009
Loss ratio Expense ratio
10.2%9.2%
2008 2009
2,835.9 3,395.7
772.0 909.7
2008 2009
201.6182.6
2008 2009
180.1212.5
2008 2009
113.4113.5
2008 2009
MAPFRE AMÉRICA – key figures
Business development
Million Euros
Profitability indicatorsBusiness activity indicators
Non-life CombinedRatio
Gross written and accepted premiums
Net result
ROE
Underwriting and financial result
Gross result
+19.3%
LifeNon-Life
3,607.94,305.4 103.7% 103.9%
+3.1p.p.
-2.9p.p.
+10.4%
+18.0%
-0.1%
+0.2p.p.
-1.0p.p.
48Nº 2009 - 25
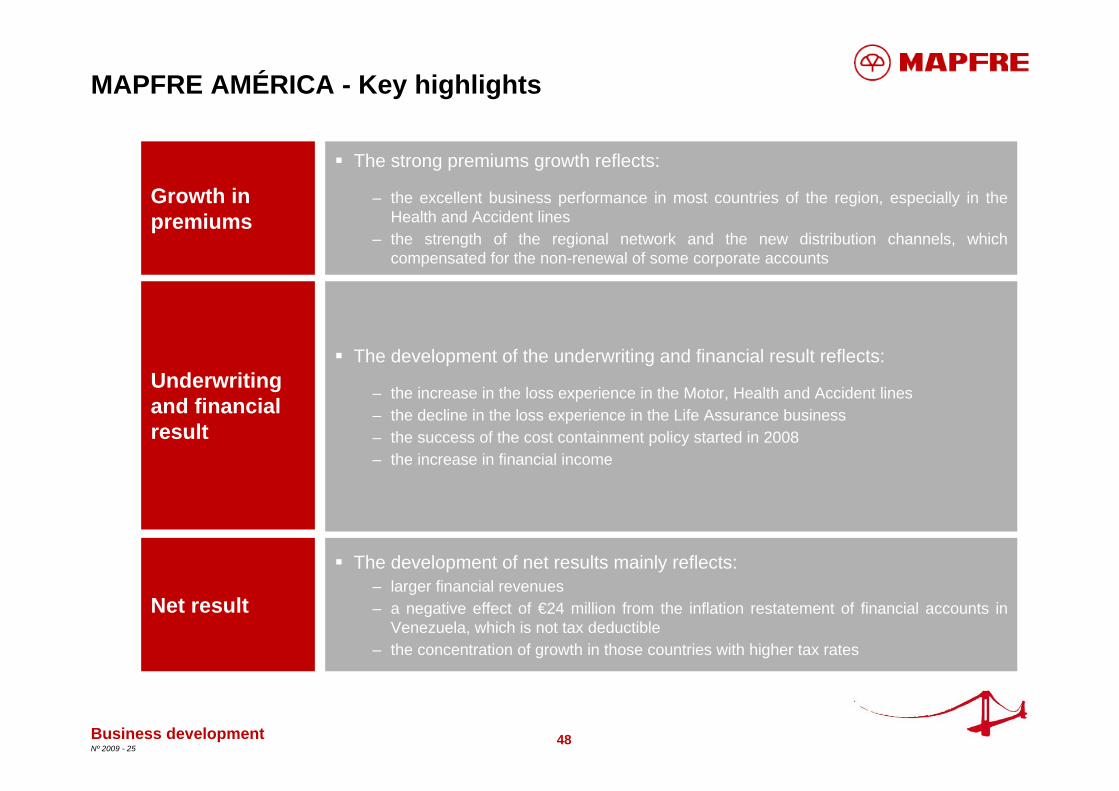
Growth in premiums
The strong premiums growth reflects:
– the excellent business performance in most countries of the region, especially in the Health and Accident lines
– the strength of the regional network and the new distribution channels, which compensated for the non-renewal of some corporate accounts
Underwriting and financial result
The development of the underwriting and financial result reflects:
– the increase in the loss experience in the Motor, Health and Accident lines – the decline in the loss experience in the Life Assurance business– the success of the cost containment policy started in 2008– the increase in financial income
Net result
The development of net results mainly reflects:– larger financial revenues – a negative effect of €24 million from the inflation restatement of financial accounts in
Venezuela, which is not tax deductible– the concentration of growth in those countries with higher tax rates
MAPFRE AMÉRICA - Key highlights
Business development
49Nº 2009 - 25
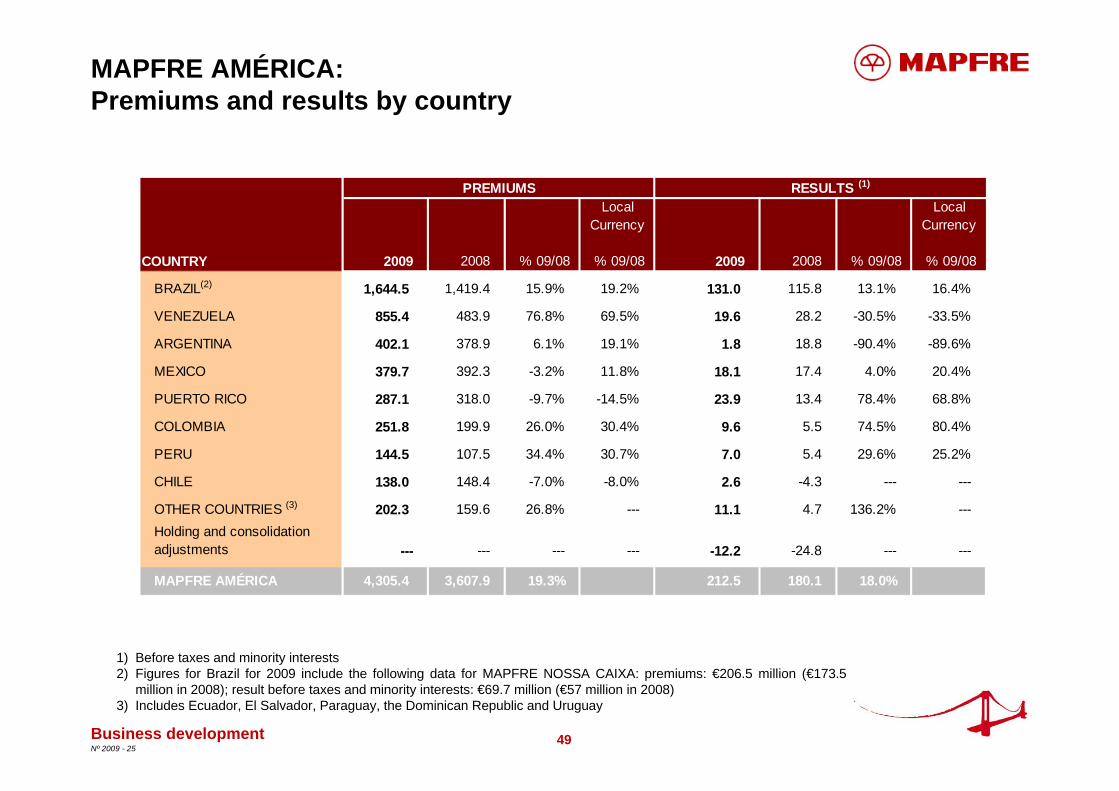
MAPFRE AMÉRICA:Premiums and results by country
1) Before taxes and minority interests2) Figures for Brazil for 2009 include the following data for MAPFRE NOSSA CAIXA: premiums: €206.5 million (€173.5
million in 2008); result before taxes and minority interests: €69.7 million (€57 million in 2008)3) Includes Ecuador, El Salvador, Paraguay, the Dominican Republic and Uruguay
Business development
Million Euros
Local Currency
Local Currency
COUNTRY 2009 2008 % 09/08 % 09/08 2009 2008 % 09/08 % 09/08
BRAZIL(2) 1,644.5 1,419.4 15.9% 19.2% 131.0 115.8 13.1% 16.4%
VENEZUELA 855.4 483.9 76.8% 69.5% 19.6 28.2 -30.5% -33.5%
ARGENTINA 402.1 378.9 6.1% 19.1% 1.8 18.8 -90.4% -89.6%
MEXICO 379.7 392.3 -3.2% 11.8% 18.1 17.4 4.0% 20.4%
PUERTO RICO 287.1 318.0 -9.7% -14.5% 23.9 13.4 78.4% 68.8%
COLOMBIA 251.8 199.9 26.0% 30.4% 9.6 5.5 74.5% 80.4%
PERU 144.5 107.5 34.4% 30.7% 7.0 5.4 29.6% 25.2%
CHILE 138.0 148.4 -7.0% -8.0% 2.6 -4.3 --- ---
OTHER COUNTRIES (3) 202.3 159.6 26.8% --- 11.1 4.7 136.2% ---Holding and consolidationadjustments --- --- --- --- -12.2 -24.8 --- ---
MAPFRE AMÉRICA 4,305.4 3,607.9 19.3% 212.5 180.1 18.0%
RESULTS (1)PREMIUMS
50Nº 2009 - 25
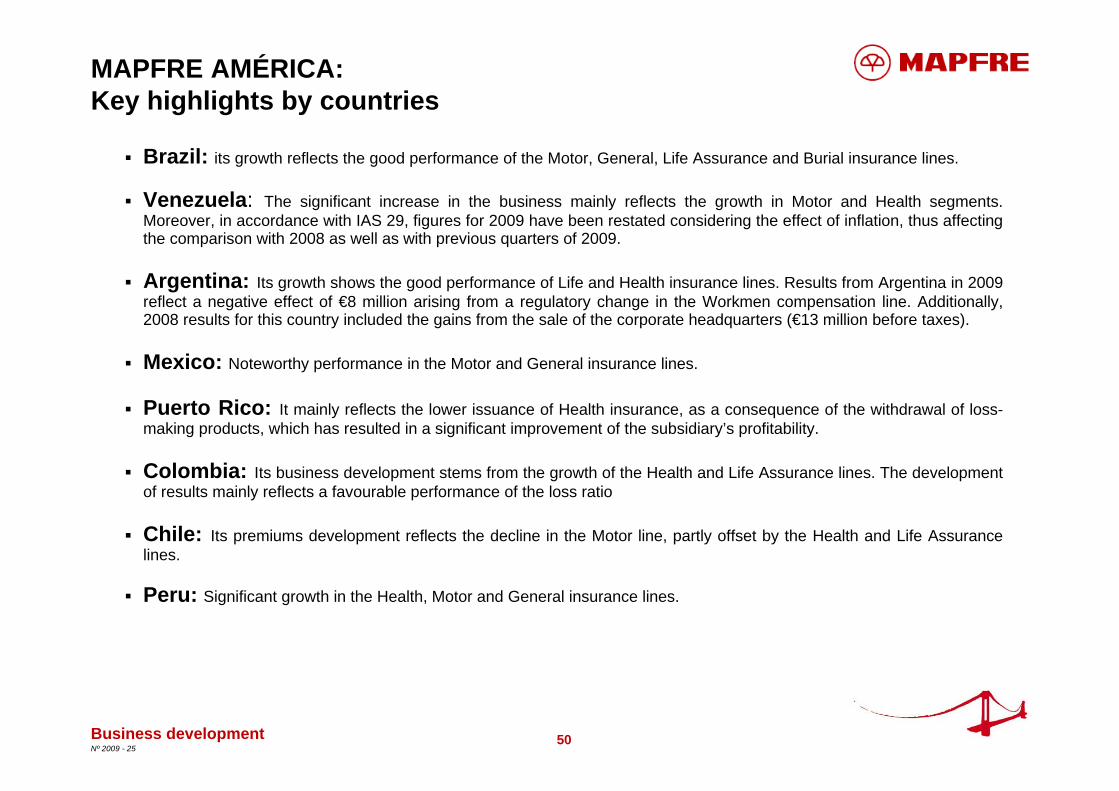
MAPFRE AMÉRICA:Key highlights by countries
Brazil: its growth reflects the good performance of the Motor, General, Life Assurance and Burial insurance lines.
Venezuela: The significant increase in the business mainly reflects the growth in Motor and Health segments. Moreover, in accordance with IAS 29, figures for 2009 have been restated considering the effect of inflation, thus affecting the comparison with 2008 as well as with previous quarters of 2009.
Argentina: Its growth shows the good performance of Life and Health insurance lines. Results from Argentina in 2009 reflect a negative effect of €8 million arising from a regulatory change in the Workmen compensation line. Additionally, 2008 results for this country included the gains from the sale of the corporate headquarters (€13 million before taxes).
Mexico: Noteworthy performance in the Motor and General insurance lines.
Puerto Rico: It mainly reflects the lower issuance of Health insurance, as a consequence of the withdrawal of loss-making products, which has resulted in a significant improvement of the subsidiary’s profitability.
Colombia: Its business development stems from the growth of the Health and Life Assurance lines. The development of results mainly reflects a favourable performance of the loss ratio
Chile: Its premiums development reflects the decline in the Motor line, partly offset by the Health and Life Assurance lines.
Peru: Significant growth in the Health, Motor and General insurance lines.
Business development

51Nº 2009 - 25
Million Euros
Breakdown of the main impacts of the inflation restatement in Venezuela
Business development
Impact of the inflation restatement on MAPFRE AMERICA's accounts 2009
Gross written and accepted premiums 84.2
Underwriting and financial result 2.5
Net result -24.0
Shareholders' equity (1) 60.6
Impact on the ROE -2.2p.p.
1) Net of translation adjustments
52Nº 2009 - 25
THE COMMERCE GROUP:
GENEL SIGORTA:
INTERNATIONAL OPERATING UNIT:Key events of 2009
Bancassurance agreement with FINIBANCO in Portugal
– the redesign of the company’s functional structure was finalised– the IT integration plan continues according to plan– further progress in the strategy to unify brand and products
– introduction of the MAPFRE GENEL SIGORTA brand– IT integration completed– implementation of the regional expansion plan– the management team was enlarged with professionals from the Group as well as with external
hires– an additional 10% stake in the company was acquired in November, raising the total
shareholding to 90%
Business development
53Nº 2009 - 25
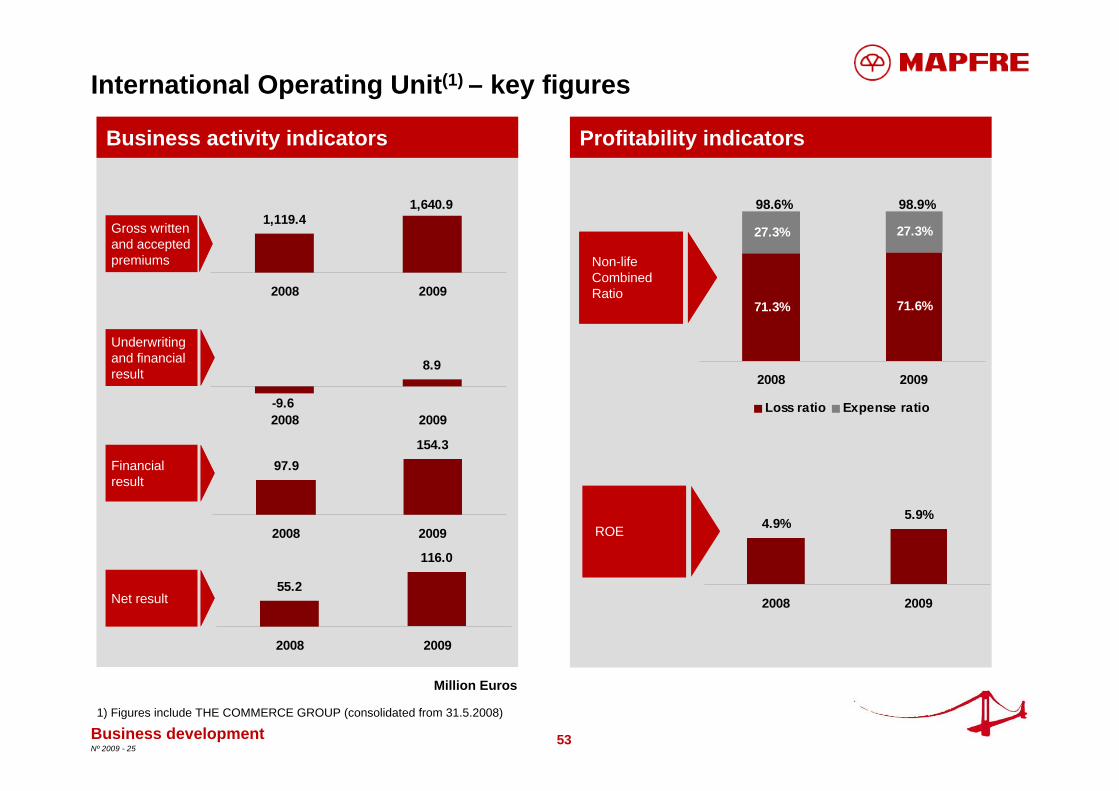
71.3% 71.6%
27.3% 27.3%
2008 2009
Loss ratio Expense ratio
5.9%4.9%
2008 2009
International Operating Unit(1) – key figures
Business development
Profitability indicatorsBusiness activity indicators
Gross written and accepted premiums
Net result
Underwriting and financial result
Financial result
Ratio combinado No Vida
Non-life CombinedRatio
ROE
Million Euros
1) Figures include THE COMMERCE GROUP (consolidated from 31.5.2008)
98.6% 98.9%1,119.4
1,640.9
2008 2009
8.9
-9.62008 2009
97.9154.3
2008 2009
55.2
116.0
2008 2009
54Nº 2009 - 25
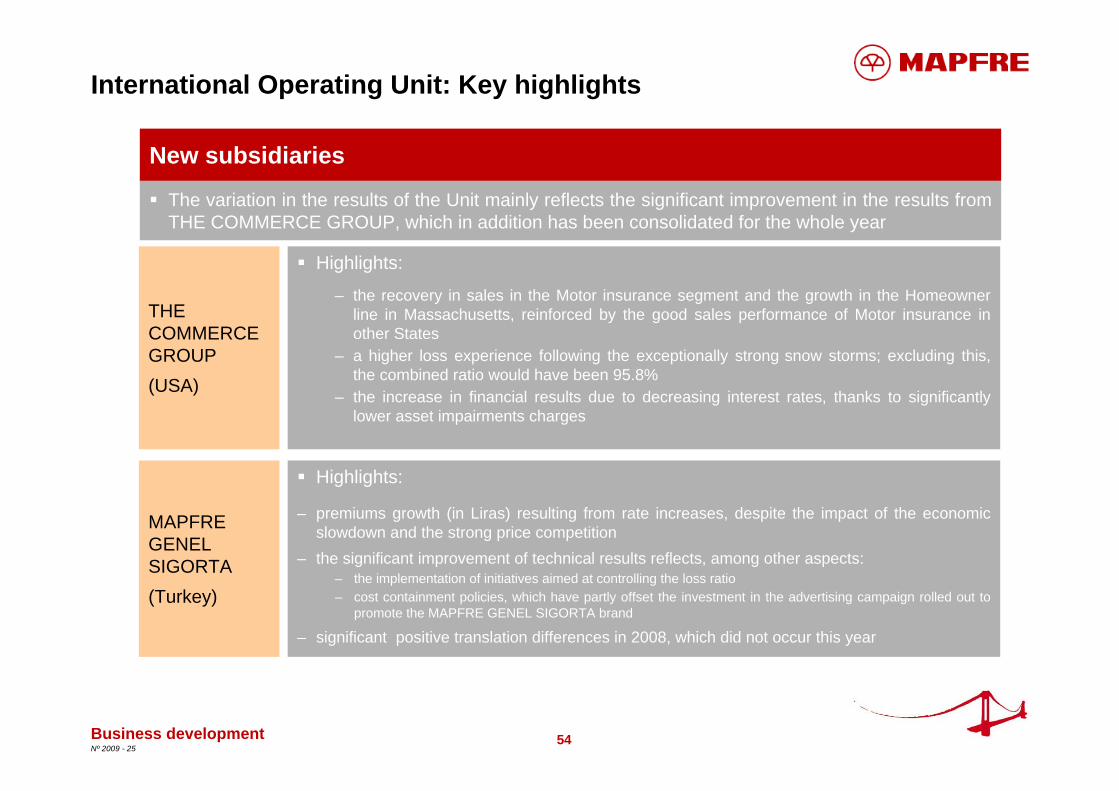
International Operating Unit: Key highlights
Business development
New subsidiaries
The variation in the results of the Unit mainly reflects the significant improvement in the results from THE COMMERCE GROUP, which in addition has been consolidated for the whole year
Highlights:
– the recovery in sales in the Motor insurance segment and the growth in the Homeowner line in Massachusetts, reinforced by the good sales performance of Motor insurance in other States
– a higher loss experience following the exceptionally strong snow storms; excluding this, the combined ratio would have been 95.8%
– the increase in financial results due to decreasing interest rates, thanks to significantly lower asset impairments charges
Highlights:
– premiums growth (in Liras) resulting from rate increases, despite the impact of the economic slowdown and the strong price competition
– the significant improvement of technical results reflects, among other aspects:– the implementation of initiatives aimed at controlling the loss ratio – cost containment policies, which have partly offset the investment in the advertising campaign rolled out to
promote the MAPFRE GENEL SIGORTA brand
– significant positive translation differences in 2008, which did not occur this year
THE COMMERCEGROUP (USA)
MAPFRE GENEL SIGORTA(Turkey)
55Nº 2009 - 25
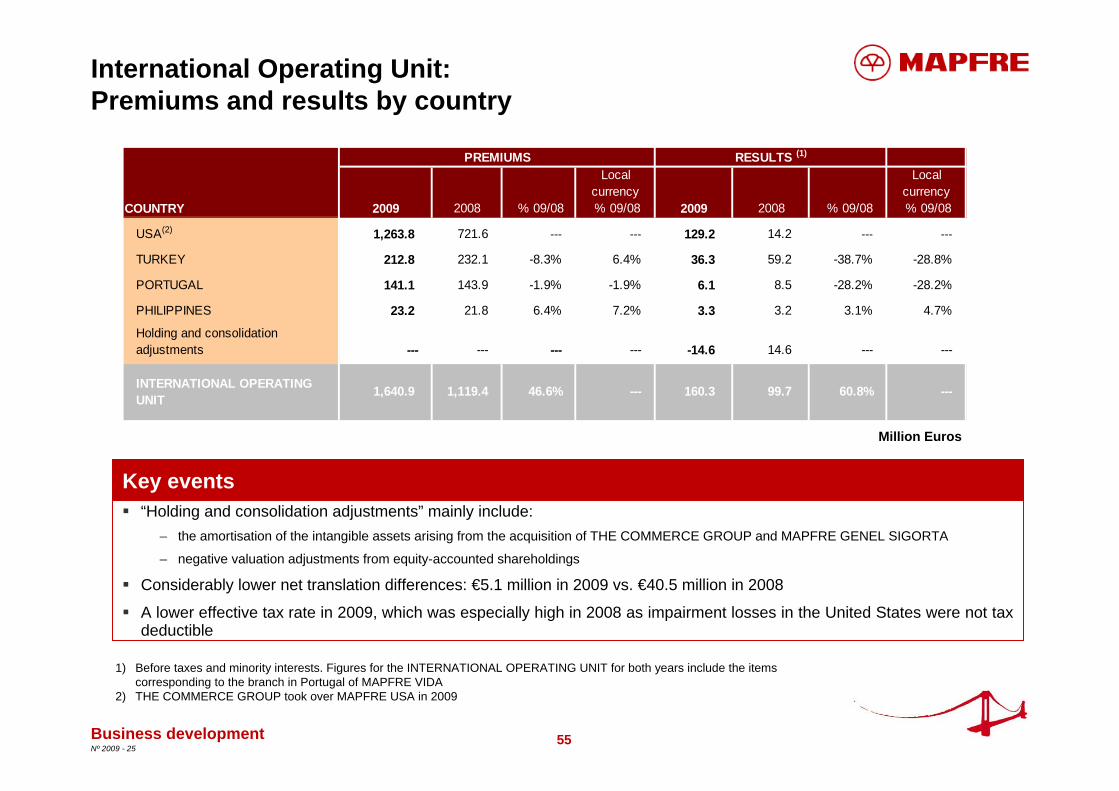
International Operating Unit:Premiums and results by country
1) Before taxes and minority interests. Figures for the INTERNATIONAL OPERATING UNIT for both years include the items corresponding to the branch in Portugal of MAPFRE VIDA
2) THE COMMERCE GROUP took over MAPFRE USA in 2009
Business development
Million Euros
Key events“Holding and consolidation adjustments” mainly include:
– the amortisation of the intangible assets arising from the acquisition of THE COMMERCE GROUP and MAPFRE GENEL SIGORTA
– negative valuation adjustments from equity-accounted shareholdings
Considerably lower net translation differences: €5.1 million in 2009 vs. €40.5 million in 2008
A lower effective tax rate in 2009, which was especially high in 2008 as impairment losses in the United States were not tax deductible
Local currency
Local currency
COUNTRY 2009 2008 % 09/08 % 09/08 2009 2008 % 09/08 % 09/08
USA(2) 1,263.8 721.6 --- --- 129.2 14.2 --- ---
TURKEY 212.8 232.1 -8.3% 6.4% 36.3 59.2 -38.7% -28.8%
PORTUGAL 141.1 143.9 -1.9% -1.9% 6.1 8.5 -28.2% -28.2%
PHILIPPINES 23.2 21.8 6.4% 7.2% 3.3 3.2 3.1% 4.7%
Holding and consolidation adjustments --- --- --- --- -14.6 14.6 --- ---
INTERNATIONAL OPERATING UNIT
1,640.9 1,119.4 46.6% --- 160.3 99.7 60.8% ---
RESULTS (1)PREMIUMS
56Nº 2009 - 25
MAPFRE RE: Key events of 2009
The difficult economic environment of the year has allowed MAPFRE RE to leverage the value of its business model, which is based on:
– economic solvency and strength– a long-term and close relation with customers
– a growing market demand – a professional and stable underwriting policy, which has resulted in larger technical results
The business development of MAPFRE RE has been characterised by:
Business development
57Nº 2009 - 25
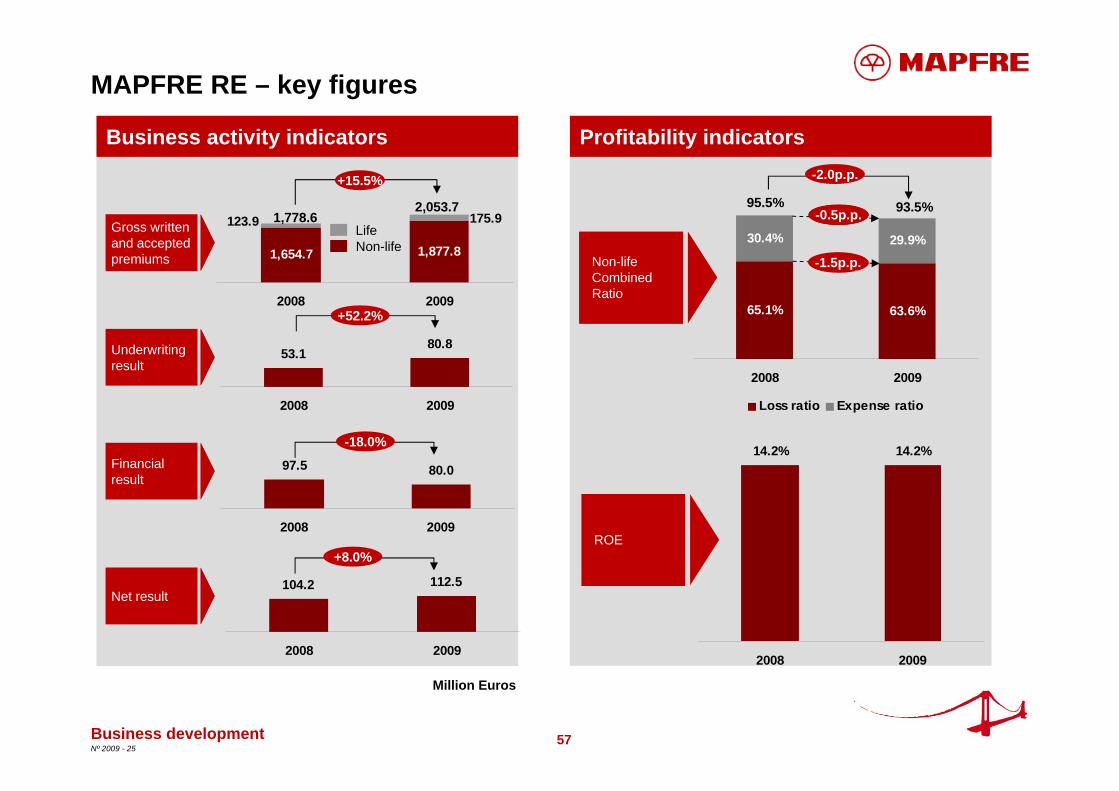
1,654.7 1,877.8
175.9123.9
2008 2009
97.5 80.0
2008 2009
53.180.8
2008 2009
104.2 112.5
2008 2009
MAPFRE RE – key figures
Business development
Million Euros
Profitability indicatorsBusiness activity indicators
Underwriting result
Gross written and accepted premiums
Financial result
Net result
ROE
1,778.62,053.7
+15.5%
LifeNon-life
+5.1p.p
-1.2pp-1.2pp
-2.0p.p.
93.5%95.5%
Ratio combinado No Vida
Non-life CombinedRatio
+52.2%
-18.0%
+8.0%
14.2% 14.2%
2008 2009
65.1% 63.6%
30.4% 29.9%
2008 2009
Loss ratio Expense ratio
-0.5p.p.
-1.5p.p.
58Nº 2009 - 25
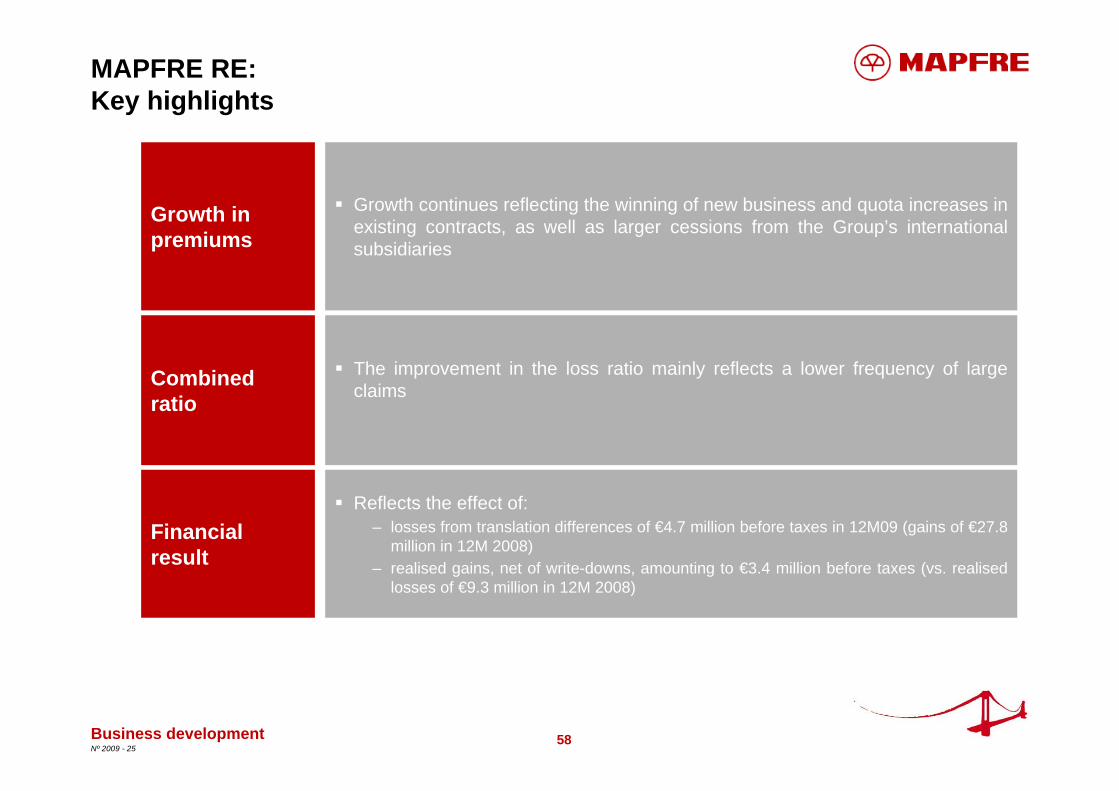
Growth continues reflecting the winning of new business and quota increases in existing contracts, as well as larger cessions from the Group’s international subsidiaries
MAPFRE RE:Key highlights
Business development
Growth in premiums
Financial result
Reflects the effect of:– losses from translation differences of €4.7 million before taxes in 12M09 (gains of €27.8
million in 12M 2008)– realised gains, net of write-downs, amounting to €3.4 million before taxes (vs. realised
losses of €9.3 million in 12M 2008)
Combined ratio
The improvement in the loss ratio mainly reflects a lower frequency of large claims
59Nº 2009 - 25
MAPFRE RE:Renewal campaign of January 2010
The renewal campaign was characterised by an increase in both capacity on offer and competition, which resulted in a moderate fall in prices
The volume of the business accepted in January is expected to grow by 5%, thanks mainly to the winning of new business in the European market. Moreover, contracts with insufficient rates have been cancelled selectively.
Business development
60Nº 2009 - 25
Key highlights
Consolidated financial information
Business development
Appendix
Financial supplement
Contacts
61Nº 2009 - 25
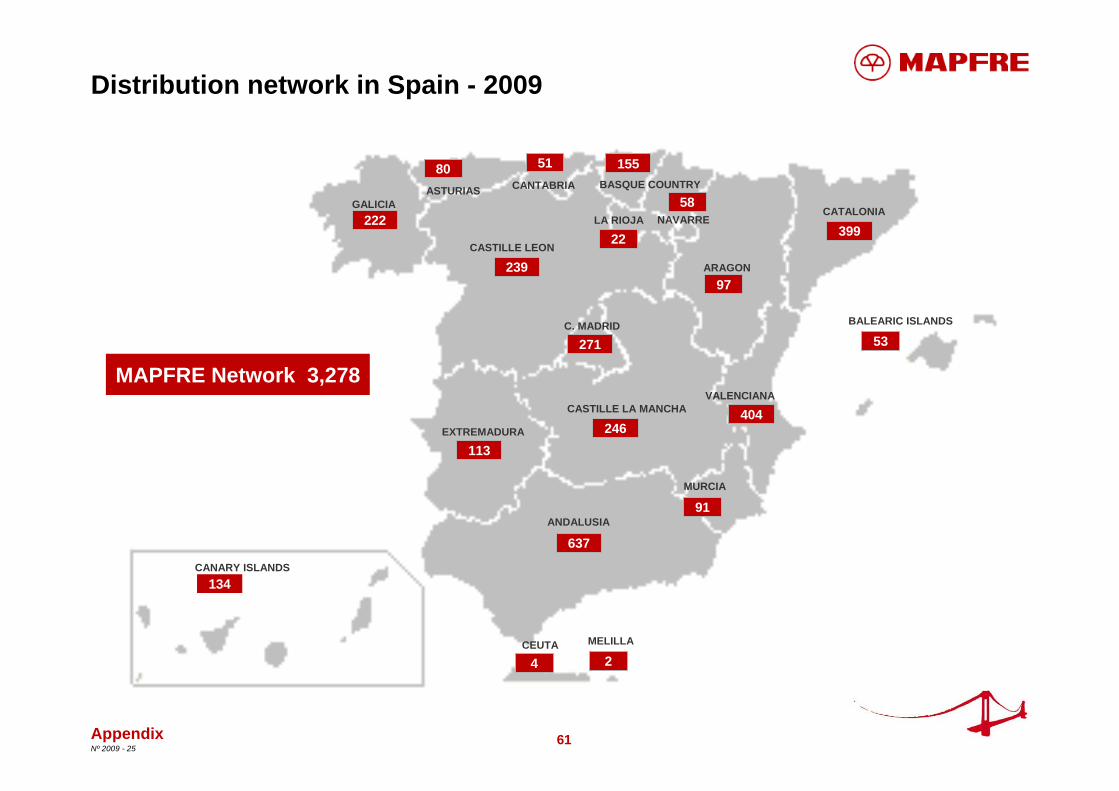
Distribution network in Spain - 2009
GALICIAASTURIAS
CASTILLE LEON
C. MADRID
EXTREMADURA
CASTILLE LA MANCHA
ANDALUSIA
MURCIA
VALENCIANA
ARAGON
NAVARRELA RIOJA
BASQUE COUNTRYCANTABRIA
CATALONIA
BALEARIC ISLANDS
CANARY ISLANDS
MELILLACEUTA
222
80 51 155
58
399
53
134
97
22
404
91
271
246
2
637
113
239
4
MAPFRE Network 3,278
Appendix

62Nº 2009 - 25
Organisation chart
MAPFRE AMÉRICA
MAPFRE ASISTENCIA
INTERNATIONAL DIRECT INSURANCE
DIVISION
MAPFRE INTER-
NACIONAL
87.5%
91.5%100%
MAPFRE S.A.
MAPFRE FAMILIAR
100%
MAPFRE RE
100%100%
88.9%MAPFREVIDA
COMMERCIAL INSUR. OPER.
UNIT(1)
OTHER BUSINESSES
INSURANCE IN SPAIN INSURANCE ABROAD
Appendix
1) During 2010 the COMMERCIAL INSURANCE OPERATING UNIT (now MAPFRE GLOBAL RISKS S.A.) will be split into two companies: MAPFRE GLOBAL RISKS, which will be included in the International Direct Insurance Division, and MAPFRE SEGUROS DE EMPRESAS (which will maintain the brand “MAPFRE EMPRESAS”).
63Nº 2009 - 25
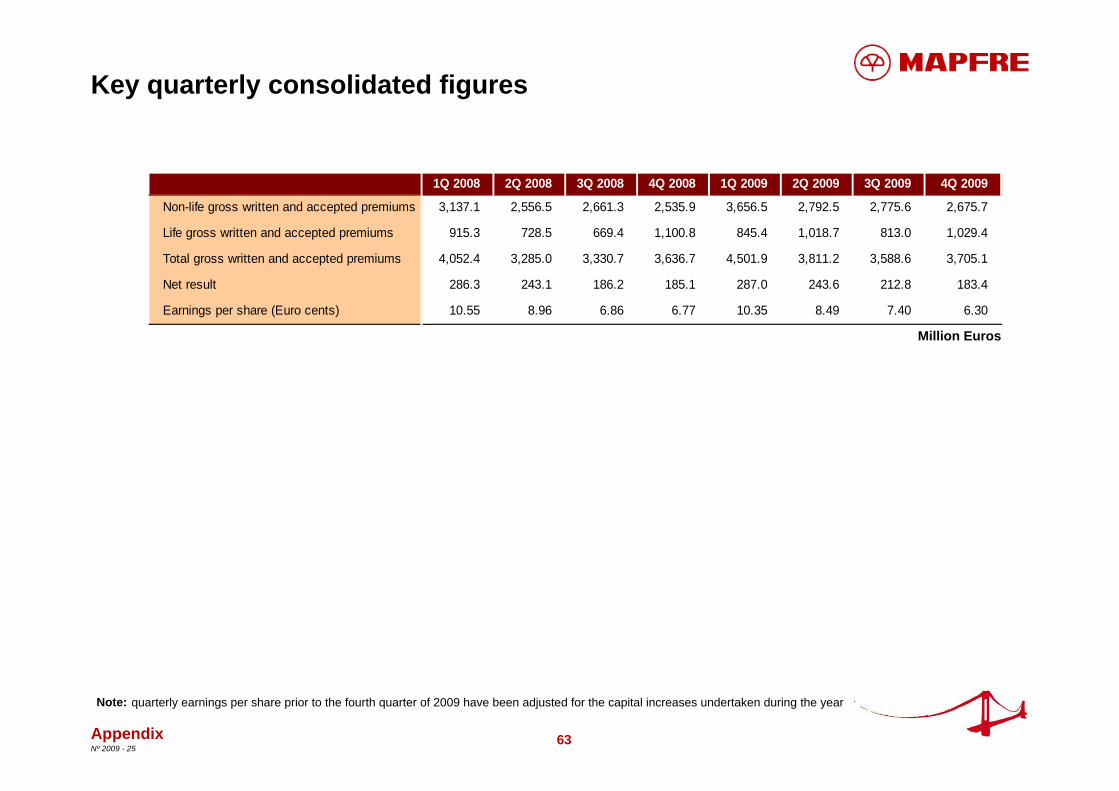
Key quarterly consolidated figures
Million Euros
Appendix
quarterly earnings per share prior to the fourth quarter of 2009 have been adjusted for the capital increases undertaken during the yearNote:
1Q 2008 2Q 2008 3Q 2008 4Q 2008 1Q 2009 2Q 2009 3Q 2009 4Q 2009
Non-life gross written and accepted premiums 3,137.1 2,556.5 2,661.3 2,535.9 3,656.5 2,792.5 2,775.6 2,675.7
Life gross written and accepted premiums 915.3 728.5 669.4 1,100.8 845.4 1,018.7 813.0 1,029.4
Total gross written and accepted premiums 4,052.4 3,285.0 3,330.7 3,636.7 4,501.9 3,811.2 3,588.6 3,705.1
Net result 286.3 243.1 186.2 185.1 287.0 243.6 212.8 183.4
Earnings per share (Euro cents) 10.55 8.96 6.86 6.77 10.35 8.49 7.40 6.30
64Nº 2009 - 25
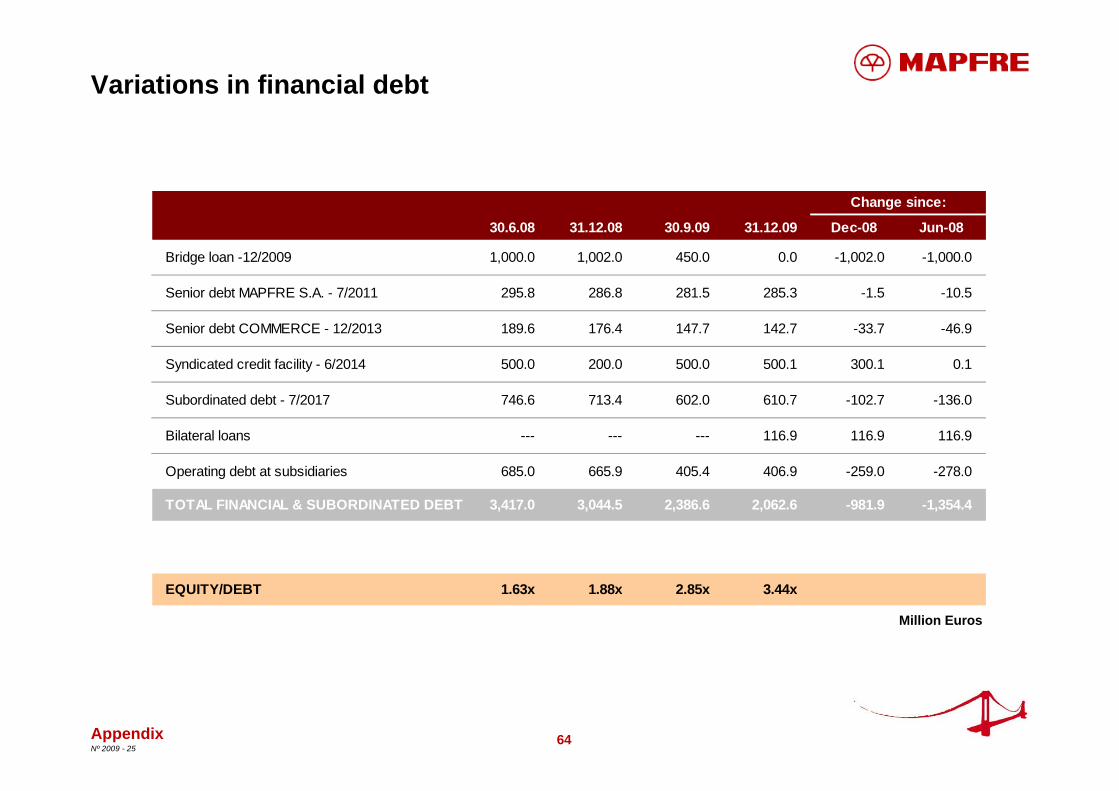
Variations in financial debt
Appendix
Million Euros
30.6.08 31.12.08 30.9.09 31.12.09 Dec-08 Jun-08
Bridge loan -12/2009 1,000.0 1,002.0 450.0 0.0 -1,002.0 -1,000.0
Senior debt MAPFRE S.A. - 7/2011 295.8 286.8 281.5 285.3 -1.5 -10.5
Senior debt COMMERCE - 12/2013 189.6 176.4 147.7 142.7 -33.7 -46.9
Syndicated credit facility - 6/2014 500.0 200.0 500.0 500.1 300.1 0.1
Subordinated debt - 7/2017 746.6 713.4 602.0 610.7 -102.7 -136.0
Bilateral loans --- --- --- 116.9 116.9 116.9
Operating debt at subsidiaries 685.0 665.9 405.4 406.9 -259.0 -278.0
TOTAL FINANCIAL & SUBORDINATED DEBT 3,417.0 3,044.5 2,386.6 2,062.6 -981.9 -1,354.4
EQUITY/DEBT 1.63x 1.88x 2.85x 3.44x
Change since:
65Nº 2009 - 25
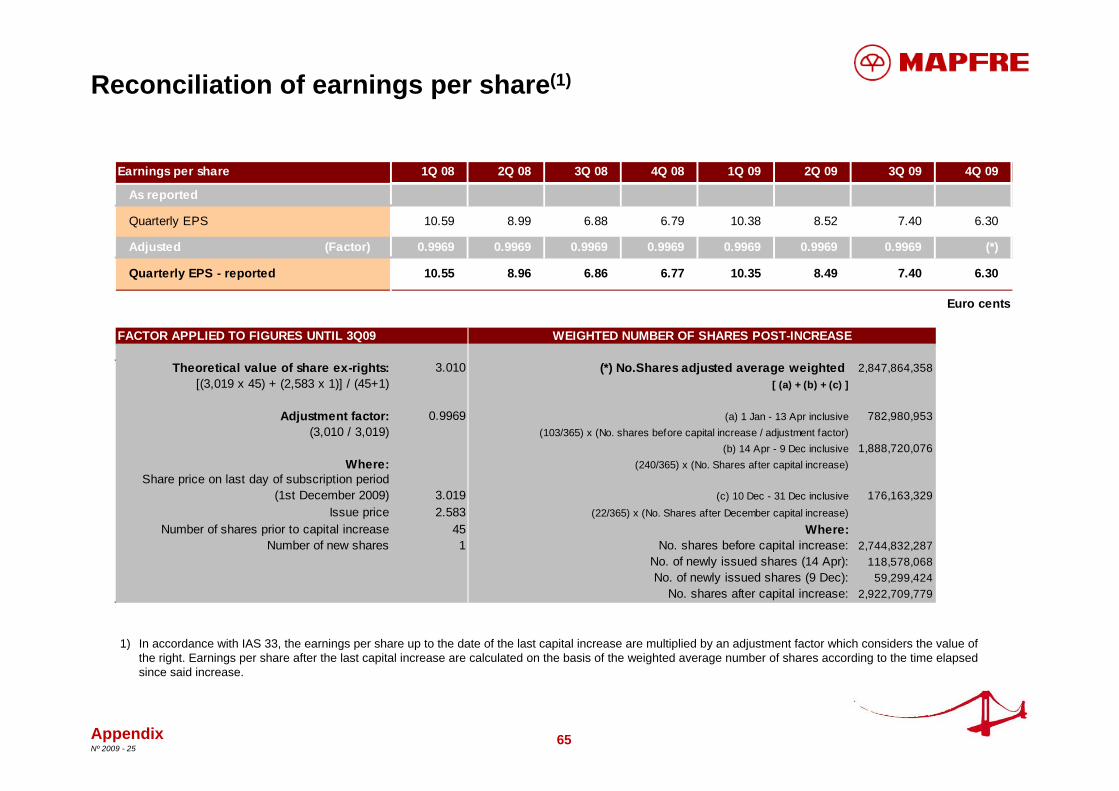
Reconciliation of earnings per share(1)
Appendix
1) In accordance with IAS 33, the earnings per share up to the date of the last capital increase are multiplied by an adjustment factor which considers the value of the right. Earnings per share after the last capital increase are calculated on the basis of the weighted average number of shares according to the time elapsed since said increase.
Earnings per share 1Q 08 2Q 08 3Q 08 4Q 08 1Q 09 2Q 09 3Q 09 4Q 09
As reported
Quarterly EPS 10.59 8.99 6.88 6.79 10.38 8.52 7.40 6.30
Adjusted (Factor) 0.9969 0.9969 0.9969 0.9969 0.9969 0.9969 0.9969 (*)
Quarterly EPS - reported 10.55 8.96 6.86 6.77 10.35 8.49 7.40 6.30
Euro cents
3.010 (*) No.Shares adjusted average weighted 2,847,864,358[ (a) + (b) + (c) ]
0.9969 (a) 1 Jan - 13 Apr inclusive 782,980,953(103/365) x (No. shares before capital increase / adjustment factor)
(b) 14 Apr - 9 Dec inclusive 1,888,720,076Where: (240/365) x (No. Shares after capital increase)
3.019 (c) 10 Dec - 31 Dec inclusive 176,163,3292.583 (22/365) x (No. Shares after December capital increase)
45 Where:1 No. shares before capital increase: 2,744,832,287
No. of newly issued shares (14 Apr): 118,578,068No. of newly issued shares (9 Dec): 59,299,424
No. shares after capital increase: 2,922,709,779
Number of new shares
FACTOR APPLIED TO FIGURES UNTIL 3Q09
(3,010 / 3,019)
Share price on last day of subscription period (1st December 2009)
Issue priceNumber of shares prior to capital increase
WEIGHTED NUMBER OF SHARES POST-INCREASE
Theoretical value of share ex-rights:[(3,019 x 45) + (2,583 x 1)] / (45+1)
Adjustment factor:
66Nº 2009 - 25
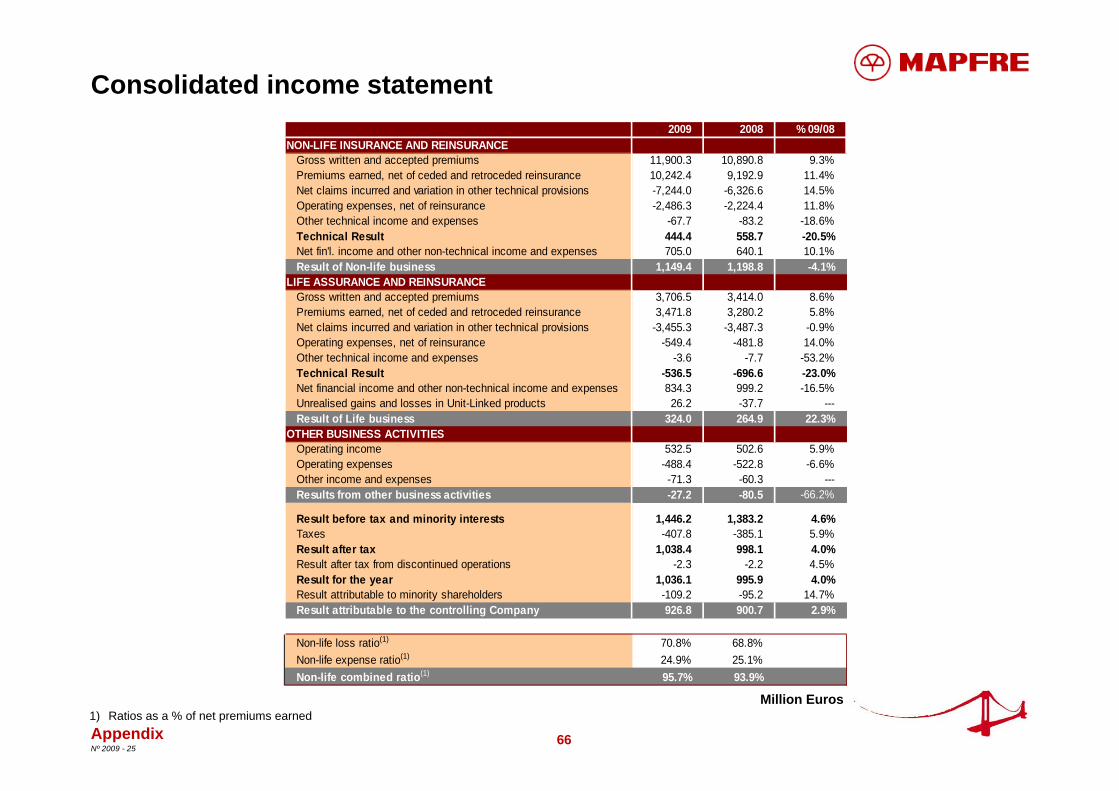
Consolidated income statement
1) Ratios as a % of net premiums earnedMillion Euros
Appendix
2009 2008 % 09/08NON-LIFE INSURANCE AND REINSURANCE
Gross written and accepted premiums 11,900.3 10,890.8 9.3%Premiums earned, net of ceded and retroceded reinsurance 10,242.4 9,192.9 11.4%Net claims incurred and variation in other technical provisions -7,244.0 -6,326.6 14.5%Operating expenses, net of reinsurance -2,486.3 -2,224.4 11.8%Other technical income and expenses -67.7 -83.2 -18.6%Technical Result 444.4 558.7 -20.5%Net fin'l. income and other non-technical income and expenses 705.0 640.1 10.1%Result of Non-life business 1,149.4 1,198.8 -4.1%
LIFE ASSURANCE AND REINSURANCEGross written and accepted premiums 3,706.5 3,414.0 8.6%Premiums earned, net of ceded and retroceded reinsurance 3,471.8 3,280.2 5.8%Net claims incurred and variation in other technical provisions -3,455.3 -3,487.3 -0.9%Operating expenses, net of reinsurance -549.4 -481.8 14.0%Other technical income and expenses -3.6 -7.7 -53.2%Technical Result -536.5 -696.6 -23.0%Net financial income and other non-technical income and expenses 834.3 999.2 -16.5%Unrealised gains and losses in Unit-Linked products 26.2 -37.7 ---Result of Life business 324.0 264.9 22.3%
OTHER BUSINESS ACTIVITIESOperating income 532.5 502.6 5.9%Operating expenses -488.4 -522.8 -6.6%Other income and expenses -71.3 -60.3 ---Results from other business activities -27.2 -80.5 -66.2%
Result before tax and minority interests 1,446.2 1,383.2 4.6%Taxes -407.8 -385.1 5.9%Result after tax 1,038.4 998.1 4.0%Result after tax from discontinued operations -2.3 -2.2 4.5%Result for the year 1,036.1 995.9 4.0%Result attributable to minority shareholders -109.2 -95.2 14.7%Result attributable to the controlling Company 926.8 900.7 2.9%
Non-life loss ratio(1) 70.8% 68.8%Non-life expense ratio(1) 24.9% 25.1%Non-life combined ratio(1) 95.7% 93.9%

67Nº 2009 - 25
Profit breakdown by units and companies
Appendix
Million Euros1) Includes BANKINTER VIDA, CCM VIDA Y PENSIONES, UNION DUERO VIDA and DUERO PENSIONES2) Includes THE COMMERCE GROUP (USA), MAPFRE INSULAR (the Philippines), GENEL SIGORTA (Turkey) and the business in Portugal
Contribution Contribution to consolidated to consolidated
result resultNet Minority 2009 2008
Result interests € Million % € Million %
INSURANCE ACTIVITIES
LIFE ASSURANCE OPERATING UNIT(1) 125.2 125.2 13.5% 148.8 16.5%MAPFRE FAMILIAR 430.8 430.8 46.5% 503.9 55.9%MAPFRE EMPRESAS 76.7 76.7 8.3% 114.5 12.7%
MAPFRE INMUEBLES -13.3 -13.3 -1.4% -32.5 -2.9%MAPFRE QUAVITAE -3.2 1.4 -1.8 -0.2% -0.1 -0.1%BANCO DE S.F. CAJA MADRID - MAPFRE -49.0 -5.3% 0.3 0.4%
COMPANIES OPERATING MAINLY IN SPAIN 568.6 61.4% 734.9 79.9%
MAPFRE AMÉRICA 113.4 -12.6 100.8 10.9% 100.9 9.3%MAPFRE RE 112.5 -9.6 102.9 11.1% 95.3 9.9%MAPFRE ASISTENCIA 16.3 16.3 1.7% 10.8 1.3%INTERNATIONAL OPERATING UNIT(2) 116.0 -14.4 101.6 11.0% 48.4 1.6%
COMPANIES OPERATING MAINLY ABROAD 321.6 34.7% 255.4 22.0%
Other companies and consolidation adjustments 36.6 3.9% -89.6 -2.0%
MAPFRE S.A. 926.8 100.0% 900.7 100.0%
68Nº 2009 - 25
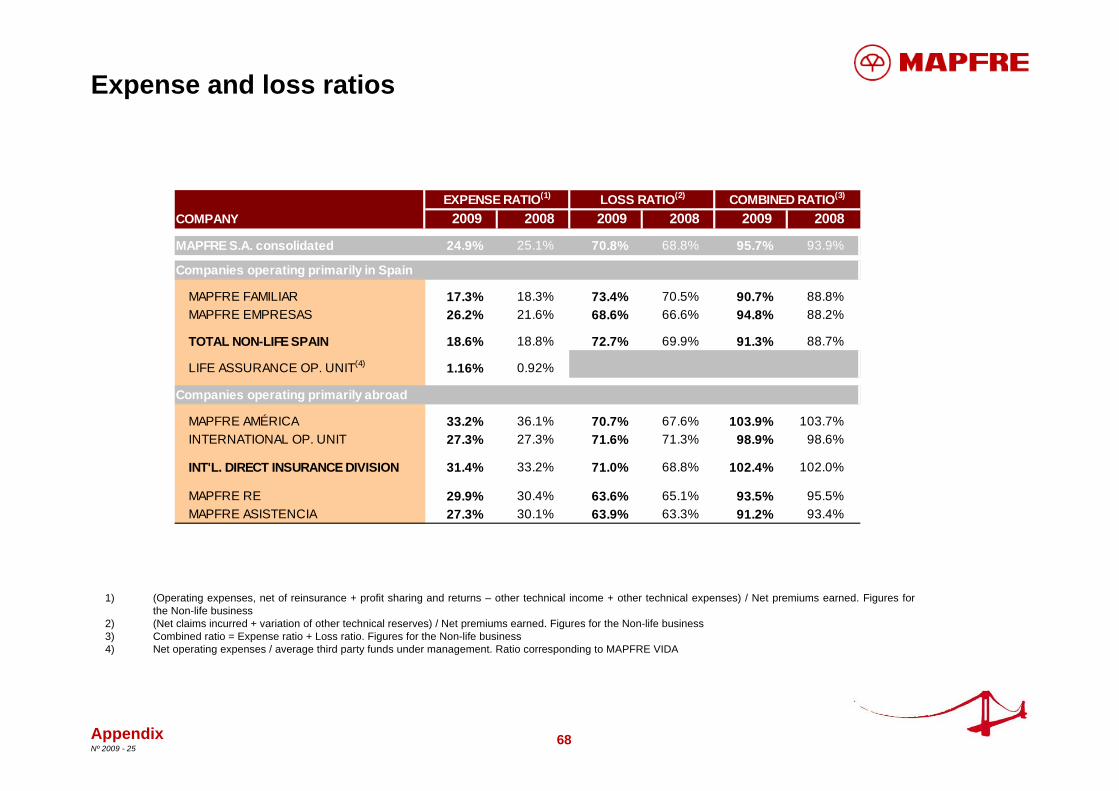
Expense and loss ratios
Appendix
1) (Operating expenses, net of reinsurance + profit sharing and returns – other technical income + other technical expenses) / Net premiums earned. Figures for the Non-life business
2) (Net claims incurred + variation of other technical reserves) / Net premiums earned. Figures for the Non-life business3) Combined ratio = Expense ratio + Loss ratio. Figures for the Non-life business4) Net operating expenses / average third party funds under management. Ratio corresponding to MAPFRE VIDA
COMPANY 2009 2008 2009 2008 2009 2008
MAPFRE S.A. consolidated 24.9% 25.1% 70.8% 68.8% 95.7% 93.9%
Companies operating primarily in Spain
MAPFRE FAMILIAR 17.3% 18.3% 73.4% 70.5% 90.7% 88.8%MAPFRE EMPRESAS 26.2% 21.6% 68.6% 66.6% 94.8% 88.2%
TOTAL NON-LIFE SPAIN 18.6% 18.8% 72.7% 69.9% 91.3% 88.7%
LIFE ASSURANCE OP. UNIT(4) 1.16% 0.92%
Companies operating primarily abroad
MAPFRE AMÉRICA 33.2% 36.1% 70.7% 67.6% 103.9% 103.7%INTERNATIONAL OP. UNIT 27.3% 27.3% 71.6% 71.3% 98.9% 98.6%
INT'L. DIRECT INSURANCE DIVISION 31.4% 33.2% 71.0% 68.8% 102.4% 102.0%
MAPFRE RE 29.9% 30.4% 63.6% 65.1% 93.5% 95.5%MAPFRE ASISTENCIA 27.3% 30.1% 63.9% 63.3% 91.2% 93.4%
LOSS RATIO(2) COMBINED RATIO(3)EXPENSE RATIO(1)
69Nº 2009 - 25
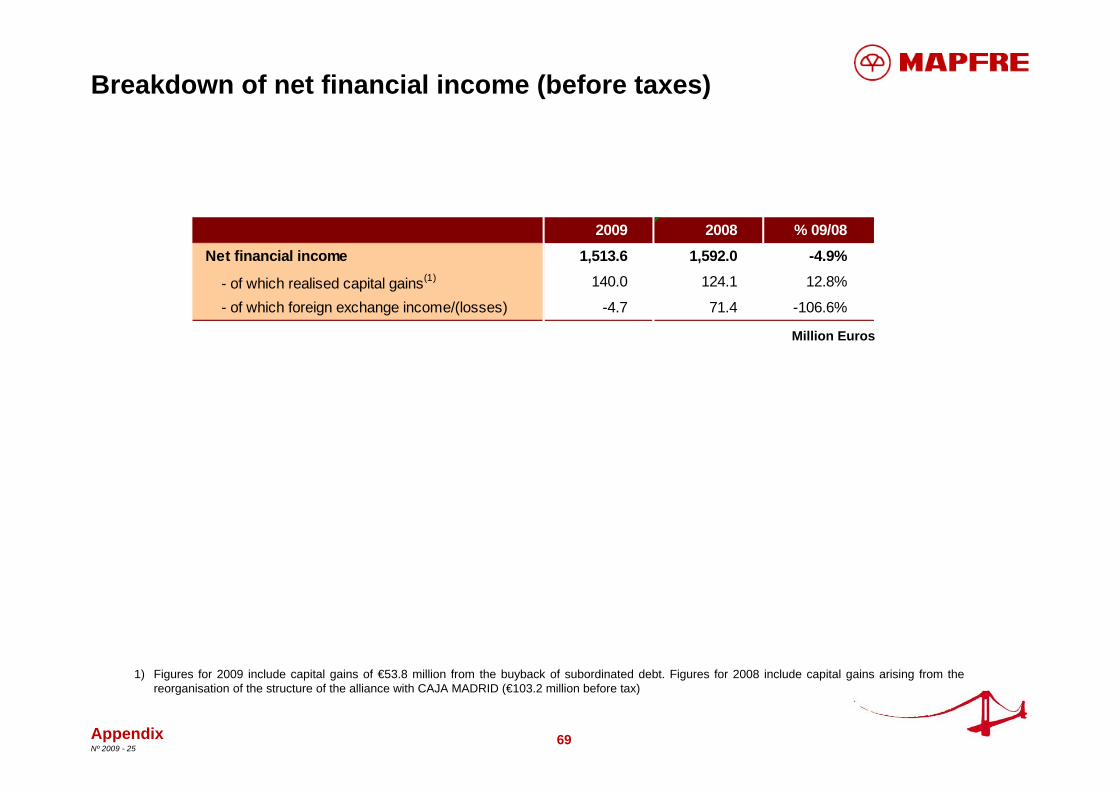
Breakdown of net financial income (before taxes)
Million Euros
Appendix
2009 2008 % 09/08
Net financial income 1,513.6 1,592.0 -4.9%
- of which realised capital gains(1) 140.0 124.1 12.8%
- of which foreign exchange income/(losses) -4.7 71.4 -106.6%
1) Figures for 2009 include capital gains of €53.8 million from the buyback of subordinated debt. Figures for 2008 include capital gains arising from the reorganisation of the structure of the alliance with CAJA MADRID (€103.2 million before tax)
70Nº 2009 - 25
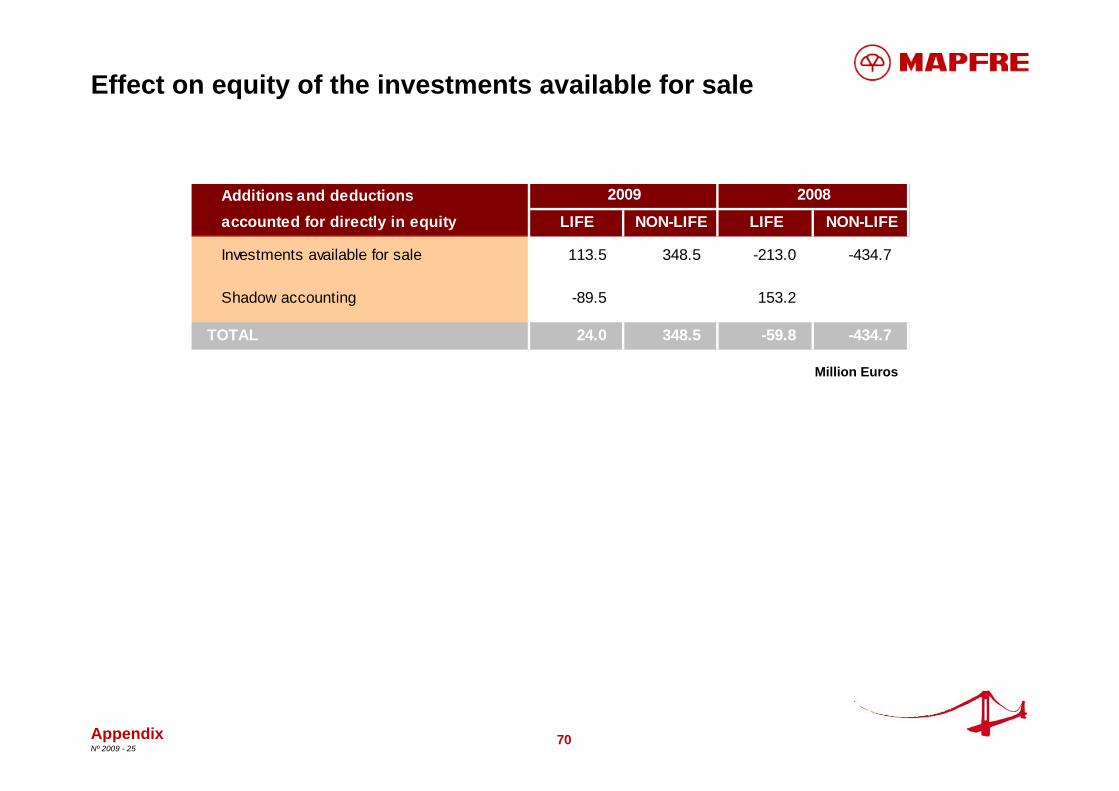
Effect on equity of the investments available for sale
Million Euros
Appendix
Additions and deductionsaccounted for directly in equity LIFE NON-LIFE LIFE NON-LIFE
Investments available for sale 113.5 348.5 -213.0 -434.7
Shadow accounting -89.5 153.2
TOTAL 24.0 348.5 -59.8 -434.7
20082009
71Nº 2009 - 25
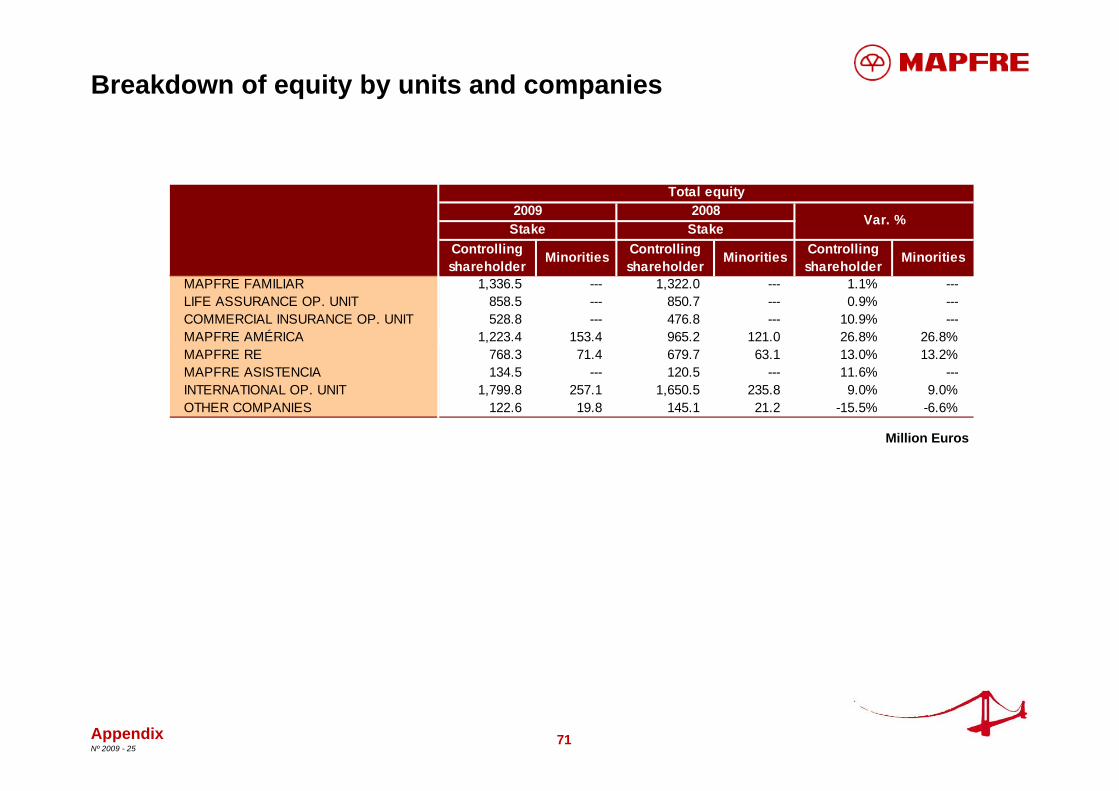
Breakdown of equity by units and companies
Appendix
Million Euros
Controlling shareholder Minorities Controlling
shareholder Minorities Controlling shareholder Minorities
MAPFRE FAMILIAR 1,336.5 --- 1,322.0 --- 1.1% ---LIFE ASSURANCE OP. UNIT 858.5 --- 850.7 --- 0.9% ---COMMERCIAL INSURANCE OP. UNIT 528.8 --- 476.8 --- 10.9% ---MAPFRE AMÉRICA 1,223.4 153.4 965.2 121.0 26.8% 26.8%MAPFRE RE 768.3 71.4 679.7 63.1 13.0% 13.2%MAPFRE ASISTENCIA 134.5 --- 120.5 --- 11.6% ---INTERNATIONAL OP. UNIT 1,799.8 257.1 1,650.5 235.8 9.0% 9.0%OTHER COMPANIES 122.6 19.8 145.1 21.2 -15.5% -6.6%
Var. %Stake Stake
Total equity2009 2008
72Nº 2009 - 25
Million Euros
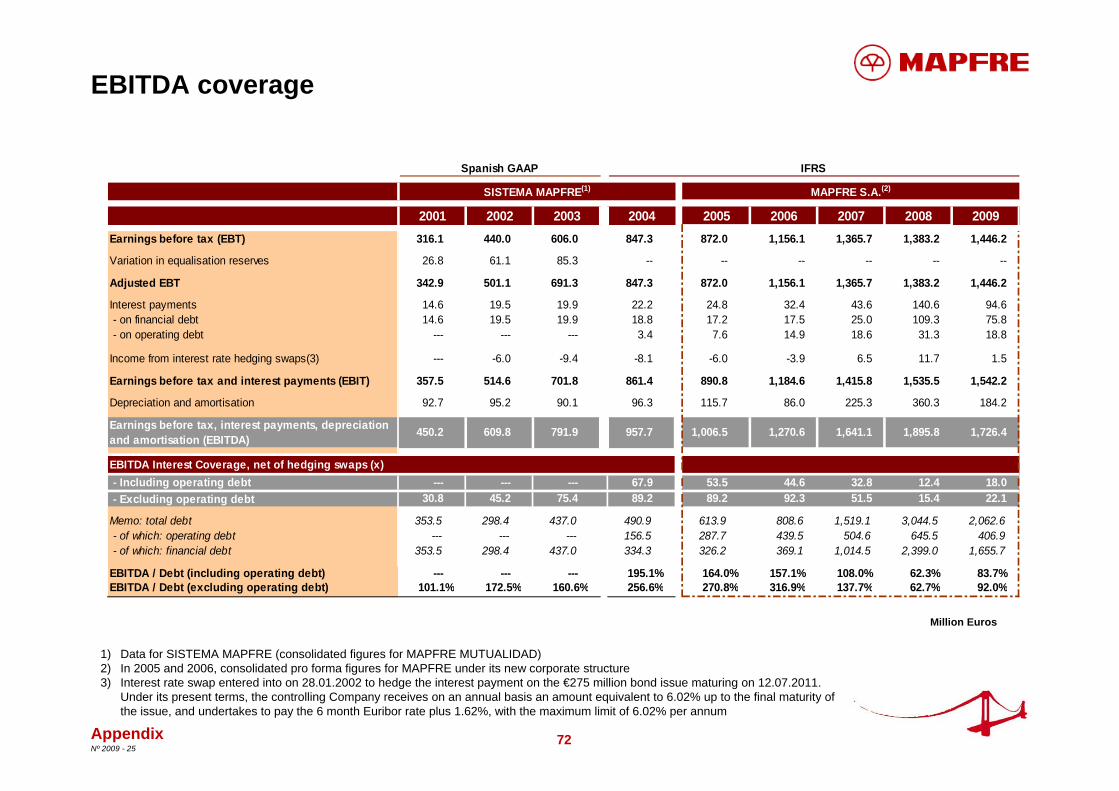
EBITDA coverage
Appendix
1) Data for SISTEMA MAPFRE (consolidated figures for MAPFRE MUTUALIDAD)2) In 2005 and 2006, consolidated pro forma figures for MAPFRE under its new corporate structure3) Interest rate swap entered into on 28.01.2002 to hedge the interest payment on the €275 million bond issue maturing on 12.07.2011.
Under its present terms, the controlling Company receives on an annual basis an amount equivalent to 6.02% up to the final maturity of the issue, and undertakes to pay the 6 month Euribor rate plus 1.62%, with the maximum limit of 6.02% per annum
2001 2002 2003 2004 2005 2006 2007 2008 2009Earnings before tax (EBT) 316.1 440.0 606.0 847.3 872.0 1,156.1 1,365.7 1,383.2 1,446.2
Variation in equalisation reserves 26.8 61.1 85.3 -- -- -- -- -- --
Adjusted EBT 342.9 501.1 691.3 847.3 872.0 1,156.1 1,365.7 1,383.2 1,446.2
Interest payments 14.6 19.5 19.9 22.2 24.8 32.4 43.6 140.6 94.6 - on financial debt 14.6 19.5 19.9 18.8 17.2 17.5 25.0 109.3 75.8 - on operating debt --- --- --- 3.4 7.6 14.9 18.6 31.3 18.8
Income from interest rate hedging swaps(3) --- -6.0 -9.4 -8.1 -6.0 -3.9 6.5 11.7 1.5
Earnings before tax and interest payments (EBIT) 357.5 514.6 701.8 861.4 890.8 1,184.6 1,415.8 1,535.5 1,542.2
Depreciation and amortisation 92.7 95.2 90.1 96.3 115.7 86.0 225.3 360.3 184.2
Earnings before tax, interest payments, depreciation and amortisation (EBITDA)
450.2 609.8 791.9 957.7 1,006.5 1,270.6 1,641.1 1,895.8 1,726.4
- Including operating debt --- --- --- 67.9 53.5 44.6 32.8 12.4 18.0 - Excluding operating debt 30.8 45.2 75.4 89.2 89.2 92.3 51.5 15.4 22.1
Memo: total debt 353.5 298.4 437.0 490.9 613.9 808.6 1,519.1 3,044.5 2,062.6 - of which: operating debt --- --- --- 156.5 287.7 439.5 504.6 645.5 406.9 - of which: financial debt 353.5 298.4 437.0 334.3 326.2 369.1 1,014.5 2,399.0 1,655.7
EBITDA / Debt (including operating debt) --- --- --- 195.1% 164.0% 157.1% 108.0% 62.3% 83.7%EBITDA / Debt (excluding operating debt) 101.1% 172.5% 160.6% 256.6% 270.8% 316.9% 137.7% 62.7% 92.0%
EBITDA Interest Coverage, net of hedging swaps (x)
Spanish GAAP
SISTEMA MAPFRE(1) MAPFRE S.A.(2)
IFRS
73Nº 2009 - 25
Million Euros
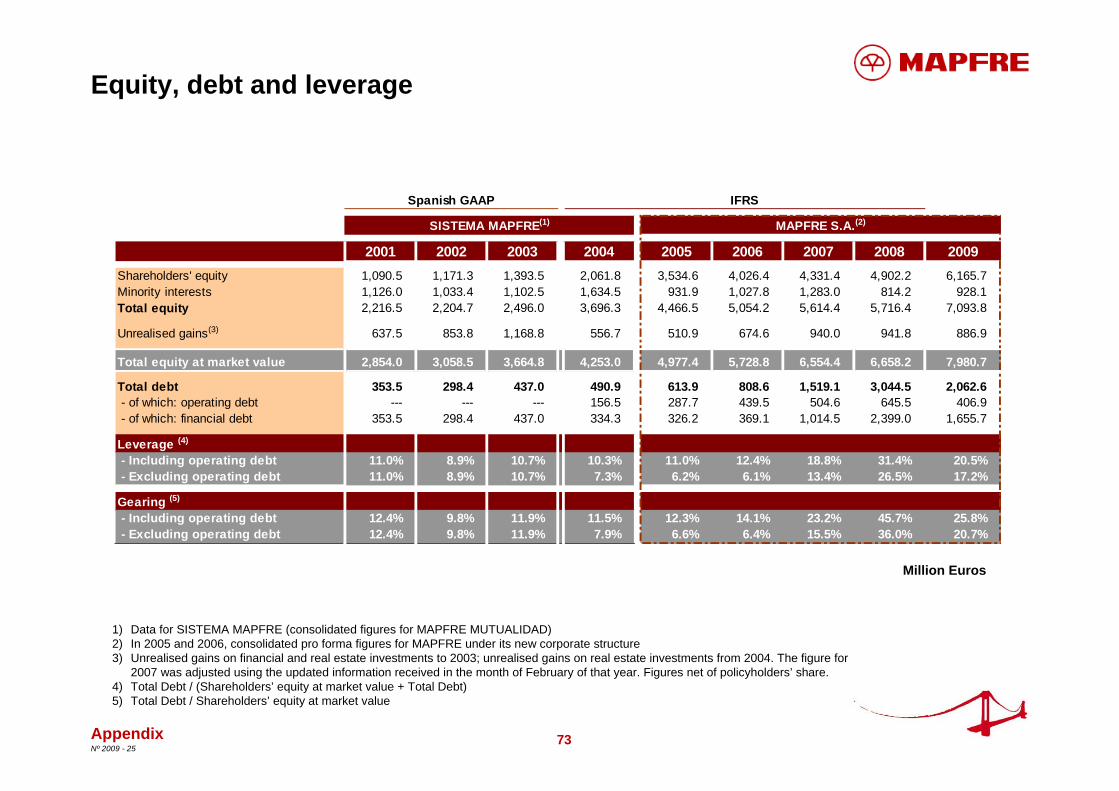
Equity, debt and leverage
Appendix
1) Data for SISTEMA MAPFRE (consolidated figures for MAPFRE MUTUALIDAD)2) In 2005 and 2006, consolidated pro forma figures for MAPFRE under its new corporate structure3) Unrealised gains on financial and real estate investments to 2003; unrealised gains on real estate investments from 2004. The figure for
2007 was adjusted using the updated information received in the month of February of that year. Figures net of policyholders’ share.4) Total Debt / (Shareholders’ equity at market value + Total Debt)5) Total Debt / Shareholders’ equity at market value
2001 2002 2003 2004 2005 2006 2007 2008 2009Shareholders' equity 1,090.5 1,171.3 1,393.5 2,061.8 3,534.6 4,026.4 4,331.4 4,902.2 6,165.7Minority interests 1,126.0 1,033.4 1,102.5 1,634.5 931.9 1,027.8 1,283.0 814.2 928.1Total equity 2,216.5 2,204.7 2,496.0 3,696.3 4,466.5 5,054.2 5,614.4 5,716.4 7,093.8
Unrealised gains(3) 637.5 853.8 1,168.8 556.7 510.9 674.6 940.0 941.8 886.9
Total equity at market value 2,854.0 3,058.5 3,664.8 4,253.0 4,977.4 5,728.8 6,554.4 6,658.2 7,980.7
Total debt 353.5 298.4 437.0 490.9 613.9 808.6 1,519.1 3,044.5 2,062.6 - of which: operating debt --- --- --- 156.5 287.7 439.5 504.6 645.5 406.9 - of which: financial debt 353.5 298.4 437.0 334.3 326.2 369.1 1,014.5 2,399.0 1,655.7
Leverage (4)
- Including operating debt 11.0% 8.9% 10.7% 10.3% 11.0% 12.4% 18.8% 31.4% 20.5% - Excluding operating debt 11.0% 8.9% 10.7% 7.3% 6.2% 6.1% 13.4% 26.5% 17.2%
Gearing (5)
- Including operating debt 12.4% 9.8% 11.9% 11.5% 12.3% 14.1% 23.2% 45.7% 25.8% - Excluding operating debt 12.4% 9.8% 11.9% 7.9% 6.6% 6.4% 15.5% 36.0% 20.7%
Spanish GAAP IFRS
SISTEMA MAPFRE(1) MAPFRE S.A.(2)
74Nº 2009 - 25
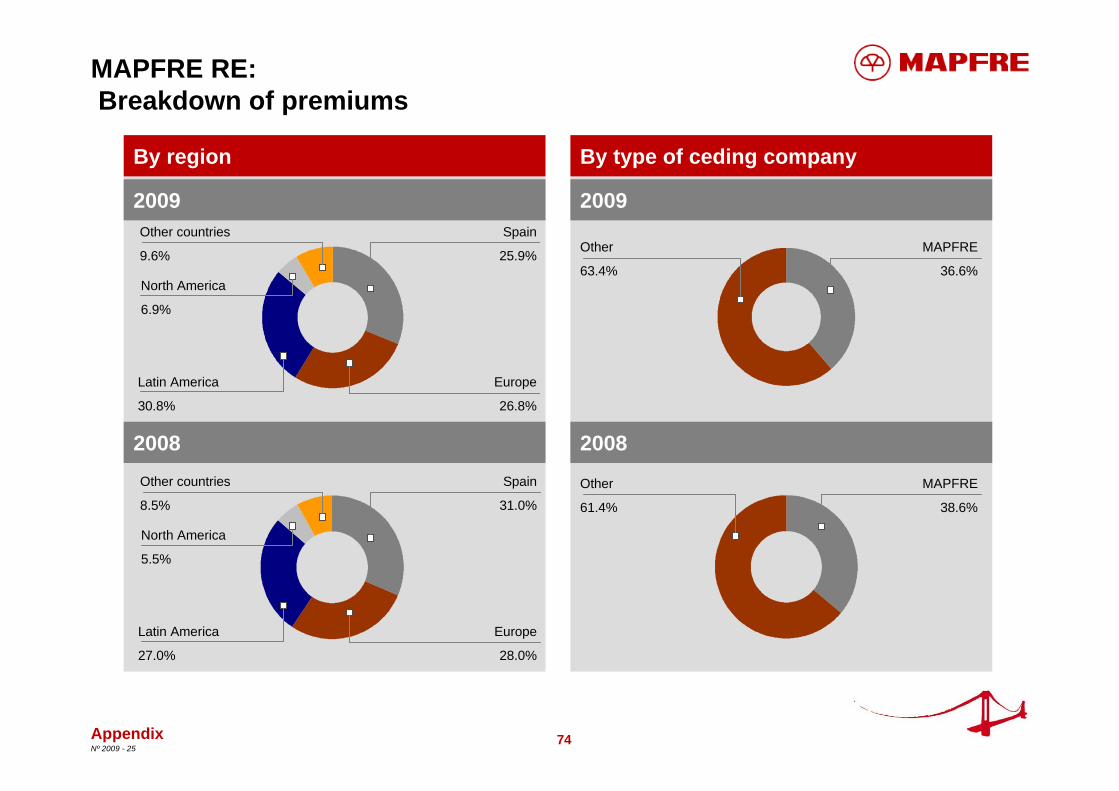
MAPFRE RE:Breakdown of premiums
By type of ceding companyBy region
2009
2008
2009
2008
North America
6.9%
Latin America
30.8%
Other countries
9.6%
Spain
25.9%
Europe
26.8%
Other
63.4%
MAPFRE
36.6%
North America
5.5%
Latin America
27.0%
Other countries
8.5%
Spain
31.0%
Europe
28.0%
Other
61.4%
MAPFRE
38.6%
Appendix
75Nº 2009 - 25
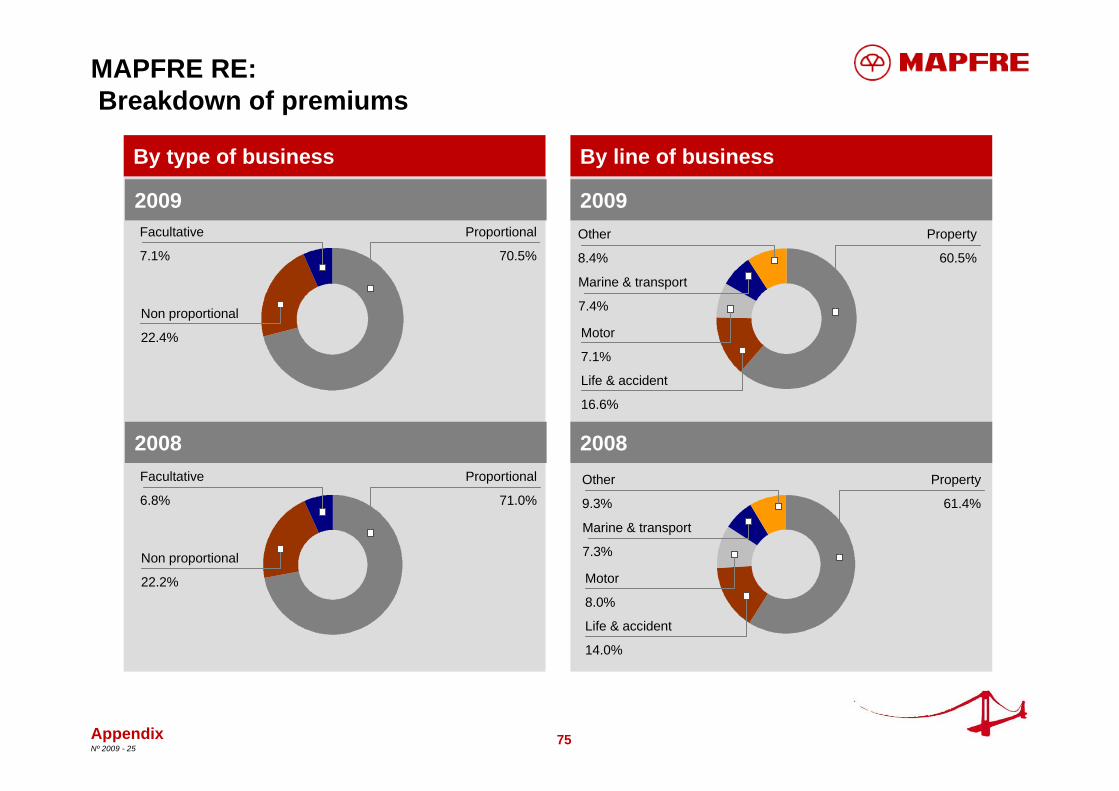
MAPFRE RE:Breakdown of premiums
By line of businessBy type of business
2009
2008
2009
2008
Non proportional
22.4%
Facultative
7.1%
Proportional
70.5%
Non proportional
22.2%
Facultative
6.8%
Proportional
71.0%
Life & accident
16.6%
Other
8.4%
Property
60.5%
Motor
7.1%
Marine & transport
7.4%
Life & accident
14.0%
Other
9.3%
Property
61.4%
Motor
8.0%
Marine & transport
7.3%
Appendix
76Nº 2009 - 25
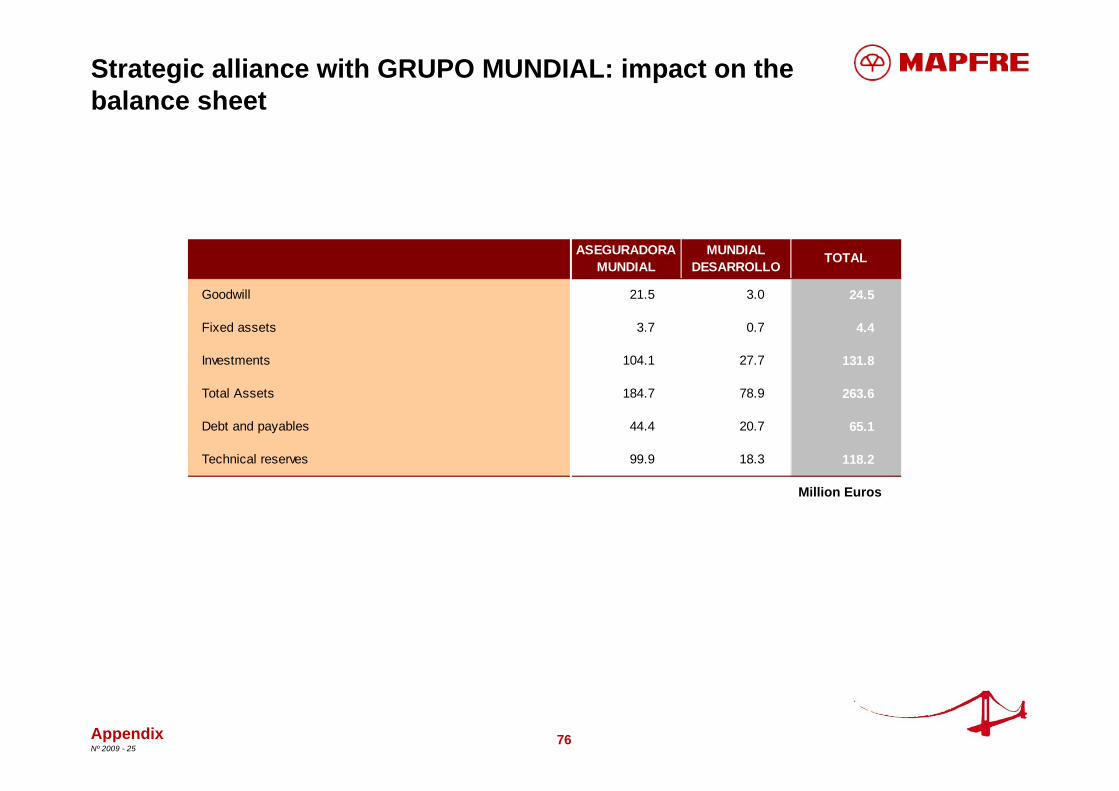
Strategic alliance with GRUPO MUNDIAL: impact on the balance sheet
Million Euros
ASEGURADORA MUNDIAL
MUNDIAL DESARROLLO
TOTAL
Goodwill 21.5 3.0 24.5
Fixed assets 3.7 0.7 4.4
Investments 104.1 27.7 131.8
Total Assets 184.7 78.9 263.6
Debt and payables 44.4 20.7 65.1
Technical reserves 99.9 18.3 118.2
Appendix
77Nº 2009 - 25
Key highlights
Consolidated financial information
Business development
Appendix
Financial supplement
Contacts
78Nº 2009 - 25
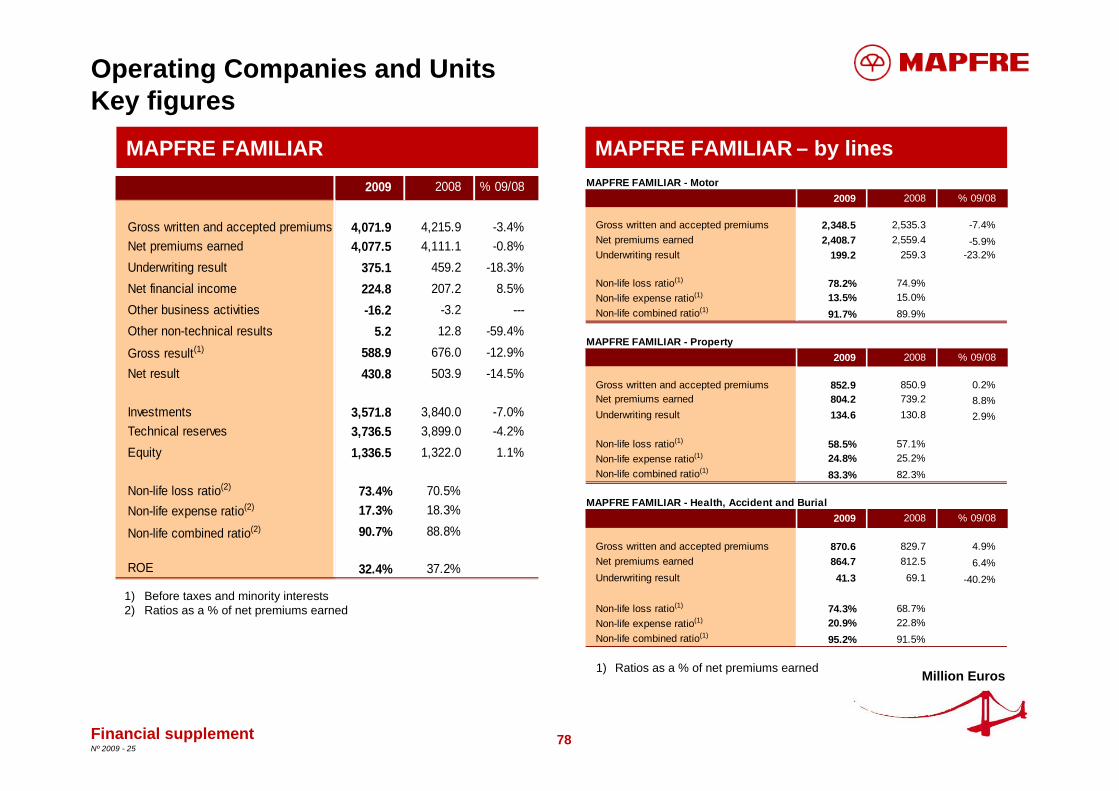
Operating Companies and UnitsKey figures
MAPFRE FAMILIAR
Million Euros
MAPFRE FAMILIAR – by lines
1) Before taxes and minority interests2) Ratios as a % of net premiums earned
1) Ratios as a % of net premiums earned
Financial supplement
2009 2008 % 09/08
Gross written and accepted premiums 4,071.9 4,215.9 -3.4%Net premiums earned 4,077.5 4,111.1 -0.8%Underwriting result 375.1 459.2 -18.3%Net financial income 224.8 207.2 8.5%Other business activities -16.2 -3.2 ---Other non-technical results 5.2 12.8 -59.4%
Gross result(1) 588.9 676.0 -12.9%Net result 430.8 503.9 -14.5%
Investments 3,571.8 3,840.0 -7.0%Technical reserves 3,736.5 3,899.0 -4.2%Equity 1,336.5 1,322.0 1.1%
Non-life loss ratio(2) 73.4% 70.5%Non-life expense ratio(2) 17.3% 18.3%
Non-life combined ratio(2) 90.7% 88.8%
ROE 32.4% 37.2%
MAPFRE FAMILIAR - Motor2009 2008 % 09/08
Gross written and accepted premiums 2,348.5 2,535.3 -7.4%Net premiums earned 2,408.7 2,559.4 -5.9%Underwriting result 199.2 259.3 -23.2%
Non-life loss ratio(1) 78.2% 74.9%Non-life expense ratio(1) 13.5% 15.0%Non-life combined ratio(1) 91.7% 89.9%
MAPFRE FAMILIAR - Property2009 2008 % 09/08
Gross written and accepted premiums 852.9 850.9 0.2%Net premiums earned 804.2 739.2 8.8%Underwriting result 134.6 130.8 2.9%
Non-life loss ratio(1) 58.5% 57.1%Non-life expense ratio(1) 24.8% 25.2%Non-life combined ratio(1) 83.3% 82.3%
MAPFRE FAMILIAR - Health, Accident and Burial2009 2008 % 09/08
Gross written and accepted premiums 870.6 829.7 4.9%Net premiums earned 864.7 812.5 6.4%Underwriting result 41.3 69.1 -40.2%
Non-life loss ratio(1) 74.3% 68.7%Non-life expense ratio(1) 20.9% 22.8%Non-life combined ratio(1) 95.2% 91.5%

79Nº 2009 - 25
COMMERCIAL INSUR. OPER. UNIT MAPFRE EMPRESAS – by lines
1) Before taxes and minority interests 2) Ratios calculated as a % of net premiums earned.
1) Ratios calculated as a % of net premiums earned
Million Euros
Operating Companies and UnitsKey figures
Financial supplement
2009 2008 % 09/08
Gross written and accepted premiums 1,504.8 1,613.6 -6.7%- Industrial business 666.4 836.1 -20.3%- Global Risks 713.2 620.8 14.9%- Credit and Surety business 125.2 156.6 -20.1%Net premiums earned 724.6 760.7 -4.7%Underwriting result 37.7 89.8 -58.0%Net financial income 76.7 69.6 10.2%Other business activities -6.0 -4.0 50.0%Other non-technical results 3.1 4.7 -34.0%Gross result (2) 111.6 160.1 -30.3%Net result 76.7 114.5 -33.0%
Investments 1,614.8 1,579.1 2.3%Technical reserves 3,013.9 2,969.5 1.5%Shareholders' equity 528.8 476.8 10.9%
Non-life loss ratio(3) 68.6% 66.6%Non-life expense ratio(3) 26.2% 21.6%Non-life combined ratio(3) 94.8% 88.2%
ROE 15.3% 23.3%
MAPFRE SEGUROS DE EMPRESAS2009 2008 % 09/08
Gross written and accepted premiums 666.4 836.1 -20.3%Net premiums earned 538.8 593.9 -9.3%Underwriting result 34.2 101.9 -66.4%
Non-life loss ratio(1) 66.6% 61.7%Non-life expense ratio(1) 27.1% 21.2%Non-life combined ratio(1) 93.7% 82.8%
GLOBAL RISKS2009 2008 % 09/08
Gross written and accepted premiums 838.4 777.5 7.8%Net premiums earned 185.8 166.9 11.3%Underwriting result 3.5 -12.1 --
Non-life loss ratio(1) 74.8% 84.1%Non-life expense ratio(1) 23.3% 23.1%Non-life combined ratio(1) 98.1% 107.3%
80Nº 2009 - 25
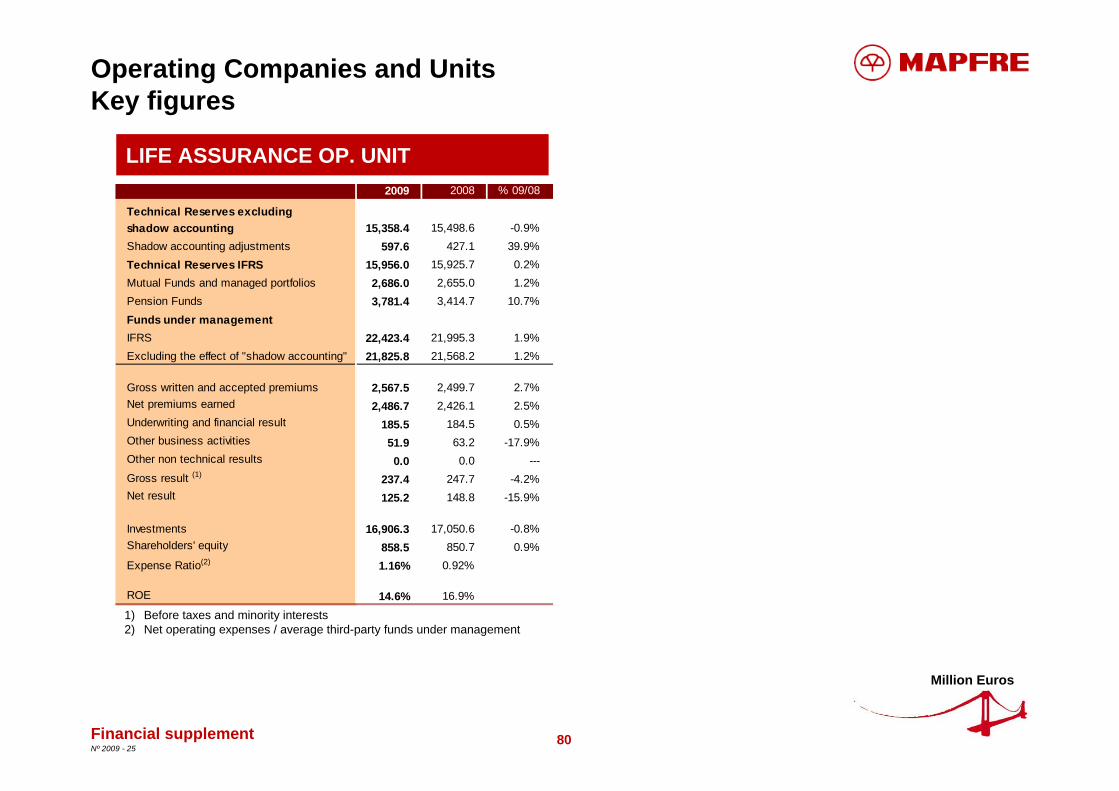
Operating Companies and UnitsKey figures
LIFE ASSURANCE OP. UNIT
1) Before taxes and minority interests2) Net operating expenses / average third-party funds under management
Financial supplement
2009 2008 % 09/08
Technical Reserves excludingshadow accounting 15,358.4 15,498.6 -0.9%Shadow accounting adjustments 597.6 427.1 39.9%Technical Reserves IFRS 15,956.0 15,925.7 0.2%Mutual Funds and managed portfolios 2,686.0 2,655.0 1.2%Pension Funds 3,781.4 3,414.7 10.7%Funds under managementIFRS 22,423.4 21,995.3 1.9%Excluding the effect of "shadow accounting" 21,825.8 21,568.2 1.2%
Gross written and accepted premiums 2,567.5 2,499.7 2.7%Net premiums earned 2,486.7 2,426.1 2.5%Underwriting and financial result 185.5 184.5 0.5%Other business activities 51.9 63.2 -17.9%Other non technical results 0.0 0.0 ---Gross result (1) 237.4 247.7 -4.2%Net result 125.2 148.8 -15.9%
Investments 16,906.3 17,050.6 -0.8%Shareholders' equity 858.5 850.7 0.9%Expense Ratio(2) 1.16% 0.92%
ROE 14.6% 16.9%
Million Euros
81Nº 2009 - 25
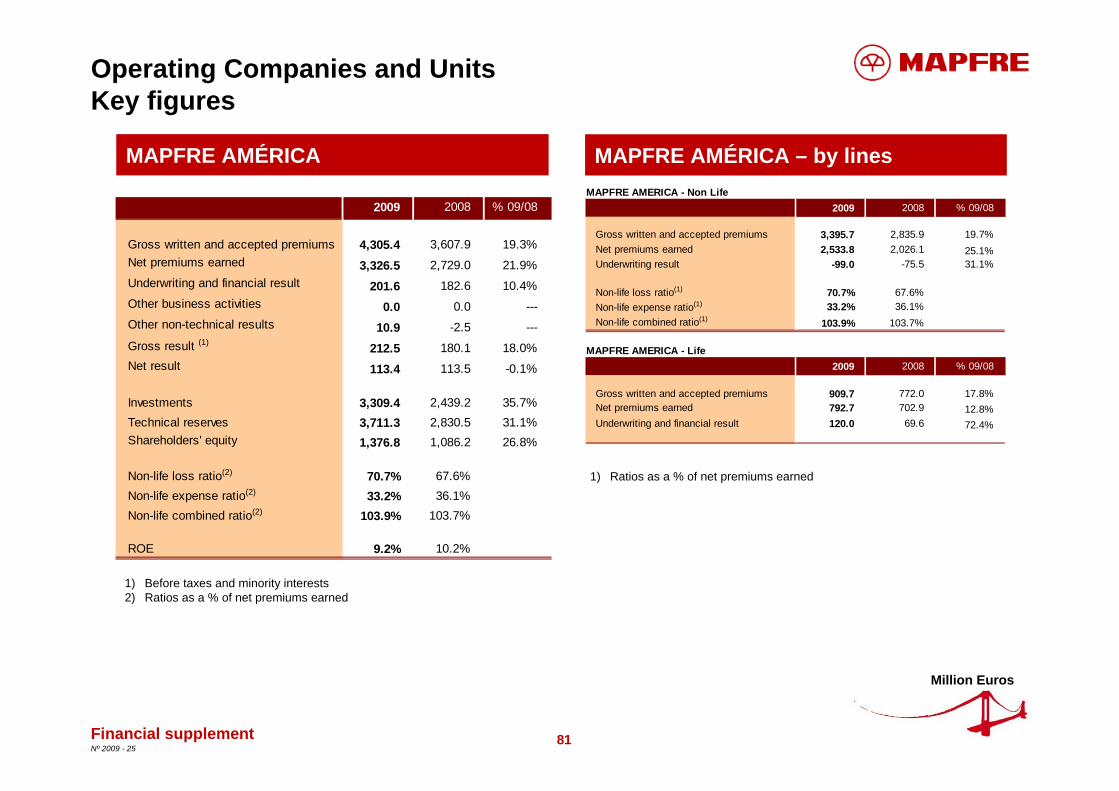
MAPFRE AMÉRICA – by lines
1) Before taxes and minority interests2) Ratios as a % of net premiums earned
Million Euros
Operating Companies and UnitsKey figures
MAPFRE AMÉRICA
1) Ratios as a % of net premiums earned
Financial supplement
2009 2008 % 09/08
Gross written and accepted premiums 4,305.4 3,607.9 19.3%Net premiums earned 3,326.5 2,729.0 21.9%Underwriting and financial result 201.6 182.6 10.4%Other business activities 0.0 0.0 ---Other non-technical results 10.9 -2.5 ---Gross result (1) 212.5 180.1 18.0%Net result 113.4 113.5 -0.1%
Investments 3,309.4 2,439.2 35.7%Technical reserves 3,711.3 2,830.5 31.1%Shareholders' equity 1,376.8 1,086.2 26.8%
Non-life loss ratio(2) 70.7% 67.6%Non-life expense ratio(2) 33.2% 36.1%Non-life combined ratio(2) 103.9% 103.7%
ROE 9.2% 10.2%
MAPFRE AMERICA - Non Life2009 2008 % 09/08
Gross written and accepted premiums 3,395.7 2,835.9 19.7%Net premiums earned 2,533.8 2,026.1 25.1%Underwriting result -99.0 -75.5 31.1%
Non-life loss ratio(1) 70.7% 67.6%Non-life expense ratio(1) 33.2% 36.1%Non-life combined ratio(1) 103.9% 103.7%
MAPFRE AMERICA - Life2009 2008 % 09/08
Gross written and accepted premiums 909.7 772.0 17.8%Net premiums earned 792.7 702.9 12.8%Underwriting and financial result 120.0 69.6 72.4%
82Nº 2009 - 25
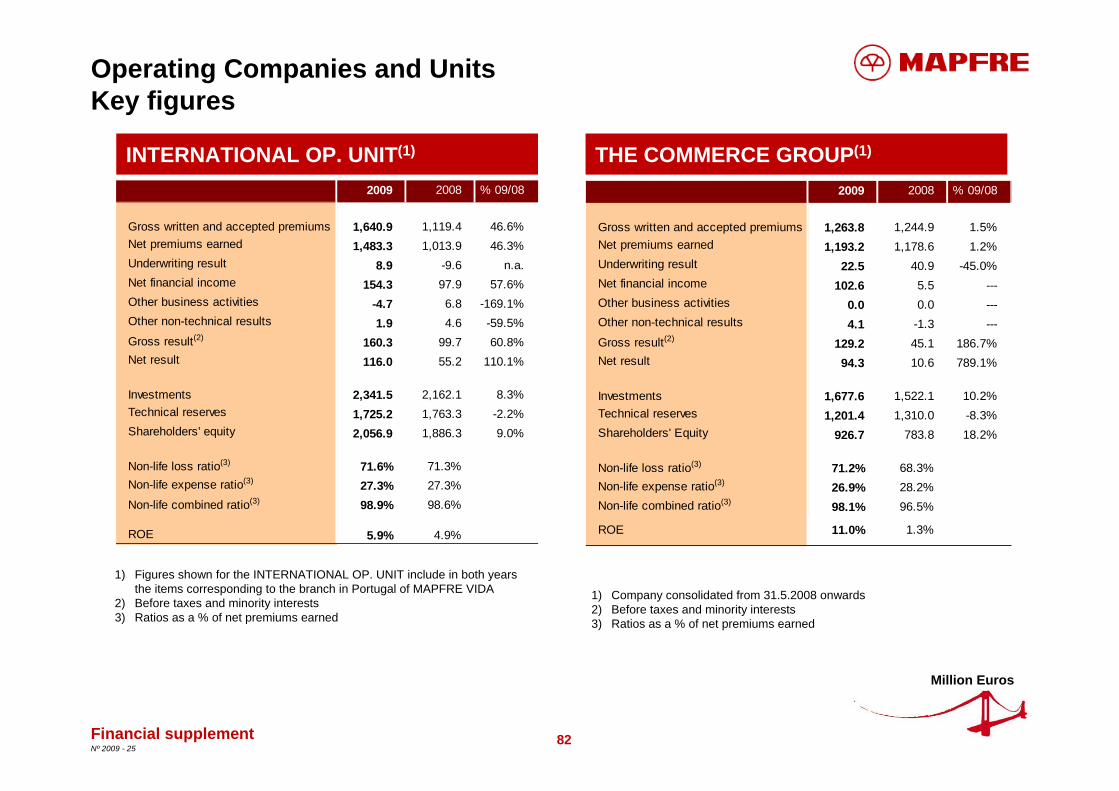
Operating Companies and UnitsKey figures
INTERNATIONAL OP. UNIT(1)
1) Figures shown for the INTERNATIONAL OP. UNIT include in both years the items corresponding to the branch in Portugal of MAPFRE VIDA
2) Before taxes and minority interests 3) Ratios as a % of net premiums earned
THE COMMERCE GROUP(1)
Financial supplement
Million Euros
2009 2008 % 09/08
Gross written and accepted premiums 1,640.9 1,119.4 46.6%Net premiums earned 1,483.3 1,013.9 46.3%Underwriting result 8.9 -9.6 n.a.Net financial income 154.3 97.9 57.6%Other business activities -4.7 6.8 -169.1%Other non-technical results 1.9 4.6 -59.5%Gross result(2) 160.3 99.7 60.8%Net result 116.0 55.2 110.1%
Investments 2,341.5 2,162.1 8.3%Technical reserves 1,725.2 1,763.3 -2.2%Shareholders' equity 2,056.9 1,886.3 9.0%
Non-life loss ratio(3) 71.6% 71.3%Non-life expense ratio(3) 27.3% 27.3%Non-life combined ratio(3) 98.9% 98.6%
ROE 5.9% 4.9%
1) Company consolidated from 31.5.2008 onwards 2) Before taxes and minority interests3) Ratios as a % of net premiums earned
2009 2008 % 09/08
Gross written and accepted premiums 1,263.8 1,244.9 1.5%Net premiums earned 1,193.2 1,178.6 1.2%Underwriting result 22.5 40.9 -45.0%Net financial income 102.6 5.5 ---Other business activities 0.0 0.0 ---Other non-technical results 4.1 -1.3 ---Gross result(2) 129.2 45.1 186.7%Net result 94.3 10.6 789.1%
Investments 1,677.6 1,522.1 10.2%Technical reserves 1,201.4 1,310.0 -8.3%Shareholders' Equity 926.7 783.8 18.2%
Non-life loss ratio(3) 71.2% 68.3%Non-life expense ratio(3) 26.9% 28.2%Non-life combined ratio(3) 98.1% 96.5%
ROE 11.0% 1.3%
83Nº 2009 - 25
Operating Companies and UnitsKey figures
MAPFRE RE
1) Before taxes and minority interests2) Ratios as a % of net premiums earned
MAPFRE GENEL SIGORTA
Financial supplement
Million Euros
1) Before taxes and minority interests 2) Ratios as a % of net premiums earned
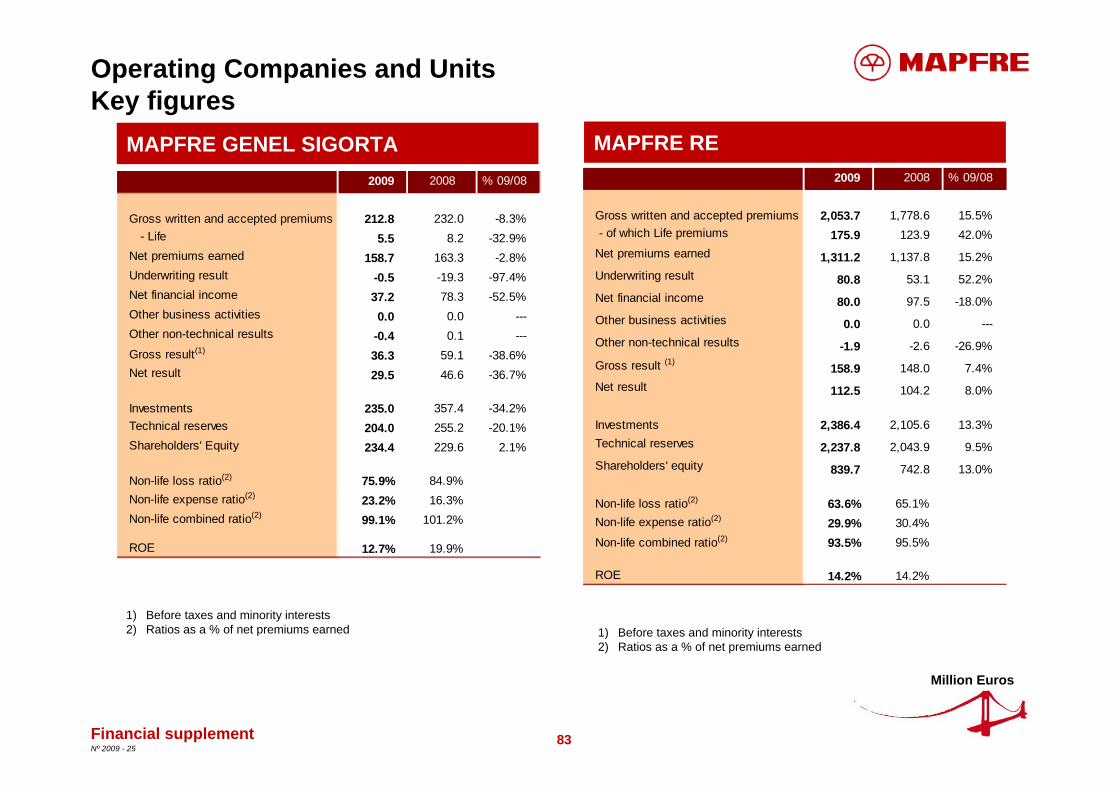
2009 2008 % 09/08
Gross written and accepted premiums 212.8 232.0 -8.3% - Life 5.5 8.2 -32.9%Net premiums earned 158.7 163.3 -2.8%Underwriting result -0.5 -19.3 -97.4%Net financial income 37.2 78.3 -52.5%Other business activities 0.0 0.0 ---Other non-technical results -0.4 0.1 ---Gross result(1) 36.3 59.1 -38.6%Net result 29.5 46.6 -36.7%
Investments 235.0 357.4 -34.2%Technical reserves 204.0 255.2 -20.1%Shareholders' Equity 234.4 229.6 2.1%
Non-life loss ratio(2) 75.9% 84.9%Non-life expense ratio(2) 23.2% 16.3%Non-life combined ratio(2) 99.1% 101.2%
ROE 12.7% 19.9%
2009 2008 % 09/08
Gross written and accepted premiums 2,053.7 1,778.6 15.5% - of which Life premiums 175.9 123.9 42.0%Net premiums earned 1,311.2 1,137.8 15.2%Underwriting result 80.8 53.1 52.2%Net financial income 80.0 97.5 -18.0%Other business activities 0.0 0.0 ---Other non-technical results -1.9 -2.6 -26.9%Gross result (1) 158.9 148.0 7.4%Net result 112.5 104.2 8.0%
Investments 2,386.4 2,105.6 13.3%Technical reserves 2,237.8 2,043.9 9.5%Shareholders' equity 839.7 742.8 13.0%
Non-life loss ratio(2) 63.6% 65.1%Non-life expense ratio(2) 29.9% 30.4%Non-life combined ratio(2) 93.5% 95.5%
ROE 14.2% 14.2%

84Nº 2009 - 25
BANCO DE SERVICIOS FINANCIEROS CAJA MADRID-MAPFRE (Affiliate company)
MAPFRE INMUEBLES
Operating Companies and UnitsKey figures
Million Euros
1) Before taxes and minority interests2) Operating expenses/Operating revenues
1) Before taxes and minority interests
Financial supplement
2009 2008 % 09/08
Net interest income 149.3 126.2 18.3%Operating revenues 150.9 125.3 20.4%Operating profits 91.6 64.0 43.1%Provisions -220.5 -59.4 ---Gross result(1) -135.5 5.2 ---Net result -100.0 0.6 ---
Lending portfolio (net) 6,171.9 6,745.8 -8.5%Shareholders' equity 466.0 453.1 2.8%
Cost/income ratio(2) 36.5% 44.5%NPL ratio 6.1% 5.2%
Coverage ratio 48.6% 43.2%
BIS ratio 10.0% 10.2%
2009 2008 % 09/08
Operating revenues 45.4 59.2 -23.3%EBIT -0.5 -20.4 97.5%Net financial income -18.4 -25.6 28.1%Gross result(1) -18.9 -46.1 59.0%Net result -13.3 -32.5 59.1%
Stock 654.4 686.5 -4.7%Debt 572.6 544.3 5.2%Shareholders' equity 96.7 111.6 -13.4%
Real estate units under construction 145 334 -56.6%
Real estate units finished, pending sale 122 36 ---Land (buildable floor space, thousand m2) 541.0 547.0 -1.1%Floor space - under construction (thousand m2) 24.0 45.0 -46.7%

85Nº 2009 - 25
MAPFRE QUAVITAE (1)
Financial supplement
MAPFRE ASISTENCIA
Operating Companies and UnitsKey figures
Million Euros
1) Before taxes and minority interests 2) Ratios as a % of net premiums earned
1) MAPFRE QUAVITAE is managed by the ASSISTANCE OPERATING UNIT, although MAPFRE S.A. controls the majority of its share capital
2) Before taxes and minority interests
2009 2008 % 09/08
Operating income 483.8 425.8 13.6% - Gross written and accepted premiums 357.1 301.5 18.4% - Other income 126.7 124.3 1.9%Net premiums earned 304.4 290.5 4.8%Underwriting result 26.9 19.3 39.4%Net financial income 0.7 1.8 -61.1%Other business activities -2.0 -0.4 ---Other non-technical results 0.0 -0.1 -100.0%Gross result (1) 25.6 20.7 23.7%Net result 16.3 10.8 50.9%
Investments 33.9 56.4 -39.9%Technical reserves 198.5 174.9 13.5%Shareholders' equity 134.5 120.5 11.6%
Non-life loss ratio(2) 63.9% 63.3%Non-life expense ratio(2) 27.3% 30.1%Non-life combined ratio(2) 91.2% 93.4%
ROE 12.8% 9.3%
2009 2008 % 09/08
Operating revenues 134.7 118.7 13.5%
EBIT -1.1 3.1 -135.5%
Total financial income -1.0 -2.5 60.0%
Gross result(2) -2.5 0.6 ---
Net result -3.2 -0.2 ---
Financial debt 33.0 36.5 -9.6%
Shareholders' equity 45.6 48.9 -6.7%
Residential centres 21 20 5.0%
Residential places 3,388 3,273 3.5%
Day-centres 35 31 12.9%
Day-centres places 1,471 1,369 7.5%
Teleassistance users 21,930 21,670 1.2%
Home assistance users 16,477 14,043 17.3%
86Nº 2009 - 25
Key highlights
Consolidated financial information
Business development
Appendix
Financial supplement
Contacts
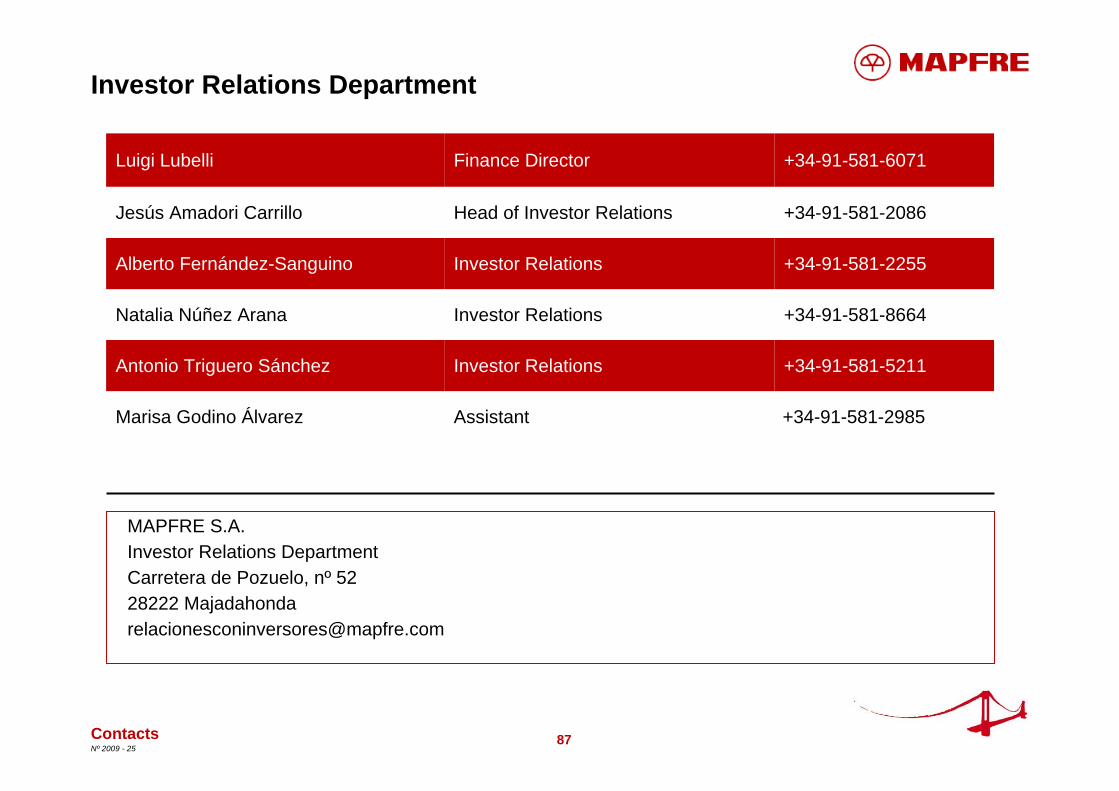
87Nº 2009 - 25
Investor Relations Department
Contacts
Assistant
Investor Relations
Investor Relations
Investor Relations
Head of Investor Relations
Finance Director
+34-91-581-2985Marisa Godino Álvarez
+34-91-581-5211Antonio Triguero Sánchez
+34-91-581-8664Natalia Núñez Arana
+34-91-581-2255Alberto Fernández-Sanguino
+34-91-581-2086Jesús Amadori Carrillo
+34-91-581-6071Luigi Lubelli
MAPFRE S.A. Investor Relations Department Carretera de Pozuelo, nº 52 28222 Majadahonda [email protected]
88Nº 2009 - 25
DisclaimerThis document is purely informative. Its content does not constitute, nor can it be interpreted as, an offer or an invitation to sell, exchange or buy, and it is not binding on the issuer in any way. The information about the plans of the Company, its evolution, its results and its dividends represents a simple forecast whose formulation does not represent a guarantee with respect to the future performance of the Company or the achievement of its targets or estimated results. The recipients of this information must be aware that the preparation of these forecasts is based on assumptions and estimates, which are subject to a high degree of uncertainty, and that, due to multiple factors, future results may differ materially from expected results. Among such factors, the following are worth highlighting: the development of the insurance market and the general economic situation of those countries where the Group operates; circumstances which may affect the competitiveness of insurance products and services; changes in the basis of calculation of mortality and morbidity tables which may affect the insurance activities of the Life and Health segments; frequency and severity of claims covered; effectiveness of the Groups reinsurance policies and fluctuations in the cost and availability of covers offered by third party reinsurers; changes in the legal environment; adverse legal actions; changes in monetary policy; variations in interest rates and exchange rates; fluctuations in liquidity and the value and profitability of assets which make up the investment portfolio; restrictions in the access to third party financing.
MAPFRE S.A. does not undertake to update or revise periodically the content of this document.