Embed Size (px)
Citation preview
Year-End Performance Report
October 2011 (July 1, 2010 – June 30, 2011)
A Summary of
Construction Compliance Reviews
CTSW-RT-12-222.04.3
Prepared for:
California Department of Transportation
Division of Environmental Analysis
Storm Water Program
1120 N Street
Sacramento, California 95814
http://www.dot.ca.gov/hq/env/stormwater/index.htm
Department of Transportation Year-End Performance Report – October 2011
For individuals with sensory disabilities, this document is available in alternate formats upon
request. Please call or write to Stormwater Liaison, California Department of Transportation
Division of Environmental Analysis, PO Box 942874, MS-27, Sacramento, CA 94274-0001,
(916) 653-8896 Voice, or dial 711 to use a relay service.
Department of Transportation Year-End Performance Report – October 2011
TABLE OF CONTENTS
1.0 INTRODUCTION ..................................................................................................................5
2.0 ELEMENTS OF CONSTRUCTION COMPLIANCE EVALUATION PLAN ...............7
2.1 CONSTRUCTION PROJECT STORMWATER REVIEW RATING CRITERIA..............................8 2.1.1 AUTOMATED PROCESS FOR CREATING THE PROJECT ALPHA AND
NUMERIC RATING ................................................................................................8 2.1.2 WATER QUALITY COMPLIANCE - NUMERIC RATING ............................................8 2.1.3 STORMWATER CONTRACT ADMINISTRATION - ALPHA RATING ..........................10
2.2 PROJECT SELECTION .....................................................................................................12
2.3 CONSTRUCTION PROJECT STORMWATER REVIEW PLAN ...............................................12
2.4 CONSTRUCTION COMPLIANCE EVALUATION PLAN -INDEPENDENT
ASSURANCE PROCEDURE ..............................................................................................13
2.5 FEEDBACK AND PROGRAM IMPROVEMENT ...................................................................13 2.5.1 TRENDS EVALUATION ........................................................................................13
3.0 PERFORMANCE ASSESSMENT .....................................................................................14
3.1 COMBINED REVIEW RESULTS .......................................................................................14
3.2 NUMERIC REVIEW RESULTS ..........................................................................................16
3.3 ALPHA REVIEW RESULTS ..............................................................................................18
4.0 TRENDS ................................................................................................................................19
4.1 BMP ADEQUACY ..........................................................................................................19 4.1.1 BMP PERFORMANCE TRENDS OVER TIME ..........................................................29
4.2 CONTRACT ADMINISTRATION EFFECTIVENESS .............................................................31
5.0 CONCLUSION .....................................................................................................................35
LIST OF FIGURES
FIGURE 3-1. OVERALL ALPHA NUMBERIC RATINGS (ALL PROJECTS) ....................................16
FIGURE 3-2. NUMERIC RATING SUMMARY (ALL PROJECTS) ..................................................17
FIGURE 3-3. ALPHA RATING SUMMARY (ALL PROJECTS) ......................................................19
FIGURE 4-1. BMPS – SORTED BY NUMBER OF INADEQUACIES ...............................................22
FIGURE 4-2. BMPS – SORTED BY PERCENTAGE OF INADEQUACIES ........................................25
FIGURE 4-3. BMP PERFORMANCE TRENDS OVER TIME ..........................................................33
FIGURE 4-4. ALPHA BMPS – SORTED BY NUMBER OF INADEQUACIES ...................................33
FIGURE 4-5. ALPHA BMPS – SORTED BY PERCENTAGE OF INADEQUACIES ............................35
Department of Transportation Year-End Performance Report – October 2011
LIST OF TABLES
TABLE 3-1. COMBINED REVIEW RESULTS (ALL PROJECTS) CURRENT DATA COMPARTED
TO PAST YEARS ..................................................................................................15
TABLE 3-2. NUMERIC RATING SUMMARY (ALL PROJECTS) JULY 1, 2010 - JUNE 30, 2011 ...17
TABLE 3-3. ALPHA RATING SUMMARY (ALL PROJECTS) JULY 1, 2010 - JUNE 30, 2011 .......18
TABLE 4-1. SUMMARY OF BMPS REVIEWED ........................................................................20
TABLE 4-2. BMPS SORTED BY PERCENTAGE OF INADEQUACIES ...........................................23
TABLE 4-3A. SUMMARY OF NON-STORMWATER BMPS ..........................................................26
TABLE 4-3B. SUMMARY OF SEDIMENT CONTROL BMPS .........................................................27
TABLE 4-3C. SUMMARY OF SOIL STABILIZATION BMPS .........................................................27
TABLE 4-3D. SUMMARY OF OTHER BMPS (TRACKING CONTROL, WIND EROSION,
WASTE MANAGEMENT) .......................................................................................28
TABLE 4-4. SUMMARY OF ALPHA BMPS REVIEWED ............................................................34
TABLE 4-5. ALPHA BMPS SORTED BY PERCENTAGE OF INADEQUACIES ...............................34
Department of Transportation Year-End Performance Report – October 2011
LIST OF ACRONYMS
ACCRP Annual Construction Compliance Review Plan
ACL Administrative Civil Liability
BMP Best Management Practice
CCEP Construction Compliance Evaluation Plan
CPSRP Construction Project Stormwater Review Plan
CSBMPAE Construction Stormwater Best Management Practices Adequacy Evaluation
CSWAT Construction Stormwater Advisory Team
DCSWC District Construction Stormwater Coordinator
Department Department of Transportation
DSA Disturbed Soil Area
IA Independent Assurance
NPDES National Pollutant Discharge Elimination System
OSPI Office of Stormwater Program Implementation
QA II Quality Assurance Level II
QC Quality Control
RWQCB Regional Water Quality Control Board
SCAPE Stormwater Contract Administration Process Evaluation
SWMP Stormwater Management Plan
SWPPP Stormwater Pollution Prevention Program
WPCP Water Pollution Control Program
Department of Transportation Year-End Performance Report – October 2011
1.0 INTRODUCTION
This Year-End Performance Report – October 2011 summarizes the construction project stormwater
compliance reviews conducted between July 1, 2010 and June 30, 2011. This document reports the
level of stormwater pollution control compliance observed on Department of Transportation
(Department) construction projects statewide during this reporting period (July 1, 2010 to June 30,
2011) and identifies Best Management Practice (BMP) implementation trends, improvements, and
challenges noted during the year.
Since 1990, several construction project stormwater review plans have been developed to evaluate
Caltrans projects for adequacy to implement stormwater pollution prevention measures and
compliance with the requirements of the Caltrans National Pollutant Discharge Elimination System
(NPDES) Permit and the Construction General Permit. The Annual Construction Compliance
Review Plan (ACCRP) was adopted in August 2003 and was revised later in August 2005. In July
2008, the document Construction Compliance Evaluation Plan (CCEP) CTSW-PL-08-999.54.1 was
adopted, which superseded the ACCRP. Beginning in July 2008, Caltrans began using the CCEP
statewide to conduct project reviews statewide.
The CCEP document describes the activities implemented by Caltrans for evaluating construction
project stormwater compliance with the statewide NPDES Permit, Construction General Permit,
Caltrans guidance documents and the construction stormwater program. It also monitors the level of
compliance in the field, evaluates trends, and recommends improvements. The purpose of the CCEP
is to describe an effective procedure for evaluating Caltrans’ stormwater program in accordance with
Caltrans’ statewide Stormwater Management Plan (SWMP) dated June 2003 (Section 14, “Program
Evaluation,”) and the self-auditing requirements of Caltrans’ statewide NPDES Permit
(CAS000003) (Order No. 99-06-DWQ), provision K(3)(d) “Overall Management Program
Effectiveness.”
The CCEP includes the following components:
A process for evaluating the potential threat to water quality;
A review rating criteria sensitive to forecasted storm events and contractor preparedness;
A dual rating system that separates water quality compliance and stormwater contract
administration;
A prescribed project selection process for randomly selecting projects for review;
A Construction Project Stormwater Review Plan (CPSRP) providing procedures for
conducting project reviews, and;
An independent assurance process for the data collected from project reviews.
Department of Transportation Year-End Performance Report – October 2011
The CCEP also provides feedback procedures and a process for program improvement as follows:
A Stormwater Contract Administration Process Evaluation (SCAPE) to evaluate contract
administration processes based upon the observed trends detected in the data collected from
project reviews.
A Construction Stormwater Best Management Practices Adequacy Evaluation (CSBMPAE) to
evaluate BMP adequacy based upon the observed trends detected in the data collected from
project reviews.
To be an effective stormwater program for construction, the CCEP is designed to answer the
following questions:
Are resident engineers enforcing an effective Water Pollution Control Program (WPCP) or
Stormwater Pollution Prevention Program (SWPPP)?
Are construction BMPs adequate to protect the waters of California and the United States?
Do construction contractors properly implement and maintain effective WPCP or SWPPP?
Does the Caltrans’ stormwater program provide adequate support and training for resident
engineers and Caltrans staff to satisfactorily administer effective construction site stormwater
compliance?
Are contractors adequately trained to implement, maintain and inspect best management
practices that provide effective WPCP or SWPPP?
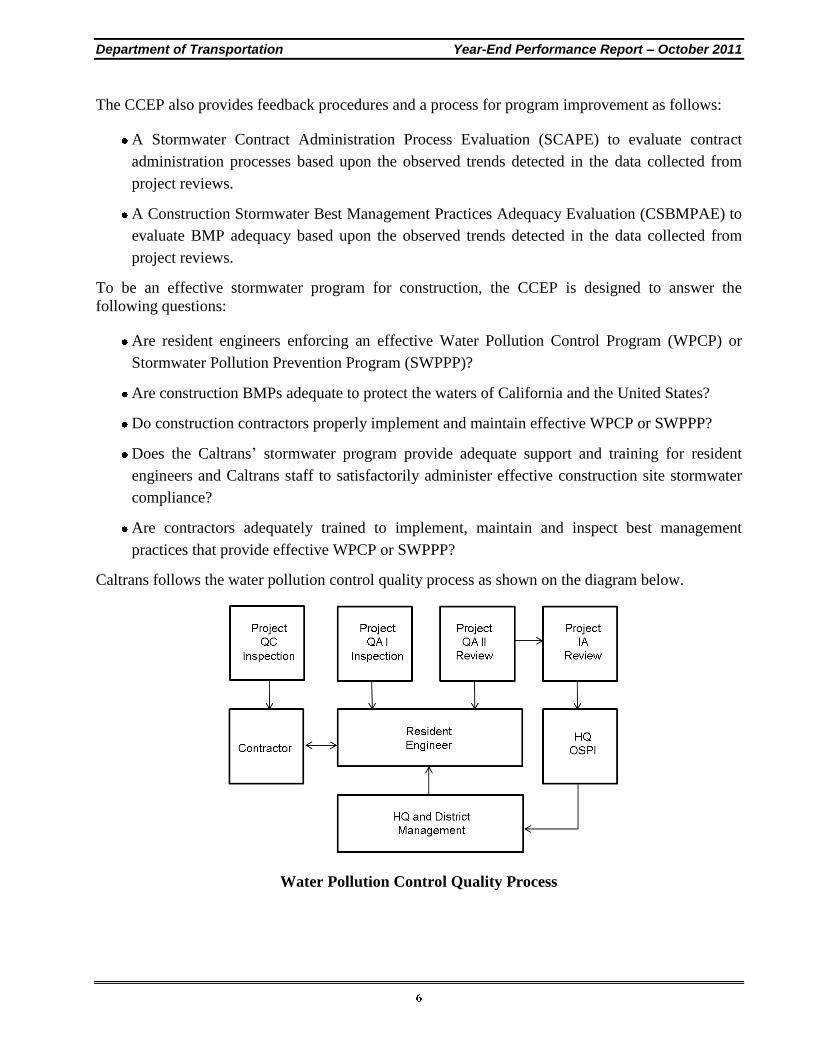
Caltrans follows the water pollution control quality process as shown on the diagram below.
Water Pollution Control Quality Process
Department of Transportation Year-End Performance Report – October 2011
QC: Quality Control inspection is done by the contractor.
QA I: Quality Assurance Level I inspection is done by the resident engineer or designee
(assistant resident engineer or construction inspector).
QA II: Quality Assurance Level II review is done by the district construction stormwater
coordinator (DCSWC) or designee.
IA: Independent Assurance review is done under the direction of Division of
Environmental Analysis, Stormwater IA Reviewer.
This Year-End Performance Report includes the following information:
Description of the project selection criteria and rating system used to conduct compliance
inspections during the reporting period. See Section 2.0 – Elements of Construction
Compliance Evaluation Plan.
Summary of overall ratings from the current reporting period compared with ratings from
previous years. See Section 3.0 – Performance Assessment.
Summary of BMP performance trends from the current reporting period compared with ratings
from the 2008/2009 and 2009/2010 reporting period. See Section 4.0 – Trends.
2.0 ELEMENTS OF CONSTRUCTION COMPLIANCE EVALUATION PLAN
The following elements form the basis of the CCEP:
Review of the level of compliance of selected construction projects with the requirements of
the NPDES Construction General Permit (Permit No. CAS000002) or applicable Lahonton
Regional Water Quality Control Board (RWQCB) permit, the Caltrans Statewide NPDES
Permit (NPDES No. CAS000003), and the statewide SWMP.
Review of the level of compliance of selected construction projects with the contract
specifications and guidance documents (project stormwater contract administration).
Identify sources, and causes of observed inadequacies.
Apply the process for evaluating trends.
Evaluate effectiveness of the stormwater program for construction.
Recommend program improvements, including SWMP improvements, training, research,
updates to guidance documents, updates to specifications, and updates to the CCEP.
Department of Transportation Year-End Performance Report – October 2011
2.1 CONSTRUCTION PROJECT STORMWATER REVIEW RATING CRITERIA
The review of construction project stormwater control effectiveness conducted by using two separate
rating criteria:
Water Quality Compliance
Stormwater Contract Administration
The water quality compliance rating is numerical beginning with number one (1) representing
compliance and going to number four (4) representing noncompliance. The water quality
compliance rating is an assessment of BMP adequacy. If BMPs are found to be inadequate, a
secondary level of analysis is done to confirm if a potential threat to water quality exists. This
assessment is referred to as “The Test for Potential Threat to Water Quality,” or simply, threat to
water quality.
The numeric component of the rating represents the potential threat to water quality in terms of
implementation and maintenance of construction site BMPs on a project. The water quality
compliance rating could be affected by different factors such as percentage of inadequate BMPs or
when a precipitation event is forecasted.
Stormwater contract administration is assessed based on the existence of contract required
documentation, amendments to the same, timely review and approval of document submittals and
processing requirements. The stormwater contract administration rating goes from A for compliance
to D for noncompliance. This alpha rating represents compliance with the permits and the quality of
stormwater contract administrative activities in accordance with contract specifications and guidance
documents.
Checklists have been designed to evaluate the adequacy of BMPs and to determine if the
implemented BMPs eliminate or minimize stormwater runoff pollution. The checklists are submitted
in the automated process called the Construction Project Stormwater Review Tool. It processes
information gathered in the checklists and generates a rating and a report form.
The CCEP rating criteria are summarized below. Refer to the CCEP for additional detail.
1 Rating
The project poses no threat to water quality, and review observations support the following criteria:
Temporary soil stabilization and sediment control BMPs are implemented in accordance with
the project’s SWPPP or WPCP requirements, rainy season, non-rainy season, active and non-
active areas.
Wind erosion BMPs are properly implemented.
Sediment tracking is minimal to non-existent.
Department of Transportation Year-End Performance Report – October 2011
Non-stormwater and waste management BMPs are properly implemented.
Treatment control(s) for dewatering operations meet(s) the requirements of the project’s
dewatering permit and/or dewatering plan.
It is not expected that construction sites will reflect 100 percent compliance at all times. However, it
is recognized construction methods and operations are dynamic in nature and project sites are subject
to occasional occurrences of less than the expected level of compliance. Therefore, the CCEP
assigns a rating of 1 for projects:
Having less than 10 percent inadequate BMPs due to:
1. Missing BMP
2. Improper location
3. Incorrect installation
4. Lack of maintenance
5. Improper selection
Less than 30 percent chance of precipitation within 48 hours
2 Rating
The project poses no threat to water quality and review observations support the following criteria:
Between 20 to 50 percent of the BMPs are inadequate based on:
1. Missing BMP
2. Improper location
3. Incorrect installation
4. Lack of maintenance
5. Improper selection
3 Rating
The project poses a potential threat to water quality and review observations support the following
criteria:
At least 50 percent of the BMPs are inadequate based on:
Missing BMP
Improper location
Incorrect installation
Lack of maintenance
Department of Transportation Year-End Performance Report – October 2011
Improper selection
Projects receiving a rating of 2 will be downgraded to a rating of 3 when all of the following apply:
The threat to water quality assessment identifies a potential threat to the quality of receiving
water.
At the time of review there is a greater than or equal to a 30 percent chance of rain within the
next 48 hours.
There is no evidence the contractor is actively mobilizing resources and materials to protect the
site.
4 Rating
The project poses a threat to water quality or has a high risk of posing a threat to water quality and
the review observations support the following criteria:
Uncontrolled discharge
Evidence of uncontrolled discharge
Projects receiving a rating of 2 or 3 will be downgraded to a rating of 4 if all of the following apply:
The assessment identifies a potential threat to the quality of receiving water:
There is a greater than or equal to 50 percent chance of rain within the next 24 hours at the
time of review, and;
The contractor is not actively implementing water pollution control practices where appropriate
before precipitation or a failure of a water pollution control practice is not corrected before
precipitation.
A Rating
A project is assigned an A rating when there are no project document inadequacies and the review of
project documentation supports each of the following:
The approved SWPPP or WPCP appropriately addresses current operations.
SWPPP or WPCP or amendments are on file and signed.
Site inspections by the contractor are conducted in accordance with expected frequencies.
Site inspections by project staff are conducted in accordance with expected frequencies.
Sampling and analysis plans as required have been properly documented, filed, and reflect
current field conditions.
Sampling results have been properly logged and are up to date.
Department of Transportation Year-End Performance Report – October 2011
If applicable, dewatering plan is approved by the RWQCB and is on file.
A record of a preconstruction meeting to review SWPPP or WPCP requirements is on file.
In addition to the above requirements, the A rating is still assigned to the project, when 20 percent or
less of certain contract Standard Specifications and Standard Special Provision requirements (if
applicable) are not met.
B Rating
A project is assigned a B rating when at least one of the A rating project document inadequacies is
documented or when 20 percent to 50 percent of A rating contract specification requirements are not
met.
The approved SWPPP or WPCP does not reflect current operations and amending of the
document is needed.
SWPPP or WPCP or amendment (s) are not on file or signed.
On file documentation of site inspections performed by the contractor are not up to date.
On file documentation of site inspections performed by project staff are not up to date.
Contractor’s yard, staging area, material or waste storage sites directly related to the project are
not addressed in the SWPPP or WPCP.
The contractor does not have a copy of the SWPPP or WPCP on site.
A record of the preconstruction meeting to review SWPPP or WPCP requirements is not on
file.
C Rating
There are project documentation inadequacies that require immediate correction. The project
receives a C rating when four or fewer of the following are documented or between 50 percent and
80 percent of the contract specification requirements are not met.
SWPPP or WPCP or amendments are not on file or signed. Annual recertification of the
project SWPPP is not on file or signed.
File documentation of site inspections performed by the contractor do not support the contract
specified minimum frequency.
Expansion beyond the contract specified limit for active disturbed soil areas without resident
engineer’s written approval.
Sampling was conducted but proper documentation is not on file.
A required dewatering plan has not been submitted or approved.
Department of Transportation Year-End Performance Report – October 2011
D Rating
A project receives a D rating when at least one of the following conditions exists:
Work started without an R.E.-approved or conditionally approved SWPPP or WPCP.
A Notice of Discharge not submitted to the RWQCB within 14 days when required.
When more than four items under a C rating are observed.
When 80 percent or more of the contract specification requirements are not met.
2.2 PROJECT SELECTION
Caltrans has decided that the number of projects to be reviewed will be at a level that will result in a
95 percent confidence in conclusions drawn from the information collected. The number of projects
to be reviewed for the 95 percent confidence level will be determined in accordance with Appendix
B of the CCEP, “Project Selection Process.”
Caltrans will review WPCP and SWPPP projects based on a random selection from projects listed in
the Caltrans’ Statement of Going Contracts. Projects will be randomly selected by the Caltrans’
Division of Environmental Analysis, Office of Stormwater Program Implementation (OSPI).
2.3 CONSTRUCTION PROJECT STORMWATER REVIEW PLAN
The purpose of the Construction Project Stormwater Review Plan (CPSRP) is to have a formalized
procedure for the Quality Assurance level II review component of the water pollution control quality
process. The goal of the CPSRP is to document a project’s impact on receiving water quality and to
evaluate the administration of construction contract provisions related to stormwater runoff
management.
The CPSRP provides a process for review of the selected construction projects using special review
rating criteria.” The CPSRP lists the step-by-step procedures for reviewing implemented BMPs and
documenting observed inadequacies.
The District construction stormwater coordinator (DCSWC) or a designee is responsible for
arranging and conducting project compliance reviews.
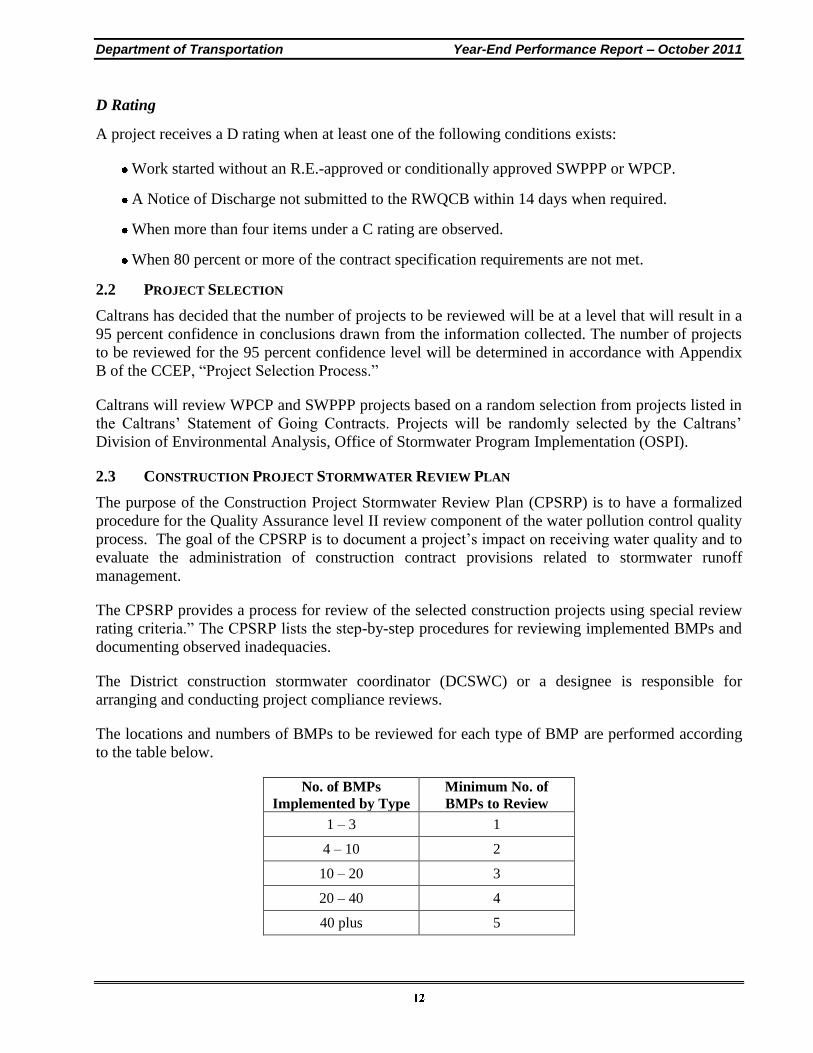
The locations and numbers of BMPs to be reviewed for each type of BMP are performed according
to the table below.
No. of BMPs
Implemented by Type Minimum No. of
BMPs to Review
1 – 3 1
4 – 10 2
10 – 20 3
20 – 40 4
40 plus 5
Department of Transportation Year-End Performance Report – October 2011
The field review focuses on the proper implementation and maintenance of BMPs and the potential
impact on receiving water quality from construction activities. The participants must include:
resident engineer or a designee, and may include the contractor’s water pollution control manager or
designee.
2.4 CONSTRUCTION COMPLIANCE EVALUATION PLAN –INDEPENDENT ASSURANCE
PROCEDURE
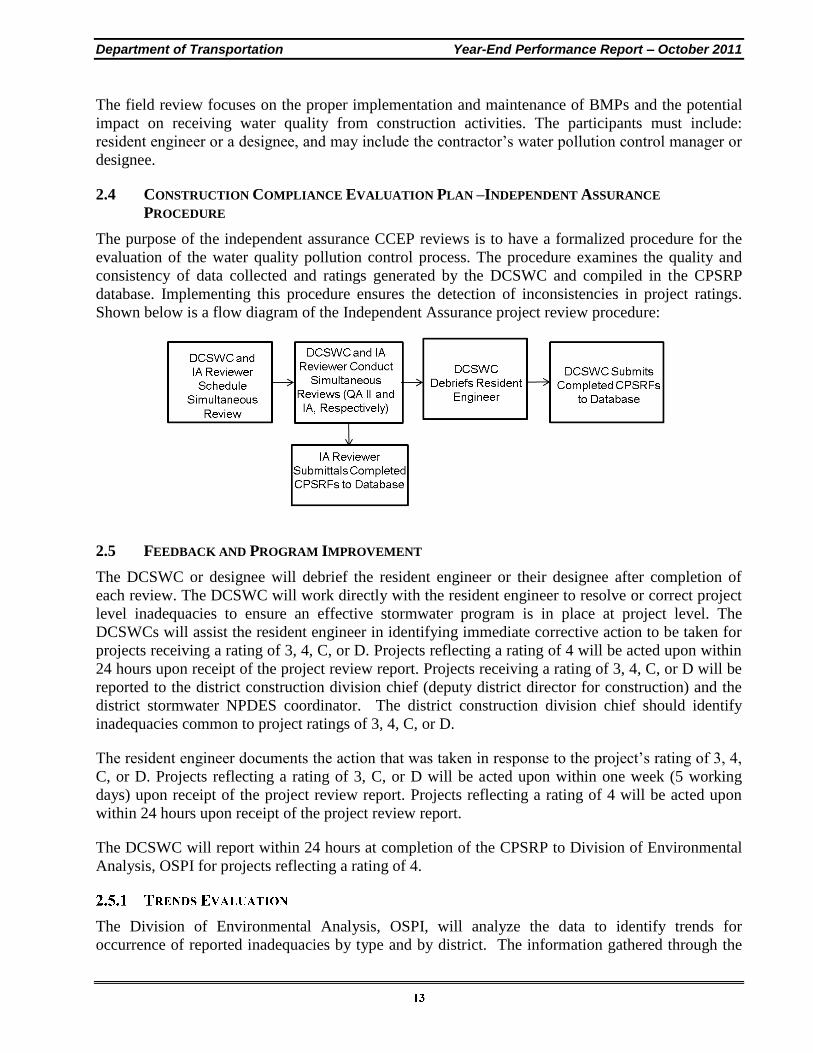
The purpose of the independent assurance CCEP reviews is to have a formalized procedure for the
evaluation of the water quality pollution control process. The procedure examines the quality and
consistency of data collected and ratings generated by the DCSWC and compiled in the CPSRP
database. Implementing this procedure ensures the detection of inconsistencies in project ratings.
Shown below is a flow diagram of the Independent Assurance project review procedure:
2.5 FEEDBACK AND PROGRAM IMPROVEMENT
The DCSWC or designee will debrief the resident engineer or their designee after completion of
each review. The DCSWC will work directly with the resident engineer to resolve or correct project
level inadequacies to ensure an effective stormwater program is in place at project level. The
DCSWCs will assist the resident engineer in identifying immediate corrective action to be taken for
projects receiving a rating of 3, 4, C, or D. Projects reflecting a rating of 4 will be acted upon within
24 hours upon receipt of the project review report. Projects receiving a rating of 3, 4, C, or D will be
reported to the district construction division chief (deputy district director for construction) and the
district stormwater NPDES coordinator. The district construction division chief should identify
inadequacies common to project ratings of 3, 4, C, or D.
The resident engineer documents the action that was taken in response to the project’s rating of 3, 4,
C, or D. Projects reflecting a rating of 3, C, or D will be acted upon within one week (5 working
days) upon receipt of the project review report. Projects reflecting a rating of 4 will be acted upon
within 24 hours upon receipt of the project review report.
The DCSWC will report within 24 hours at completion of the CPSRP to Division of Environmental
Analysis, OSPI for projects reflecting a rating of 4.
The Division of Environmental Analysis, OSPI, will analyze the data to identify trends for
occurrence of reported inadequacies by type and by district. The information gathered through the
Department of Transportation Year-End Performance Report – October 2011
CSBMPAE and SCAPE will identify the source(s) and cause(s) for inadequacies and will provide a
solid basis for redirecting or refining stormwater program for construction activities. The
information gathered will also provide critical data about strengths and weaknesses of the
stormwater program for construction, current and future resource needs to administer an effective
and stable program.
3.0 PERFORMANCE ASSESSMENT
This section presents the overall site ratings for the projects reviewed according to the CCEP
protocol implemented beginning on July 1, 2008. These Quality Assurance Level II (QAII) reviews
were conducted by the DCSWC according to CCEP protocol. The combined numeric/alphabetic
criteria are presented first, followed by overall performance of numeric BMP ranking (1 to 4) and
Alpha-BMPs ranking (A to D).
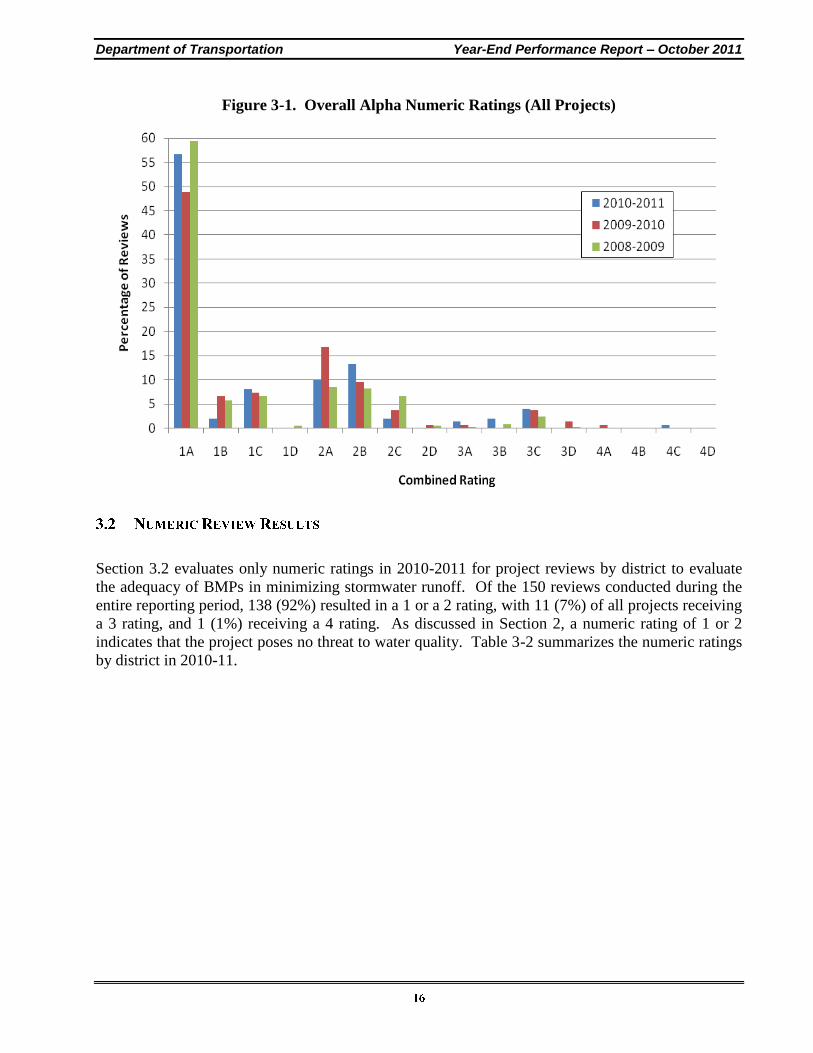
Figure 3-1 presents a summary of the combined review results for the first three years of the CCEP.
Construction site reviews were conducted state-wide from July 1, 2008 to June 30, 2009,
July 1, 2009 to June 30, 2010 and July 1, 2010 to June 30, 2011.
In 2008-09, a total of 365 reviews were conducted. In 2009-10 and 2010-2011, fewer reviews (137
and 150, respectively) were conducted. Some construction sites were reviewed more than once
during each year, as follows:
2008-2009 – 365 reviews conducted at 120 construction sites
2009-2010 – 137 reviews conducted at 118 construction sites
2010-2011 – 150 reviews conducted at 145 construction sites
More than 82% of all project reviews were rated 1A, 1B, 2A, 2B in all three years.
Department of Transportation Year-End Performance Report – October 2011
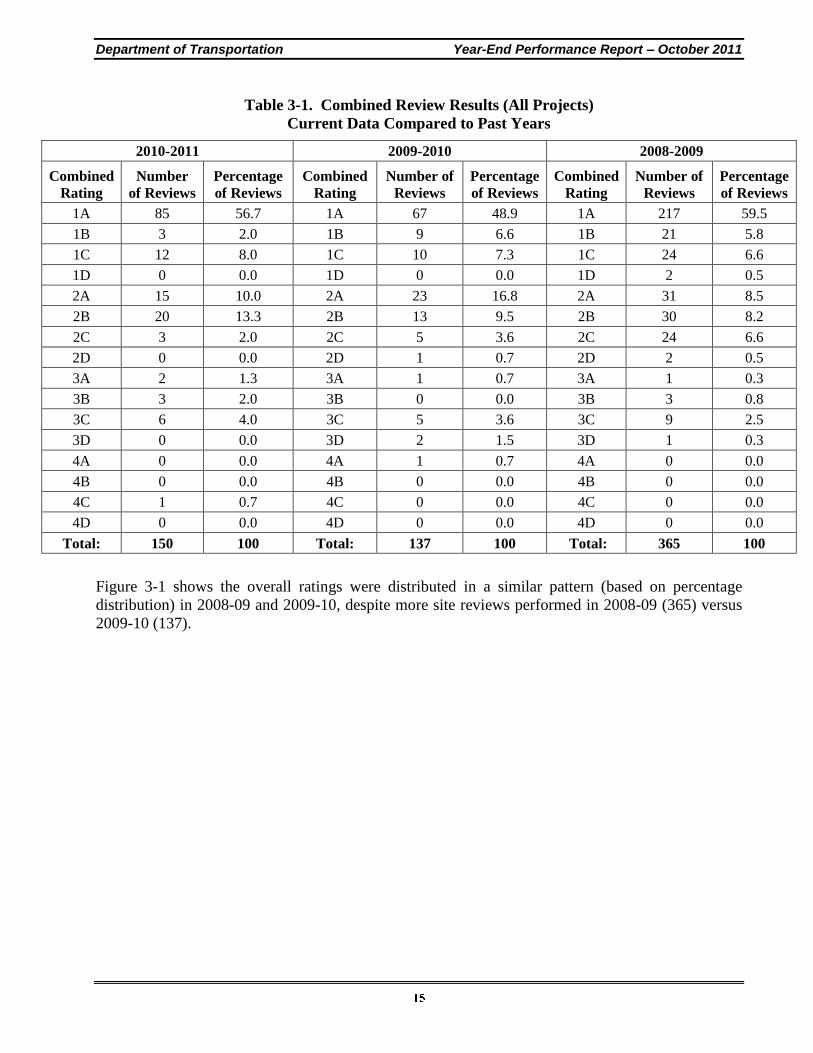
Table 3-1. Combined Review Results (All Projects)
Current Data Compared to Past Years
2010-2011 2009-2010 2008-2009
Combined
Rating
Number
of Reviews
Percentage
of Reviews
Combined
Rating
Number of
Reviews
Percentage
of Reviews
Combined
Rating
Number of
Reviews
Percentage
of Reviews
1A 85 56.7 1A 67 48.9 1A 217 59.5
1B 3 2.0 1B 9 6.6 1B 21 5.8
1C 12 8.0 1C 10 7.3 1C 24 6.6
1D 0 0.0 1D 0 0.0 1D 2 0.5
2A 15 10.0 2A 23 16.8 2A 31 8.5
2B 20 13.3 2B 13 9.5 2B 30 8.2
2C 3 2.0 2C 5 3.6 2C 24 6.6
2D 0 0.0 2D 1 0.7 2D 2 0.5
3A 2 1.3 3A 1 0.7 3A 1 0.3
3B 3 2.0 3B 0 0.0 3B 3 0.8
3C 6 4.0 3C 5 3.6 3C 9 2.5
3D 0 0.0 3D 2 1.5 3D 1 0.3
4A 0 0.0 4A 1 0.7 4A 0 0.0
4B 0 0.0 4B 0 0.0 4B 0 0.0
4C 1 0.7 4C 0 0.0 4C 0 0.0
4D 0 0.0 4D 0 0.0 4D 0 0.0
Total: 150 100 Total: 137 100 Total: 365 100
Figure 3-1 shows the overall ratings were distributed in a similar pattern (based on percentage
distribution) in 2008-09 and 2009-10, despite more site reviews performed in 2008-09 (365) versus
2009-10 (137).
Department of Transportation Year-End Performance Report – October 2011
Figure 3-1. Overall Alpha Numeric Ratings (All Projects)
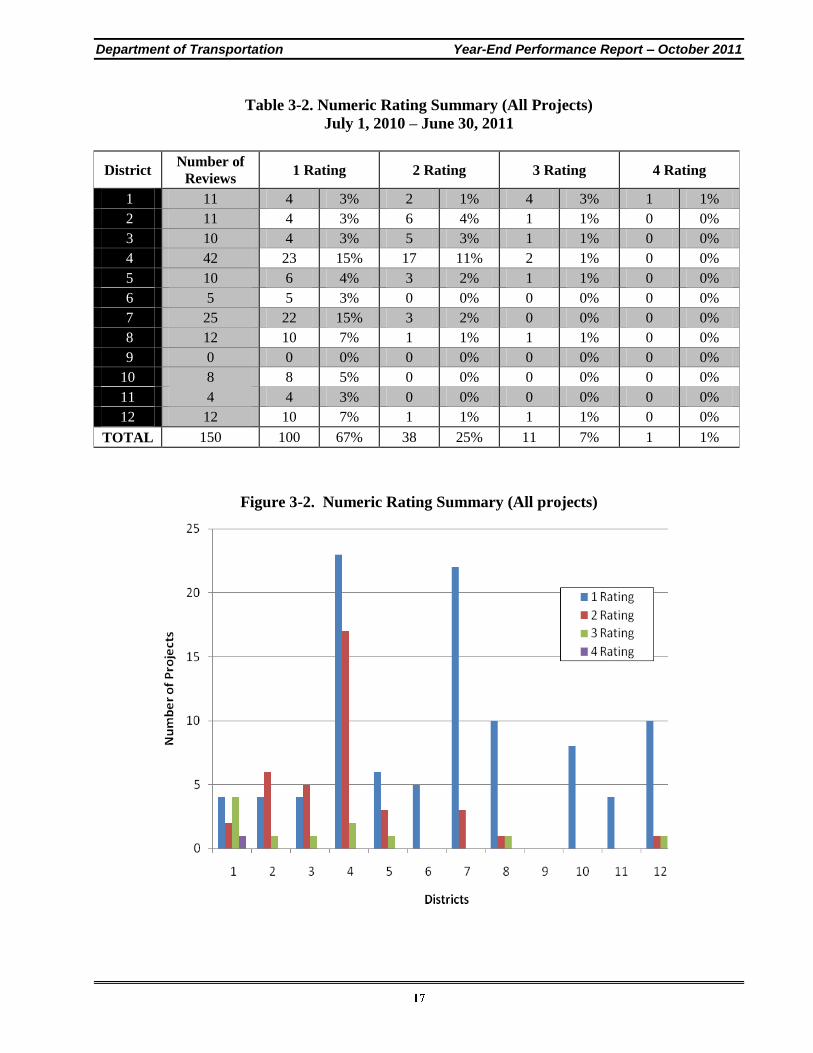
Section 3.2 evaluates only numeric ratings in 2010-2011 for project reviews by district to evaluate
the adequacy of BMPs in minimizing stormwater runoff. Of the 150 reviews conducted during the
entire reporting period, 138 (92%) resulted in a 1 or a 2 rating, with 11 (7%) of all projects receiving
a 3 rating, and 1 (1%) receiving a 4 rating. As discussed in Section 2, a numeric rating of 1 or 2
indicates that the project poses no threat to water quality. Table 3-2 summarizes the numeric ratings
by district in 2010-11.
Department of Transportation Year-End Performance Report – October 2011
Table 3-2. Numeric Rating Summary (All Projects)
July 1, 2010 – June 30, 2011
District Number of
Reviews 1 Rating 2 Rating 3 Rating 4 Rating
1 11 4 3% 2 1% 4 3% 1 1%
2 11 4 3% 6 4% 1 1% 0 0%
3 10 4 3% 5 3% 1 1% 0 0%
4 42 23 15% 17 11% 2 1% 0 0%
5 10 6 4% 3 2% 1 1% 0 0%
6 5 5 3% 0 0% 0 0% 0 0%
7 25 22 15% 3 2% 0 0% 0 0%
8 12 10 7% 1 1% 1 1% 0 0%
9 0 0 0% 0 0% 0 0% 0 0%
10 8 8 5% 0 0% 0 0% 0 0%
11 4 4 3% 0 0% 0 0% 0 0%
12 12 10 7% 1 1% 1 1% 0 0%
TOTAL 150 100 67% 38 25% 11 7% 1 1%
Figure 3-2. Numeric Rating Summary (All projects)
Department of Transportation Year-End Performance Report – October 2011
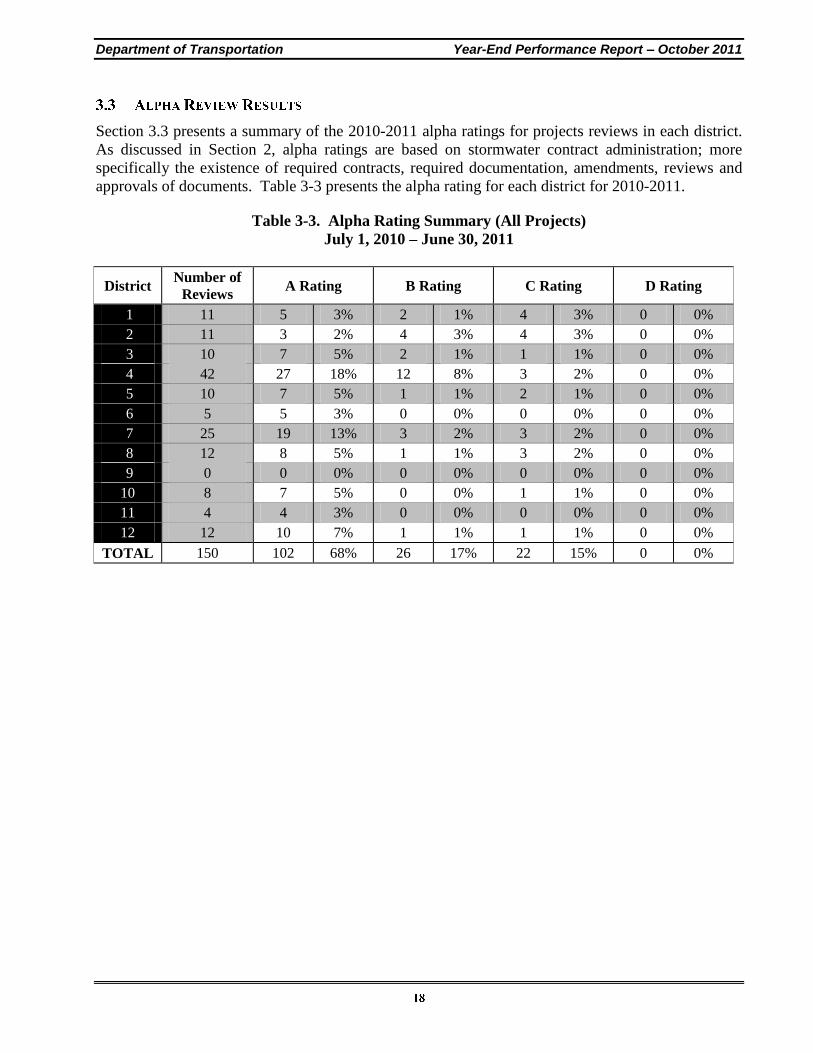
Section 3.3 presents a summary of the 2010-2011 alpha ratings for projects reviews in each district.
As discussed in Section 2, alpha ratings are based on stormwater contract administration; more
specifically the existence of required contracts, required documentation, amendments, reviews and
approvals of documents. Table 3-3 presents the alpha rating for each district for 2010-2011.
Table 3-3. Alpha Rating Summary (All Projects)
July 1, 2010 – June 30, 2011
District Number of
Reviews A Rating B Rating C Rating D Rating
1 11 5 3% 2 1% 4 3% 0 0%
2 11 3 2% 4 3% 4 3% 0 0%
3 10 7 5% 2 1% 1 1% 0 0%
4 42 27 18% 12 8% 3 2% 0 0%
5 10 7 5% 1 1% 2 1% 0 0%
6 5 5 3% 0 0% 0 0% 0 0%
7 25 19 13% 3 2% 3 2% 0 0%
8 12 8 5% 1 1% 3 2% 0 0%
9 0 0 0% 0 0% 0 0% 0 0%
10 8 7 5% 0 0% 1 1% 0 0%
11 4 4 3% 0 0% 0 0% 0 0%
12 12 10 7% 1 1% 1 1% 0 0%
TOTAL 150 102 68% 26 17% 22 15% 0 0%
Department of Transportation Year-End Performance Report – October 2011
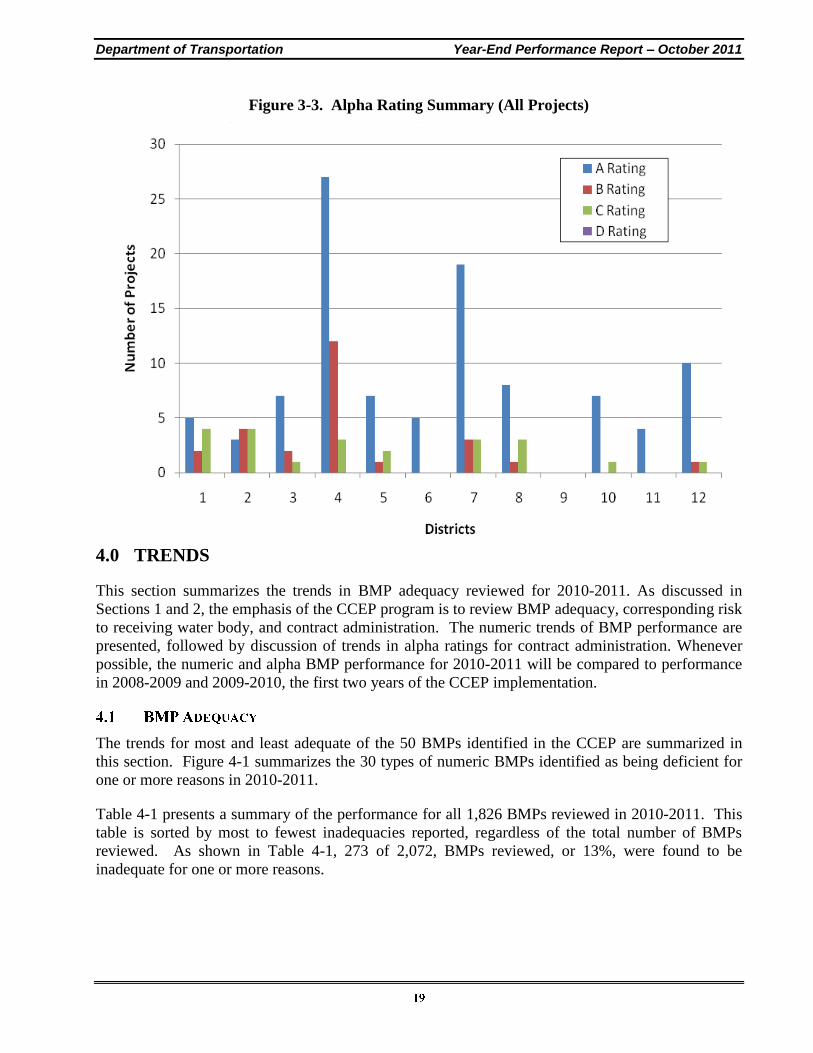
Figure 3-3. Alpha Rating Summary (All Projects)
4.0 TRENDS
This section summarizes the trends in BMP adequacy reviewed for 2010-2011. As discussed in
Sections 1 and 2, the emphasis of the CCEP program is to review BMP adequacy, corresponding risk
to receiving water body, and contract administration. The numeric trends of BMP performance are
presented, followed by discussion of trends in alpha ratings for contract administration. Whenever
possible, the numeric and alpha BMP performance for 2010-2011 will be compared to performance
in 2008-2009 and 2009-2010, the first two years of the CCEP implementation.
The trends for most and least adequate of the 50 BMPs identified in the CCEP are summarized in
this section. Figure 4-1 summarizes the 30 types of numeric BMPs identified as being deficient for
one or more reasons in 2010-2011.
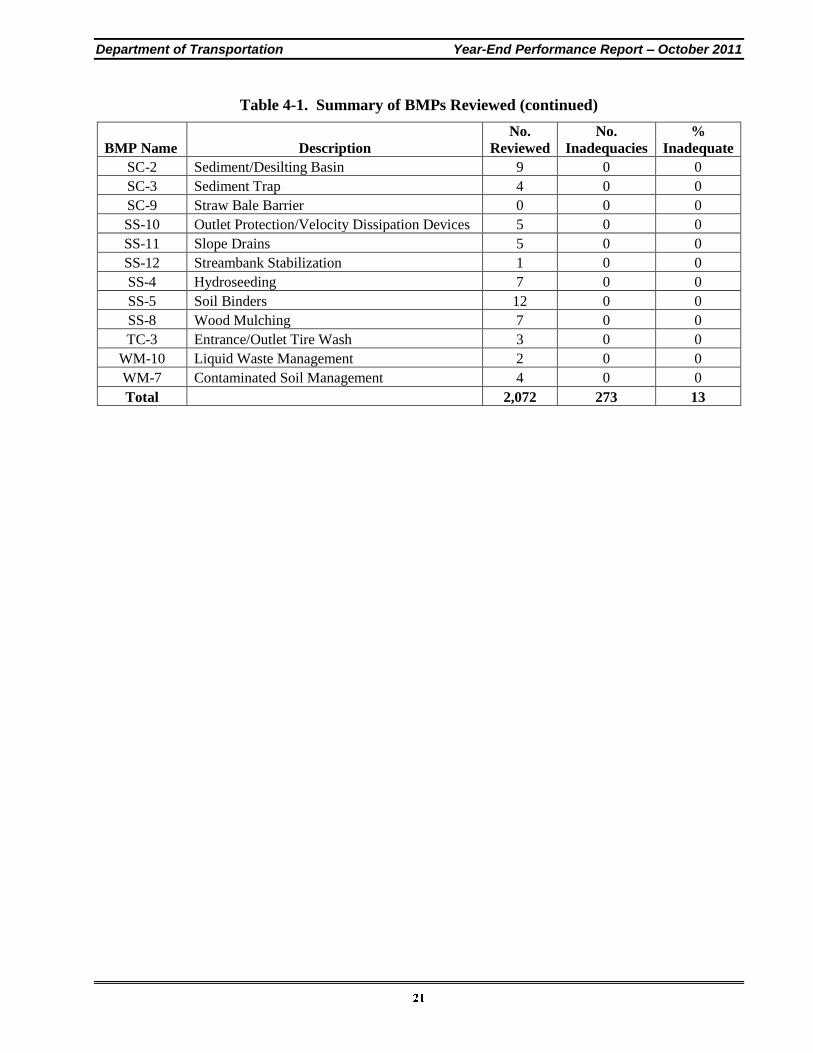
Table 4-1 presents a summary of the performance for all 1,826 BMPs reviewed in 2010-2011. This
table is sorted by most to fewest inadequacies reported, regardless of the total number of BMPs
reviewed. As shown in Table 4-1, 273 of 2,072, BMPs reviewed, or 13%, were found to be
inadequate for one or more reasons.
Department of Transportation Year-End Performance Report – October 2011
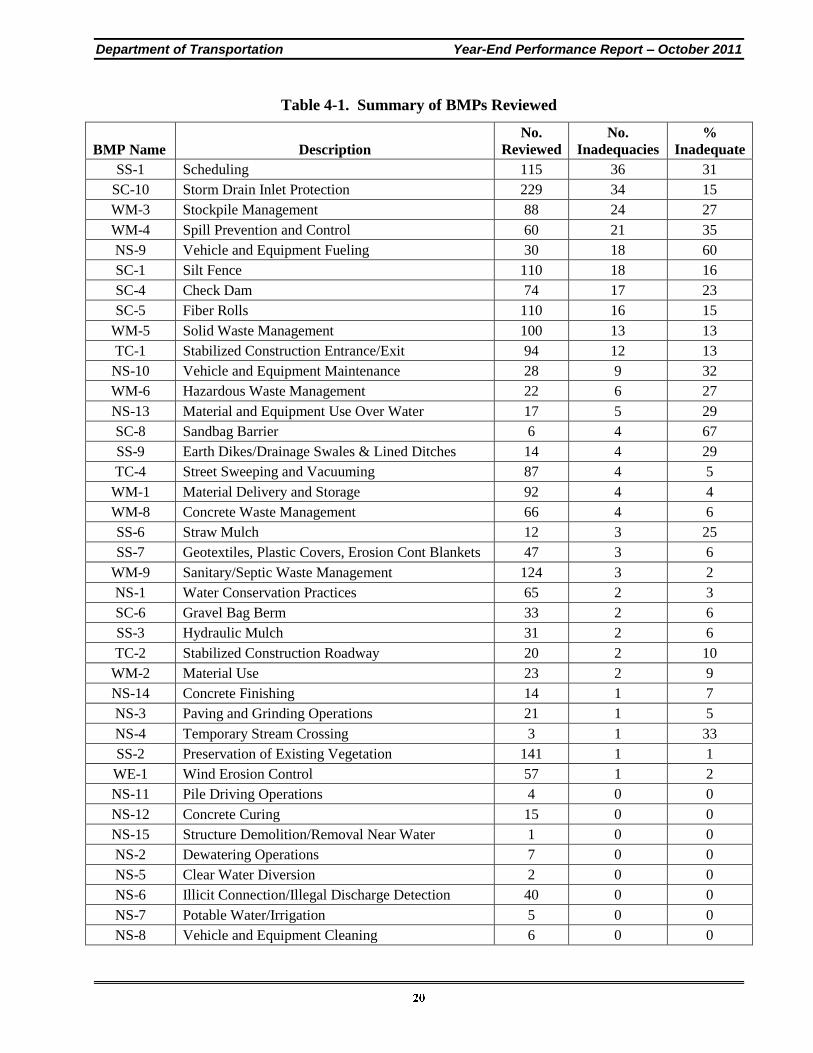
Table 4-1. Summary of BMPs Reviewed
BMP Name Description
No.
Reviewed
No.
Inadequacies
%
Inadequate
SS-1 Scheduling 115 36 31
SC-10 Storm Drain Inlet Protection 229 34 15
WM-3 Stockpile Management 88 24 27
WM-4 Spill Prevention and Control 60 21 35
NS-9 Vehicle and Equipment Fueling 30 18 60
SC-1 Silt Fence 110 18 16
SC-4 Check Dam 74 17 23
SC-5 Fiber Rolls 110 16 15
WM-5 Solid Waste Management 100 13 13
TC-1 Stabilized Construction Entrance/Exit 94 12 13
NS-10 Vehicle and Equipment Maintenance 28 9 32
WM-6 Hazardous Waste Management 22 6 27
NS-13 Material and Equipment Use Over Water 17 5 29
SC-8 Sandbag Barrier 6 4 67
SS-9 Earth Dikes/Drainage Swales & Lined Ditches 14 4 29
TC-4 Street Sweeping and Vacuuming 87 4 5
WM-1 Material Delivery and Storage 92 4 4
WM-8 Concrete Waste Management 66 4 6
SS-6 Straw Mulch 12 3 25
SS-7 Geotextiles, Plastic Covers, Erosion Cont Blankets 47 3 6
WM-9 Sanitary/Septic Waste Management 124 3 2
NS-1 Water Conservation Practices 65 2 3
SC-6 Gravel Bag Berm 33 2 6
SS-3 Hydraulic Mulch 31 2 6
TC-2 Stabilized Construction Roadway 20 2 10
WM-2 Material Use 23 2 9
NS-14 Concrete Finishing 14 1 7
NS-3 Paving and Grinding Operations 21 1 5
NS-4 Temporary Stream Crossing 3 1 33
SS-2 Preservation of Existing Vegetation 141 1 1
WE-1 Wind Erosion Control 57 1 2
NS-11 Pile Driving Operations 4 0 0
NS-12 Concrete Curing 15 0 0
NS-15 Structure Demolition/Removal Near Water 1 0 0
NS-2 Dewatering Operations 7 0 0
NS-5 Clear Water Diversion 2 0 0
NS-6 Illicit Connection/Illegal Discharge Detection 40 0 0
NS-7 Potable Water/Irrigation 5 0 0
NS-8 Vehicle and Equipment Cleaning 6 0 0
Department of Transportation Year-End Performance Report – October 2011
Table 4-1. Summary of BMPs Reviewed (continued)
BMP Name Description
No.
Reviewed
No.
Inadequacies
%
Inadequate
SC-2 Sediment/Desilting Basin 9 0 0
SC-3 Sediment Trap 4 0 0
SC-9 Straw Bale Barrier 0 0 0
SS-10 Outlet Protection/Velocity Dissipation Devices 5 0 0
SS-11 Slope Drains 5 0 0
SS-12 Streambank Stabilization 1 0 0
SS-4 Hydroseeding 7 0 0
SS-5 Soil Binders 12 0 0
SS-8 Wood Mulching 7 0 0
TC-3 Entrance/Outlet Tire Wash 3 0 0
WM-10 Liquid Waste Management 2 0 0
WM-7 Contaminated Soil Management 4 0 0
Total
2,072 273 13
Department of Transportation Year-End Performance Report – October 2011
Figure 4-1. BMPs – Sorted by Number of Inadequacies
Department of Transportation Year-End Performance Report – October 2011
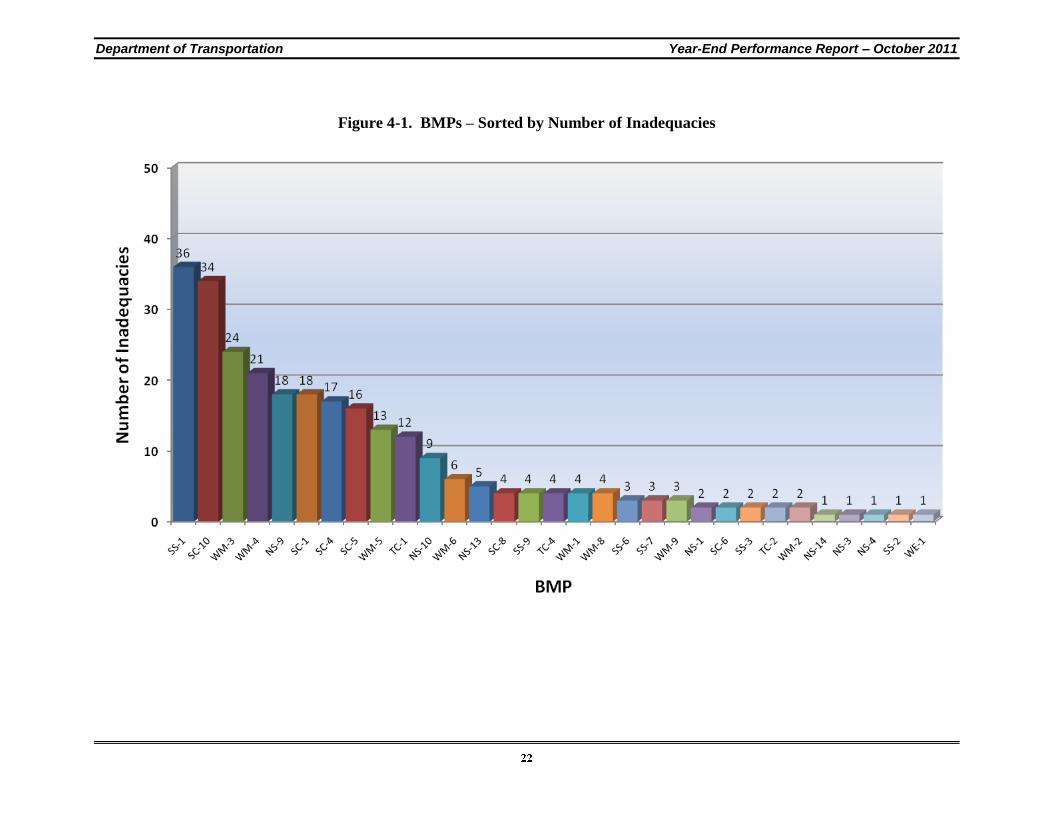
Figure 4-1 presents the number of inadequacies reported for all 50 BMPs in 2010-2011, sorted by
most to fewest inadequacies. Those BMPs with zero reported inadequacies in 2010-2011 are not
presented in Figure 4-1.
Analysis of Table 4-1 and Figure 4-1 provide the following trends:
Out of 2,072 BMPs reviewed, 273 BMPs, or 13%, were not properly implemented.
Scheduling and the next 10 numeric BMPs with the most reported inadequacies accounted for
218 of the 273 (80%) of the reported inadequacies in 2010-2011. A total of 55 inadequacies
were reported from the remaining 40 BMPs.
The highest numbers of inadequacies (36) were reported for scheduling (SS-1) and storm drain
inlet protection (SC-10), which also had 34 reported inadequacies.
Stockpile management (WM-3), spill prevention and control (WM-4), and vehicle and
equipment fueling (NS-9) had the second highest number of inadequacies (24, 21 and 18,
respectively). Silt fence (SC-1) also had 18. WM-4 is considered both in the numeric BMP
category and in the contract administration (Alpha rating) category.
Check dam (SC-4) had the third highest number of inadequacies, followed by fiber rolls and
solid waste management (WM-5).
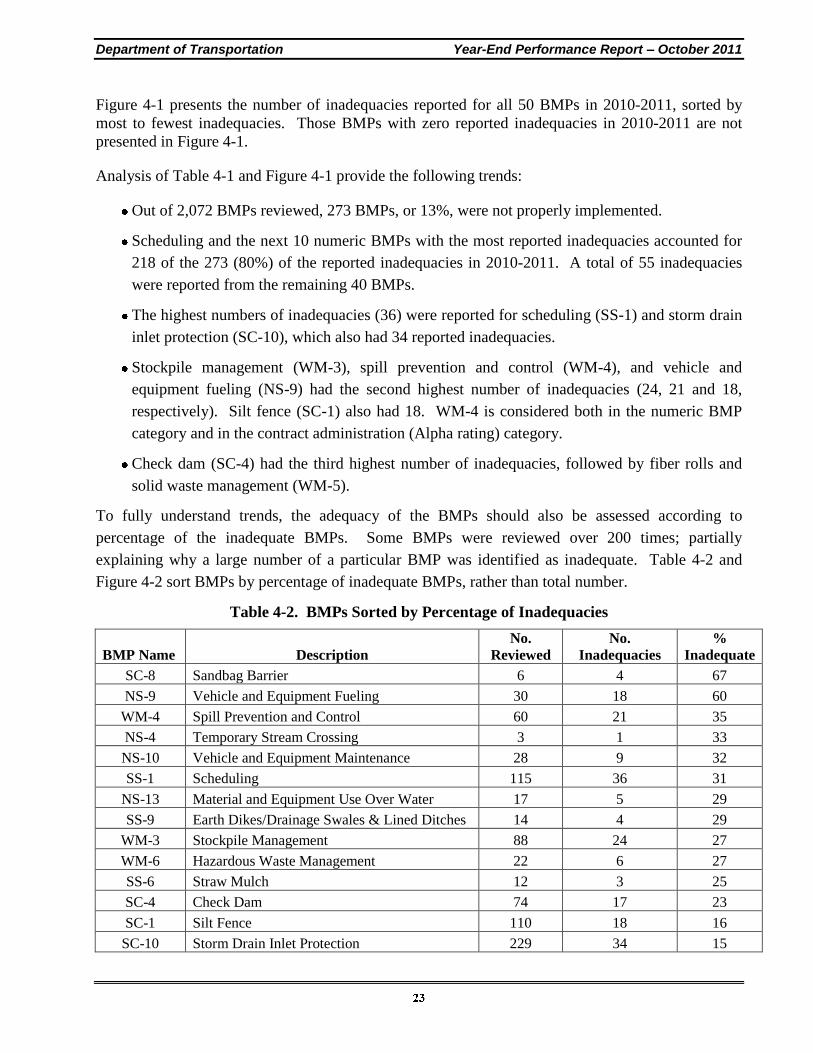
To fully understand trends, the adequacy of the BMPs should also be assessed according to
percentage of the inadequate BMPs. Some BMPs were reviewed over 200 times; partially
explaining why a large number of a particular BMP was identified as inadequate. Table 4-2 and
Figure 4-2 sort BMPs by percentage of inadequate BMPs, rather than total number.
Table 4-2. BMPs Sorted by Percentage of Inadequacies
BMP Name Description
No.
Reviewed
No.
Inadequacies
%
Inadequate
SC-8 Sandbag Barrier 6 4 67
NS-9 Vehicle and Equipment Fueling 30 18 60
WM-4 Spill Prevention and Control 60 21 35
NS-4 Temporary Stream Crossing 3 1 33
NS-10 Vehicle and Equipment Maintenance 28 9 32
SS-1 Scheduling 115 36 31
NS-13 Material and Equipment Use Over Water 17 5 29
SS-9 Earth Dikes/Drainage Swales & Lined Ditches 14 4 29
WM-3 Stockpile Management 88 24 27
WM-6 Hazardous Waste Management 22 6 27
SS-6 Straw Mulch 12 3 25
SC-4 Check Dam 74 17 23
SC-1 Silt Fence 110 18 16
SC-10 Storm Drain Inlet Protection 229 34 15
Department of Transportation Year-End Performance Report – October 2011
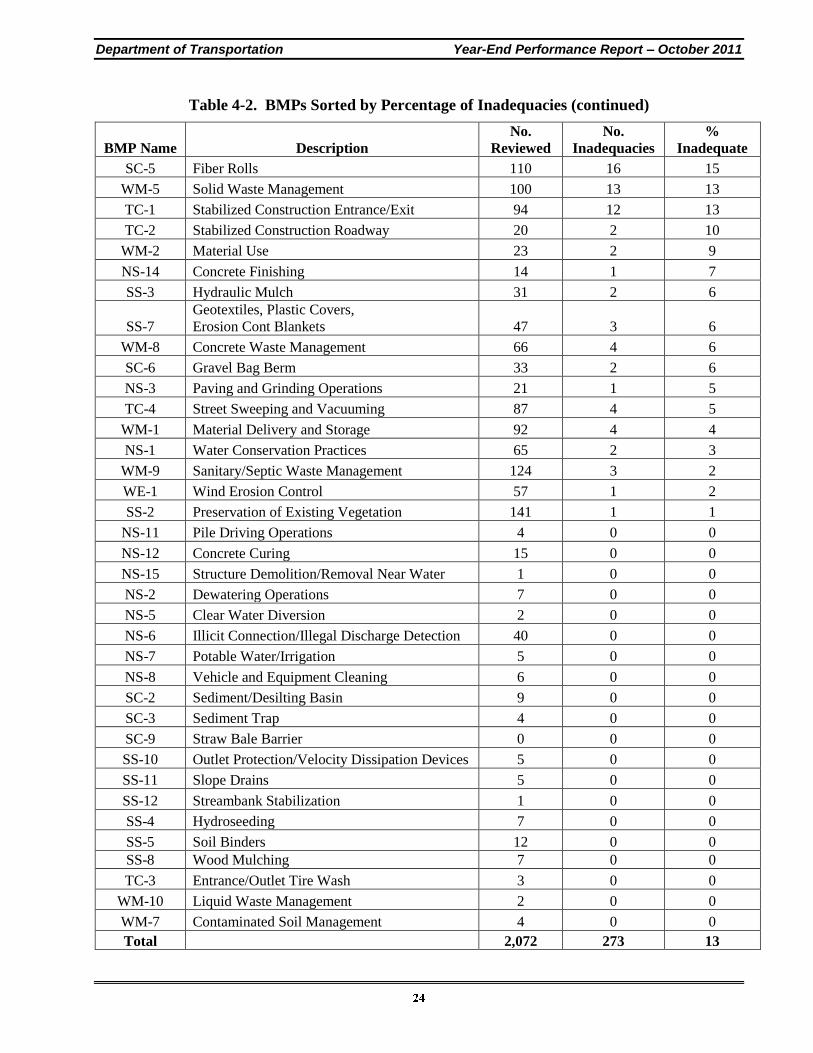
Table 4-2. BMPs Sorted by Percentage of Inadequacies (continued)
BMP Name Description
No.
Reviewed
No.
Inadequacies
%
Inadequate
SC-5 Fiber Rolls 110 16 15
WM-5 Solid Waste Management 100 13 13
TC-1 Stabilized Construction Entrance/Exit 94 12 13
TC-2 Stabilized Construction Roadway 20 2 10
WM-2 Material Use 23 2 9
NS-14 Concrete Finishing 14 1 7
SS-3 Hydraulic Mulch 31 2 6
SS-7
Geotextiles, Plastic Covers,
Erosion Cont Blankets 47 3 6
WM-8 Concrete Waste Management 66 4 6
SC-6 Gravel Bag Berm 33 2 6
NS-3 Paving and Grinding Operations 21 1 5
TC-4 Street Sweeping and Vacuuming 87 4 5
WM-1 Material Delivery and Storage 92 4 4
NS-1 Water Conservation Practices 65 2 3
WM-9 Sanitary/Septic Waste Management 124 3 2
WE-1 Wind Erosion Control 57 1 2
SS-2 Preservation of Existing Vegetation 141 1 1
NS-11 Pile Driving Operations 4 0 0
NS-12 Concrete Curing 15 0 0
NS-15 Structure Demolition/Removal Near Water 1 0 0
NS-2 Dewatering Operations 7 0 0
NS-5 Clear Water Diversion 2 0 0
NS-6 Illicit Connection/Illegal Discharge Detection 40 0 0
NS-7 Potable Water/Irrigation 5 0 0
NS-8 Vehicle and Equipment Cleaning 6 0 0
SC-2 Sediment/Desilting Basin 9 0 0
SC-3 Sediment Trap 4 0 0
SC-9 Straw Bale Barrier 0 0 0
SS-10 Outlet Protection/Velocity Dissipation Devices 5 0 0
SS-11 Slope Drains 5 0 0
SS-12 Streambank Stabilization 1 0 0
SS-4 Hydroseeding 7 0 0
SS-5 Soil Binders 12 0 0
SS-8 Wood Mulching 7 0 0
TC-3 Entrance/Outlet Tire Wash 3 0 0
WM-10 Liquid Waste Management 2 0 0
WM-7 Contaminated Soil Management 4 0 0
Total
2,072 273 13
Department of Transportation Year-End Performance Report – October 2011
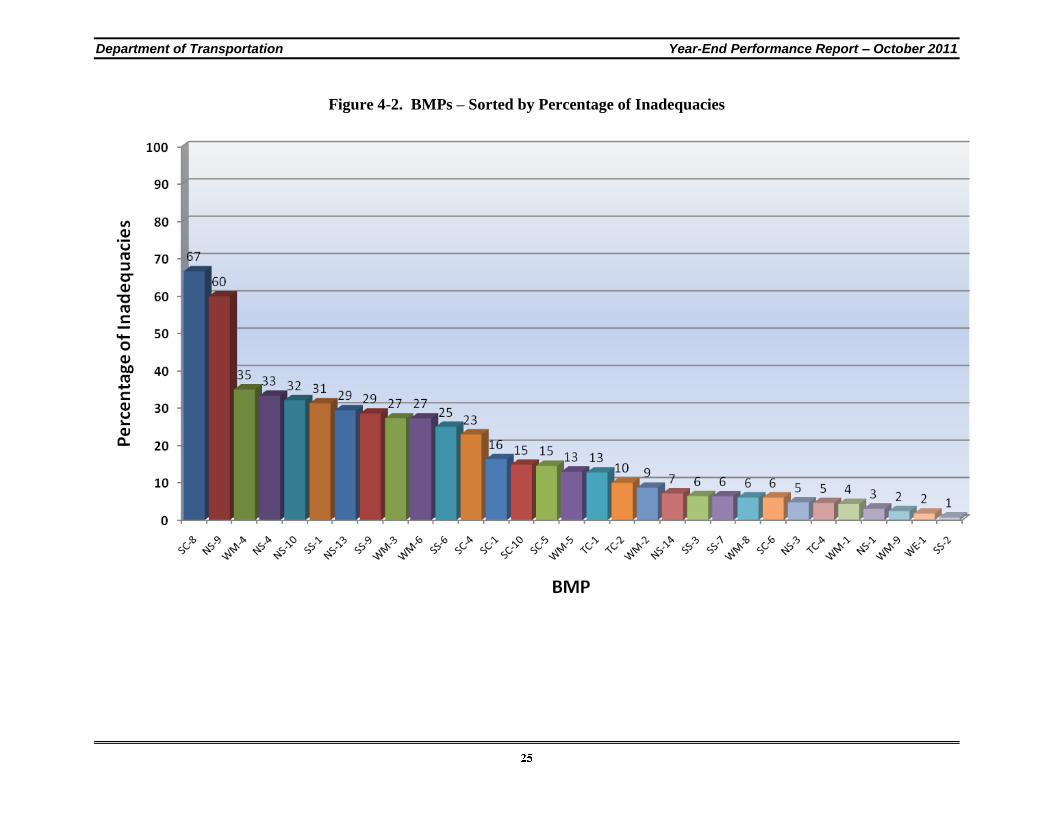
Figure 4-2. BMPs – Sorted by Percentage of Inadequacies
Department of Transportation Year-End Performance Report – October 2011
Analysis of Table 4-2 and Figure 4-2 provide the following trends for numeric BMPs in 2010-
2011:
67% of the 6 sandbag barriers (SC-8) BMPs were identified as inadequate.
60% of the 30 vehicle and equipment fueling (NS-9) BMPs were identified as inadequate.
12 of 51 total BMPs reported higher than the average percentage (13%) inadequacies.
39 of 50 numeric BMPs reported lower than average percentage (13%) inadequacies. Of
these 39 BMPs, 20 BMPs had 0% reported inadequacies.
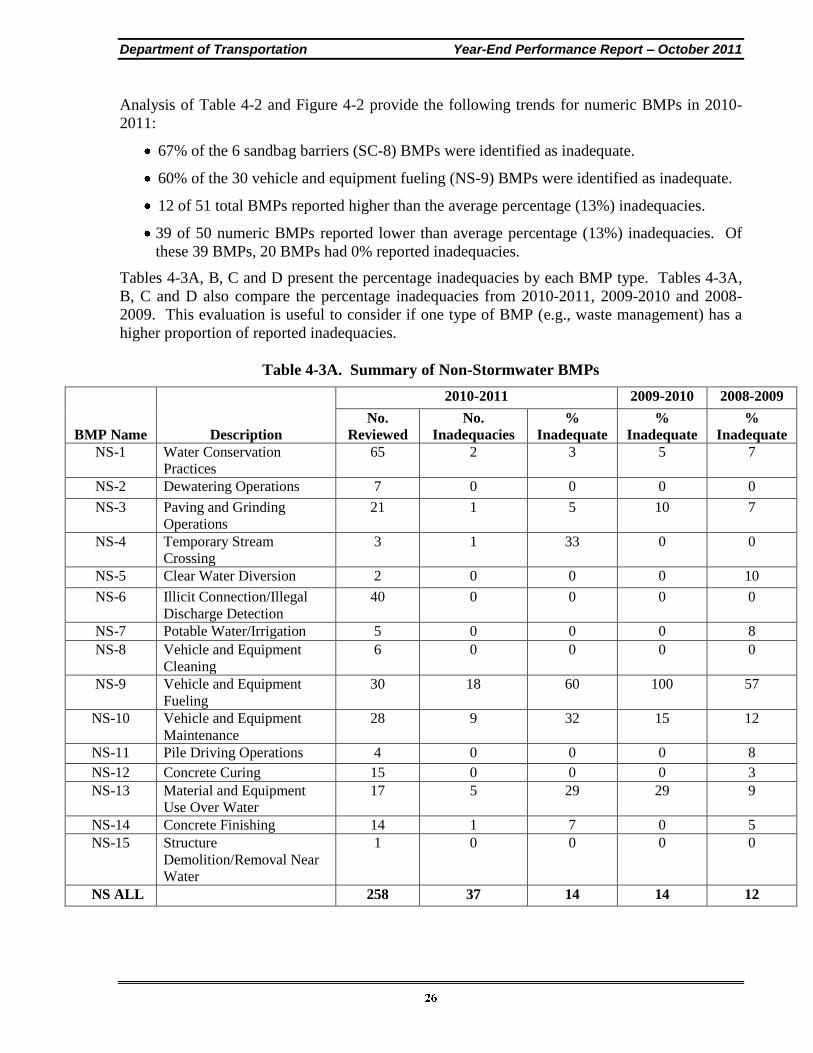
Tables 4-3A, B, C and D present the percentage inadequacies by each BMP type. Tables 4-3A,
B, C and D also compare the percentage inadequacies from 2010-2011, 2009-2010 and 2008-
2009. This evaluation is useful to consider if one type of BMP (e.g., waste management) has a
higher proportion of reported inadequacies.
Table 4-3A. Summary of Non-Stormwater BMPs
BMP Name Description
2010-2011 2009-2010 2008-2009
No.
Reviewed
No.
Inadequacies
%
Inadequate
%
Inadequate
%
Inadequate
NS-1 Water Conservation
Practices
65 2 3 5 7
NS-2 Dewatering Operations 7 0 0 0 0
NS-3 Paving and Grinding
Operations
21 1 5 10 7
NS-4 Temporary Stream
Crossing
3 1 33 0 0
NS-5 Clear Water Diversion 2 0 0 0 10
NS-6 Illicit Connection/Illegal
Discharge Detection
40 0 0 0 0
NS-7 Potable Water/Irrigation 5 0 0 0 8
NS-8 Vehicle and Equipment
Cleaning
6 0 0 0 0
NS-9 Vehicle and Equipment
Fueling
30 18 60 100 57
NS-10 Vehicle and Equipment
Maintenance
28 9 32 15 12
NS-11 Pile Driving Operations 4 0 0 0 8
NS-12 Concrete Curing 15 0 0 0 3
NS-13 Material and Equipment
Use Over Water
17 5 29 29 9
NS-14 Concrete Finishing 14 1 7 0 5
NS-15 Structure
Demolition/Removal Near
Water
1 0 0 0 0
NS ALL 258 37 14 14 12
Department of Transportation Year-End Performance Report – October 2011
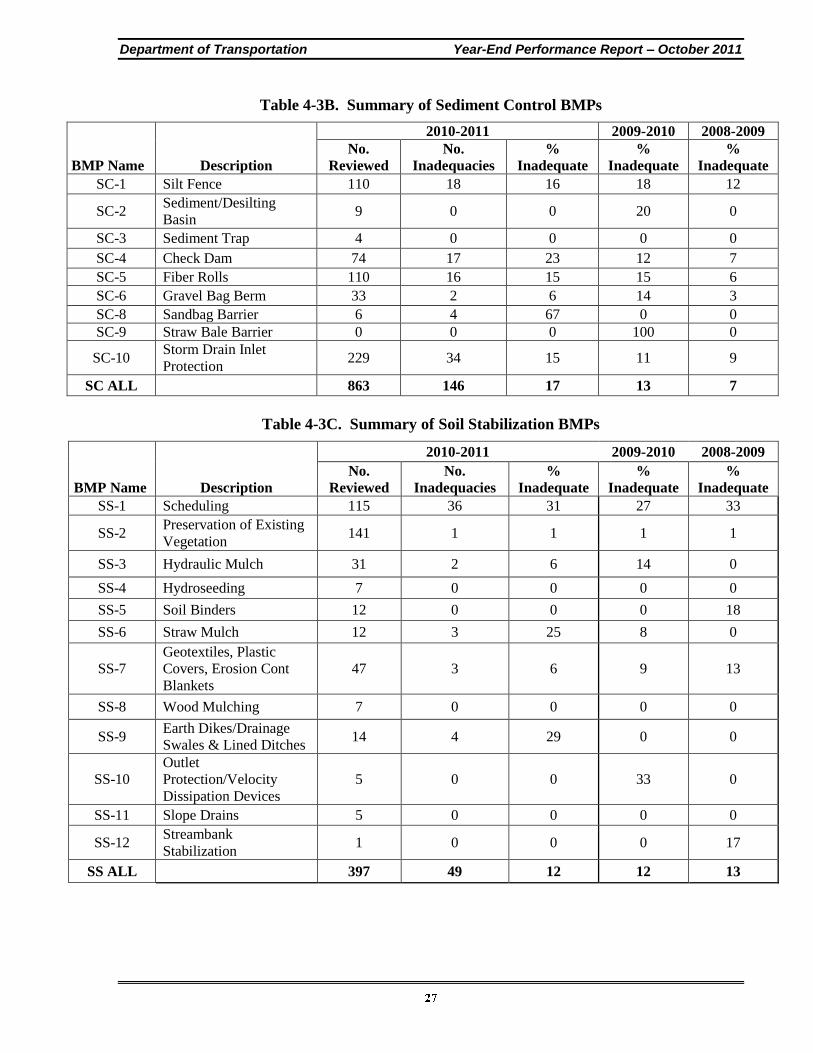
Table 4-3B. Summary of Sediment Control BMPs
BMP Name Description
2010-2011 2009-2010 2008-2009
No.
Reviewed
No.
Inadequacies
%
Inadequate
%
Inadequate
%
Inadequate
SC-1 Silt Fence 110 18 16 18 12
SC-2 Sediment/Desilting
Basin 9 0 0 20 0
SC-3 Sediment Trap 4 0 0 0 0
SC-4 Check Dam 74 17 23 12 7
SC-5 Fiber Rolls 110 16 15 15 6
SC-6 Gravel Bag Berm 33 2 6 14 3
SC-8 Sandbag Barrier 6 4 67 0 0
SC-9 Straw Bale Barrier 0 0 0 100 0
SC-10 Storm Drain Inlet
Protection 229 34 15 11 9
SC ALL 863 146 17 13 7
Table 4-3C. Summary of Soil Stabilization BMPs
BMP Name Description
2010-2011 2009-2010 2008-2009
No.
Reviewed
No.
Inadequacies
%
Inadequate
%
Inadequate
%
Inadequate
SS-1 Scheduling 115 36 31 27 33
SS-2 Preservation of Existing
Vegetation 141 1 1 1 1
SS-3 Hydraulic Mulch 31 2 6 14 0
SS-4 Hydroseeding 7 0 0 0 0
SS-5 Soil Binders 12 0 0 0 18
SS-6 Straw Mulch 12 3 25 8 0
SS-7
Geotextiles, Plastic
Covers, Erosion Cont
Blankets
47 3 6 9 13
SS-8 Wood Mulching 7 0 0 0 0
SS-9 Earth Dikes/Drainage
Swales & Lined Ditches 14 4 29 0 0
SS-10
Outlet
Protection/Velocity
Dissipation Devices
5 0 0 33 0
SS-11 Slope Drains 5 0 0 0 0
SS-12 Streambank
Stabilization 1 0 0 0 17
SS ALL 397 49 12 12 13
Department of Transportation Year-End Performance Report – October 2011
In 2010-2011, Table 4-3C shows that the percentage of inadequate soil stabilization BMPs (12%)
are slightly less than the average of all BMPs (i.e., 13%) presented in Tables 4-1 and 4-2. In
2010-2011, scheduling (SS-1), earth dikes/drainage swales & lined ditches (SS-9) and straw
mulch (SS-6) reported higher than average inadequacy percentages (31, 29 and 25, respectively).
Excluding SS-1, SS-9 and 22-6, the remaining soil stabilization BMPs have inadequacies ranging
from 6% to 0%, far below the overall BMP average of 13%.
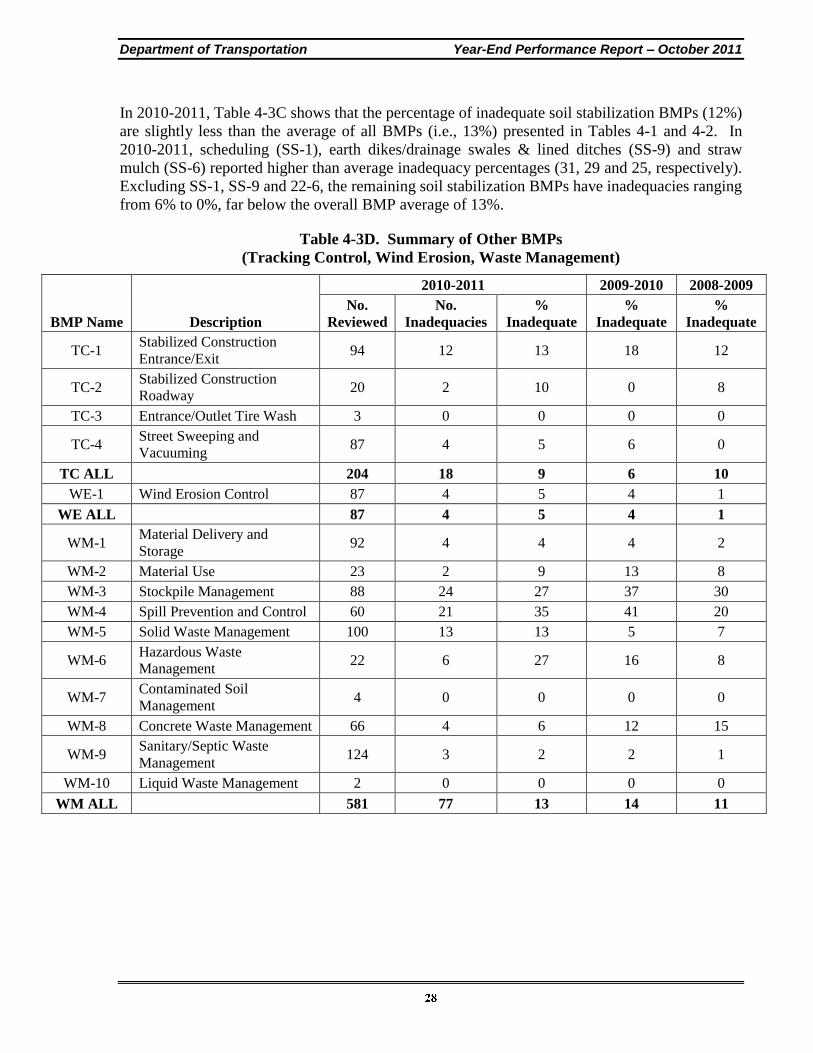
Table 4-3D. Summary of Other BMPs
(Tracking Control, Wind Erosion, Waste Management)
BMP Name Description
2010-2011 2009-2010 2008-2009
No.
Reviewed
No.
Inadequacies
%
Inadequate
%
Inadequate
%
Inadequate
TC-1 Stabilized Construction
Entrance/Exit 94 12 13 18 12
TC-2 Stabilized Construction
Roadway 20 2 10 0 8
TC-3 Entrance/Outlet Tire Wash 3 0 0 0 0
TC-4 Street Sweeping and
Vacuuming 87 4 5 6 0
TC ALL 204 18 9 6 10
WE-1 Wind Erosion Control 87 4 5 4 1
WE ALL 87 4 5 4 1
WM-1 Material Delivery and
Storage 92 4 4 4 2
WM-2 Material Use 23 2 9 13 8
WM-3 Stockpile Management 88 24 27 37 30
WM-4 Spill Prevention and Control 60 21 35 41 20
WM-5 Solid Waste Management 100 13 13 5 7
WM-6 Hazardous Waste
Management 22 6 27 16 8
WM-7 Contaminated Soil
Management 4 0 0 0 0
WM-8 Concrete Waste Management 66 4 6 12 15
WM-9 Sanitary/Septic Waste
Management 124 3 2 2 1
WM-10 Liquid Waste Management 2 0 0 0 0
WM ALL 581 77 13 14 11
Department of Transportation Year-End Performance Report – October 2011
In 2010-2011, Table 4-3D shows that the percentage of inadequate tracking control, wind
erosion and waste management BMPs are 9%, 5% and 13% respectively; less than the average of
all BMPs (i.e., 13%) presented in Tables 4-1 and 4-2. In 2010-2011, reported percentage of
inadequacies for waste management BMPs were slightly lower, respectively, than reported in
2009-2010. In 2010-2011 three waste management BMPs, reported a higher than average
percentage inadequacies percentage; spill prevention and control (WM-4; 35%), stockpile
management (WM-3; 27%) and hazardous waste management (WM-6; 27%).
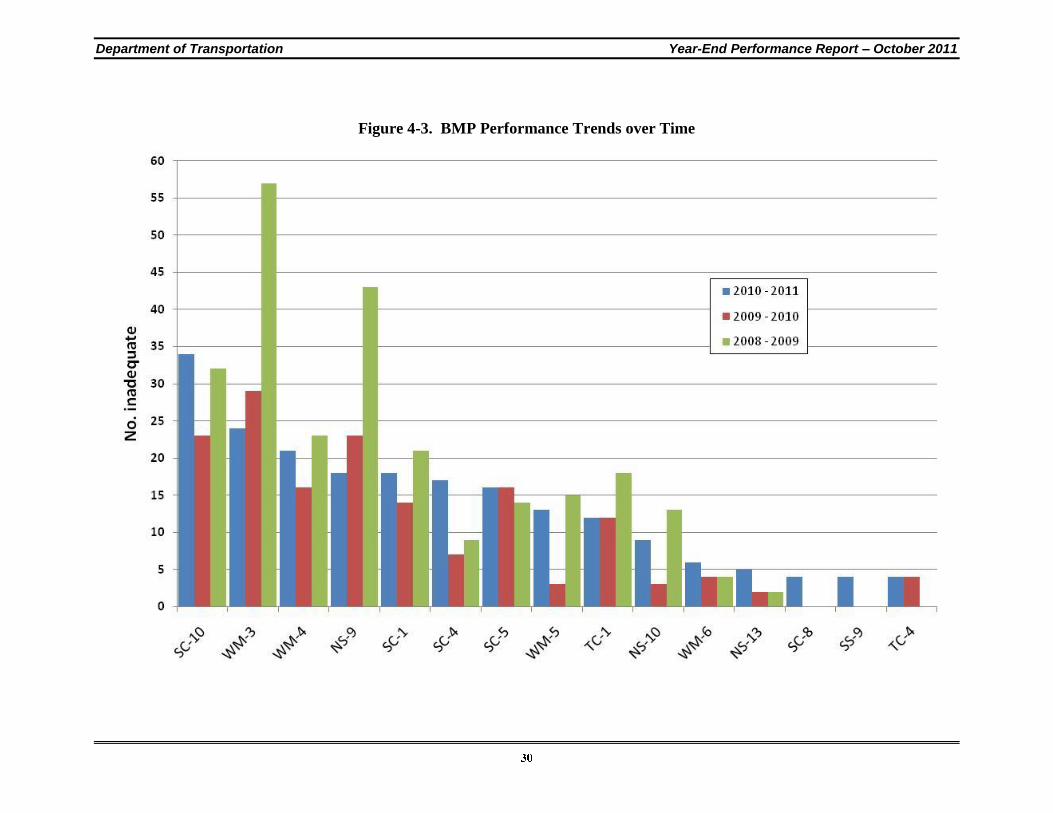
Figure 4-3 shows the performance of BMPs over time for the 2008-09, 2009-10 and 2010-11
construction seasons. Figure 4-3 compares fifteen BMPs with the most inadequacies over time
to assess BMP performance trends over time.
Department of Transportation Year-End Performance Report – October 2011
Figure 4-3. BMP Performance Trends over Time
Department of Transportation Year-End Performance Report –October 2011
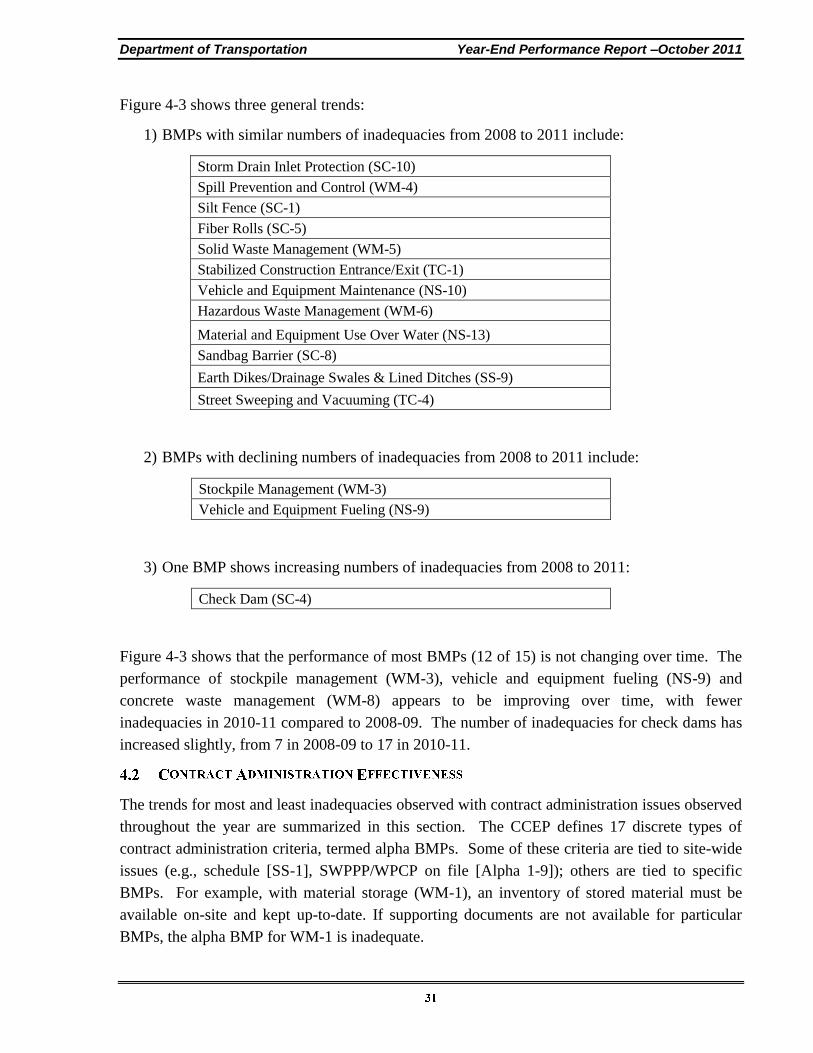
Figure 4-3 shows three general trends:
1) BMPs with similar numbers of inadequacies from 2008 to 2011 include:
Storm Drain Inlet Protection (SC-10)
Spill Prevention and Control (WM-4)
Silt Fence (SC-1)
Fiber Rolls (SC-5)
Solid Waste Management (WM-5)
Stabilized Construction Entrance/Exit (TC-1)
Vehicle and Equipment Maintenance (NS-10)
Hazardous Waste Management (WM-6)
Material and Equipment Use Over Water (NS-13)
Sandbag Barrier (SC-8)
Earth Dikes/Drainage Swales & Lined Ditches (SS-9)
Street Sweeping and Vacuuming (TC-4)
2) BMPs with declining numbers of inadequacies from 2008 to 2011 include:
Stockpile Management (WM-3)
Vehicle and Equipment Fueling (NS-9)
3) One BMP shows increasing numbers of inadequacies from 2008 to 2011:
Check Dam (SC-4)
Figure 4-3 shows that the performance of most BMPs (12 of 15) is not changing over time. The
performance of stockpile management (WM-3), vehicle and equipment fueling (NS-9) and
concrete waste management (WM-8) appears to be improving over time, with fewer
inadequacies in 2010-11 compared to 2008-09. The number of inadequacies for check dams has
increased slightly, from 7 in 2008-09 to 17 in 2010-11.
The trends for most and least inadequacies observed with contract administration issues observed
throughout the year are summarized in this section. The CCEP defines 17 discrete types of
contract administration criteria, termed alpha BMPs. Some of these criteria are tied to site-wide
issues (e.g., schedule [SS-1], SWPPP/WPCP on file [Alpha 1-9]); others are tied to specific
BMPs. For example, with material storage (WM-1), an inventory of stored material must be
available on-site and kept up-to-date. If supporting documents are not available for particular
BMPs, the alpha BMP for WM-1 is inadequate.
Department of Transportation Year-End Performance Report –October 2011
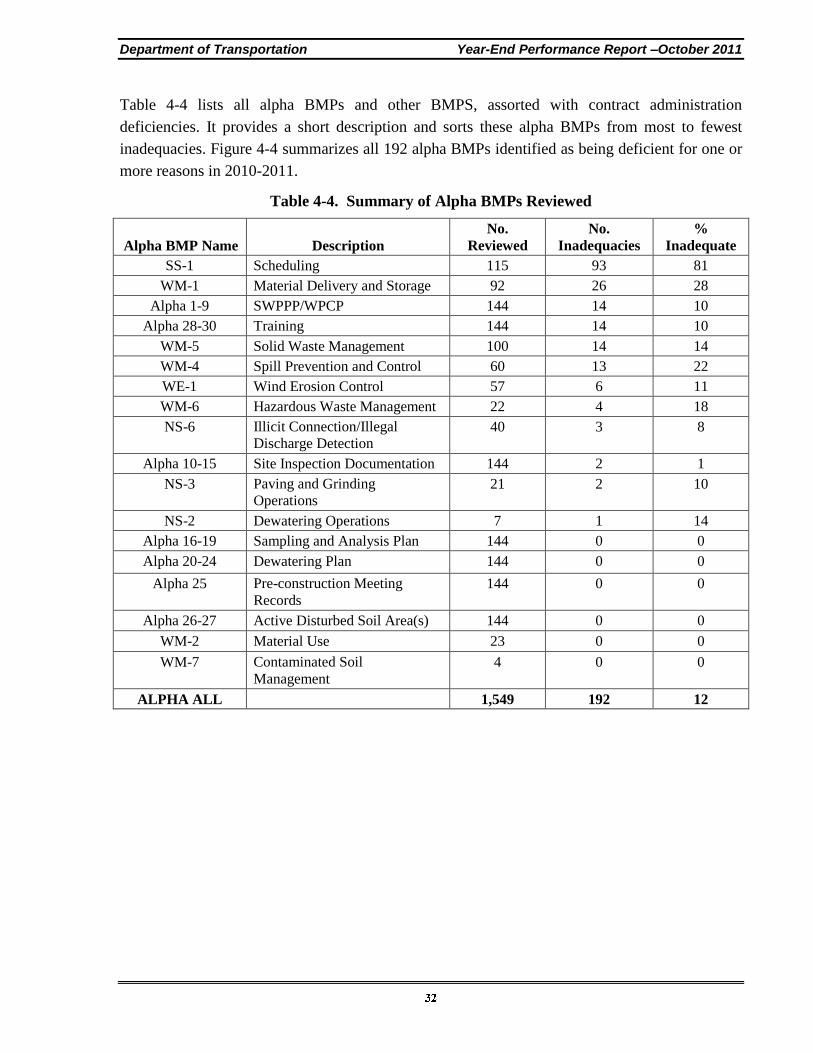
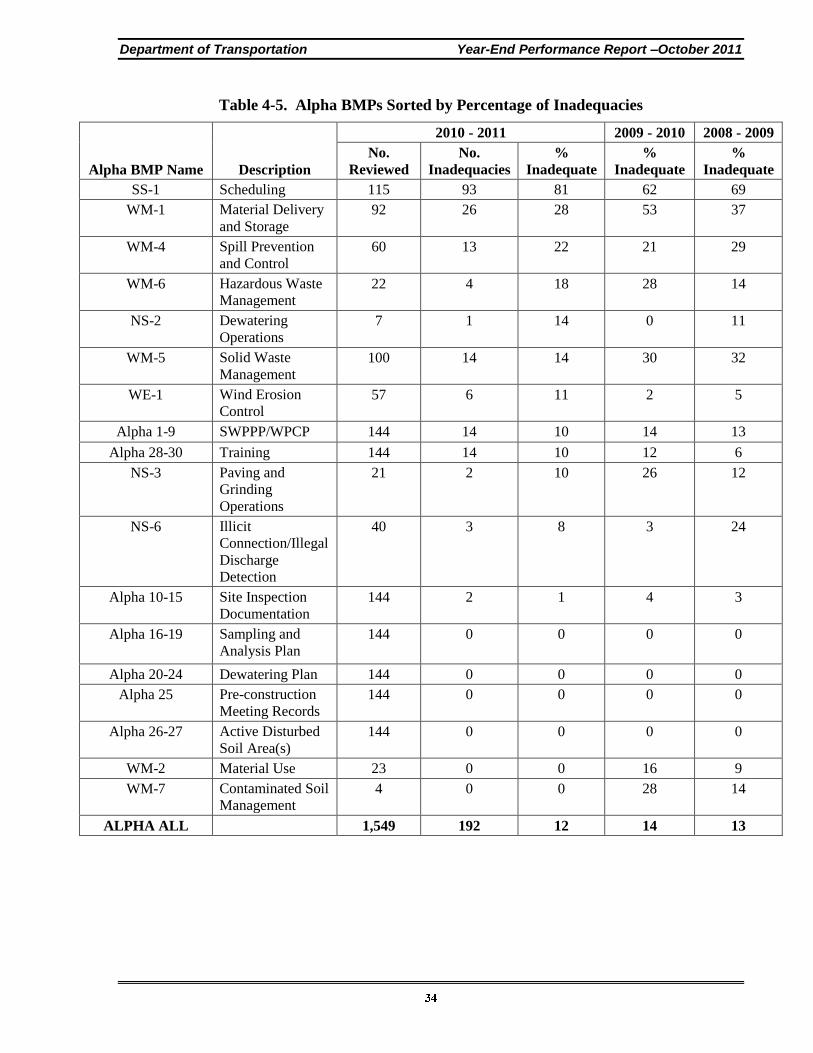
Table 4-4 lists all alpha BMPs and other BMPS, assorted with contract administration
deficiencies. It provides a short description and sorts these alpha BMPs from most to fewest
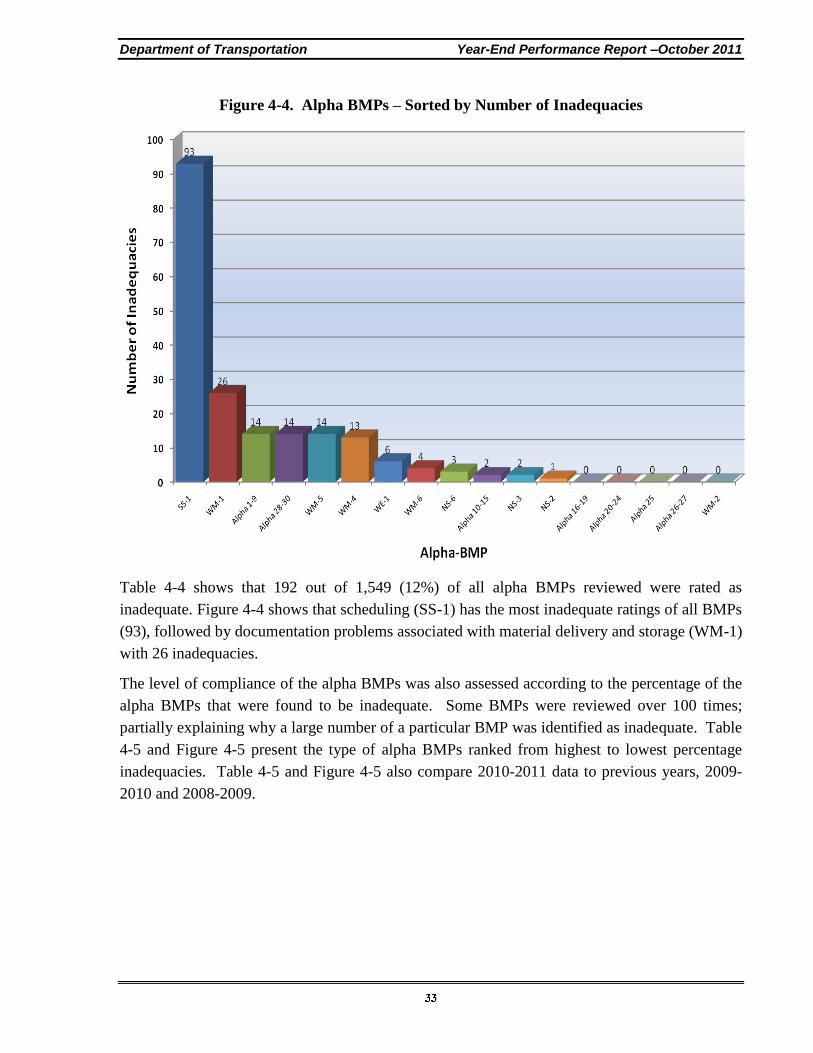
inadequacies. Figure 4-4 summarizes all 192 alpha BMPs identified as being deficient for one or
more reasons in 2010-2011.
Table 4-4. Summary of Alpha BMPs Reviewed
Alpha BMP Name Description
No.
Reviewed
No.
Inadequacies
%
Inadequate
SS-1 Scheduling 115 93 81
WM-1 Material Delivery and Storage 92 26 28
Alpha 1-9 SWPPP/WPCP 144 14 10
Alpha 28-30 Training 144 14 10
WM-5 Solid Waste Management 100 14 14
WM-4 Spill Prevention and Control 60 13 22
WE-1 Wind Erosion Control 57 6 11
WM-6 Hazardous Waste Management 22 4 18
NS-6 Illicit Connection/Illegal
Discharge Detection 40 3 8
Alpha 10-15 Site Inspection Documentation 144 2 1
NS-3 Paving and Grinding
Operations 21 2 10
NS-2 Dewatering Operations 7 1 14
Alpha 16-19 Sampling and Analysis Plan 144 0 0
Alpha 20-24 Dewatering Plan 144 0 0
Alpha 25 Pre-construction Meeting
Records
144 0 0
Alpha 26-27 Active Disturbed Soil Area(s) 144 0 0
WM-2 Material Use 23 0 0
WM-7 Contaminated Soil
Management
4 0 0
ALPHA ALL 1,549 192 12
Department of Transportation Year-End Performance Report –October 2011
Figure 4-4. Alpha BMPs – Sorted by Number of Inadequacies
Table 4-4 shows that 192 out of 1,549 (12%) of all alpha BMPs reviewed were rated as
inadequate. Figure 4-4 shows that scheduling (SS-1) has the most inadequate ratings of all BMPs
(93), followed by documentation problems associated with material delivery and storage (WM-1)
with 26 inadequacies.
The level of compliance of the alpha BMPs was also assessed according to the percentage of the
alpha BMPs that were found to be inadequate. Some BMPs were reviewed over 100 times;
partially explaining why a large number of a particular BMP was identified as inadequate. Table
4-5 and Figure 4-5 present the type of alpha BMPs ranked from highest to lowest percentage
inadequacies. Table 4-5 and Figure 4-5 also compare 2010-2011 data to previous years, 2009-
2010 and 2008-2009.
Department of Transportation Year-End Performance Report –October 2011
Table 4-5. Alpha BMPs Sorted by Percentage of Inadequacies
Alpha BMP Name Description
2010 - 2011 2009 - 2010 2008 - 2009
No.
Reviewed
No.
Inadequacies
%
Inadequate
%
Inadequate
%
Inadequate
SS-1 Scheduling 115 93 81 62 69
WM-1 Material Delivery
and Storage
92 26 28 53 37
WM-4 Spill Prevention
and Control
60 13 22 21 29
WM-6 Hazardous Waste
Management 22 4 18 28 14
NS-2 Dewatering
Operations
7 1 14 0 11
WM-5 Solid Waste
Management
100 14 14 30 32
WE-1 Wind Erosion
Control 57 6 11 2 5
Alpha 1-9 SWPPP/WPCP 144 14 10 14 13
Alpha 28-30 Training 144 14 10 12 6
NS-3 Paving and
Grinding
Operations
21 2 10 26 12
NS-6 Illicit
Connection/Illegal
Discharge
Detection
40 3 8 3 24
Alpha 10-15 Site Inspection
Documentation
144 2 1 4 3
Alpha 16-19 Sampling and
Analysis Plan
144 0 0 0 0
Alpha 20-24 Dewatering Plan 144 0 0 0 0
Alpha 25 Pre-construction
Meeting Records
144 0 0 0 0
Alpha 26-27 Active Disturbed
Soil Area(s)
144 0 0 0 0
WM-2 Material Use 23 0 0 16 9
WM-7 Contaminated Soil
Management 4 0 0 28 14
ALPHA ALL 1,549 192 12 14 13
Department of Transportation Year-End Performance Report –October 2011
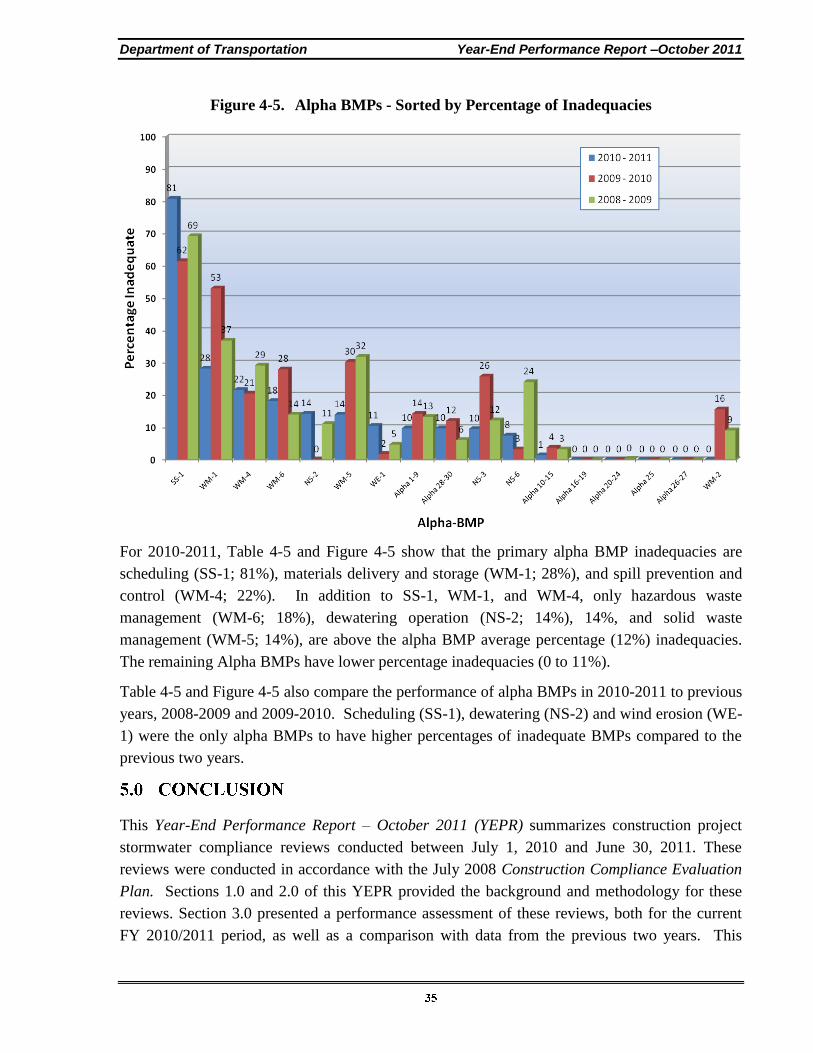
Figure 4-5. Alpha BMPs - Sorted by Percentage of Inadequacies
For 2010-2011, Table 4-5 and Figure 4-5 show that the primary alpha BMP inadequacies are
scheduling (SS-1; 81%), materials delivery and storage (WM-1; 28%), and spill prevention and
control (WM-4; 22%). In addition to SS-1, WM-1, and WM-4, only hazardous waste
management (WM-6; 18%), dewatering operation (NS-2; 14%), 14%, and solid waste
management (WM-5; 14%), are above the alpha BMP average percentage (12%) inadequacies.
The remaining Alpha BMPs have lower percentage inadequacies (0 to 11%).
Table 4-5 and Figure 4-5 also compare the performance of alpha BMPs in 2010-2011 to previous
years, 2008-2009 and 2009-2010. Scheduling (SS-1), dewatering (NS-2) and wind erosion (WE-
1) were the only alpha BMPs to have higher percentages of inadequate BMPs compared to the
previous two years.
This Year-End Performance Report – October 2011 (YEPR) summarizes construction project
stormwater compliance reviews conducted between July 1, 2010 and June 30, 2011. These
reviews were conducted in accordance with the July 2008 Construction Compliance Evaluation
Plan. Sections 1.0 and 2.0 of this YEPR provided the background and methodology for these
reviews. Section 3.0 presented a performance assessment of these reviews, both for the current
FY 2010/2011 period, as well as a comparison with data from the previous two years. This
Department of Transportation Year-End Performance Report –October 2011
assessment concluded that approximately 82% of all project reviews were rated 1A, 1B, 2A, 2B
for FY 2010/2011, which was in line with the level of compliance in the previous two years. For
FY 2010/2011, 68% of projects receive an A alpha rating. Section 4.0 analyzed trends in the
data. This analysis concluded that 273 of the 2,072 BMPs reviewed, or 13%, were found to be
inadequate. Other trends for the specific types of BMPs are presented in this section. The
general conclusion in comparing data to the previous two years was that the performance of most
BMPs is not changing over time.